DOI:
10.1039/D3MA00409K
(Paper)
Mater. Adv., 2023,
4, 4852-4859
Ultralow thermal conductivity and anharmonic rattling in two-dimensional CrSX (X = Cl, Br, I) monolayers†
Received
13th July 2023
, Accepted 7th September 2023
First published on 8th September 2023
Abstract
Using first-principles calculations and Boltzmann transport theory, we investigate the thermoelectric properties of the 2D CrSX (X = Cl, Br, I) family. The ultralow lattice thermal conductivity (κl) values of CrSX monolayers along the x-axis at 300 K are 0.624, 0.419, and 0.179 W m−1 K−1, respectively, while along the y-axis they are 0.193, 0.158, and 0.093 W m−1 K−1. These low values are attributed to the small phonon relaxation time and flat acoustic phonon dispersions of CrSX monolayers, resulting from the extraordinarily strong anharmonicity. Vibrational pattern analysis confirms that the strong anharmonicity in CrSX monolayers arises from the reciprocal vibrations of the X atoms around equilibrium positions, which can be considered as a generalized effective rattling phenomenon. Due to their low lattice thermal conductivity and favorable electrical transport properties, the CrSX monolayers demonstrate optimal ZT values of 1.33 (5.23), 1.18 (5.84), and 2.13 (5.22) along the x-axis (y-axis) at 300 K, respectively. This work not only highlights the significance of rattling modes in driving phonon anharmonicity but also provides valuable insights for discovering and designing thermoelectric materials with ultralow lattice thermal conductivity and high conversion efficiency.
1 Introduction
Thermoelectric (TE) technology is a promising solution to energy issues, as it enables direct or reversible conversion between electrical energy and thermal energy. The energy conversion efficiency of thermoelectric materials is expressed by the dimensionless parameter ZT:1,2| |  | (1) |
where S, σ, T, κe and κl are the Seebeck coefficient, electrical conductivity, absolute temperature, electronic thermal conductivity, and lattice thermal conductivity, respectively. The power factor PF = S2σ determines the ability to generate useful electrical energy at a given temperature difference,3 and the higher the ZT value, the higher the thermoelectric conversion efficiency. Therefore, high-performance TE materials require a high S2σ value and low thermal conductivity. The thermoelectric parameters S, σ and κe are highly coupled, which makes it challenging to optimize independently and improve the thermoelectric conversion efficiency.4–6 Consequently, there are two main approaches to improve ZT. The first is to optimize the power factor PF via band structure engineering7,8 and nanostructure design.9–11 The second is to minimize the lattice thermal conductivity κl through anharmonic lattices,12,13 reduced structural dimensionality,14–16 or by seeking out compounds that feature inherently low κl due to van der Waals (vdW) interactions or rattling atoms.17 Rattling has emerged as an influential and successful strategy to achieve low lattice thermal conductivity. This has led to the discovery of novel materials, including clathrates and filled skutterudites.18–21 The rattling atoms can scatter heat-carrying phonons from the host lattice, thereby resulting in a lower κl while maintaining electronic and electron transport properties.20 Additionally, rattling systems commonly exhibit large atomic displacement parameters (large mean square displacement) and flat potential energy curves, which have been used to characterize this behavior.22
Since the experimental synthesis of graphene, 2D semiconductors have been the focus of thermoelectric research due to their significant phonon scattering and superior electron transport.23–27 Jinlan Wang's group predicted that the CrSX (X = Cl, Br, I) monolayers are ferromagnetic semiconductors with a moderate band gap, a flat phonon dispersion curve, and superior carrier mobility.28 These superior properties have piqued our interest in studying the thermoelectric properties of CrSX monolayers. This paper systematically investigates the thermoelectric properties of CrSX monolayers using first principles calculations and Boltzmann transport theory. We report the extremely low κl values of 0.624, 0.419, and 0.179 W m−1 K−1 in the x-axis and 0.193, 0.158, and 0.093 W m−1 K−1 in the y-axis at 300 K, respectively. The strong ionic bonds between X and Cr atoms restrict the vibration of X atoms in the Cr–X–Cr plane but allow it in the perpendicular direction. X atoms vibrate back and forth near their equilibrium positions, resembling water plants. This differs from classical rattling, which features flat acoustic phonon modes intersecting with optical modes, although it has similar physical properties, specifically the fact that certain atoms vibrate more frequently than others. The rattling of X atoms scatters the heat-carrying acoustic phonons, resulting in extremely low κl. Additionally, we find that CrSX monolayers possess favorable thermoelectric properties, with optimum ZT values of 1.33 (5.23), 1.18 (5.84) and 2.13 (5.22) in the x (y) directions at 300 K, revealing their promising potential as thermoelectric materials. The results indicate that CrSX monolayers exhibit excellent thermoelectric properties and are promising candidate materials for thermoelectric applications.
2 Computational details
We performed simulations of CrSX monolayers using the Vienna Ab Initio Simulation Program (VASP)29 within the Density Functional Theory (DFT) framework, implementing the Projector Augmented Wave (PAW) method.30 The exchange correlation energy was handled by the Perdew–Burke–Ernzerhof (PBE) functional under Generalized Gradient Approximation (GGA).31 The electron correlation effect for the localized 3d orbitals of Cr atoms was treated by an effective on-site Hubbard term U of 3 eV.28 The plane-wave expansion cutoff energy was 450 eV. The Brillouin zone was sampled using a converged Γ-centered 15 × 13 × 1 k mesh for geometry optimization and electronic structure calculations. The residual force on each atom was less than 1 × 10⁻² eV Å−1, and the convergence criterion for the total energy was 1 × 10⁻⁸ eV. A vacuum space is 15 Å to avoid interlayer interactions, and the Heyd–Scuseria–Ernzerhof (HSE06) hybrid functional is used to obtain a more accurate bandgap.32
We utilized the Phonopy code33 with the finite-displacement method34 to compute the second-order interatomic force constants (IFCs).33 The ShengBTE code,35 based on the Boltzmann transport equation, was used to determine the phonon transport properties. Third-order anharmonic IFCs were calculated using the finite-difference method, considering the interaction among 12th-neighbor atoms. The second-order (harmonic) and third-order (anharmonic) IFCs were obtained using 5 × 4 × 1 supercells with 2 × 2 × 1 k-meshes. Phonon momenta q meshes for CrSCl, CrSBr, and CrSI monolayers were 90 × 65 × 1, 87 × 65 × 1, and 83 × 65 × 1, respectively, with the scaleboard set to 0.2.
The electrical transport properties are calculated by solving the Boltzmann transport equation with the BoltZTraP code36 and using 33 × 26 × 1 k-mesh. The total Seebeck coefficients and electrical conductivity by combining the two spin channels:
| |  | (2) |
| |  | (3) |
where
S↑(↓) and
σ↑(↓) are the spin up (down) Seebeck coefficients and electronic conductivity. The
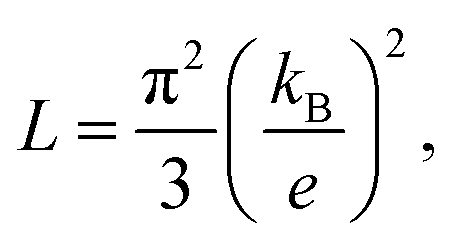
κe is determined by the Wiedemann–Franz law
37κe =
LσT, where
L is the Lorentz constant. For the degenerate semiconductors,
L is obtained as,
36| |  | (4) |
which is equal to 2.45 × 10
−8 V
2 K
−2.
38
The lattice thermal conductivity κl and electrical conductivity σ of two-dimensional (2D) materials depend on the effective van der Waals thickness dV along the z-axis, which can be computed using the following expression:
where
d1 represents the thickness of the atomic layer, while
d2 and
d3 correspond to the van der Waals radii of the atoms on the upper and lower surfaces, respectively.
3 Results and discussion
3.1 Phonon spectrum and lattice thermal conductivity
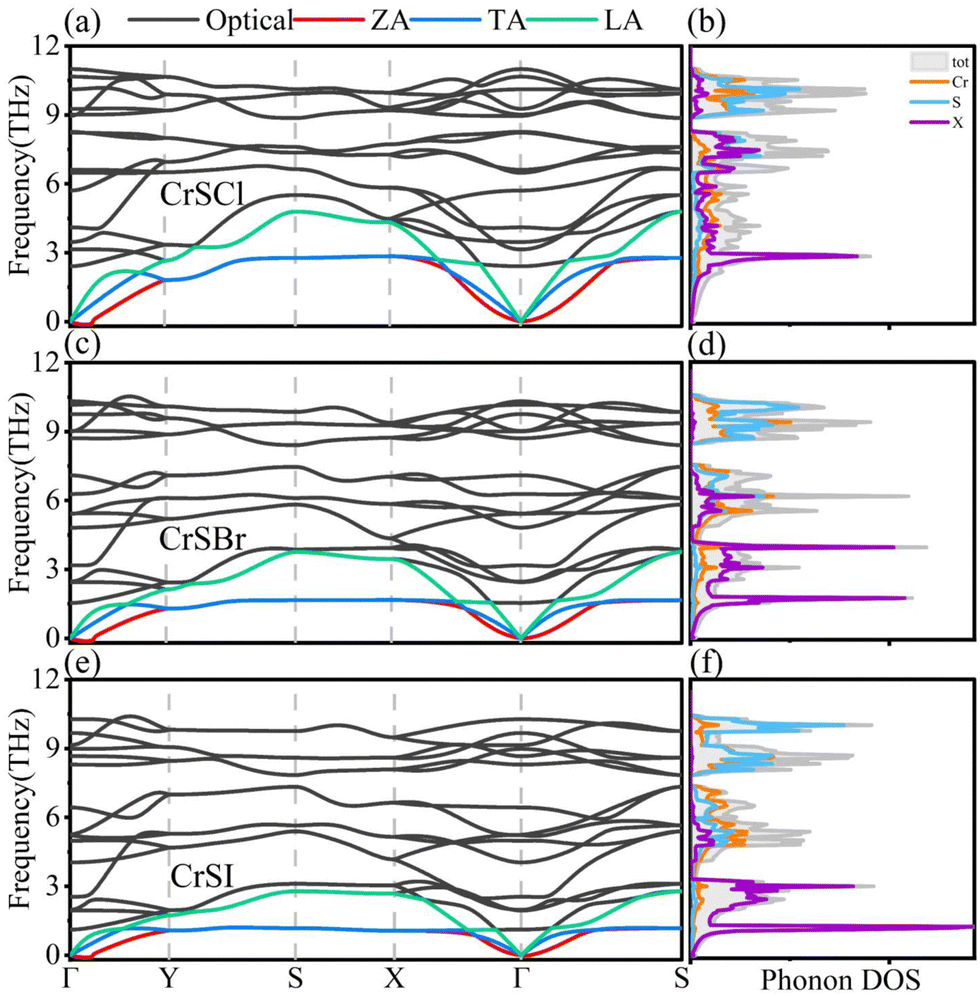
The phonon dispersion curves and phonon density of states (PhDOS) are shown in Fig. 1. CrSX monolayers have six atoms in primitive cells, so there are eighteen phonon branches in the phonon spectrum, and the acoustic and optical branches are highlighted with different colors. The ZA branch represents the out of plane mode, and the TA and LA branches are the transverse and longitudinal acoustic modes within the 2D plane,39 respectively. The slopes of the acoustic branches are much larger than those of the optical branches, predicting that the former carries the larger phonon group velocities and thus makes a major contribution to the κl. In the frequency range of the acoustic and low-frequency optical branches, the flat phonon dispersion curves of the ZA and TA branches will lead to small phonon group velocities. Moreover, the LA branch is highly overlapping with the low-frequency optical branches, which demonstrate that acoustic and optical phonons are more easily scattered, resulting in high phonon scattering rates.40 From Fig. 1(b, d and f), the vibrational modes of X atoms gradually dominate the acoustic region from Cl to I, whereas those of Cr and S atoms dominate the optical region. Overall, the PhDOS of Cr (S) and X exhibit significant mismatch in the acoustic and low-frequency optical branches, indicating the weaker vibrational interactions between Cr (S) and X atoms. This mismatch greatly limits their contribution to the κl.19,41 The flat low-frequency acoustic modes are dominated by vibrations of X atoms, which are the typical of rattling.21 Hence, based on the available analysis, it can be inferred that CrSX monolayers may have lower κl.
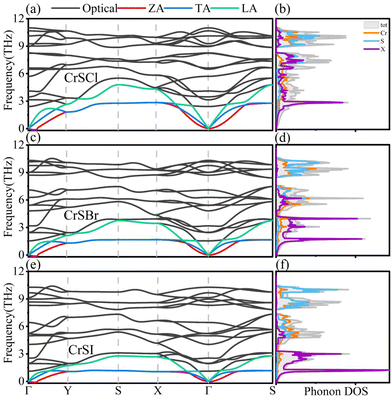 |
| | Fig. 1 (a), (c) and (e) Phonon dispersions and (b), (d) and (f) phonon density of states (PhDOS) for CrSX (X = Cl, Br, I). | |
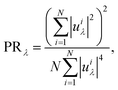
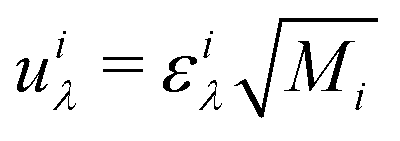
The optimized structures of CrSX monolayers are shown in Fig. 2(a and b). Mechanical response is an effective evaluation of the structural stability. The mechanical properties are studied, and the summarized results are presented in Table S2 (ESI†), confirming the stability through the satisfaction of required criteria: C11 > 0, C33 > 0, and C11 × C22 > C122.42–45 The X and Cr atoms form strong ionic bonds, and the X atoms are less likely to vibrate in the Cr–X–Cr plane but more likely to vibrate perpendicular to the Cr–X–Cr plane. The X atoms exhibit effective atomic rattling, resembling water plants that oscillate back and forth around their equilibrium positions. To verify this conclusion, we analyze the atomic displacement parameter (ADP) and potential energy curves. ADP determines the mean square of the displacement amplitudes of atoms around their equilibrium positions.46–48 Larger ADP values imply more vigorous vibrations, indicating a weak restoring force acting on the vibrating atoms. As shown in Fig. 2(c), the thermally induced ADP of X atoms is significantly larger than those of other atoms, and this effect becomes more pronounced at higher temperatures. Fig. 2(d) describes potential energy as a function of atomic displacement around the equilibrium position for Cr, S, and X atoms in CrSX monolayers. A flatter curve means that less energy is required to leave the equilibrium position,49 reflecting a weak restoring force on vibrating atoms.46,50 The potential energy of X atoms is flatter than Cr and S atoms, indicating looser binding in the lattice, consistent with their large ADP values, which indicate weak restoring force on X atoms. The rattling behavior of the X atoms enhances crystal anharmonicity, scatters phonons, and lowers lattice thermal conductivity. The computation of the phonon participation ratio (PR) distinguishes between collective excitations of all atoms and local excitation modes, revealing anharmonic rattling modes in CrSX monolayers and determining the degree of involvement of constituent atoms in a specific phonon mode.51 The PR is defined by the following equation:52,53
| |  | (6) |
where
N and
uiλ are the number of atoms in the unit cell and the atomic eigen displacement, respectively.

is obtained by scaling the phonon eigenvector projected on the
ith atom
εiλ by the atomic mass
Mi. The degree of atom involvement in a given phonon mode
λ can be determined by the PR value in the range 0–1, where PR ∼ 0 indicates a localized rattling mode while PR ∼ 1 represents a propagating vibrational mode with coherent displacements of all atoms.
52,53 In this study, the frequency-resolved PR values of CrSX monolayers are depicted in
Fig. 3. The low-frequency range shows similar PR characteristics from Cl to I. Around the frequencies of the flat acoustic bands, the three monolayers have lower PR values, confirming rattling modes at those frequencies that arise due to localized X oscillations.
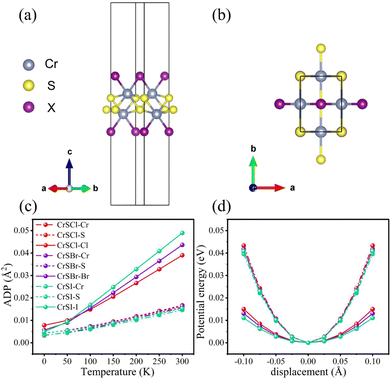 |
| | Fig. 2 (a) and (b) are the structures of CrSX monolayers in the top and side views. (c) The atomic displacement parameters (ADPs) for CrSX monolayers. (d) The potential energy curves for Cr, S and X atoms as a function of atomic displacement around the equilibrium positions for CrSX monolayers. | |
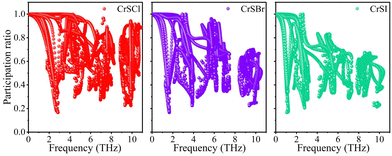 |
| | Fig. 3 Frequency resolved phonon participation ratio of CrSX monolayers. | |
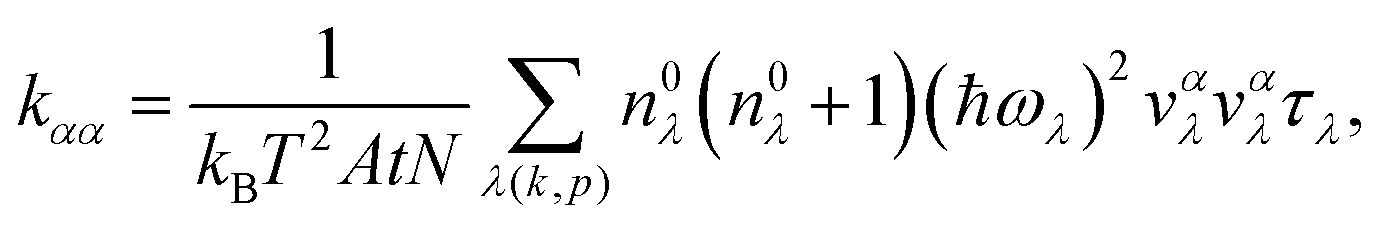
Based on the phonon transport equation, the thermal transport properties of CrSX monolayers are estimated. The κl along the α direction can be determined using the following equation:
| |  | (7) |
where
λ(
k,
p) denotes a phonon mode with
k being the wave vector and
p the phonon branch number.
A,
t,
ω,
N,
T,
vαλ,
n0λ and
τλ are the unit-cell area, the thickness of the unit cell, the phonon frequency, the number of
q points in the first Brillouin zone (BZ) for a
Γ-centered regular grid, the temperature, the phonon group velocity in the direction
α, the phonon occupation number given
via the Bose–Einstein distribution and the phonon relaxation time, respectively. The anisotropic
κl along the
x and
y directions for CrSX monolayers as a function temperature are shown in
Fig. 4(a). At 300 K, the
κl are 0.624, 0.419, and 0.179 W m
−1 K
−1 for the
x axis, and 0.193, 0.158, and 0.093 W m
−1 K
−1 for
y axis, respectively. These values are commensurate with those of other 2D materials, such as the KAgSe monolayer (0.26 W m
−1 K
−1),
54 the TlCuSe monolayer (0.44 W m
−1 K
−1),
55 and the AgSbSe
2 monolayer (0.48 W m
−1 K
−1).
56 In
Fig. 4(b), the cumulative
κl at 300 K are shown as a function of phonon frequency. The majority of heat is conducted by acoustic and low-frequency optical phonons with phonon energy from 0 to 3 THz, while high-frequency optical phonons have almost negligible contribution to heat conduction. Cumulative
κl as a function of the phonon mean free path (MFP) at 300 K are shown in
Fig. 4(c). Our findings reveal that, regardless of the
x or
y direction, the
κl of CrSX monolayers reach their maximum accumulation when the MFP are less than 10 nm. The smaller MFP indicates a greater scattering probability of phonons at the interface, and thereby inhibiting
κl.
57Eqn (7) demonstrates that the
vλ is a key parameter in determining the
κl of materials.
Fig. 4(d–i) show the
vλ values as a function of frequency along the
x and
y directions, respectively.
vλ of CrSCl, CrSBr, and CrSI decrease drastically when the frequencies converge near their respective flat-band frequencies, which are in good agreement with the flat acoustic phonon dispersion. The flat phonon dispersion indicate that the associated X atoms scatter the heat-carrying acoustic phonons, and the corresponding small group velocities lead to the lower
κl.
58
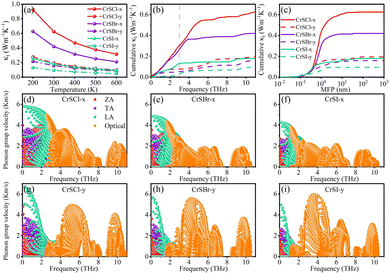 |
| | Fig. 4 (a) The κl of CrSX monolayers as a function of temperature. (b) Cumulative κl as a function of frequency at 300 K. (c) Cumulative κl as a function of the phonon mean free path (MFP) at 300 K. (d)–(i) Phonon group velocity as a function of frequency along the x and y directions for the CrSX monolayers. | |
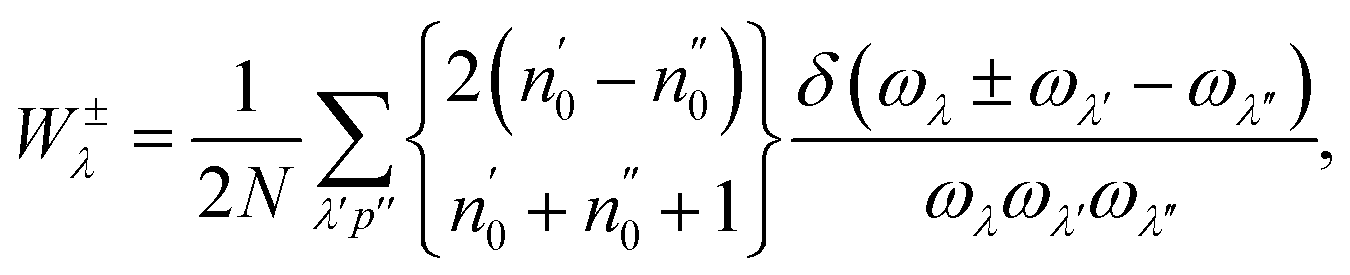
Another key parameter that determines the lattice thermal conductivity is the “scattering phase space (W)”, which can be used as a measure of the space available for the three-phonon process allowed by the conservation of the energy. This parameter is related to the phonon frequency in ref. 59:
| |  | (8) |
where (+) and (−) correspond to the absorption and emission processes, respectively.
Fig. 5(a–c) display the scattering phase space of the ZA, TA, LA and Optical modes for CrSX monolayers, respectively. The larger
W provides more space for the three-phonon scattering process, which is a good sign of shorter phonon relaxation time (
τλ) and lower lattice thermal conductivity.
60–63 Apparently, the ZA mode of the CrSX monolayers exhibits larger
W of acoustic modes, which further suggests that it has stronger three-phonon scattering and shorter
τλ. As analyzed in
W, the ZA mode possesses a lower
τλ, as shown in
Fig. 5(d–f). The strength of the three-phonon scattering process depends on the anharmonicities of the systems, which is a crucial feature to be analyzed. Greater anharmonicities result in stronger phonon–phonon interactions, leading to lower
τλ and
κl. The Grüneisen parameters (
γλ)
64 quantify the anharmonicities of crystal structures and are determined by the following equation,
| |  | (9) |
where
α,
β and
γ are the Cartesian components;
i,
j, and
k denote atomic indices.
Mi,
ελiα,
ri and
Φαβλijk are the mass of atom
i, the phonon eigenvector for atom
i in the direction
α, the position vector of the
ith atom and the third-order anharmonic IFCs, respectively.
Fig. 5(g–i) show the Grüneisen parameters of the ZA, TA, LA and optical modes in CrSX monolayers. Obviously, the ZA mode of CrSX monolayers has the largest
γλ, suggesting the presence of strong anharmonicity and phonon–phonon scattering leading to short
τλ and small
κl. The ZA mode with the largest
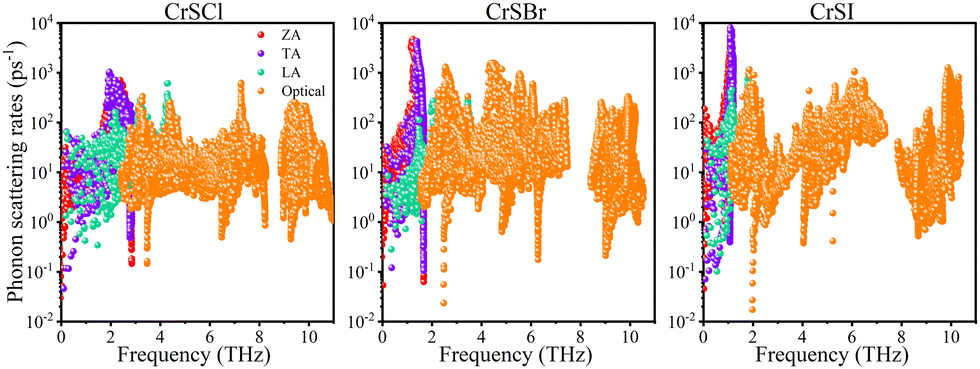
γλ may originate from the rattling vibration of the X atoms around frequencies of flat acoustic bands. Apart from the above parameters, phonon scattering rates [
Fig. 6] is another major factor in determining
κl. CrSX monolayers exhibit a remarkably high scattering rates, resulting in a shortened
τλ and consequently, strong anharmonicity. The significant scattering rates are attributed to the abundance of scattering channels facilitated by the large
W, and anharmonic phonon scattering plays a crucial role in reducing
κl.
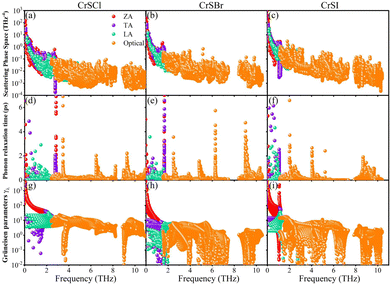 |
| | Fig. 5 (a)–(c) phonon scattering phase space, (d)–(f) phonon relaxation time, and (g)–(i) Grüneisen parameters of ZA, TA, LA and optical modes in CrSX monolayers. | |
 |
| | Fig. 6 Phonon scattering rates as a function of frequency for the CrSX monolayers. | |
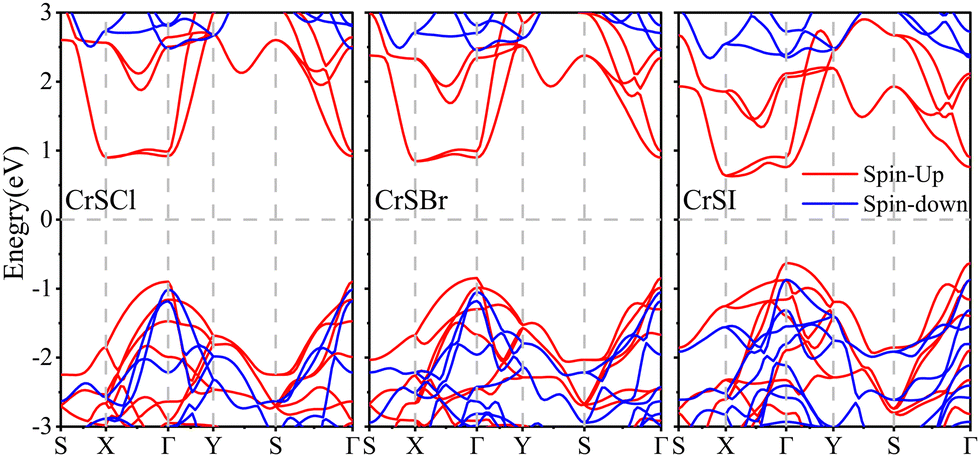
3.2 Electronic structure and electrical transport
The thermoelectric (TE) properties rely on low κl and favorable electrical transport properties, which are primarily influenced by the electronic structures. Fig. 7 displays the electron band structures of CrSX monolayers obtained through HSE06 hybrid functionals. Calculation results indicate that CrSCl, CrSBr, and CrSI monolayers are indirect bandgap semiconductors with bandgaps of 1.80, 1.69, and 1.26 eV, respectively. The conduction band minimum (CBM) and valence band maximum (VBM) are located at the X and Γ points, respectively. The CBM of CrSX monolayers exhibits highly degenerate and nearly flat dispersion along Γ–X, contributing to a higher electron effective mass and increased n-type Seebeck coefficients, while a large effective mass will lead to a small carrier mobility. Consequently, the conduction bands with high dispersion along Γ–Y will exhibit a smaller effective mass and a higher carrier mobility. The dispersion of VBM for CrSCl and CrSBr along Γ–X is smaller than that along Γ–Y, whereas CrSI exhibits the opposite trend, with a larger dispersion along Γ–X compared to Γ–Y. This trend can be attributed to the varying orbital contributions to the VBM at the Γ point. From X = Cl to I, the contribution of the S atom decreases, while the contribution of the X atoms increases.28
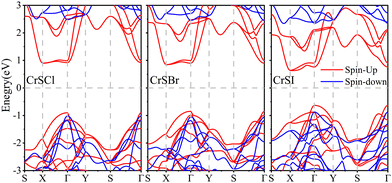 |
| | Fig. 7 The electronic band structures calculated by HSE06 hybrid functionals for CrSX monolayers, and the Fermi level is set to zero. | |
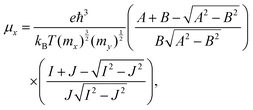
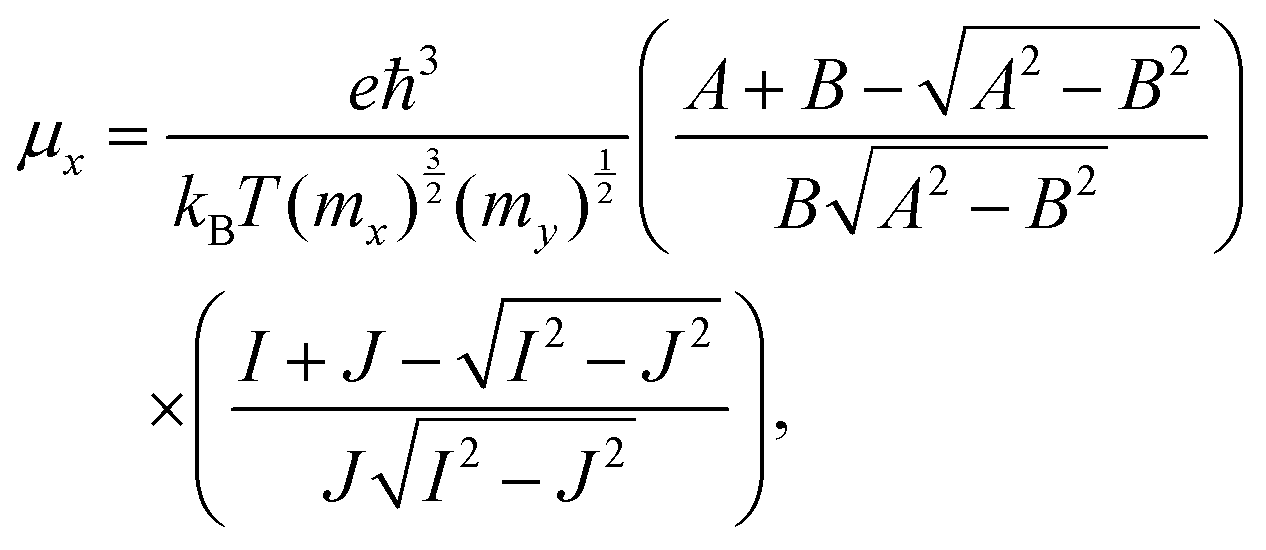
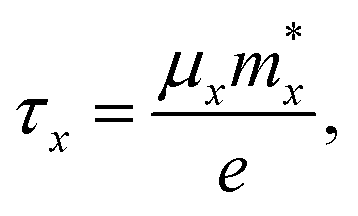
We calculate the anisotropic carrier mobility (μ2D) and electron relaxation time (τ) of CrSX monolayers employing the modified deformation potential approximation (DPA) method.65
| |  | (10) |
| |  | (11) |
where
,
B =
Ē1Δ
E1,
,
with

,

,

and

.
κB,
E1,
C and
m* are the Boltzmann constant, the reduced Planck constant, the deformation-potential constant, the elastic constants and the effective mass, respectively. The
m*,
E1 and
C can be given by
66m* =
ħ2/(∂
2E/∂
k2),
E1 = ∂
Eedge/∂(Δ
a/
a0) and
C = [∂
2E/∂(Δ
a/
a0)
2]/
S0, where
S0,
E,
Eedge and Δ
a/
a0 are the cell area, the total energy, the shift of the VBM and CBM, and the lattice dilation, respectively. Calculated
m*,
E1,
C,
μ2D and
τ along
x and
y directions using DPA theory are shown in Table S3 (ESI
†). According to the modified deformation potential approximation theory, both
μ2D and
τ depend not only on the elastic constants and the deformation potential energy along the direction of carrier transport, but also on the values perpendicular to their directions.
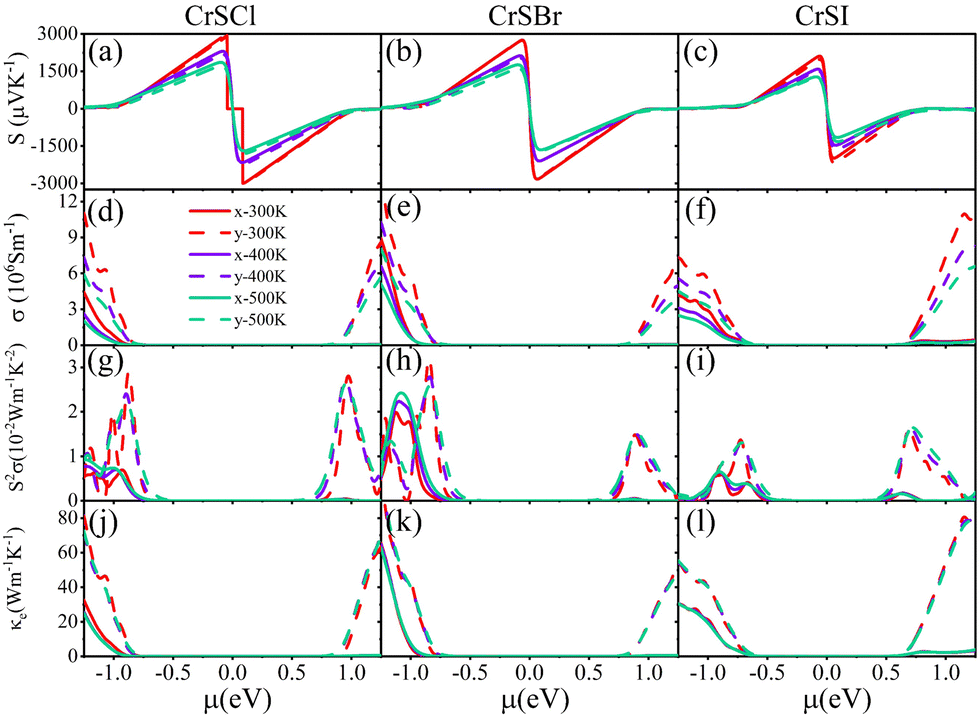
The values of m*, E1, C, τ, and μ2D were calculated and are summarized in Table 1, showing overall consistency with literature values.28 The m* values along the x-direction on the VBM (CBM) of CrSCl and CrSBr are 10–100 times greater than those along the y-direction. The m* along the y-direction is greater than that along the x-direction at the VBM of CrSI, consistent with band structure analysis. Similarly to CrSCl and CrSBr, the CBM of CrSI also shows a larger m* along the x-direction compared to the y-direction. μ2D is inversely proportional to m*, exhibiting an opposite trend. Furthermore, the multiplication of m* and μ2D results in weak anisotropy of τ. The electronic transport coefficients of CrSX monolayers as a function of chemical potential (μ) at 300 K, 400 K, and 500 K are shown in Fig. 8(a–l). The magnitude of |S| initially increases and then decreases with increasing magnitude of chemical potential |μ|. The Seebeck coefficient decreases with increasing temperature for a given μ, which can be attributed to the concurrent increase in carrier concentration as the temperature rises. The maximum S values for CrSCl, CrSBr and CrSI monolayers at 300 K are 3009, 2802 and 2172 μV K−1, respectively. The strong overlaps of the electronic group velocities cause S to nearly overlap in both directions.67Fig. 8(d–f) show the electrical conductivity σ increases with the increasing |μ| and decrease with temperature due to more frequent scattering of carriers at high temperatures.68 In p-type systems, σ exhibits weak anisotropy, while in n-type systems, it shows strong anisotropy. Regardless of the doping type (p-type or n-type), σ is greater along the y direction than along the x direction. Observation from Fig. 8(g–i) reveals that S2σ initially increases and then decreases with increasing |μ|. However, the temperature variation does not significantly affect the change in S2σ. The optimal S2σ values of CrSX monolayers are consistently higher along the y direction compared to the x direction, at a given μ, due to the difference in σ. At 300 K, the maximum S2σ values of CrSX monolayers surpass the corresponding optimal values of T-HfSe241 (2.92 mW mK−2), T-MoS269 (0.07mW mK−2), GeAs270 (3.8 mW mK−2), and PbTe70 (2.5 mW mK−2), with values of 8.85, 9.53, and 4.22 mW mK−2, respectively. Fig. 8(j–l) display the κe values of CrSX monolayers. Since κe is determined using the Wiedemann–Franz law, it demonstrates similar behavior to σ.
Table 1 Effective mass (m*, m0), deformation potential constant (E1, eV), 2D elastic modulus (C, J m−2), electron relaxation time (τ, fs) and carrier mobility (μ2D, cm2 V−1 s−1) of CrSX monolayers at 300 K using a modified DPA method
| Name |
Type |
Direction |
m* |
C
|
E
1
|
τ
|
μ
2D
|
| CrSCl |
h |
Γ–X |
6.554 |
81.1 |
3.42 |
97.792 |
26.243 |
|
Γ–Y |
0.080 |
101.0 |
4.63 |
88.940 |
1955.372 |
| e |
Γ–X |
5.982 |
81.1 |
5.00 |
32.062 |
9.427 |
|
Γ–Y |
0.343 |
101.0 |
4.52 |
35.621 |
182.657 |
| CrSBr |
h |
Γ–X |
7.118 |
77.1 |
3.03 |
123.511 |
30.519 |
|
Γ–Y |
0.091 |
98.8 |
3.51 |
122.068 |
2359.297 |
| e |
X–Γ |
7.962 |
77.1 |
4.51 |
24.610 |
5.436 |
|
X–S |
0.478 |
98.8 |
4.81 |
25.355 |
93.295 |
| CrSI |
h |
Γ–X |
0.280 |
73.7 |
7.29 |
30.983 |
194.620 |
|
Γ–Y |
4.888 |
96.9 |
1.28 |
62.733 |
22.573 |
| e |
X–Γ |
3.987 |
73.7 |
4.01 |
50.456 |
22.258 |
|
X–S |
0.300 |
96.9 |
4.61 |
50.399 |
295.477 |
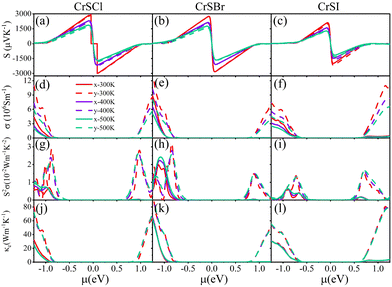 |
| | Fig. 8 The electron transport coefficients of CrSX monolayers as a function of chemical potential (μ) at 300, 400 and 500 K. (a)–(c) Seebeck coefficients (S), (d)–(f) electrical conductivity (σ), (g)–(i) power factor (S2σ) and (j)–(l) electronic thermal conductivity (κe). | |
3.3 Thermoelectric figure of merit
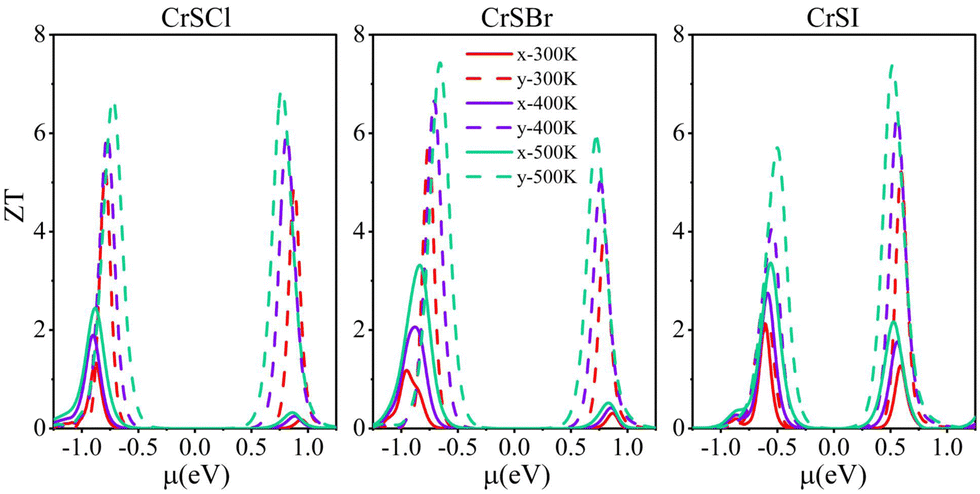
The ZT values of CrSX monolayers at different temperatures (300 K, 400 K, and 500 K) and varying chemical potentials along the x and y directions are shown in Fig. 9. The ZT value initially increases, then decreases with increasing |μ| for both p-type and n-type doping along the x and y directions, while it increases with temperature. The significant disparity in σ contributes to a marked differentiation in the ZT values in both directions. Table 2 presents the thermoelectric parameters corresponding to the optimum ZT values at room temperature. The optimal ZT values for CrSX monolayers are 1.33, 1.18, and 2.13 along the x-axis and 5.23, 5.84, and 5.22 along the y-axis. Thus, CrSX monolayers, characterized by their remarkably high ZT values, hold tremendous potential for thermoelectric applications and can be compared to the following excellent materials. For instance, SnSe has been reported to have a low thermal conductivity (0.25 W m−1 K−1) and a large ZT value of (2.6 ± 0.3) at 935 K71. The 2D superlattice-monolayer structure (SLM) of ZrSe2/HfSe2 theoretically exhibits a ZT value of 5.3 at room temperature.57 Moreover, the ZT value of the Fe2V0.8W0.2 Al film can reach 5 within the temperature range of 300–400 K.72
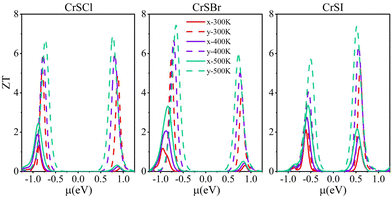 |
| | Fig. 9
ZT along the x and y directions as a function of chemical potential at 300, 400 and 500 K. | |
Table 2 The calculated optimum figure of merit (ZT) and Seebeck coefficients S (μV K−1), electrical conductivity σ (105 S m−1), power factor S2σ (10−2 W m−1 K−2) and electronic thermal conductivity κe (W m−1 K−1) at 300 K
| Name |
Type |
Direction |
S
|
σ
|
S
2
σ
|
κ
e
|
ZT
|
| CrSCl |
h |
X
|
277.69 |
0.63 |
0.48 |
0.46 |
1.33 |
|
Y
|
454.29 |
0.43 |
0.88 |
0.32 |
5.23 |
| e |
X
|
−208.05 |
0.10 |
0.04 |
0.07 |
0.18 |
|
Y
|
−442.38 |
0.44 |
0.84 |
0.31 |
4.90 |
| CrSBr |
h |
X
|
187.35 |
2.72 |
0.95 |
2.00 |
1.18 |
|
Y
|
476.80 |
0.37 |
0.83 |
0.27 |
5.84 |
| e |
X
|
−213.97 |
0.11 |
0.05 |
0.08 |
0.31 |
|
Y
|
−412.79 |
0.29 |
0.50 |
0.21 |
4.00 |
| CrSI |
h |
X
|
333.25 |
0.22 |
0.24 |
0.16 |
2.13 |
|
Y
|
310.40 |
0.16 |
0.15 |
0.12 |
2.17 |
| e |
X
|
−281.11 |
0.16 |
0.13 |
0.12 |
1.27 |
|
Y
|
−455.38 |
0.23 |
0.42 |
0.15 |
5.22 |
4 Conclusions
In this paper, by using the density functional theory and Boltzmann transport methods, we investigated the thermal and electrical transport properties of CrSX monolayers. The lattice thermal conductivity (κl) values of CrSX monolayers along the x-axis are 0.624, 0.419, and 0.179 W m−1 K−1, while along the y-axis, the values are 0.193, 0.158, and 0.093 W m−1 K−1 at room temperature. These ultralow κl values can be attributed to the strong anharmonicity in CrSX monolayers, which leads to small phonon relaxation times and flat acoustic phonon dispersions. The X atoms in CrSX monolayers serve as generalized rattlers in the direction perpendicular to the Cr–X–Cr plane, contributing to the strong anharmonicity. The interplay between harmonic and anharmonic phonon properties was responsible for the initial increase and subsequent decrease of the lattice thermal conductivity with the atomic mass from Cl to I. Additionally, we found that the optimum ZT values in CrSX monolayers can reach 1.33 (5.23), 1.18 (5.84) and 2.13 (5.22) along the y-axis at 300 K. The combination of ultralow lattice thermal conductivity and high figure of merit in CrSX monolayers not only highlights the potential of this system as an efficient 2D thermoelectric material but also provides valuable insights for discovering and designing high-ZT thermoelectric materials featuring rattling vibrational atoms.
Author contributions
Xiaowei Xuan conceptualized the study, conducted the DFT calculations, acquired the data, analyzed the results, and wrote the paper. Zhaoyu Yang, Rui Du, and Yimeng Zhao provided helpful discussion. Guangbiao Zhang, Yuli Yan, Chang Liu, and Hang Li initiated and designed the methodology of this work. All authors conceived the DFT calculations, analyzed the results, and coedited the manuscript.
Conflicts of interest
The authors declare that they have no known competing financial interests or personal relationships that could have appeared to influence the work reported in this paper.
Acknowledgements
This work was financially supported by the Postgraduate Education Reform and Quality Improvement Project of Henan Province (Grant No. YJS2023ZX19) and the National Natural Science Foundation of He'nan Province of China (Grant No. 222300420416).
Notes and references
- J. Yang, L. Xi, W. Qiu, L. Wu, X. Shi, L. Chen, J. Yang, W. Zhang, C. Uher and D. J. Singh, npj Comput. Mater., 2016, 2, 1–17 CrossRef.
- Z. Ding, M. An, S. Mo, X. Yu, Z. Jin, Y. Liao, K. Esfarjani, J.-T. Lü, J. Shiomi and N. Yang, J. Mater. Chem. A, 2019, 7, 2114–2121 RSC.
- N. Wang, H. Gong, Z. Sun, C. Shen, B. Li, H. Xiao, X. Zu, D. Tang, Z. Yin, X. Wu, H. Zhang and L. Qiao, ACS Appl. Energy Mater., 2021, 4, 12163–12176 CrossRef CAS.
- S. Chu, Y. Cui and N. Liu, Nat. Mater., 2016, 16, 16–22 CrossRef PubMed.
- L.-D. Zhao, C. Chang, G. Tan and M. G. Kanatzidis, Energy Environ. Sci., 2016, 9, 3044–3060 RSC.
- D. Li, K. Lee, B. Y. Wang, M. Osada, S. Crossley, H. R. Lee, Y. Cui, Y. Hikita and H. Y. Hwang, Nature, 2019, 572, 624–627 CrossRef CAS PubMed.
- Z. Wang, L. Zhao, K. F. Mak and J. Shan, Nano Lett., 2017, 17, 740–746 CrossRef CAS PubMed.
- L.-P. Tang, L.-M. Tang, H. Geng, Y.-P. Yi, Z. Wei, K.-Q. Chen and H.-X. Deng, Appl. Phys. Lett., 2018, 112, 012101 CrossRef.
- B. Poudel, Q. Hao, Y. Ma, Y. Lan, A. Minnich, B. Yu, X. Yan, D. Wang, A. Muto, D. Vashaee, X. Chen, J. Liu, M. S. Dresselhaus, G. Chen and Z. Ren, Science, 2008, 320, 634–638 CrossRef CAS PubMed.
- V. Kocevski and C. Wolverton, Chem. Mater., 2017, 29, 9386–9398 CrossRef CAS.
- M. Dutta, K. Pal, M. Etter, U. V. Waghmare and K. Biswas, J. Am. Chem. Soc., 2021, 143, 16839–16848 CrossRef CAS PubMed.
- U. Aseginolaza, R. Bianco, L. Monacelli, L. Paulatto, M. Calandra, F. Mauri, A. Bergara and I. Errea, Phys. Rev. B, 2019, 100, 214307 CrossRef CAS.
- J. Zhang, N. Roth, K. Tolborg, S. Takahashi, L. Song, M. Bondesgaard, E. Nishibori and B. B. Iversen, Nat. Commun., 2021, 12, 6709 CrossRef CAS PubMed.
- J. Hansson, T. M. J. Nilsson, L. Ye and J. Liu, Int. Mater. Rev., 2018, 63, 22–45 CrossRef CAS.
- D. Li, J. He, G. Ding, Q. Tang, Y. Ying, J. He, C. Zhong, Y. Liu, C. Feng, Q. Sun, H. Zhou, P. Zhou and G. Zhang, Adv. Funct. Mater., 2018, 28, 1801685 CrossRef.
- X.-K. Chen, J. Liu, Z.-X. Xie, Y. Zhang, Y.-X. Deng and K.-Q. Chen, Appl. Phys. Lett., 2018, 113, 121906 CrossRef.
- D. Dangić, O. Hellman, S. Fahy and I. Savić, npj Comput. Mater., 2021, 7, 57 CrossRef.
- M. K. Jana, K. Pal, A. Warankar, P. Mandal, U. V. Waghmare and K. Biswas, J. Am. Chem. Soc., 2017, 139, 4350–4353 CrossRef CAS PubMed.
- J. He, M. Amsler, Y. Xia, S. S. Naghavi, V. I. Hegde, S. Hao, S. Goedecker, V. Ozolinš and C. Wolverton, Phys. Rev. Lett., 2016, 117, 046602 CrossRef PubMed.
- Z. Feng, Y. Fu, Y. Zhang and D. J. Singh, Phys. Rev. B, 2020, 101, 064301 CrossRef CAS.
- X. Ye, Z. Feng, Y. Zhang, G. Zhao and D. J. Singh, Phys. Rev. B, 2022, 105, 104309 CrossRef CAS.
- B. Sales, B. Chakoumakos, D. Mandrus and J. Sharp, J. Solid State Chem., 1999, 146, 528–532 CrossRef CAS.
- R. Guo, X. Wang, Y. Kuang and B. Huang, Phys. Rev. B: Condens. Matter Mater. Phys., 2015, 92, 115202 CrossRef.
- X.-L. Zhu, P.-F. Liu, G. Xie, W.-X. Zhou, B.-T. Wang and G. Zhang, Nanomaterials, 2019, 9, 597 CrossRef CAS PubMed.
- D. Li, Y. Gong, Y. Chen, J. Lin, Q. Khan, Y. Zhang, Y. Li, H. Zhang and H. Xie, Nano-Micro Lett., 2020, 12, 36 CrossRef CAS PubMed.
- Y. Bai, Y. Wu, C. Jia, L. Hou and B. Wang, Appl. Phys. Lett., 2023, 123, 012401 CrossRef CAS.
- B. Wang, Y. Wu, Y. Bai, P. Shi, G. Zhang, Y. Zhang and C. Liu, Nanoscale, 2023, 15, 13402–13410 RSC.
- Y. Guo, Y. Zhang, S. Yuan, B. Wang and J. Wang, Nanoscale, 2018, 10, 18036–18042 RSC.
- J. P. Perdew and A. Zunger, Phys. Rev. B: Condens. Matter Mater. Phys., 1981, 23, 5048–5079 CrossRef CAS.
- P. E. Blöchl, Phys. Rev. B: Condens. Matter Mater. Phys., 1994, 50, 17953–17979 CrossRef PubMed.
- G. Kresse and D. Joubert, Phys. Rev. B: Condens. Matter Mater. Phys., 1999, 59, 1758–1775 CrossRef CAS.
- J. Heyd, G. E. Scuseria and M. Ernzerhof, J. Chem. Phys., 2003, 118, 8207–8215 CrossRef CAS.
- A. Togo and I. Tanaka, Scr. Mater., 2015, 108, 1–5 CrossRef CAS.
- L. Chaput, A. Togo, I. Tanaka and G. Hug, Phys. Rev. B: Condens. Matter Mater. Phys., 2011, 84, 094302 CrossRef.
- W. Li, J. Carrete, N. A. Katcho and N. Mingo, Comput. Phys. Commun., 2014, 185, 1747–1758 CrossRef CAS.
- G. K. H. Madsen and D. J. Singh, Comput. Phys. Commun., 2006, 175, 67–71 CrossRef CAS.
- J. C. Klöckner, M. Matt, P. Nielaba, F. Pauly and J. C. Cuevas, Phys. Rev. B, 2017, 96, 205405 CrossRef.
- G. J. Snyder and E. S. Toberer, Nat. Mater., 2008, 7, 105–114 CrossRef CAS PubMed.
- S. Tang, S. Bai, M. Wu, D. Luo, D. Wang, S. Yang and L.-D. Zhao, Mater. Today Energy, 2022, 23, 100914 CrossRef CAS.
- W. Fang, H. Wei, X. Xiao, Y. Chen, M. Li and Y. He, ACS Appl. Energy Mater., 2022, 5, 7802–7812 CrossRef CAS.
- G. Ding, G. Y. Gao, Z. Huang, W. Zhang and K. Yao, Nanotechnology, 2016, 27, 375703 CrossRef PubMed.
- R. Hill, Proc. Phys. Soc., London, Sect. A, 1952, 65, 349 CrossRef.
- A. Reuss, Z. Angew. Math. Mech., 1929, 9, 49–58 CrossRef CAS.
- O. L. Anderson, J. Phys. Chem. Solids, 1963, 24, 909–917 CrossRef CAS.
- M. Maździarz, 2D Mater., 2019, 6, 048001 CrossRef.
- W. Qiu, L. Xi, P. Wei, X. Ke, J. Yang and W. Zhang, Proc. Natl. Acad. Sci. U. S. A., 2014, 111, 15031–15035 CrossRef CAS PubMed.
- W. Lai, Y. Wang, D. T. Morelli and X. Lu, Adv. Funct. Mater., 2015, 25, 3648–3657 CrossRef CAS.
- J. Wang, Z. Huang, W. Liu, C. Chang, H. Tang, Z. Li, W. Chen, C. Jia, T. Yao, S. Wei, Y. Wu and Y. Li, J. Am. Chem. Soc., 2017, 139, 17281–17284 CrossRef CAS PubMed.
- A. Lou, Q.-B. Liu and H.-H. Fu, Phys. Rev. B, 2022, 105, 075431 CrossRef CAS.
- H. H. Huang, X. Fan, D. J. Singh and W. T. Zheng, J. Mater. Chem. C, 2019, 7, 10652–10662 RSC.
- J. Hafner and M. Krajci, J. Phys.: Condens. Matter, 1993, 5, 2489 CrossRef.
- S. Lu, Y. Ouyang, C. Yu, P. Jiang, J. He and J. Chen, J. Appl. Phys., 2021, 129, 225106 CrossRef CAS.
- Z. Zhang, S. Hu, Q. Xi, T. Nakayama, S. Volz, J. Chen and B. Li, Phys. Rev. B, 2020, 101, 081402 CrossRef CAS.
- X.-L. Zhu, H. Yang, W.-X. Zhou, B. Wang, N. Xu and G. Xie, ACS Appl. Mater. Interfaces, 2020, 12, 36102–36109 CrossRef CAS PubMed.
- W. Lin, J. He, X. Su, X. Zhang, Y. Xia, T. P. Bailey, C. C. Stoumpos, G. Tan, A. J. E. Rettie, D. Y. Chung, V. P. Dravid, C. Uher, C. Wolverton and M. G. Kanatzidis, Adv. Mater., 2021, 33, 2104908 CrossRef CAS PubMed.
- M. D. Nielsen, V. Ozolins and J. P. Heremans, Energy Environ. Sci., 2013, 6, 570–578 RSC.
- G. Ding, C. Wang, G. Gao, K. Yao, C. Dun, C. Feng, D. Li and G. Zhang, Nanoscale, 2018, 10, 7077–7084 RSC.
- X. Jiang, Z. Zhang, Z. Liu, J. Wang and Y. Liu, Appl. Phys. Lett., 2022, 120, 132202 CrossRef CAS.
- W. Li and N. Mingo, Phys. Rev. B: Condens. Matter Mater. Phys., 2015, 91, 144304 CrossRef.
- T. Pandey and A. K. Singh, J. Mater. Chem. C, 2016, 4, 1979–1987 RSC.
- T. Pandey, C. A. Polanco, L. Lindsay and D. S. Parker, Phys. Rev. B, 2017, 95, 224306 CrossRef.
- T. Tadano, Y. Gohda and S. Tsuneyuki, Phys. Rev. Lett., 2015, 114, 095501 CrossRef PubMed.
- L. Lindsay, Nanoscale Microscale Thermophys. Eng., 2016, 20, 67–84 CrossRef CAS.
- D. A. Broido, A. Ward and N. Mingo, Phys. Rev. B: Condens. Matter Mater. Phys., 2005, 72, 014308 CrossRef.
- H. Lang, S. Zhang and Z. Liu, Phys. Rev. B, 2016, 94, 235306 CrossRef.
- J. Bardeen and W. Shockley, Phys. Rev., 1950, 80, 72–80 CrossRef CAS.
- N. T. Hung, A. R. T. Nugraha and R. Saito, Appl. Phys. Lett., 2017, 111, 092107 CrossRef.
- N. Wang, M. Li, H. Xiao, X. Zu and L. Qiao, Phys. Rev. Appl., 2020, 13, 024038 CrossRef CAS.
- Y. Xie, T.-M. Chou, W. Yang, M. He, Y. Zhao, N. Li and Z.-H. Lin, Semicond. Sci. Technol., 2017, 32, 044003 CrossRef.
- A. Hassan, Y. Guo, Q. Wang, Y. Kawazoe and P. Jena, J. Appl. Phys., 2019, 125, 065308 CrossRef.
- L.-D. Zhao, S.-H. Lo, Y. Zhang, H. Sun, G. Tan, C. Uher, C. Wolverton, V. P. Dravid and M. G. Kanatzidis, Nature, 2014, 508, 373–377 CrossRef CAS PubMed.
- B. Hinterleitner, I. Knapp, M. Poneder, Y. Shi, H. Müller, G. Eguchi, C. Eisenmenger-Sittner, M. Stöger-Pollach, Y. Kakefuda, N. Kawamoto, Q. Guo, T. Baba, T. Mori, S. Ullah, X.-Q. Chen and E. Bauer, Nature, 2019, 576, 85–90 CrossRef CAS PubMed.
|
| This journal is © The Royal Society of Chemistry 2023 |
Click here to see how this site uses Cookies. View our privacy policy here. 
 Open Access Article
 This Open Access Article is licensed under a
  ,
Chang
Liu
,
Chang
Liu

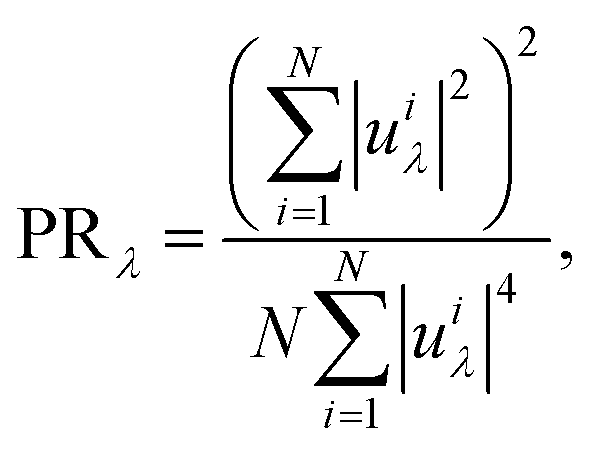
 is obtained by scaling the phonon eigenvector projected on the ith atom εiλ by the atomic mass Mi. The degree of atom involvement in a given phonon mode λ can be determined by the PR value in the range 0–1, where PR ∼ 0 indicates a localized rattling mode while PR ∼ 1 represents a propagating vibrational mode with coherent displacements of all atoms.52,53 In this study, the frequency-resolved PR values of CrSX monolayers are depicted in Fig. 3. The low-frequency range shows similar PR characteristics from Cl to I. Around the frequencies of the flat acoustic bands, the three monolayers have lower PR values, confirming rattling modes at those frequencies that arise due to localized X oscillations.


 , B = Ē1ΔE1,
  ,
,  with
with  ,
,  ,
,  and
and  . κB, E1, C and m* are the Boltzmann constant, the reduced Planck constant, the deformation-potential constant, the elastic constants and the effective mass, respectively. The m*, E1 and C can be given by66m* = ħ2/(∂2E/∂k2), E1 = ∂Eedge/∂(Δa/a0) and C = [∂2E/∂(Δa/a0)2]/S0, where S0, E, Eedge and Δa/a0 are the cell area, the total energy, the shift of the VBM and CBM, and the lattice dilation, respectively. Calculated m*, E1, C, μ2D and τ along x and y directions using DPA theory are shown in Table S3 (ESI†). According to the modified deformation potential approximation theory, both μ2D and τ depend not only on the elastic constants and the deformation potential energy along the direction of carrier transport, but also on the values perpendicular to their directions.