 Open Access Article
Creative Commons Attribution 3.0 Unported Licence
Injectable gelatin microspheres for osteomyelitis treatment: osteogenic and anti-inflammatory effect
Rui
Zhang
a,
Li
Chen
b,
Yijing
Stehle
c,
Mingyue
Lin
a,
Chenxin
Wang
a,
Yufan
Li
a,
Min
Huang
d,
Yubao
Li
*a and
Qin
Zou
 *a
*a
aResearch Center for Nano Biomaterials, Analytical & Testing Center, Sichuan University, Chengdu 610064, P. R. China. E-mail: nic7504@scu.edu.cn; zouqin80913@126.com
bAnalytical & Testing Center, Sichuan University, Chengdu 610064, P. R. China
cDepartment of Mechanical Engineering, Union College, 807 Union St., Schenectady, NY 12308, USA
dSichuan Institute of Atomic Energy, Chengdu, 610101, P. R. China
First published on 9th August 2023
Abstract
The clinical treatment of osteomyelitis usually involves surgical debridement, necrotic bone removal, and subsequent biomaterial transplantation to fill the void. The transplanted biomaterials need to be able to fight the pathogens invading the infection after trauma, orthopedic surgery or joint replacement and be able to relay regenerative events. Here, injectable vancomycin (Van)-loaded gelatin/nanohydroxyapatite (Gel/n-HA) composite microspheres (VM) with both antibacterial and bone regenerative properties were prepared for osteomyelitis treatment. The impact of Gel/n-HA-injectable composite microspheres (M) on cell recruitment, proliferation, and osteogenic differentiation was evaluated. Osteoblasts were successfully recruited by M to the bone defect area in vivo. Furthermore, the release kinetics of Van from VM in vitro and anti-inflammatory activity in vivo were assessed as the efficacy of the released antibiotics, which inhibited cell wall synthesis in Staphylococcus aureus, thereby lysing the bacterial cells. When administered topically to rabbit tibia osteomyelitis defects, the injectable VM enhanced in vivo bone healing and fracture resistance. Thus, owing to the injectability and coordinated therapeutic actions of VM, they are considered promising biomaterials with osteogenic and anti-inflammatory potential for osteomyelitis treatment.
1. Introduction
Osteomyelitis occurs because of microbial invasion or autoinflammatory processes and can drastically compromise the functionality and regenerative capacity of osseous tissues.1 Gram-positive Staphylococci constitute the most common pathogen of osteomyelitis (∼75%) and can cause bone destruction at the infection site by inducing osteoblast apoptosis,2 activating osteoclast formation, and secreting toxins.3 Sequestrum formation following infection produces bone defects not conducive to local infection control, with hematoma formation in these defects creating opportunities for bacterial colonization.4 In the later stages of osteomyelitis, dead bone almost fully covers the original living bone. Ischemia can potentially induce bone necrosis by obliterating the bone vascular channels, thereby reducing blood supply.5 The separation of ischemic bone segments forms sequestra. Consequently, an avascular area inaccessible to antibiotics and inflammatory cells is formed that provides a suitable environment for continued bacterial growth.6 The first task in the treatment of osteomyelitis is to clear the bacterial infection. Systemic antibiotic application can help reduce infection; however, the local ischemic condition and the presence of the “blood–bone” barrier cause poor antibiotic penetration at the site of interest.7 Clinical treatment usually includes surgical debridement, necrotic bone removal, and subsequent autologous bone transplantation to fill the void.Therefore, numerous bone implantable biomaterials, such as microspheres, have been developed with antibiotics8,9 (i.e., gentamicin sulfate,10 ibuprofen,11 or lysozyme12) incorporated for administration to localized defective sites to protect against bacterial infection while simultaneously enabling bone repair.13 Spherical microspheres have versatile applications either as suspensions or (colloidal) gels that can be applied using minimally invasive surgery.14 The microsphere-type scaffold is easily applied via syringe needle injection into the bone defect sites for repairing irregular and complex defects. Gelatin is derived from collagen by breaking down the triple-helical structure of collagen. Gelatin contains the sequence of arginine–glycine–aspartic acid (RGD) which is the specific recognition site of integrins and is involved in regulating the interactions between cells and the extracellular matrix.15 Incorporation of nanohydroxyapatite (n-HA) into gelatin was shown to generate composite microspheres with increased hydrophilicity and osteoconductivity. With the increase of n-HA content, the protein adsorption capacity of the composite microspheres significantly increased.16 The architecture of n-HA can offer biophysical information for the adjustment of cell behaviors (e.g., cell attachment, spreading, proliferation, or differentiation) and the subsequent process of osteogenesis for bone regeneration.17 Previously, we reported the preparation of gelatin/nanohydroxyapatite (Gel/n-HA) (10 wt%) composite microspheres using a water-in-oil emulsification process and subsequent crosslinking with 1-ethyl-3-(3-dimethylaminopropyl)carbodiimide (EDC).18 These microspheres exhibited superior cytocompatibility as they possessed sustainable regenerative effects for bone healing with the zero-length crosslinking agent (EDC) and are entirely degradable. Studies have shown that drug and biomolecules can be readily loaded into gelatin microspheres via diffusion, which avoids the contact with harsh organic substances during the crosslinking reaction.19 Vancomycin (Van) is a glycopeptide antibiotic that inhibits bacterial cell wall synthesis through a five-hydrogen bond interaction between the heptapeptide backbone of the antibiotic and the C-terminal D-alanyl–D-alanine (D-Ala–D-Ala) dipeptide, consequently lysing the bacterial cell walls and causing cell death.20 A nanocomposite fibrous scaffold (silica-coated n-HA-gelatin reinforced with poly(L-lactic acid) yarns) containing Van for treating osteomyelitis in a rat model was shown to be highly efficacious.21 In recent years, bone tissue regeneration through endogenous stem cell “homing” and recruitment has received more attention.22 It utilizes the body's own regeneration capacity to repair bone tissue while avoiding exogenous cell-associated limitations. The appropriate selection of cell-adhesion signaling molecules and the identification of a suitable linking strategy that ensures efficient and reliable mobilization of the selected adhesion signaling molecules while preserving their biochemical functions are key considerations when designing cell instructive biomaterials.23 Many strategies, such as native ECM proteins and protein fragments of gelatin, are popular choices for promoting the adhesion of stem cells to the surfaces of biomaterials, regulating immune cell infiltration and reducing the inflammatory effects of biomaterials.24 Ke et al. described the production of a 3D gelatin microsphere scaffold with multiple voids designed and manufactured on the basis of facile fabrication of gelatin microspheres. The effective production of this scaffold can be used to promote tissue migration and nerve recovery after spinal cord injury.25 Limited stem cell sources restrict the ex vivo expansion of exogenous stem cells and in vivo delivery of growth factors for osteomyelitis treatment. Hence, the most effective and feasible strategy to apply this treatment is by exploiting injectable scaffolds loaded with targeted antibacterials against local infection and cell recruitment activities reflecting the osteogenic cell niche that can interact with the surrounding host tissue to achieve rapid homeostasis by recruiting embryonic stem cells and promoting angiogenesis and osteogenesis.26
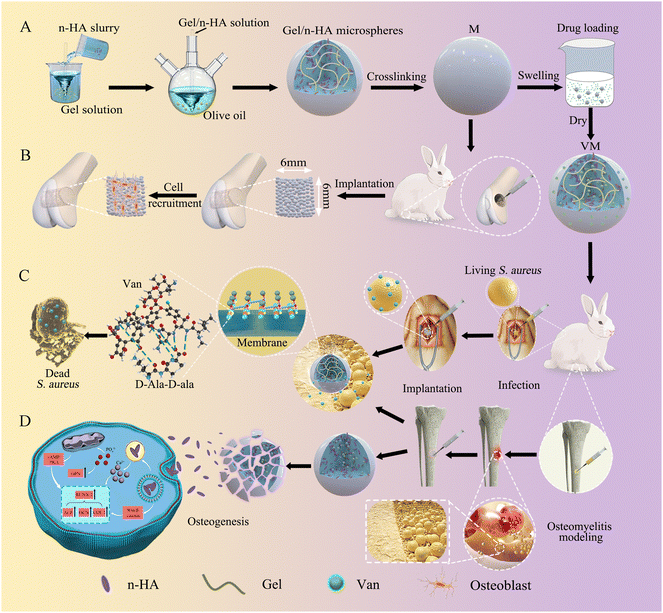
Here, we exploited the water-in-oil emulsification method to fabricate Gel/n-HA-injectable composite Van-loaded microspheres (VM) as a local delivery system (Scheme 1). We aimed to examine whether the targeted antibacterial and cell recruitment activities in vitro of VM translate to an effective osteomyelitis treatment. Further, we tested the hypothesis that EDC crosslinked microspheres support osteogenesis. Microsphere degradation and bone formation supported by the microscaffolds in the femoral condyle defect group were monitored using microcomputed tomography (Micro-CT) and histology. We validated the feasibility of Van delivery for antibacterial activity via VM. The drug release kinetics and antibacterial mechanism of VM were assessed using the drug release profile and scanning electron microscopy (SEM), transmission electron microscopy (TEM), and live/dead staining of bacteria. Finally, a rabbit model of osteomyelitis was employed to assess the overall hypothesis of the targeted antibacterial, inflammation modulatory, osteoblast recruitment, and bone regenerative properties of VM in vivo. The inflammation modulatory effect, particularly in killing bacteria, and the morphology of bone formation in the osteomyelitis model following treatment were evaluated using end-point histology and sequence fluorescent labeling.
2. Materials and methods
2.1 Materials and reagents
Gel type A was purchased from Sigma-Aldrich, USA. n-HA slurry was synthesized by a wet chemical method in our laboratory.27 All chemical reagents obtained from commercial routes were of analytical grade and were used without further purification.2.2 Preparation of microspheres
The injectable Gel/n-HA microspheres (M) were prepared by a water-in-oil emulsion method.18 Briefly, Gel (1.5 g) was completely dissolved in distilled water (10 mL) at 40 °C to form a homogeneous aqueous Gel solution before the addition of n-HA slurry (30 w/v%, Gel![[thin space (1/6-em)]](https://www.rsc.org/images/entities/char_2009.gif) :
:![[thin space (1/6-em)]](https://www.rsc.org/images/entities/char_2009.gif) n-HA = 9
n-HA = 9![[thin space (1/6-em)]](https://www.rsc.org/images/entities/char_2009.gif) :
:![[thin space (1/6-em)]](https://www.rsc.org/images/entities/char_2009.gif) 1). Next, the solution was poured into olive oil in a three-neck round-bottom flask and further stirred with an upper stirrer for 15 min (400 rpm) followed by chilling to below 10 °C for 30 min. To form this W/O emulsion, acetone (100 mL) was added to the suspension mixture and stirred for 15 min. The microspheres were separated by centrifugation at 4 °C, and fully washed with acetone to remove oil. Finally, the microspheres (dried at 45 °C for 12 h in an oven in air) were crosslinked in EDC/acetone aqueous solution (0.1%, w/v) at room temperature for 12 h.
1). Next, the solution was poured into olive oil in a three-neck round-bottom flask and further stirred with an upper stirrer for 15 min (400 rpm) followed by chilling to below 10 °C for 30 min. To form this W/O emulsion, acetone (100 mL) was added to the suspension mixture and stirred for 15 min. The microspheres were separated by centrifugation at 4 °C, and fully washed with acetone to remove oil. Finally, the microspheres (dried at 45 °C for 12 h in an oven in air) were crosslinked in EDC/acetone aqueous solution (0.1%, w/v) at room temperature for 12 h.
The swellable properties of the drug carrier loaded Van in the M have been reported.28 Briefly, the Van was loaded allowing the microspheres (1 g) to swell at 37 ± 0.2 °C under continuous magnetic stirring (120 rpm) in a water solution of Van (1 g/125 mL) for 6 h. The resulting Van-loaded Gel/n-HA composite microspheres (VM) were finally washed 3 times with ethanol by centrifiltration and lyophilization.
2.3 Characterization of microspheres
The particle size distribution of M and VM was measured by laser diffractometry (laser particle size analyzer, Mastersizer 2000, Malvern, UK). Scanning electron microscopy (SEM, Apreo S, Thermo Scientific, USA) was used to observe the surface of M and VM and observe the cross-section of M and VM which were embedded in the glycol methacrylate monomer29 (Technovit®7200 VLC, Germany). Energy-dispersive X-ray spectroscopy (EDS, X-MaxN 80, Oxford, UK) was used for elemental analysis. The phase composition and crystallinity of samples were analyzed by X-ray diffraction (XRD, PANalytical B.V, EMPYREAN, Netherlands). The infrared spectra of samples were collected by Fourier transform infrared spectrometry (FT-IR, Invenio R, BRUKER, Germany). The M and VM filled in bones were scanned by microcomputed tomography (Micro-CT, Viva CT80, SCANCO Medical AG, Switzerland).2.4 Biocompatibility and osteogenic differentiation of M
For the quantitative real-time polymerase chain reaction (qPCR) assay,30,31 after BMSCs were seeded on the M at 5 × 10⁴ cells per mL for 7 and 14 days, total RNAs of BMSCs were extracted and collected by using the Trizol reagent (Life Technologies), the quantity of RNA was detected by the OD value, and the integrity of RNA was determined by 1% agarose gel electrophoresis. The first-strand cDNA was synthesized using the Super-Script First-Strand Synthesis System (Gene seed), followed by the amplification of the cDNA product using Platinum Taq DNA polymerase (Gene seed). The first-strand complementary DNA (cDNA) was synthesized by using the reaction fluid (4 μL of 5 × RT buffer, 2 μL of geneseed® enzyme mix, 1 μL of reverse transcription primer, 1 μg of total RNA, and 20 μL of RNase free ddH2O) at 25 °C for 10 min, 42 °C for 60 min, and 85 °C for 5 min, respectively. β-Actin was considered as the internal control gene in this analysis. The primer sequences of the genes are summarized in Table 1.
| mRNA | Forward primer | Reverse primer |
|---|---|---|
| β-actin | GGCCGGGACCTGACAGACTACCTC | GTCACGCACGATTTCCTTCTCAGC |
| COL 1 | ACGGCTGCACGAGTCACAC | GATGGGOAGGCGGGAGGTCITG |
| RLNX 2 | GCCQTAGAGAGCAGGGAAGAC | CTGGCTTGGATTAGGGAGTCAC |
| ALP | CGGGCAGTGTGACGGTAAATA | ACATCGGGGGCAGGCAGACT |
| OCN | ACCGGGAGCAGTGTGAGC | GATGCGTTTGTAGGCGGTCTTC |
| OPN | TGGCTGAATTCTGAGGGACTAACT | ACTTTCACCGGGAGGGAGGAG |
The qPCR reaction system was prepared using 10 μL of 2 × SYBR Green PCR Master Mix, 0.4 μL of forward primer, 0.4 μL of reverse primer, and 20 μL of ddH2O. The PCR initiated denaturation at 95 °C for 5 min. Then 40 cyclic reactions were carried out, each of which was composed of denaturation at 95 °C for 10 s and acquisition signals at 60 °C for 34 s. Eventually, the dissolution was reacted at 95 °C for 15 s, 60 °C for 60 s, and 95 °C for 15 s. Reaction specificity was confirmed by analyzing the melting curves of the products and the electrophoresis of the products on a 1.0% agarose gel. The relative changes in gene expression were analyzed via the 2(−Delta Delta C(T)) method and normalized according to the expression of the housekeeping gene β-actin.
2.5 Antibacterial ability and release evaluation of Van of the VM
 | (1) |
The KB disk diffusion method was used to evaluate the bioactivity of the Van released under different pH conditions. The bacterial zone of inhibition (killed bacteria) is related to the quantity and efficacy of the released antibiotic. For this, about 30 μL of the released Van at different time points (0–14 days) was added to a 6 mm sterile filter-paper disk and then air-dried. S. aureus (1 mL, 108 CFU mL−1) was seeded on the prepared agar plate and the prepared filter paper samples were placed on the agar plate. The zones of inhibition were measured after 24 h incubation at 37 °C.
2.6 Treatment of rabbit osteomyelitis
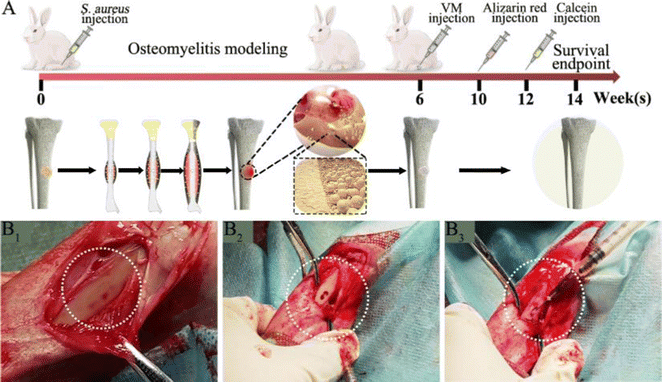
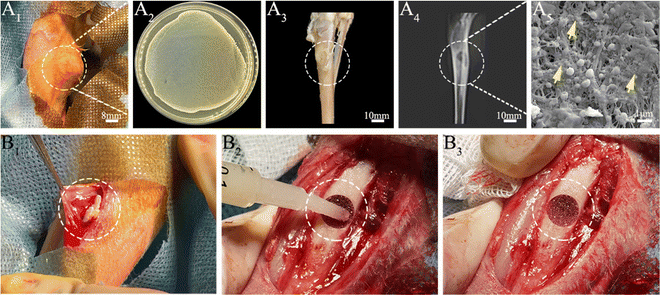
Next, we developed an animal model with induced infection to evaluate its potential as a promising adjuvant therapy for osteomyelitis (Fig. 1A). The rabbit tibia osteomyelitis model was established according to the literature.39–41 All surgical procedures were approved and performed by the Ethics Committee of West China Hospital at Sichuan University. Ten adult pathogen-free New Zealand white rabbits (∼3.0 kg per each) were anesthetized with 3% (w/w, 30 mg kg−1) pentobarbital sodium. After anesthesia, the hair was removed from the hind legs and the skin was disinfected. A skin incision was made in the medial tibia of the rabbits. The skin and musculature were dissected and the tibia was exposed (Fig. 1B1). A bone defect model (2 mm in diameter, deep into the medullary cavity) was created on the medial side of the anterior tibia using a drill. Two longitudinally connected and partially overlapped bone holes were drilled here to reach the medullary cavity to make a rectangular bone window (Fig. 1B2). Osteomyelitis was induced by injecting 0.1 mL of S. aureus suspension (1 × 10⁸ CFU mL−1) and 0.1 mL of 5% sodium morrhuate (Xinyi Pharmaceutical, China) into the tibia of the rabbits (Fig. 1B3). After sealing the bone window with bone wax and washing the wound with normal saline, the musculature and the skin were closed with sutures separately. After 6 weeks, the rabbits were sacrificed to confirm the presence of osteomyelitis through microbiological and X-ray imaging, according to the method described by Norden et al.40Six weeks following surgery, a yellow viscous purulent liquid and granular purulent tissue can be seen around the site of the previous operation and a large number of bacterial colonies can be observed after incubation of the purulent liquid (Fig. 2A1 and A2). Obvious bone abscesses can be found by exposing the tibia (Fig. 2A3). Radiographic features (Fig. 2A4) of osteomyelitis including osteoporosis, peripheral osteosclerosis, cortical bone thinning, and bone destruction were observed in osteomyelitis modeling. SEM examination (Fig. 2A5) revealed the presence of S. aureus clusters within the biofilm on the implant surface, densely packed within a thin necrosed bone. Under strictly sterile conditions, after subcutaneous abscess removal, the loose and necrotic bone and soft tissue were delicately debrided in the area of osteomyelitis infection (Fig. 2B1). For different treatments, Van solution was used to wash the infected site repeatedly in the control group and the VM group was washed with Van solution and injected with VM into the intramedullary canal (Fig. 2B2 and B3). Finally, the bone defect was sealed by bone wax, and then the wounds were sutured.
The sequence fluorescent labeling investigation was conducted to detect the rate of new bone formation and mineralization.42,43 Briefly, after VM implantation for 4 weeks, the animals were subjected to intramuscular injection of 30 mg kg−1 Alizarin red solution (Sigma, USA). Besides, additional calcein solution at a dose of 20 mg kg−1 (Sigma, USA) was also injected two weeks before sacrifice. At 8 weeks, the rabbits were sacrificed and the tibias were harvested. Fresh bone tissues were fixed in 4% buffered paraformaldehyde, embedded in resin and sliced. The cut sections stained by HE were observed by using a microscope. The other sections without staining were then imaged by CLSM.
8 weeks after the microsphere treatment, all animals were sacrificed and the tibias were harvested. The immobilized (in 4% buffered paraformaldehyde) samples were scanned using Micro-CT. Based on the original CT scans of each sample, three-dimensional images were reconstructed. The micro-morphological bone evaluation parameters include BMD and BV/TV. Samples for histological analysis were decalcified in 10% EDTA decalcifying solution for 2 months, then embedded in resin and cut into 5 μm sections after washing, dehydration, and wax immersion. Finally, the cut sections were stained by HE and Masson staining and then observed by using a microscope to analyze histopathological characteristics.
2.7 Statistical analysis
All the data were expressed as means ± standard deviations (SDs). One-way analysis of variance (ANOVA) was used to determine the statistical significance among different groups. When the p-value was <0.05, the statistics was considered significant, and p < 0.01 was considered remarkably significant.3. Results
3.1 Characterization of M and VM
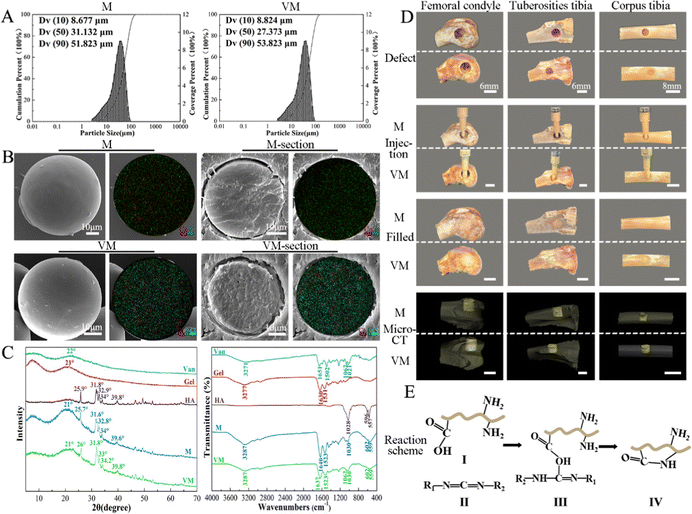
The particle sizes of M range between 8.7 and 51.8 μm (D50 = 31.1 μm) and those of VM range from 8.8 to 53.8 μm (D10 and D90, respectively), with a median size of 27.4 μm (D50) (Fig. 3A). Gel/n-HA composite microspheres (M) showed a very smooth spherical appearance with a few microwrinkles on the surface (Fig. 3B(top, left)). Both calcium (red) and phosphorus (green) elements were evenly distributed on the microsphere. The Van-loaded M (VM) sample was comprised of some miniscule particles compared to the unloaded microsphere. The large pores on the sphere interior and chloride elements (blue dots) on the surface and inside of the VM (Fig. 3B) were formed during the drug loading. The broad XRD diffraction peak of Gel and Van powder was located around 22° and 21°, respectively, which proves the amorphous structure of Gel and Van. The diffraction peaks at 24.7°, 31.6°, 32.8°, 34°, and 39.6° (JCPDS#09-0432) indicated the presence of n-HA in M.44 No apparent changes in the crystalline structure during the EDC crosslinking can be identified in the XRD spectral comparison. The addition of Van did not alter the crystallinity of the M or form new bonding according to Fig. 3C. According to IR spectra, the phosphate bands at 1030, 602, and 559 cm−1 which arise from the phosphate asymmetric bending vibrations slightly shift after crosslinking with EDC. The C![[double bond, length as m-dash]](https://www.rsc.org/images/entities/char_e001.gif) O absorption peak of the amide I band shifted from 1630 to 1640 cm−1and that of the amide A band shifted from 3277 to 3287 cm−1.45 VM exhibited a specific band at 1062 cm−1 corresponding to the stretching bending of C–O for Van (Fig. 3C).46 Following the implantation of M and VM into the rabbit bone defect ex vivo model, a random stacking of both M and VM effectively filled the defect site completely, which demonstrated good injectability and plasticity and potential as an ideal injectable bone-filling material (Fig. 3D).47
O absorption peak of the amide I band shifted from 1630 to 1640 cm−1and that of the amide A band shifted from 3277 to 3287 cm−1.45 VM exhibited a specific band at 1062 cm−1 corresponding to the stretching bending of C–O for Van (Fig. 3C).46 Following the implantation of M and VM into the rabbit bone defect ex vivo model, a random stacking of both M and VM effectively filled the defect site completely, which demonstrated good injectability and plasticity and potential as an ideal injectable bone-filling material (Fig. 3D).47
3.2 Biocompatibility of M and associated effects on osteogenic differentiation of BMSCs
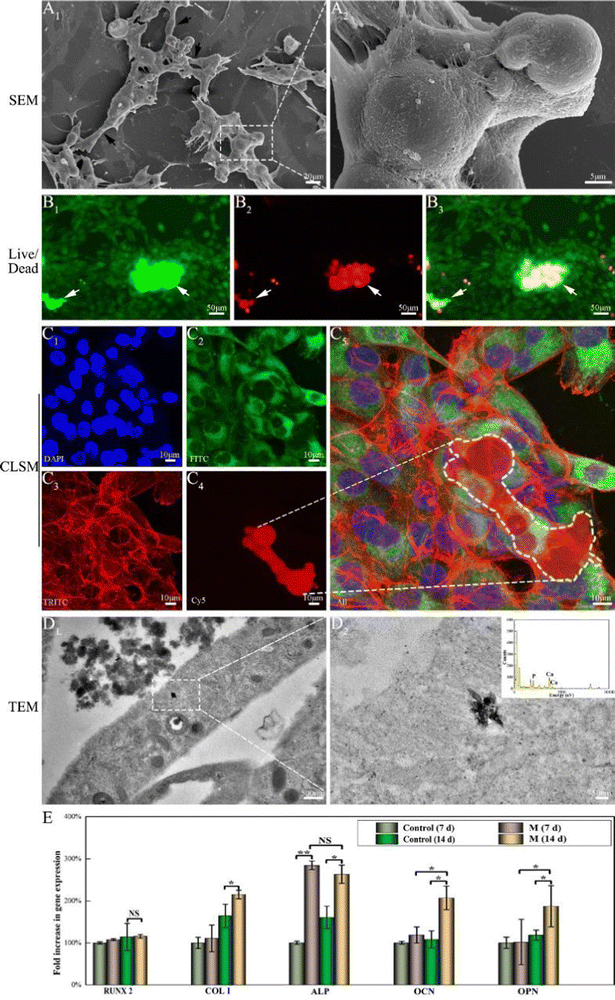
When MG63 cells were in close proximity with randomly distributed M, the cells explored their environment by extending filopodia and spikes, with numerous long multiple filopodia extending from the cell bodies connecting to distant M, leading to bridging (Fig. 4A1, black arrow). High-resolution imaging (Fig. 4A2) revealed that the MG63 cells were attached to the surface of M via pseudopodia to form tight, compact layers till the surface was well-coated. In the live/dead staining assay (Fig. 4B), numerous live cells (Fig. 4B1, green fluorescence) and a few dead cells (Fig. 4B2, red fluorescence) were observed, revealing that coated cells exhibited high viability and sufficient maturity to jointly form a layered film around the agglomerated M. Confocal microscopy staining was used to visualize the migration and proliferation of the cells that coated the three-dimensional (4C) structure of M. Diffuse and brightly stained nuclei (Fig. 4C1, blue) were observed on and around the M. Strong mitochondrial staining (green) indicated potential cell viability and proliferation on M (Fig. 4C2). The cells exhibited a fusiform and spreading morphology, with multiple elongated filopodia and lamellipodia. Cell growth on the surface of M exhibited elongated, clustered, and multilayered morphologies alongside extended spreading of the cytoskeleton, as shown by F-actin staining (red) (Fig. 4C3). The 3D reconstruction of the images showed that several cellular layers covered the agglomerated M (Fig. 4C4 and C5). On TEM of bone marrow-derived mesenchymal stem cells (BMSCs) cultured with M for 14 days, mitochondria that approximated the rough endoplasmic reticulum exhibited characteristic double membranes with granule-free cristae (Fig. 4D1).48 Following interaction with M, n-HA entered BMSCs cells via endocytosis. Intracellular n-HA accumulation was demonstrated by the appearance of electron-dense granules surrounded by the rough endoplasmic reticulum. The nanocrystals maintained a uniform rod-like morphology and EDS mapping further proved the existence of Ca/P elements in n-HA, as shown in the higher-magnification images (Fig. 4D2).RUNX2 is a prominent transcription factor that regulates the expression of osteogenic marker genes and promotes bone formation. Although no significant difference in expression levels was observed among the M and control groups (Fig. 4E), normal RUNX2 mRNA expression in M indicated that M can support the differentiation of adherent cells along the osteogenic lineage. COLI is a component of the extracellular matrix and is an intermediate osteogenesis index.49 The effect of M on COLI mRNA expression was less prominent for 7 days of treatment. However, M upregulated COLI expression at later time points (day 14, p < 0.05). As an essential marker of early osteogenesis, ALP expression on day 7 showed particular improvements compared with the control group (p < 0.05). On day 14, ALP expression in the experimental group osteoblasts with M was slightly lower than that on day 7 but higher than that of the control group (p < 0.01). OCN and OPN are late-stage osteogenic markers for bone maturation and bone formation.44 Both these markers exhibited high mRNA expression levels on day 14 (p < 0.05). Thus, M accelerates osteogenic differentiation at an early stage and promotes extracellular matrix formation.
3.3 Degradation and osteogenesis of M in vivo
3.4 Antibacterial effect of the VM
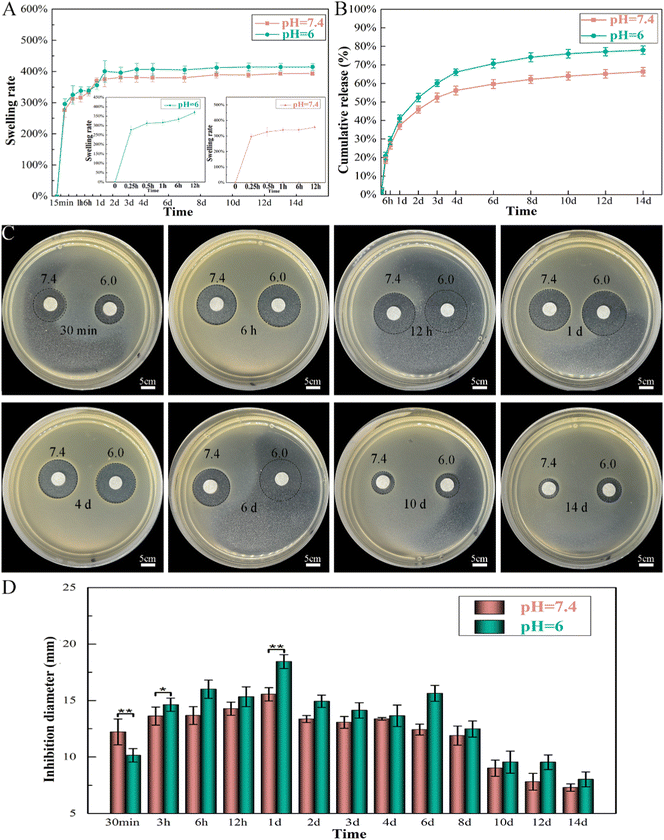
The released Van can produce visible bacterial inhibition rings after 14 days of release at both pH values, which further proved its high biological activity (Fig. 8C and D). The diameter of the formed inhibition ring gradually increased on the first day and then eventually decreased. The largest diameters of the zones were 18 mm (pH 6.0) and 15 mm (pH 7.4) at 24 h in the agar plates; thus, the rapid release of Van can produce an initially rapid period of bacterial death. After a longer release time (14 days), the diameters of the inhibition rings were only 8 mm (pH 6.0) and 7 mm (pH 7.4), although VM still maintained antibacterial activity. The bioactivity of Van at both pH values was similar within the 14 day period. However, the antibacterial effect of Van at pH 6.0 sharply increased and was more effective than that of Van at pH 7.4 within 14 days of release (except for the first 30 min).
3.5 Treatment of osteomyelitis in vivo
By the 8th week, the infected rabbit exhibited distorted periosteum and progressive cortical bone destruction (Fig. 10A1); purulent material at the modeling medullary cavity site can be observed in the sagittal photo (Fig. 10A2). MicroCT images revealed that the control group had almost no new bone formation in the defect site. Typical osteomyelitis manifestations, including severe trabecular disorder (Fig. 10A3), osteoporosis (Fig. 10A4), and osteolysis (Fig. 10A5), were observed. In the VM group, the bone cortex was smooth and intact (Fig. 10B1) without swelling or ulceration (Fig. 10B2). CT analysis showed that the VM group exhibited good bone repair with almost complete healing of the bone defect, including the cortical bone (Fig. 10B3). In addition, the shape of the radiopacity area in the intramedullary bone (Fig. 10B4) was similar to that of the original compact bone, i.e., the bone tissue was dense (Fig. 10B5). BV/TV and BMD (quantitative analyses of the microCT images) exhibited similar trends (Fig. 10G) where the VM group (BV/TV: 32.24%; BMD: 0.45 g/cm3) was significantly different (p < 0.01) from the control group (BV/TV: 5.23%; BMD: 0.12 g cm−3). Severe cortical bone destruction and fracture were observed in the control group via H&E staining (Fig. 10C). Conversely, in the VM group, instead of further bone destruction, regenerated cortical bone was observed at the infection site (Fig. 10D). Subsequently, sequential fluorescent labeling was used to observe new bone formation by applying two types of fluorochromes: alizarin red (red) and calcein (green). As fluorochromes can bind to calcium ions of the newly formed bone and incorporate into the mineralization area, the new bone formed at different periods can be discriminated using different fluorochrome colors.53 The new bone tissue was thin, and the fluorescence intensity was low in the control group after 8 weeks (Fig. 10E). In the VM group, the fluorescence images showed the complete outline of M that had not completely degraded together with new bone tissue around these M (Fig. 10F, white arrow). Strong fluorescence intensity (Fig. 10H) and dense bone tissue indicated a strong bone regeneration capability induced by treatment with VM.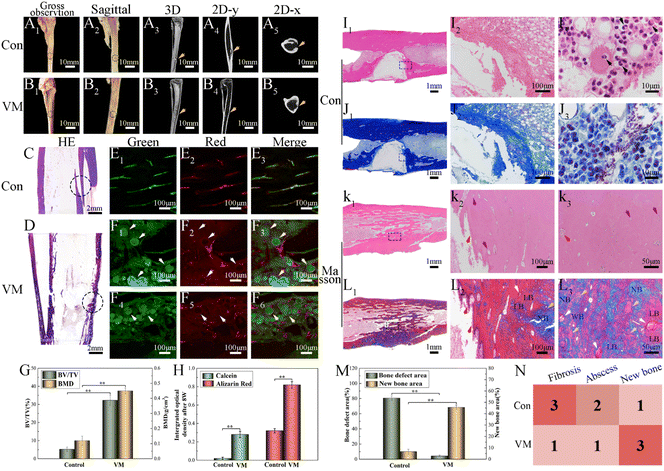 | ||
| Fig. 10 In vivo treatment of osteomyelitis after 8 weeks. Gross observation photos and Micro-CT 3D reconstruction: (A) control; (B) VMs. Hematoxylin and eosin (H&E) staining of newly formed bone tissue: (C) control; (D) VMs. Fluorescent staining of newly formed bone tissue: (E) control; (F) VMs. Green: calcein, red: alizarin red. Black circle: bone defect; yellow arrow: modeling area; white arrow: microspheres. The bone volume/total volume and bone mineral density results of the defect area of bone modeling (G) in vivo via Micro-CT analysis. Summary of fluorescent labeling (H). Histological analysis of newly formed bone tissue: (I) H&E staining of the control group; (J) Masson staining of the control group; (K) H&E staining of the VM group; (L) Masson staining of the VM group. Black arrow: inflammatory cells, white arrow: microspheres, red arrow: osteoblasts, yellow arrow: trabecular, purple arrow: blood vessels, NB: new bone, LB: lamellar bone, WB: woven bone. (M) The percentage of trabecular bone area in the different treatment groups after 8 weeks; (N) for the semiquantitative assessment of the severity of infection and lack of tissue integration,52 histological scores were determined based on the histological sections J and L (1: few; 2: moderate/focal; 3: numerous and diffuse). n = 3, **p < 0.01. | ||
The H&E staining showed that bone destruction (Fig. 10I1) was present at 8 weeks. A severe inflammatory (Fig. 10I2) response was observed in the control group, including dead bone, large accumulation of lymphocytes and monocytes, and neutrophil infiltration into the bone tissues. The bone defect area reached 80.56% ± 2.78% (Fig. 10M). Noticeably, neutrophils were in evidence (Fig. 10I3, black arrow), possibly as a result of the ongoing and severe bacterial infection. Bone defects were displayed via the blue-stained collagen fibrous tissues using Masson's staining (Fig. 10J1, J2). In the VM group, bone infection was considerably suppressed (Fig. 10K1) and the defect was completely reconstructed (Fig. 10L1) at 8 weeks (new bone remodeling area reached 45.65% ± 1.9%) (Fig. 10M). A substantial number of new blood vessels had formed (Fig. 10K2, K3, purple arrow). Several new blood vessels were present around the newly formed trabeculae (yellow arrow) aligned by osteoblasts (red arrow), suggesting active bone formation. Osteocytes and the lamellar features of the newly synthesized bone around M (white arrow) indicated bone maturation. A thick layer of randomly oriented woven bone was gradually translated into compact and stress-oriented lamellar bone (Fig. 10L2, L3). The histological scores (Fig. 10N) demonstrated that VM exhibited the ability to eliminate existing infections and guide bone tissue regeneration.
4. Discussion
The clinical treatment of osteomyelitis usually includes surgical debridement, necrotic bone removal, and subsequent biomaterial transplantation to fill the void. It is critical to develop new therapeutic strategies for antibiotic delivery with sustained release characteristics alongside high bioactivity that can neutralize the negative effects of high local antibiotic concentrations.54 Here, we have developed an antibiotic delivery microcarrier consisting of Gel/n-HA microspheres loaded with Van that simultaneously exhibits an improved ability to induce cell recruitment and targeted antimicrobial characteristics for effective osteomyelitis treatment.4.1 Preparation and sustained drug release of Van-loaded Gel/n-HA microspheres
Topical delivery systems tend to exhibit suboptimal release characteristics that produce antibiotic concentrations that are thousand times higher than those required to inhibit bacterial growth.55 Synthetic conditions and crosslinking of Gel microspheres considerably affect drug release from M by impacting the particle size and drug distribution The sizes of Gel microspheres formed via chemical crosslinking using the water-in-oil emulsion method can be adjusted from 10 to 400 μm by tuning the preparation conditions, such as the viscosity of the Gel solution, type and concentration of organic solvent and surfactant and oil, and the stirring speed.56,57 The conditions applied here synthesized Gel microspheres in the size range of 8.7–51.8 μm (Fig. 3A). The smooth surface of M indicated a tight surface structure (Fig. 3B). In the composite formation stage, the COOH groups of Gel exist as COO− ions and electrostatically bind with the Ca2+ ions of n-HA,58 and this process produced a slight shift of P (Fig. 3C). The water-soluble zero-length crosslinker, EDC, promoted the formation of amide bonds between the carboxyl and amino groups (–NH2) of Gel and but was not incorporated into the crosslinked structure (Fig. 3E), which is preferable for crosslinking Gel microsphere carriers.59 After EDC crosslinking, changes in the amide bonds of M occurred because of the enhanced interaction of the amide functional groups in the Gel (Fig. 3C). The formation of small porous structures (Fig. 3B) on the surface of M resulted from the dispersion of n-HA in M or phase separation due to the exchange of water solvent and acetone (nonsolvent) during the polymer solution precipitation process.60 The strategy of incorporating antimicrobials into biomaterials was achieved via physisorption in this study by immersing the substrate in the antimicrobial-containing solution. The infrared spectrum of VM (Fig. 3C) revealed that Van did not react with Gel and n-HA. n-HA particles exhibit greater solubility, higher surface energy, and stronger adsorption.61 By adding positively charged Van, n-HA, which can bind with neutral, positively charged, and negatively charged molecules, adsorbed more Van and formed more pores (Fig. 3B) in the inner structure. These interior pores facilitate water uptake from the media, providing diffusion channels for drugs.The release kinetics of Van at pH 6.0 and 7.4 were analyzed by fitting the cumulative release data (solid line) to an exponential equation (dashed line) as shown in Fig. 11A. The fitted equations of Van release before 60% were Mt/M∞ = 0.1218 × (t − 0.5) 0.5646 + 0.0692 (r2 = 0.9774) (pH 6.0) (Fig. 11A1) and Mt/M∞ = 0.0894 × (t − 0.5) 0.5395 + 0.0915 (r2 = 0.9669) (pH 7.4) (Fig. 11A2). As both release exponents were between 0.43 and 0.85, their release mechanism was the superposition of Fickian diffusion and Case-II transport.62 The simple adsorption of Van on the surface of microspheres created a relatively fast burst release at pH 6.0 and 7.4 that occurred via diffusion.63 The presence of bacteria lowers the environmental pH value (pH < 6.5) due to the release of lactic or acetic acid. The isoelectric point (pI) of Van is ∼8.30, and the compound is positively charged in an acidic solution.64 The repulsive forces between the positive charges of Van and high protonation in acidic solution could limit the release rate of Van at pH 6.0; thus, the release rate at pH 7.4 was higher in the first 30 min. The swelling property is essential for microspheres in tissue engineering, and most microspheres, especially those with a large amount of amino groups (such as Gel), will swell in an aqueous solution, resulting in Gel expansion.65 Here, microspheres swelled rapidly in aqueous solution within 15 min (Fig. 6B). The crosslinking of Gel with EDC can form a large number of amide bond-crosslinking networks (Fig. 11B-II). However, amide bonds are sensitive to H+ in the acidic phosphate-buffered saline (Fig. 11B-IV). The breaking of amide bonds under acidic conditions facilitates the penetration of water molecules into the Gel network structure, yielding both a shortened swelling equilibrium time and an enhanced equilibrium swelling ratio.66 With the increase in the volume of absorbed water, the mobility of Gel macromolecules and the free volume available for diffusion increase, which further facilitates buffer penetration and high drug release.67 At low pH, Van exhibited a higher release rate from VM than normal, which will benefit the delivery system for treating infections associated with localized acidity.
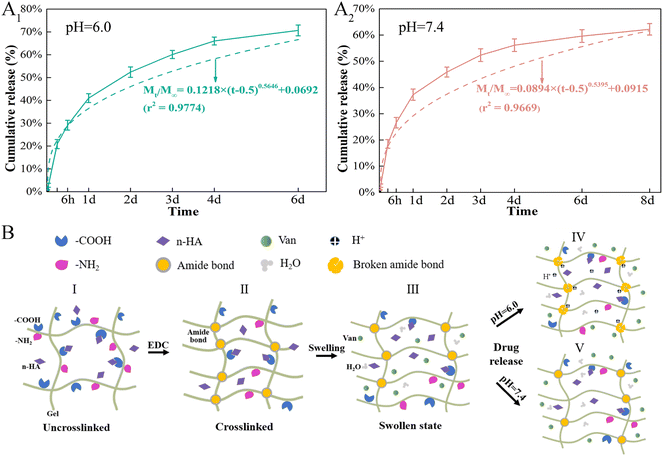 | ||
| Fig. 11 Van release mechanism from Van-loaded microspheres (VM). (A) Release kinetics of Van from VM in different pH environments, (B) Schematic diagram of pH-responsive release behavior of VM. | ||
4.2 Targeted antibacterial effect of Van-loaded Gel/n-HA microspheres
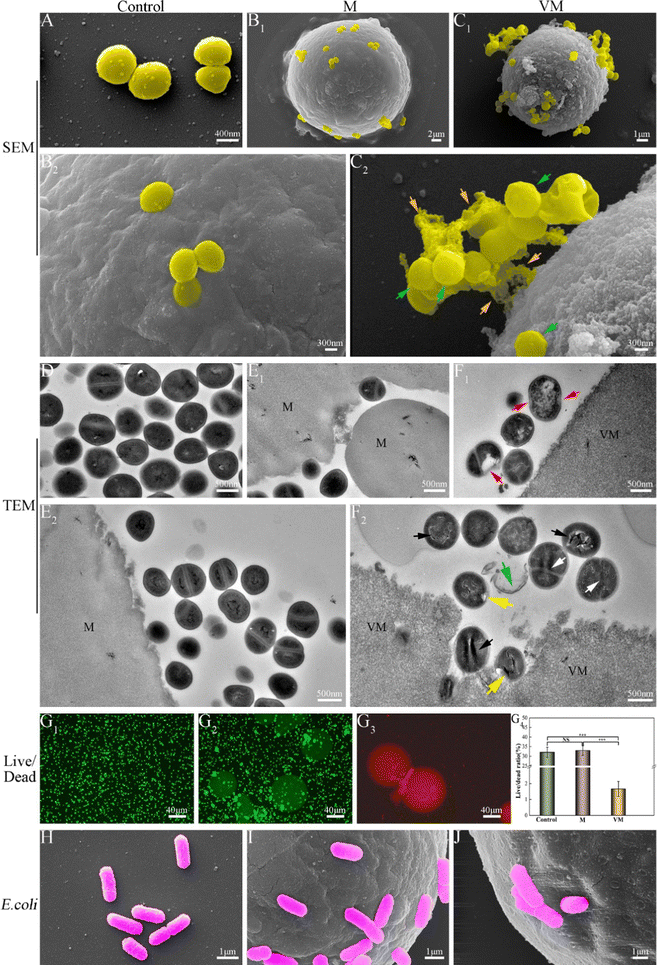
As elaborated in Section 3.4.2, the as-prepared Van-loaded Gel/n-HA microspheres (VM) exhibit continuous drug release and effective antibacterial activity against S. aureus (Gram-positive). Following VM treatment, the cell membranes of some S. aureus were disrupted, causing cytoplasm leakage (Fig. 7C). Ultrastructural analysis revealed that the internal structure of bacteria treated with VM had altered (Fig. 7F1 and F2). Live/dead staining difference in Fig. 7G further confirmed that these bacteria had died. Gram-positive bacteria, which have peptidoglycan precursors on the surface of their cytoplasmic membrane (Fig. 12A), and Van, which can form an intricate network of hydrogen bonds with the D-Ala–D-Ala region of lipid II in S. aureus, will interfere with the maturation process of the peptidoglycan layer.68,69 This will further weaken the cell wall of the bacteria, and render the cells susceptible to lysis due to alterations in osmotic pressure.70 Gram-negative bacteria, such as E. coli, are protected by the outer lipopolysaccharide membrane that is impermeable to large biomolecules, such as Van, and hydrophobic compounds from the environment (Fig. 12B).71 Therefore, Van released from VM cannot form an intricate network of hydrogen bonds with the D-Ala–D-Ala region to kill E. coli (Fig. 12B), as confirmed by SEM images (Fig. 7), indicating the inefficiency of VMs against E. coli. In the rabbit traumatic infection model, the pure Van group exhibited rapid killing of bacteria at the infected site in a short time, but the infection may return after 1–3 days. The sustained and targeted drug release from inside the VM particle after absorbing water demonstrates the sustained antibacterial activity of VM.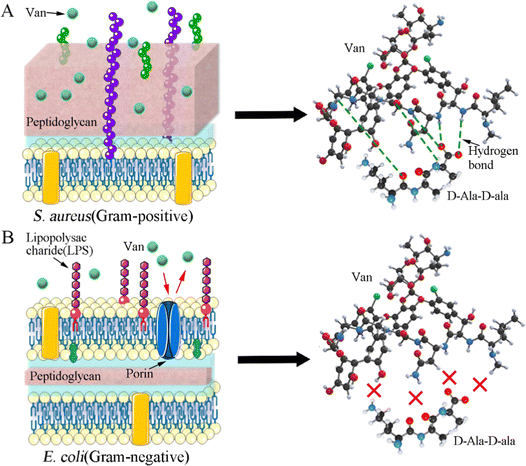 | ||
| Fig. 12 Antibacterial mechanism of Van against two bacteria. (A) Staphylococcus aureus; (B) Escherichia coli. | ||
4.3 Cell recruitment and osteoblast activity of Gel/n-HA microspheres
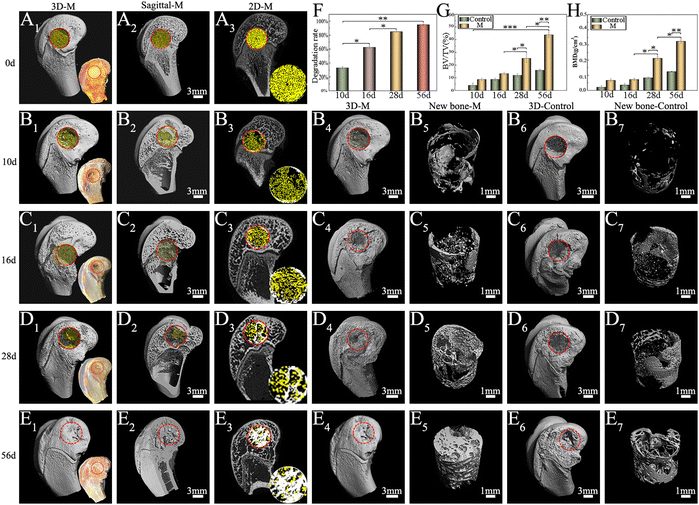
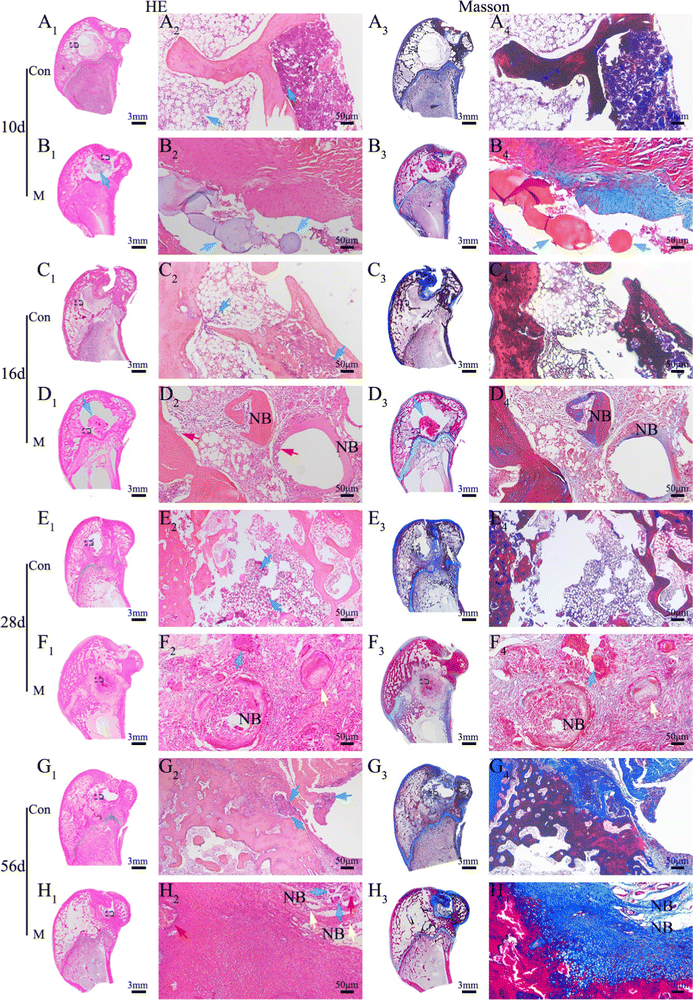
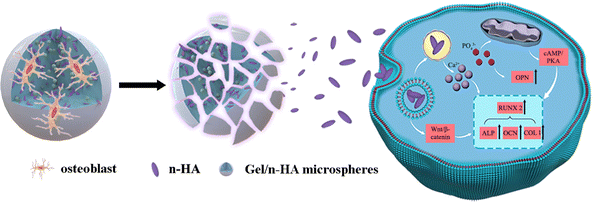
The survival of anchorage-dependent cells, such as MG63 and BMSCs, initially depends on the successful ligation between cell surface receptors and specific protein domains on substrates. As a denatured collagen product, Gel contains bioactive sequences that can be recognized and integrated by integrins, such as RGD peptides.72 As expected, SEM (Fig. 4A) and CLSM (Fig. 4C) showed the rapid recruitment and attachment of MG63 cells on the surface of M. Unlike other chemical crosslinked Gel microspheres, the cell-friendliness of the EDC crosslinker avoids the potential cytotoxicity of conventional chemical crosslinkers, such as glutaraldehyde,73 and thus supports cell survival and growth better (as shown by live/dead staining, Fig. 4B). This triggers the focal adhesion and cytoskeletal organization of successfully recruited cells, which in turn induces cell spreading and regulates numerous other cellular behaviors, such as proliferation and differentiation.74 Granules normally gain intracellular access via one of three pathways: pinocytosis, receptor-mediated pinocytotic process, and “swallowing.” Owing to the higher phase activity of n-HA, it was easy to enter cells via “swallowing”.44 TEM images (Fig. 4D) showed a close interaction of n-HA released from M with cells, followed by an internalization process via endocytosis pathways. n-HA can promote osteogenesis via the WNT/β-catenin pathway, favoring the induction of osteogenic transcription factor expression75 (Fig. 13). Treatment with M caused a significant increase in the mRNA expression of the osteoblastic markers ALP, OCN, OPN, and COLI (Fig. 4E). In summary, the significant increase in the mRNA expression of these osteogenesis-related genes suggests enhanced ossification of BMSCs cocultured in M. The random accumulation of M can maintain a 3D configuration that can fill a void (Micro-CT results; Fig. 5) and guide the migration and growth of tissues.76 The pore channels built between M were reported to play a critical role in accelerating bone recovery.77 Here, M can provide important physical support within the empty bone space, which can prevent secondary fracture and modulate and accelerate osteoinduction, and by this means the formation and thickening of new bone tissue were facilitated. By the 8th week, the microspheres of the treatment groups were nearly all degraded, even though a large amount of mature bone was growing from the Gel residue. Osteogenesis tended to occur at the microsphere locations in addition to the periphery of the defective areas. The degraded, uneven microspheres were directly integrated with the bone trabeculae (Fig. 6), indicating that microspheres were retained at the target site and ossified with their hierarchical micro/nanostructures, thereby demonstrating excellent osteoinduction and osseointegration abilities.784.4 Treatment of rabbit osteomyelitis
An ideal local delivery system should provide a sustained release of antibiotics against S. aureus (10–20-fold above the minimum inhibitory concentration) during osteomyelitis treatment.70 Here, the Van concentration was maintained at ∼50 μg mL−1 14 days after VM release in vitro (Fig. 8A) (where the Van MIC for S. aureus was >2 μg mL−1).79 A rabbit model of osteomyelitis was utilized to assess the targeted antibacterial, inflammation modulatory, osteoblast recruitment, and bone regenerative properties of VM in vivo. The surgical debridement of osteomyelitis leaves a large void, which is caused by the removal of sequestra and resection of the scarred and infected bone and soft tissue. The void needs to be filled to prevent recurrence and bone instability after significant bone loss. Herein, with the recurrence of osteomyelitis by S. aureus strains (Fig. 2A1–A5), debridement alone cannot effectively remove bacteria and guide bone tissue regeneration (Fig. 10A and C). The micrometer size and carrying capability of M empowered them to deliver drugs to infected sites with sustained release, which makes them a promising drug delivery system. The as-prepared Gel microspheres exhibited a good injectability (Fig. 3D) and could be injected into the bone defect through a minimally invasive surgery to fill irregular bone defects for subsequent cell adhesion, proliferation, and osteogenesis.80 According to the osteomyelitis in vivo model, it was confirmed that the VM group is more effective in eliminating the existing infection than unloaded M (Fig. 10K). The sustained Ca2+ and P release induced by the degradation of M which can stimulate both cell proliferation and aggregation18 is important for producing a critical cell mass required to initiate bone tissue formation. The large number of osteoblasts revealed in the H&E staining (Fig. 10K and L) assay confirmed the cell recruitment effect of M. Hence, the assembled system promotes osteogenic factor secretion and osteogenic gene expression, thereby accelerating new bone formation.5. Conclusions
In this study, an effective drug release system and experimental model based on injectable Gel/n-HA composite microspheres (M) for treating severe osteomyelitis caused by S. aureus was designed and fabricated. Specifically, Van was loaded in the M (VM) to ensure the sustained release of the drug from VM for an extended period to support bone tissue regeneration without inflammation. In vitro and in vivo experiments indicated that the VM could specifically target S. aureus and demonstrated its efficient localized antibacterial activities in a rabbit back muscle model. In summary, our injectable VM exhibited a successful treatment outcome via targeted antibacterial, inflammation modulatory, osteoblast recruitment, and bone regenerative properties to treat osteomyelitis. In the future, our research will focus on infection and anti-infection, and examine the angiogenesis mechanism of VM in a controlled delivery system for osteomyelitis treatment.Author contributions
Rui Zhang: conceptualization, methodology, investigation, writing—original draft, and writing—review and editing. Li Chen: resources investigation and project administration. Yijing Stehle: resources investigation and project administration. Mingyue Lin: investigation and methodology. Chenxin Wang: investigation and methodology. Yufan Li: investigation and methodology. Min Huang: resources investigation and project administration. Yubao Li: conceptualization, methodology, writing—review and editing, and funding acquisition. Qin Zou: conceptualization, methodology, writing—review and editing, and funding acquisition.Conflicts of interest
The authors declare that they have no known competing financial interests or personal relationships that could have appeared to influence the work reported in this paper.Acknowledgements
We would like to thank Guiping Yuan, Shanling Wang, and Yi He at the Analytical &Testing Center of Sichuan University for their help with TEM and SEM analysis. This work was supported by the China NSFC project [no. 32171338], Innovation and Reform Project of Postgraduate Education of Sichuan University in 2021, Experimental Technology Research Project of Sichuan University [no. SCU221099] and Analysis and Test Technology Innovation Project of Analytical & Testing Center.References
- J. M. Sadowska and K. J. Genoud, et al. , Mater. Today, 2021, 46, 136–154 CrossRef CAS.
- Y. Yang and M. Li, et al. , Bioact. Mater., 2023, 25, 594–614 CrossRef CAS PubMed.
- N. Kavanagh and E. J. Ryan, et al. , Clin. Microbiol. Rev., 2018, 31(2), e00084–17 CrossRef CAS.
- X. Qu and H. Yang, et al. , Bioact. Mater., 2021, 6, 4607–4624 CrossRef CAS.
- D. P. Lew and F. A. Waldvogel, Lancet, 2004, 364, 369–379 CrossRef CAS PubMed.
- D. K. Mills and U. Jammalamadaka, et al. , Bioact. Mater., 2018, 3, 157–166 CrossRef.
- S. Ghosh and S. Mukherjee, et al. , Biomacromolecules, 2022, 23, 592–608 CrossRef CAS PubMed.
- Y. Gao and Q. Ma, Smart Med., 2022, 1(1), e20220012 Search PubMed.
- H. A. Durr and N. D. Leipzig, Mater. Adv., 2023, 4, 1249–1257 RSC.
- P. F. Wei and Z. Y. Yuan, et al. , Biomater. Sci., 2018, 7, 272–286 RSC.
- F. Tian and B. Chi, et al. , Biomater. Sci., 2020, 8, 6212–6224 RSC.
- X. Zhao and L. Wang, et al. , Biomater. Sci., 2020, 8, 1702–1710 RSC.
- L. Cai and D. Xu, et al. , Eng. Regen, 2021, 2, 109–115 Search PubMed.
- T. Wu and L. Liu, et al. , Biomater. Sci., 2023, 11, 2877–2885 RSC.
- A. Maihemuti and H. Zhang, et al. , Bioact. Mater., 2023, 26, 77–87 CrossRef CAS PubMed.
- O. Song and X. Luo, Mater. Adv., 2022, 3, 8323–8331 RSC.
- L. Liu and W. Jia, et al. , Int. J. Biol. Macromol., 2022, 206, 277–287 CrossRef CAS.
- R. Zhang and M. Lin, et al. , Int. J. Polym. Mater., 2022, 1–12 CrossRef.
- F. Tao and S. Ma, et al. , Carbohydr. Polym., 2021, 251, 117063 CrossRef CAS.
- V. Yarlagadda and P. Sarkar, et al. , Angew. Chem., Int. Ed., 2016, 55, 7836–7840 CrossRef CAS PubMed.
- S. Zhang and G. Chen, et al. , Mater. Sci. Eng., C, 2022, 135, 112681 Search PubMed.
- J. Chen and Y. Zhang, et al. , Colloids Surf., B, 2015, 135, 581–587 CrossRef CAS.
- C. A. Custodio and R. L. Reis, et al. , Adv. Healthcare Mater., 2014, 3, 797–810 CrossRef CAS.
- Y. Yu and R. X. Wu, et al. , J. Mater. Chem. B, 2016, 4, 569–584 RSC.
- H. Ke and H. Yang, et al. , Adv. Sci., 2023, 10(3), e2204528 CrossRef PubMed.
- Z. Mu and K. Chen, et al. , Adv. Healthcare Mater., 2020, 9, e1901469 CrossRef PubMed.
- B. Cai and Q. Zou, et al. , RSC Adv., 2016, 6, 85735–85744 RSC.
- M. A. Vandelli and F. Rivasi, et al. , Int. J. Pharmaceut., 2001, 215, 175–184 CrossRef CAS PubMed.
- Q. Zou and J. Li, et al. , Int. J. Biol. Macromol., 2015, 79, 736–747 CrossRef CAS PubMed.
- J. Liu and Q. Zou, et al. , Mater. Design, 2021, 210, 110047 CrossRef CAS.
- X. Li and Q. Zou, et al. , Small, 2019, 15, e1901617 CrossRef PubMed.
- J. Baek and H. Lee, et al. , ACS Biomater. Sci. Eng., 2018, 4, 846–856 CrossRef CAS PubMed.
- Y. Qiao and J. He, et al. , ACS Nano, 2020, 14, 3299–3315 CrossRef CAS PubMed.
- A. S. Ram and K. Matuszewska, et al. , Front. Vet. Sci., 2021, 8, 758295 CrossRef PubMed.
- A. Dinache and M. Boni, et al. , Colloids Surf., A, 2015, 480, 328–335 CrossRef CAS.
- Q. Zhang and Y. Du, et al. , Carbohydr. Polym., 2022, 277, 118880 CrossRef CAS PubMed.
- S. Cao and L. Li, et al. , Colloids Surf., B, 2021, 207, 112013 CrossRef CAS PubMed.
- B. Jia and Z. Zhang, et al. , Biomaterials, 2022, 287, 121663 CrossRef CAS PubMed.
- L. A. Poultsides and L. K. Papatheodorou, et al. , J. Orthop. Res., 2008, 26, 1355–1362 CrossRef PubMed.
- C. W. Norden and R. L. Myerowitz, et al. , Int. J. Exp. Pathol., 1980, 61, 451–460 CAS.
- X. Zhang and W. Jia, et al. , Biomaterials, 2010, 31, 5865–5874 CrossRef CAS PubMed.
- Y. Sun and Q. Zhou, et al. , Small, 2022, 18(36), 2201656 CrossRef CAS PubMed.
- M. Lei and X. Qu, et al. , Adv. Funct. Mater., 2019, 29(18), 1900065 CrossRef.
- Y. Li and Y. Wang, et al. , ACS Biomater. Sci. Eng., 2020, 6, 320–328 CrossRef CAS.
- T. Liu and N. Dan, et al. , RSC Adv., 2015, 5, 34511–34516 RSC.
- X. Yu and Q. Pan, et al. , RSC Adv., 2018, 8, 37424–37432 RSC.
- H. Wang and S. C. Leeuwenburgh, et al. , Tissue Eng., Part B, 2012, 18, 24–39 CrossRef CAS PubMed.
- D. D. Pei and J. L. Sun, et al. , Adv. Sci., 2018, 5, 1800873 CrossRef PubMed.
- B. Jia and H. Yang, et al. , Bioact. Mater., 2021, 6, 1588–1604 CrossRef CAS PubMed.
- X. Qi and Y. Huang, et al. , Adv. Sci., 2022, 9, e2106015 CrossRef PubMed.
- Z. Ming and L. Han, et al. , Adv. Sci., 2021, 8, e2102545 CrossRef PubMed.
- J. Min and K. Y. Choi, et al. , ACS Nano, 2016, 10, 4441–4450 CrossRef CAS.
- B. Liu and J. Li, et al. , Mater. Sci. Eng., C, 2020, 112, 110905 CrossRef CAS PubMed.
- M. Diba and B. Pape, et al. , Acta Biomater., 2017, 58, 67–79 CrossRef CAS.
- S. Sankaran and J. Becker, et al. , Small, 2019, 15, e1804717 CrossRef.
- M. Nouri-Felekori and M. Khakbiz, et al. , Int. J. Pharm., 2019, 557, 208–220 CrossRef CAS PubMed.
- D. Zhang and W. Li, et al. , Eng. Regen, 2022, 3, 258–261 Search PubMed.
- F. Wang and Y. Wen, et al. , Mater. Sci. Eng., C, 2016, 69, 268–275 CrossRef CAS PubMed.
- A. Bigi and G. Cojazzi, et al. , Biomaterials, 2001, 22, 763–768 CrossRef CAS PubMed.
- X. Liu and Y. Won, et al. , Biomaterials, 2006, 27, 3980–3987 CrossRef CAS PubMed.
- X. Dong and Y. Sun, et al. , Small, 2021, 17, e2007672 CrossRef PubMed.
- P. L. Ritger and N. A. Peppas, J. Controlled Release, 1987, 5, 23–36 CrossRef CAS.
- N. Kamaly and B. Yameen, et al. , Chem. Rev., 2016, 116, 2602–2663 CrossRef CAS PubMed.
- N. Hassani Besheli and F. Mottaghitalab, et al. , ACS Appl. Mater. Interfaces, 2017, 9, 5128–5138 CrossRef CAS PubMed.
- G. Li and S. Liu, et al. , Nat. Commun., 2023, 14, 3159 CrossRef CAS PubMed.
- J. Chen and J. S. Caserto, et al. , Bioact. Mater., 2022, 14, 52–60 CrossRef CAS PubMed.
- Y. Xue and L. Xu, et al. , J. Controlled Release, 2023, 357, 196–209 CrossRef CAS PubMed.
- J. Zhu and W. Chen, et al. , Mater. Adv., 2022, 3, 7687–7708 RSC.
- Z. Wu and Z. Zhong, et al. , Mater. Adv., 2022, 3, 4295–4309 RSC.
- B. Cao and F. Xiao, et al. , Small, 2018, 14, e1802008 CrossRef PubMed.
- S. Xiao and L. Yuan, et al. , Surf. Coat Tech., 2023, 463, 129525 CrossRef CAS.
- J. W. Nichol and S. T. Koshy, et al. , Biomaterials, 2010, 31, 5536–5544 CrossRef CAS PubMed.
- J. Sun and D. Wei, et al. , Biomaterials, 2014, 35, 4759–4768 CrossRef CAS PubMed.
- J. Jiang and A. Liu, et al. , Colloids Surf., B, 2020, 188, 110798 CrossRef CAS PubMed.
- D. Cheng and R. Ding, et al. , ACS Appl. Mater. Interfaces, 2023, 15, 19951–19965 CrossRef CAS PubMed.
- D. Wei and R. Qiao, et al. , Small, 2018, 14, e1800063 CrossRef PubMed.
- A. K. Kudva and A. D. Dikina, et al. , Acta Biomater., 2019, 90, 287–299 CrossRef CAS PubMed.
- L. Wu and Y. Xu, et al. , Chem. Eng. J., 2022, 439, 135692 CrossRef CAS.
- S. J. van Hal and T. P. Lodise, et al. , Clin. Infect. Dis., 2012, 54, 755–771 CrossRef CAS PubMed.
- P. Du and A. D. S. Da Costa, et al. , Mater. Sci. Eng., C, 2020, 113, 110961 CrossRef CAS PubMed.
| This journal is © The Royal Society of Chemistry 2023 |

