 Open Access Article
Creative Commons Attribution 3.0 Unported Licence
Rapid single step atmospheric pressure plasma jet deposition of a SERS active surface†
Oliver S. J.
Hagger
 a,
M. Emre
Sener‡
a,
Imran
Khan
b,
Francis Lockwood
Estrin
a,
Stefanos
Agrotis
a,
Albertus D.
Handoko
a,
M. Emre
Sener‡
a,
Imran
Khan
b,
Francis Lockwood
Estrin
a,
Stefanos
Agrotis
a,
Albertus D.
Handoko
 c,
Ivan P.
Parkin
 a and
Daren J.
Caruana
 *a
*a
aDepartment of Chemistry, Christopher Ingold Laboratories, 20 Gordon St., WC1H 0AJ, London, UK. E-mail: d.j.caruana@ucl.ac.uk
bDefence Science and Technology Laboratory (Dstl), Porton Down, Salisbury, Wiltshire SP4 0JQ, UK
cInstitute of Materials Research and Engineering (IMRE), Agency for Science, Technology and Research (A*STAR), 2 Fusionopolis Way, Innovis #08-03, Singapore 138634, Republic of Singapore, Singapore
First published on 10th July 2023
Abstract
A helium gas atmospheric pressure plasma jet (APPJ) is used to prepare a silver-based SERS substrate. The Raman enhancement from substrates created using APPJ compares well with two commercially available silver-based SERS substrates and an in-house prepared physical deposition of pre-synthesised silver nanoparticles. An aqueous solution of rudimentary silver salt was required as an ink to deposit zero valent silver in a single step with no post processing. An array of 16 × 16 silver ‘islands’ are printed on borosilicate glass, each island taking 5 seconds to print with a power of < 14 W to sustain the plasma. The SERS response was assessed using 4-mercaptobenzoic acid and rhodamine 6G as model analytes, with a calculated detection limit of 1 × 10⁻⁶ M. Also demonstrated is the removal of analyte from the surface after Raman measurement by exposure to helium APPJ doped with oxygen followed by hydrogen to restore zero baseline. This regeneration takes less than 10 seconds and allows for replicate measurements using the same SERS substrate.
Introduction
Surface-enhanced Raman spectroscopy (SERS) is a highly sensitive detection technique with the capability of nanomolar or lower limit of detection for some analytes.1–3 The enhancement of the Raman signal is due to localised surface plasmon resonance (LSPR) for substrates such as silver and gold, resulting in orders of magnitude greater signal.4 The key parameter is control of the surface nanostructure to optimise this remarkable enhancement, providing non-destructive detection without the need for chemical labelling. The bottleneck for wide applicability of SERS as a valuable analytical tool is twofold; (1) rapid fabrication with the required nanostructure and (2) the difficulty to recover a baseline before exposure or re-exposure to the target matrix. Here we describe an atmospheric plasma jet method for rapid single-step synthesis of SERS active silver on glass and demonstrate the potential of plasma to remove the adsorbed analyte to recover a baseline.Substrates for SERS may be fabricated using various methods to enhance the Raman signal of molecules adsorbed on their surfaces. One popular method for creating SERS substrates is the deposition of pre-synthesised metal nanoparticles onto a solid support, such as glass or tissue paper.5–7 These substrates are quick to prepare, although require a synthetic step to produce the nanoparticles. Electrodeposition of silver or gold has been shown to create substrates for SERS on conducting substrates.8,9 Of course, there are many other methods using sophisticated materials design to provide a very precise structured surface to optimise the enhancement of the Raman spectra. These may involve complex multistep synthesis but provide robust and reproducible Raman spectra.
To optimise SERS substrates for analysis, several factors play a crucial role. First, the choice of metal nanoparticle material is important. Silver nanoparticles tend to exhibit more substantial plasmonic effects and higher SERS enhancement and sensitivity compared to gold nanoparticles.10 However, gold nanoparticles offer better stability and reproducibility in some cases.11 The size and shape of the nanoparticles also significantly impact SERS performance. Nanoparticles with sharp corners and rough surfaces, such as star-shaped nanoparticles, have been found to enhance electromagnetic fields, resulting in stronger SERS signals.12 Additionally, controlling the interparticle spacing allows the formation of hot spots, which are regions of maximum electromagnetic field enhancement between nanoparticles. This can be achieved by adjusting the deposition process or using spacer molecules.13 Finally, optimising the excitation laser wavelength to match the plasmonic resonance of the nanoparticles further enhances the SERS signal, as it maximises the interaction between the laser light and the nanoparticles' surface plasmons.14 By carefully considering these factors, researchers can tailor SERS substrates to achieve maximum signal enhancement and sensitivity for precise molecular analysis.
The method described in this study employs an atmospheric pressure plasma jet (APPJ) for rapid single-step deposition of nanostructured silver materials with SERS. Non thermal plasmas under reduced pressure offer a unique redox chemistry, in part due to the highly energised electrons and are essential for the processing of many materials and chemical transformations.15,16 Plasma jets at atmospheric pressure are more accessible and have been used for surface material modification,17 medical applications,18 etching,19 and deposition.20 Relevant to this work, plasma metal deposition has been demonstrated using a variety of precursors as a very efficient and attractive method due to the low power requirement and rapidity.21,22 Hong et al. demonstrated APPJ deposited gold nanoparticles on paper substrates and demonstrated their applicability as SERS substrates.23 In this study, we deposit nanoscale silver particles with high adherence in a single step requiring no post processing. The advantage of this synthetic method is twofold; firstly rapidity, it takes two to five seconds to deposit a surface which has enhanced Raman response, and secondly only rudimentary silver salts in aqueous solution as precursors is required. The method requires low power (<14 W) and a low stream of helium to sustain the plasma and provide a suitably reducing atmosphere to deposit zero-valent silver particles. Furthermore, earlier studies have shown that the plasma jet can also be used to provide a pristine surface for analyte adsorption for SERS analysis. Ratcliffe et al.24 showed that atmospheric pressure plasma jets are effective to desorb analytes from a surface for subsequent analysis by mass spectrometry, a technique they called plasma-assisted desorption/ionisation (PADI). More recently, Shvalya et al. showed that a SERS surface based on Au/Pd/Cu2O may be cleaned in a plasma chamber in under a minute.25 We demonstrate that exposure to an APPJ may be used to refresh the surface to restore the baseline and regenerate the surface after measurement. We discuss the use and potential utility for an analytical device based on SERS measurement.
Experimental
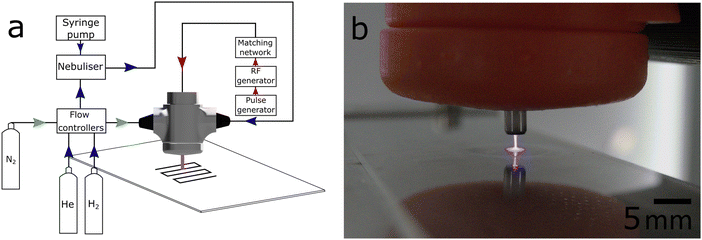
The APPJ deposited silver SERS substrates on unmodified borosilicate glass was done as follows. A solution of 1 × 10⁻⁴ M silver nitrate (99.9%, Thermo Scientific, UK) in deionised water (18 MΩ, ELGA) was injected using a syringe pump (Harvard Apparatus, UK) at a rate of 167 mL min−1 into a nebuliser. The nebuliser (Teledyne CETAC Technologies) atomised the solution and carried through the nebuliser through a drying and cooling chamber operating at 120 °C and 2 °C, respectively. The gas stream containing the dry silver nitrate was then combined with helium (99.9+%, BOC) 0.3 L min−1 plasma gas and fed into an in-house designed and built plasma jet assembly. Brooks mass flow controllers controlled all flow rates.The plasma was ignited at a stainless-steel needle electrode tip positioned in a 440 μM I.D. ceramic nozzle. The electrode was driven by a 14 W radio frequency generator operating at 13.56 MHz. The driving signal was pulse width moderated at 18 kHz, with a 50% duty cycle and passed through a matching network consisting of a variable inductor to equate the 50 Ω output impedance of the RF generator. The schematic of the plasma and gas system is shown in Fig. 1(a). The plasma exited the ceramic nozzle to form a stable plume extending 8–10 mm beyond the tip orifice. A nitrogen sheath gas, 1.5 L min−1, surrounded the plume to reduce air entrainment and aid plasma stability. The plasma jet chamber, shown in Fig. 1(b), was mounted on a three-axis motion stage for accurate spatial positioning. The deposition pattern was a consecutive spot arrangement forming a 2D array, each spot was formed by holding the nozzle 2 mm above the glass substrate for a residence time of five seconds before moving 0.75 mm to the next spot at a rate of 0.75 mm s−1. No further treatment was performed on the silver metal deposits, referred to as plasma deposited silver (PDS) SERS surface.
Pre-synthesised spherical silver particles were deposited by impaction using the plasma jet assembly as described above, with the RF supply disconnected. Undiluted solution of the as synthesised silver particles, based on the Turkevich7 method, was introduced into the CETAC nebuliser at a flow rate of 167 mL min−1. Using 0.3 L min−1 of helium through the jet assembly the particles were physically impacted on the surface for a residence time of four seconds to form silver islands. This facilitated the deposition of silver particles in a reproducible pattern on borosilicate glass slides and will be referred to as pre-synthesised nanoparticles (PSNP).
The commercially available silver SERS substrates were purchased from Ocean Insight (OI) (UK) and SERSitive (SS) (S-Silver SERS Substrates, hydrophobic, Poland). The analytes, 4-mercaptobenzoic acid (4MBA) and rhodamine 6G (R6G) (Thermo Scientific, UK), were dissolved in methanol (HPLC grade, Super Gradient, Chem-Lab NV) to the required concentration. A 9 mL aliquot of the methanol solution was spread on the substrate, and the methanol was allowed to evaporate for at least 1 min. The SERS analysis was performed at the centre of the solution footprint after evaporation.
All Raman spectra were recorded with a Renishaw inVia confocal Raman microscope with an argon-ion laser excitation source (514.5 nm copper ion laser). The spectra were recorded at ambient temperature between 100 cm−1 to 3200 cm−1 Raman shift. All Raman measurements in this report used 10% of the overall laser power, measured to be 0.32 mW, using a Si sensor with an energy meter console (PM120VA and PM100D, respectively, Thor Labs). All Raman spectra were baseline corrected in R (Version 4.1.2 run in R Studio, https://www.rstudio.com) using the ‘baseline’ package to minimise background fluorescence.26 In replicating Raman spectra, a minimum of three spectra for each substrate were recorded, and the average and standard deviation for the selected peak was calculated and reported.
For surface analysis, high-resolution scanning electron microscopy was used. Images were obtained with a JSM 6701 and 7600 field emission SEM (JEOL, Japan) at an accelerating voltage of 10 kV. Non-conducting samples were coated with gold to aid charge dissipation during imaging. Particle size analysis from SEM images was carried out using ‘ImageJ’ software version 1.53 k to estimate the particle size distribution of all four SERS substrates.27 All optical microscopy of surfaces was carried out using a Keyence optical microscope (VHX-7000, Keyence Corporation, Japan) equipped with a Z20 (20–6000 ×) objective (Keyence Corporation, Japan).
Results and discussion
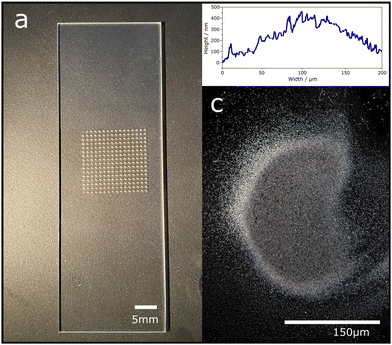
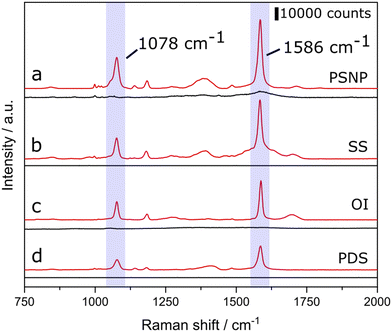
Silver deposits were ‘written’ precisely in a 2D regular pattern of plasma deposited silver (PDS) on borosilicate glass for Raman interrogation without any post treatment. The APPJ ceramic nozzle, 440 mm ID, prints silver islands of 125 ± 25 mm diameter with a height of approx. 370 nm, separated by 0.5 mm, as shown in Fig. 2(a)–(c). The residence time to print for each island was five seconds, followed by moving on to the next island in one second. A similar pattern was deposited with Turkevich synthesised silver particles using the nebuliser and nozzle assembly with no plasma. Both these arrays of silver based coatings were then interrogated using Raman spectroscopy. The adhesion of this PSD and PSNP method produced very adherent coatings compared to SS and OI, as assessed using the Scotch tape® test. See ESI† for details.The SERS response from both two in-house prepared substrates and the as received commercial substrates were compared. An aliquot of 4MBA dissolved in methanol was placed on all four surfaces using the same procedure. 4MBA was chosen since it has a known strong response from SERS due to the sulphur interaction with the silver metal. The Raman spectra for 4MBA as well as the background in the absence of an analyte (pure methanol) are shown in Fig. 3. All four substrates showed a SERS response for 4MBA, the most extensive SERS enhancement is seen from the Turkevich colloid preparation, followed by SERSitive then the OI sample, and finally our plasma deposition procedure. Table 1 shows the average peak height for 4MBA, the respective SERS enhancement factors at four silver substrates and calculated standard errors.
| SERS substrate | ||||
|---|---|---|---|---|
| PSNP | SERSitive | Ocean insight | PDS | |
| Intensity/a.u. | 53![[thin space (1/6-em)]](https://www.rsc.org/images/entities/char_2009.gif) 230 230 |
45![[thin space (1/6-em)]](https://www.rsc.org/images/entities/char_2009.gif) 542 542 |
30![[thin space (1/6-em)]](https://www.rsc.org/images/entities/char_2009.gif) 368 368 |
18![[thin space (1/6-em)]](https://www.rsc.org/images/entities/char_2009.gif) 541 541 |
| Standard error of intensity | 2500 | 5512 | 2185 | 863 |
| Enhancement factor (×106) | 11.6 | 9.9 | 6.6 | 4.0 |
The two most pronounced bands are 1078 and 1586 cm−1, assigned to ν8a and v12 aromatic ring vibrations, respectively. Both of these intense bands are red-shifted in comparison to their Raman peaks, frequency shifts can occur as a result of molecule-metal charge transfer interactions.28 The band (referred to as a shoulder) at 1710 cm−1, which appears very weakly in all spectra, indicated the presence of non-dissociated carboxylic acid groups (ν(C![[double bond, length as m-dash]](https://www.rsc.org/images/entities/char_e001.gif) O). Our solution of 4MBA is weakly alkaline, in acidic conditions of the solution, this shoulder disappears.
O). Our solution of 4MBA is weakly alkaline, in acidic conditions of the solution, this shoulder disappears.
As discussed above, SERS enhancement and relative peak intensity are shown through major bands, 1586 cm−1 for 4MBA. No bands correspond to vibrations of SH groups, which would be present at 915 and 2580 cm−1, corresponding to β(SH) and ν(SH), respectively. The non-appearance of these peaks confirms that all 4MBA molecules contributing to the SERS signal are covalently bonded to the Ag surface. The band present in the three spectra at 1183 cm−1 is assigned to C–H bending.29
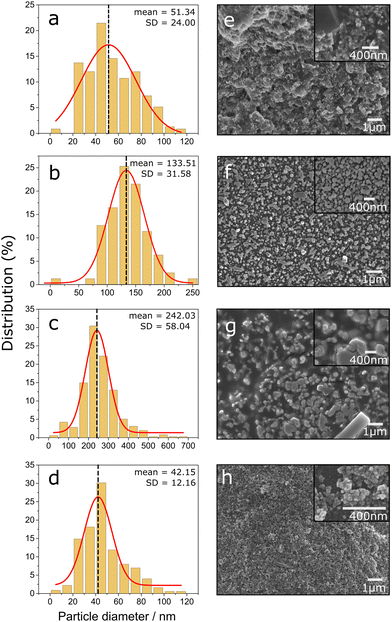
It is well established that the EM effect is dependent upon the microstructure of the substrate, thus, the surface morphology of the silver deposit is key for the enhancement in Raman signal.30 Scanning electron microscopy (SEM) showed the nanostructure of the surface of all four SERS active substrates used in this study, shown in Fig. 4. The SEM images in Fig. 4 show a spherical morphology for both PSNP and PDS substrates (Fig. 4(a) and (d)), whereas a more globular shape and larger particle diameter for the two commercial substrates (Fig. 4(f)). On average, through analysis of SEM images, PSNP and PDS particles are 42 ± 12 nm, and 51 ± 24 nm in size, respectively, whereas the commercial substrates OI and SS are 242 ± 58 nm and 133 ± 32 nm in size. It is assumed that these spherical microstructures ultimately affect the plasmon excitation and, therefore, SERS signal intensity due to rounded particles’ ability to pack closer together on a surface, decreasing the interparticle distance. It has been suggested that a larger, closer packed metallic nanostructure will result in better SERS enhancement.31 Our results are broadly consistent with these findings, however, the interparticle distance was not determined, and therefore cannot draw complete conclusions. Both the particle size and size distribution will contribute to the overall SERS signal intensity seen in Fig. 3.
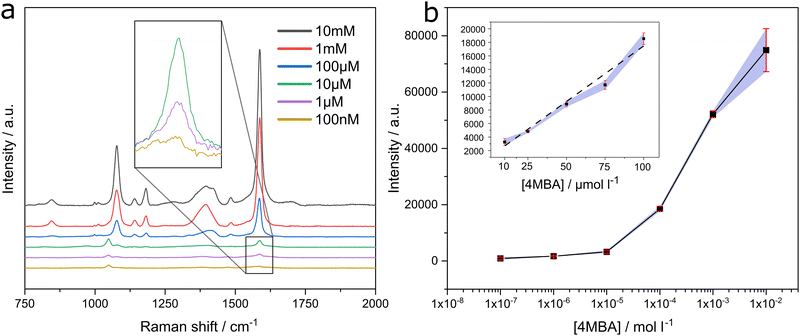
The 4MBA concentration dependence of the SERS response at the PSNP deposit was investigated using the 1586 cm−1 peak height as a function of concentration. A quantifiable signal was measured over a wide concentration range from 1 × 10⁻⁷ M to 1 × 10⁻² M, as shown in Fig. 5. The response to the same concentration range for the other substrates can be found in the ESI† Fig. S2. The log plot of concentration in methanol solution used to deposit on the substrate versus peak height at 1586 cm−1 is shown in Fig. 5(b). A linear dependence is observed between 1 × 10⁻⁵ M and 1 × 10⁻⁴ M. The limit of detection was calculated based on three times the standard deviation of the lowest concentration detectible was 1 × 10⁻⁶ M, which equates to 154 ppb.
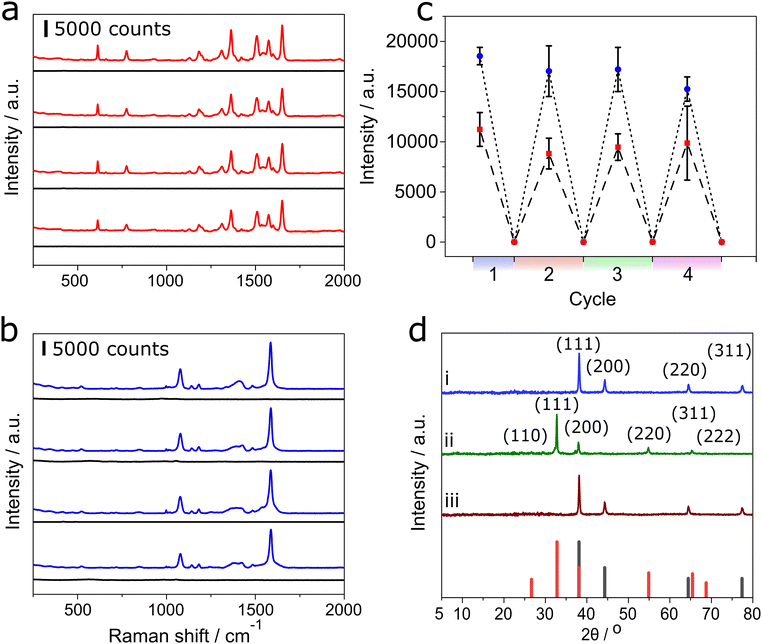
To exploit the high sensitivity of SERS based analysis of gas phase volatile molecules, it is useful to be able to recover a baseline ‘zero’ response. As the SERS response relies on the nature of strength of absorption (physi or chemisoption) on to the surface, to recover the baseline any analyte molecules need to be removed. Often this is circumvented by a one-off measurement on a disposable surface. However, it has been shown that plasma can desorb small molecules off the surface without damaging the surface.32 Using the same APPJ system described for the deposition of silver metal, using helium plasma doped with 4% oxygen followed by a separate treatment of helium doped with 4% hydrogen, was found effective to restore the zero baseline Raman response. After the cleaning steps, as shown in Fig. 6(a) and (b) for both 4MBA and R6G, respectively, and the recovery of zero baseline, Fig. 6(c), the surface was able to regenerate an enhanced Raman response. After successive cycles of application of analyte and then oxygen and hydrogen treatment, there is a slight drop in the SERS signal. Silver readily oxidises to form silver oxide after exposure to helium plasma doped with oxygen, as confirmed using XRD Fig. 6(d) and XPS in ESI† Fig. S3. This plasma oxidation causes a change in the microstructure of the particles, ultimately sintering together with successive oxidation cycles. After four cycles, there is a slight deterioration of approximately 17.8% and 12.1% for 4MBA and R6G, respectively.
Conclusions
In this study, the utility of APPJ is demonstrated for the preparation of a silver-based SERS substrate and for the regeneration of zero baseline for analytical applications. The Raman enhancement of APPJ substrates compares well with two commercially available silver based SERS substrates and an in house prepared pre-synthesised silver nanoparticle by physical deposition. Plasma prepared substrates show significant gains with respect to the economical use of materials and the rapidity for the synthesis of the substrates. Using rudimentary silver salt in an aqueous solution feeding into a plasma jet chamber where the reduction to zero valent metal and physical impaction on a surface. There are no chemical synthetic steps for the preparation of the metal ink as described in Dey et al.33 The only consumables for the deposition process are silver nitrate, water, helium, and a small amount of hydrogen. Neglecting setting up time, an array of 16 × 16 silver islands on a 2D substrate takes 1536 seconds to prepare with an estimated cost of 46 pence for consumables only, see ESI† for cost comparison. The cost of depositing a single silver SERS island is 0.15 pence, excluding the cost of the glass slide.The ability to ‘write’ isolated islands of silver on a surface opens the possibility to carry out multi-analyte analysis on a single substrate, using PDS or PSNP deposition. The Raman laser footprint used for analysis is approximately 13 mm, therefore, a spot size of 150 mm is more than enough to carry out reliable averaged SERS at different points on a single spot. The majority of commercial substrates are ‘one-use’, but have a large surface area, which leaves a vast amount of surface unused, and now useless as to the single use nature of the substrate.
The regeneration of the zero baseline to enable replicate measurement on the same substrate opens the prospect of continuous plug flow type analysis of VOCs. The repeated exposure to oxygen followed by hydrogen doped helium plasma had the effect of removing any Raman signal of analyte on the surface, as demonstrated using model SERS analytes 4MBA and R6G. When reapplying the analyte, the SERS response was recovered. After four replicate measurements cycles, the SERS response showed a reduction, this reduction is expected to continue steadily before plateauing.
In summary, we showcase the use of the atmospheric pressure plasma jet method for synthesis and baseline recovery as an integral part of an analytical device. This approach presents the prospect of reusing the same SERS device for analysis may be a key advantage for some applications.
Author contributions
Conceptualisation: DJC & IK. Methodology: OSJH, MES, IK, FLE, SA, IPP, DJC. Investigation: OSJH, MES, IK, FLE, SA, IPP, DJC. Visualisation: OSJH, MES, IPP, DJC. Formal analysis: OSJH, DJC, MES. Project administration: OSJH. Supervision: IK, IPP, ADH, DJC. Writing – original draft: OSJH, DJC. Writing – review & editing: IPP, ADH.Conflicts of interest
There are no conflicts to declare.Acknowledgements
OSJH wishes to than EPSRC and Dstl for an ICASE. We thank Andy Stewart for assistance with the Keyence microscope and Dr Rebecca Ingle for the Laser energy meter. This work was also supported by EPSRC project EP/T024836/1.Notes and references
- S. Yang, et al., Ultrasensitive surface-enhanced Raman scattering detection in common fluids, Proc. Natl. Acad. Sci. U. S. A., 2016, 113(2), 268–273, DOI:10.1073/pnas.1518980113.
- P. A. Mosier-Boss, Review of SERS Substrates for Chemical Sensing, Nanomaterials, 2017, 7(6), 142, DOI:10.3390/nano7060142.
- B. Sharma, et al., SERS: Materials, applications, and the future, Mater. Today, 2012, 15(1–2), 16–25, DOI:10.1016/S1369-7021(12)70017-2.
- S. Y. Ding, et al., Nanostructure-based plasmon-enhanced Raman spectroscopy for surface analysis of materials, Nat. Rev. Mater., 2016, 1, 6, DOI:10.1038/natrevmats.2016.21.
- N. Leopold and B. Lendl, J. Phys. Chem. B, 2003, 107, 5723–5727, DOI:10.1021/jp027460u.
- L. Mikac, et al., Preparation and characterisation of SERS substrates: From colloids to solid substrates, 2015 38th International Convention on Information and Communication Technology, Electronics and Microelectronics (MIPRO), 2015, 9–11.
- J. Turkevich, et al. , Discuss. Faraday Soc., 1951, 11, 55–75, 10.1039/DF9511100055.
- R. Wang, et al., Electrodeposition of Ag nanodendrites SERS substrates for detection of malachite green, Microchem. J., 2019, 150, 104127, DOI:10.1016/j.microc.2019.104127.
- R. D. Rivera-Rangel, et al., Electrodeposition of plasmonic bimetallic Ag-Cu nanodendrites and their application as surface-enhanced Raman spectroscopy (SERS) substrates, Nanotechnology, 2020, 31(46), 465605, DOI:10.1088/1361-6528/abacf5.
- M. Rycenga, et al. , Chem. Rev., 2011, 111(6), 3669–3712, DOI:10.1021/cr100275d.
- Y. Yin, et al., Synthesis and Characterisation of Stable Aqueous Dispersions of Silver Nanoparticles through the Tollens Process, J. Mater. Chem., 2002, 12(3), 522–527, 10.1039/B107469E.
- C. H. Lai, et al., Near infrared surface-enhanced Raman scattering based on star-shaped gold/silver nanoparticles and hyperbolic metamaterial, Sci. Rep., 2017, 7, 5446, DOI:10.1038/s41598-017-05939-0.
- X. Zhang, et al., Ultrasensitive SERS Substrate Integrated with Uniform Subnanometer Scale “Hot Spots” Created by a Graphene Spacer for the Detection of Mercury Ions, Small, 2017, 13(9), 1603347, DOI:10.1002/smll.201603347.
- Z. Starowicz, et al., The tuning of plasmon resonance of the metal nanoparticles in terms of the SERS effect, Colloid Polym. Sci., 2018, 296, 1029–1037, DOI:10.1007/s00396-018-4308-9.
- A. Bogaerts, et al., Plasma based CO2 and CH4 conversion: A modeling perspective, Plasma Processes Polym., 2017, 14, 1600070, DOI:10.1002/ppap.201600070.
- A. Bogaerts, E. C. Neyts and A. Rousseau, Special issue on fundamentals of plasma-surface interactions, J. Phys. D: Appl. Phys., 2014, 47, 220301, DOI:10.1088/0022-3727/47/22/220301.
- S. Bornholdt, M. Wolter and H. Kersten, Characterisation of an atmospheric pressure plasma jet for surface modification and thin film deposition, Eur. Phys. J. D, 2010, 60(3), 653–660, DOI:10.1140/epjd/e2010-00245-x.
- J. De Backer, et al., The effect of reactive oxygen and nitrogen species on the structure of cytoglobin: A potential tumor suppressor, Redox Biol., 2018, 19, 1–10, DOI:10.1016/j.redox.2018.07.019.
- I. M. Eichentopf, G. Bohm and T. Arnold, Etching mechanisms during plasma jet machining of silicon carbide, Surf. Coat. Technol., 2011, 205, S430–S434, DOI:10.1016/j.surfcoat.2011.03.003.
- L. M. Wallenhorst, et al., Topographic, optical and chemical properties of zinc particle coatings deposited by means of atmospheric pressure plasma, Appl. Surf. Sci., 2017, 410, 485–493, DOI:10.1016/j.apsusc.2017.03.021.
- R. P. Gandhiraman, et al., Plasma jet printing for flexible substrates, Appl. Phys. Lett., 2016, 108(12), 123103, DOI:10.1063/1.4943792.
- D. H. Gutierrez, et al., Plasma jet printing of metallic patterns in zero gravity, Flexible Printed Electron., 2022, 7, 2, DOI:10.1088/2058-8585/ac73cb.
- R. Alder, et al., Application of Plasma-Printed Paper-Based SERS Substrate for Cocaine Detection, Sensors, 2021, 21(3), 13, DOI:10.3390/s21030810.
- L. V. Ratcliffe, et al., Surface analysis under ambient conditions using plasma-assisted desorption/ionisation mass spectrometry, Anal. Chem., 2007, 79(16), 6094–6101, DOI:10.1021/ac070109q.
- V. Shvalya, et al., Reusable Au/Pd-coated chestnut-like copper oxide SERS substrates with ultra-fast self-recovery, Appl. Surf. Sci., 2020, 517, 11, DOI:10.1016/j.apsusc.2020.146205.
- K. H. Liland, T. Almoy and B. H. Mevik, Optimal Choice of Baseline Correction for Multivariate Calibration of Spectra, Appl. Spectrosc., 2010, 64(9), 1007–1016, DOI:10.1366/000370210792434350.
- C. A. Schneider, W. S. Rasband and K. W. Eliceiri, NIH Image to ImageJ: 25 years of image analysis, Nat. Methods, 2012, 9(7), 671–675, DOI:10.1038/nmeth.2089.
- A. Capocefalo, et al., Exploring the Potentiality of a SERS-Active pH Nano-Biosensor, Front. Chem., 2019, 7, 11, DOI:10.3389/fchem.2019.00413.
- A. Michota and J. Bukowska, Surface-enhanced Raman scattering (SERS) of 4-mercaptobenzoic acid on silver and gold substrates, J. Raman Spectrosc., 2003, 34(1), 21–25, DOI:10.1002/jrs.928.
- K. G. Stamplecoskie, et al., Optimal Size of Silver Nanoparticles for Surface-Enhanced Raman Spectroscopy, J. Phys. Chem. C, 2011, 115(5), 1403–1409, DOI:10.1021/jp106666t.
- P. Pal, et al., A generalised exponential relationship between the surface-enhanced Raman scattering (SERS) efficiency of gold/silver nanoisland arrangements and their non-dimensional interparticle distance/particle diameter ratio, Sens. Actuators, A, 2020, 314, 10, DOI:10.1016/j.sna.2020.112225.
- A. Bowfield, et al., Surface analysis using a new plasma assisted desorption/ionisation source for mass spectrometry in ambient air, Rev. Sci. Instrum., 2012, 83(6), 7, DOI:10.1063/1.4729120.
- A. Dey, et al., Plasma jet based in situ reduction of copper oxide in direct write printing, J. Vac. Sci. Technol., B: Nanotechnol. Microelectron.: Mater., Process., Meas., Phenom., 2019, 37(3), 6, DOI:10.1116/1.5087255.
Footnotes |
| † Electronic supplementary information (ESI) available. See DOI: https://doi.org/10.1039/d3ma00249g |
| ‡ Current address: Setaş Color Center, Tekirdağ/Turkey. |
| This journal is © The Royal Society of Chemistry 2023 |

