 Open Access Article
In situ fabrication and design of a novel electrochemical sensor based on the Ag3.84Sn3S8@rGO nanocomposite for competitive ultra-detection of metronidazole in human urine†
Jit
Satra
 a,
Papri
Mondal
 a,
Gopala Ram
Bhadu
 b and
Bibhutosh
Adhikary
 *a
*a
aDepartment of Chemistry, Indian Institute of Engineering Science and Technology, Shibpur, Howrah 711103, West Bengal, India. E-mail: bibutoshadhikary@gmail.com
bDepartment of Analytical and Environmental Science Division and Centralized Instrument Facility, Gijubhai Badheka Marg, Bhavnagar 364021, Gujarat, India
First published on 24th April 2023
Abstract
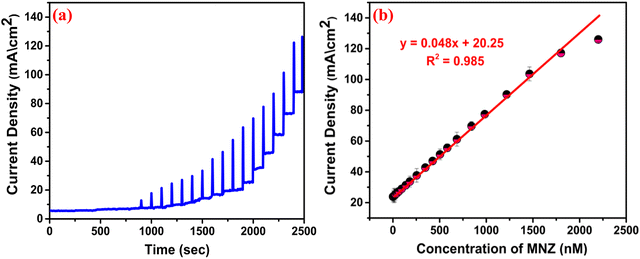
It is indispensable to develop an efficient technology for reducing contaminants in wastewater. Thus, we have developed a novel nanocomposite catalyst via the in situ formation of non-stoichiometric Ag3.84Sn3S8 on reduced graphene oxide (rGO) sheets. Significantly, we varied the concentration of rGO between 0.05 to 0.5% to get the optimal concentration (0.25%). To examine the application of the nanocomposite as a potential catalyst, we performed visible-light-induced mineralization of the antibiotic drug metronidazole (MNZ) and found the optimized efficiency. Based on this prospect, we have designed an electrochemical sensor for the ultra-detection of MNZ. The proposed sensor shows an excellent linear range (0.01–1500 nM), outstanding sensitivity (48 μA nM−1 cm−2), a significant limit of detection (LOD) (4 pM), excellent anti-interference ability (also in real samples) and good reproducibility.
1. Introduction
Nanostructured metal sulfides have garnered significant attention as promising electro- and photocatalysts due to their eco-friendliness and exceptional physicochemical properties.1 In this context, group 11 sulfides (Cu, Ag, and Au) are unique due to their ability to form many polymorphs owing to the very common +1 state. These sulfides are proven by crystallographic methods to be electrochemically stable in nature.2 One of the interesting examples is Ag2S, which can exist as three polymorphs (α, β and γ-Ag2S) within a very close temperature interval.3 Among them, the cubic γ−Ag2S is metal-rich and non-stoichiometric, and this type of material has several advantages: (i) it shows significantly large electronic conductivity of nearly 1.3 × 10³ Ω−1 cm−1; (ii) it can prevent phase transformation during the intercalation of foreign metal ions owing to the crystallographic structural stability imparted by the presence of only M–S bonds and no S–S bond;4 (iii) it helps the formation of multi-metallic sulfides, which can provide more redox reaction sites, and offers notable stability in acids, as well as alkaline media;5 (iv) due to its non-stoichiometric nature, S vacancies are created, which might ease the adsorption of molecules on its catalytic surface and accelerate the desired catalysis.6In this regard, recently, Hu et al. have discovered that S vacancies can be easily created by a non-stoichiometric synthetic approach and play a crucial role in the adsorption of N2 onto the catalytic active sites of Zn0.1Sn0.1Cd0.8S for the photofixation process.6 The study involved the calcination of the Zn0.1Sn0.1Cd0.8S nanocrystal in a saturated O2 atmosphere to obtain Zn0.1Sn0.1Cd0.8SO.6 This kind of approach has not been considered for Ag-based non-stoichiometric ternary metal sulfides yet.
Further, this type of nanocrystal can be grown on any material with an sp2 carbon backbone like graphene derivatives, such as graphene oxide (GO) and reduced graphene oxide (rGO), due to their various advantages: (i) the backbone gives thermal and chemical stability and supports the nanocrystal to grow on its surface; (ii) they can improve the catalytically active surface area, resulting in enhanced adsorption capacity, and (iii) accelerate electron mobility, easing the catalytic process. In this context, with less oxygenated functional groups, rGO shows physicochemical properties closer to the pristine graphene and hence shows superior catalytic advantages.7–11
A solvothermal process is crucial to this kind of nanocomposites because it (i) favors successful interaction between the precursors, (ii) facilitates in situ fabrication (iii) gives a spectrum of geometries via the modulation of size, shape and overall morphology.12–14
In recent years, the research community has shown interest in developing newly engineered semiconductor multi-component catalysts that can detect multiple organic pollutants. Among the chemicals found in pharmaceutical waste, metronidazole (MNZ) has gained enormous importance as it is extensively used in the medical field.15 Long exposure to this drug causes very dangerous mutagenic diseases in living things, resulting in cancer.16 It is important to note that, being a non-biodegradable entity, MNZ is hardly adsorbed on the soil molecules, and this is the reason its specific detection and removal are challenging concerns.17–21
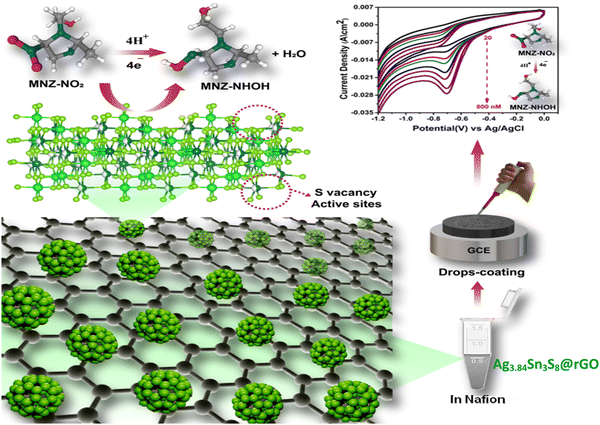
Here, we have aimed to: (1) achieve the targeted synthesis of non-stoichiometric Ag3.84Sn3S8 onto reduced graphene oxide (rGO) to prepare a nanocomposite (NC) via a facile solvothermal route, wherein the reduction of GO and the growth of the nanocrystal would be taken place in situ, (2) explore the importance of the desired S vacancies in catalysis, (3) test and optimize rGO by extensive photophysical, photochemical and electrochemical characterizations for enhanced catalytic activity. Finally, we have explored the efficiency of the NC as an excellent electrocatalytic sensor for the ultra-detection of the antibiotic drug MNZ. To the best of our knowledge, to date, no study has been performed on the activation and mineralization of a nitrogenous antibiotic drug on a non-stoichiometric nanocatalyst.
2. Experimental section
2.1. The general technique to prepare a non-stoichiometric metal sulfide nanocrystal
In this context, the characteristics of metals and the initial metallic molar ratio have a significant role. For example, to get the composition of M1x+δ Mx2 S, M1 must be comparatively harder point than M2 and the molar ratio (M1/M2) must be taken >1.222.2. Preparation of the nanocatalyst
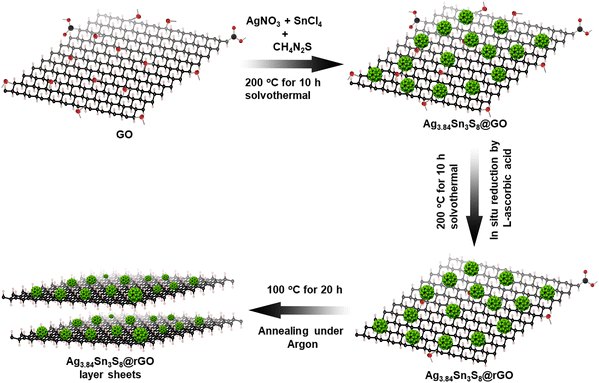
The chemicals and materials used are mentioned in the ESI.† A 100 mL suspension of GO (prepared by the Hummers’ method)23 in ethanol was taken in a 250 mL beaker at a concentration of 0.5 mg mL−1. To this suspension, AgNO3, SnCl4·2H2O and CH4N2S were added in a molar ratio of 7![[thin space (1/6-em)]](https://www.rsc.org/images/entities/char_2009.gif) :
:![[thin space (1/6-em)]](https://www.rsc.org/images/entities/char_2009.gif) 5
5![[thin space (1/6-em)]](https://www.rsc.org/images/entities/char_2009.gif) :
:![[thin space (1/6-em)]](https://www.rsc.org/images/entities/char_2009.gif) 10 and stirred for 1 hour at room temperature (rt) for homogenization and then transferred into a 250 mL autoclave for solvothermal decomposition at 200 °C for 10 h. Thereafter, the mixture was cooled down to rt, and 5 mmol L-ascorbic acid was added. For uniformity, the mixture was vigorously stirred for 1 h. Then, again the autoclave was sealed and kept at 200 °C for an additional 5 h. The greyish-black precipitate was separated by the addition of EtOH and washed with EtOH/DI H2O (1
10 and stirred for 1 hour at room temperature (rt) for homogenization and then transferred into a 250 mL autoclave for solvothermal decomposition at 200 °C for 10 h. Thereafter, the mixture was cooled down to rt, and 5 mmol L-ascorbic acid was added. For uniformity, the mixture was vigorously stirred for 1 h. Then, again the autoclave was sealed and kept at 200 °C for an additional 5 h. The greyish-black precipitate was separated by the addition of EtOH and washed with EtOH/DI H2O (1![[thin space (1/6-em)]](https://www.rsc.org/images/entities/char_2009.gif) :
:![[thin space (1/6-em)]](https://www.rsc.org/images/entities/char_2009.gif) 1) 5 times by centrifugation. Then, the material was dried under a vacuum in a furnace at 10 °C for 20 h. The as-synthesized material is assigned as Ag3.84Sn3S8@rGO0.5. A similar process was employed to prepare three more nanocomposites (rGO0.25, rGO0.1, and rGO0.05) by varying the GO concentration between 0.5–0.05 mg mL−1. Bare Ag3.84Sn3S8 was obtained under similar conditions. To probe the presence of S vacancies, the nanocrystal was subjected to calcination at 300 °C for 3 h in a saturated O2 atmosphere, as discussed in ‘Electronic spectral analysis (3.2.6)’. The details of the physical experiments, photocatalytic measurements and electrode fabrication are elaborated in ESI.†
1) 5 times by centrifugation. Then, the material was dried under a vacuum in a furnace at 10 °C for 20 h. The as-synthesized material is assigned as Ag3.84Sn3S8@rGO0.5. A similar process was employed to prepare three more nanocomposites (rGO0.25, rGO0.1, and rGO0.05) by varying the GO concentration between 0.5–0.05 mg mL−1. Bare Ag3.84Sn3S8 was obtained under similar conditions. To probe the presence of S vacancies, the nanocrystal was subjected to calcination at 300 °C for 3 h in a saturated O2 atmosphere, as discussed in ‘Electronic spectral analysis (3.2.6)’. The details of the physical experiments, photocatalytic measurements and electrode fabrication are elaborated in ESI.†
3. Results and discussion
3.1. The non-stoichiometric synthetic approach
Here, we used an Ag/Sn molar ratio of 1.4 to prepare Ag3.84Sn3S8.24,25 Additionally, to fabricate with rGO, a similar in situ synthesis approach was employed, and here, we used CH4N2S to allow the slow dissociation of S for uniformity (Scheme 1).263.2. Characterization
![[double bond, length as m-dash]](https://www.rsc.org/images/entities/char_e001.gif) O group of COOH, which resides at the edge of the GO sheets. A peak appeared at 1620 cm−1 due to the O–H bending and ring vibrations of the epoxide groups. Further, the peak at 1282 cm−1 supported the existence of C–O–C. The characteristic peak at 1055 cm−1 was due to C–O (epoxy/alkoxy).1 The intensities of the characteristic peaks were substantially reduced due to the reduction of GO to rGO, and the oxygenated functional groups readily vanished, supporting the formation of the Ag3.84Sn3S8@rGO NC. This result indicates interfacial binding between Ag3.84Sn3S8 and rGO.27
O group of COOH, which resides at the edge of the GO sheets. A peak appeared at 1620 cm−1 due to the O–H bending and ring vibrations of the epoxide groups. Further, the peak at 1282 cm−1 supported the existence of C–O–C. The characteristic peak at 1055 cm−1 was due to C–O (epoxy/alkoxy).1 The intensities of the characteristic peaks were substantially reduced due to the reduction of GO to rGO, and the oxygenated functional groups readily vanished, supporting the formation of the Ag3.84Sn3S8@rGO NC. This result indicates interfacial binding between Ag3.84Sn3S8 and rGO.27
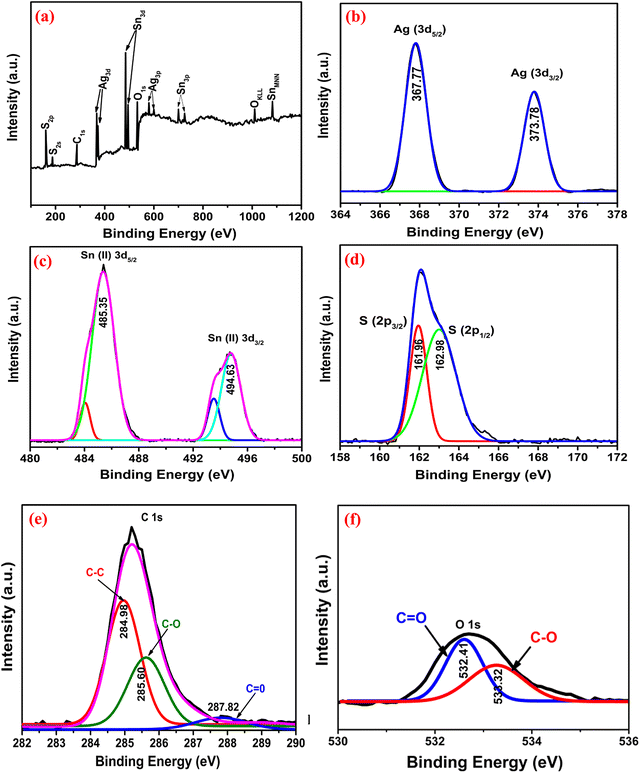
![[double bond, length as m-dash]](https://www.rsc.org/images/entities/char_e001.gif) O (287.82 eV) of rGO. The reduction of GO was further confirmed by the higher peak intensity of C–C than those of C–O and C
O (287.82 eV) of rGO. The reduction of GO was further confirmed by the higher peak intensity of C–C than those of C–O and C![[double bond, length as m-dash]](https://www.rsc.org/images/entities/char_e001.gif) O.18 In Fig. 3(f), the peaks at 532.41 and 533.32 eV are present due to O−2 and O−1, respectively.32
O.18 In Fig. 3(f), the peaks at 532.41 and 533.32 eV are present due to O−2 and O−1, respectively.32
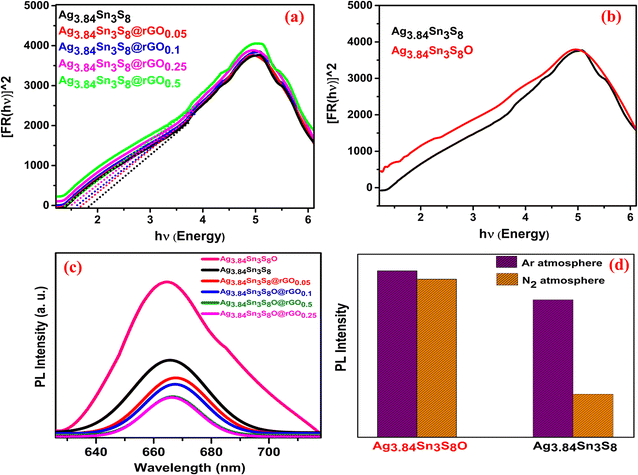
| Materials | E g (eV) |
|---|---|
| Ag3.84Sn3S8 | 1.850 |
| Ag3.84Sn3S8@rGO0.05 | 1.681 |
| Ag3.84Sn3S8@rGO0.1 | 1.565 |
| Ag3.84Sn3S8@rGO0.25 | 1.460 |
| Ag3.84Sn3S8@rGO0.5 | 1.334 |
| Ag3.84Sn3S8O | 0.72 |
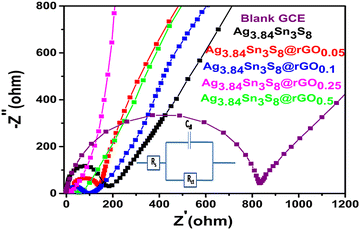
| Materials | R s (Ohm) | R ct (Ohm) | C dl (μF cm−2) |
|---|---|---|---|
| Bare GCE | 118.28 | 752.25 | 217.95 |
| Ag3.84Sn3S8 | 115.01 | 165.60 | 51.60 |
| Ag3.84Sn3S8@rGO0.05 | 110.04 | 132.30 | 36.21 |
| Ag3.84Sn3S8@rGO0.1 | 109.25 | 91.68 | 21.58 |
| Ag3.84Sn3S8@rGO0.25 | 106.96 | 18.20 | 5.43 |
| Ag3.84Sn3S8@rGO0.5 | 107.54 | 56.71 | 14.12 |
3.3. The electrocatalytic detection of MNZ
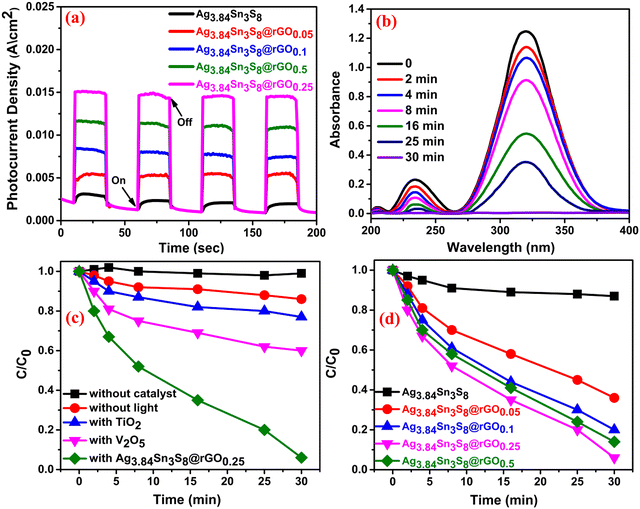
| ln(C0/C) = kt | (1) |
The effect of catalyst dosage on the performance was studied by varying the concentration from 5–80 mg mL−1 [Fig. S8(b), ESI†]. It was found that beyond the concentration of 20 mg mL−1, the activity was readily reduced. This might be due to several reasons: (1) a decrease in interfacial area between the catalyst and the solution, (2) the light may be scattered by the aggregated catalyst beyond this concentration and (3) the number of active sites might sufficiently reduce beyond the optimized rGO concentration.
| [Fe(CN)6]−4 → [Fe(CN)6]−3 + e (oxidation) | (2) |
| [Fe(CN)6]−3 + e → [Fe(CN)6]−4 (reduction) | (3) |
| Ip = 2.69 × 10⁵n3/2AD1/2Cγ½ | (4) |
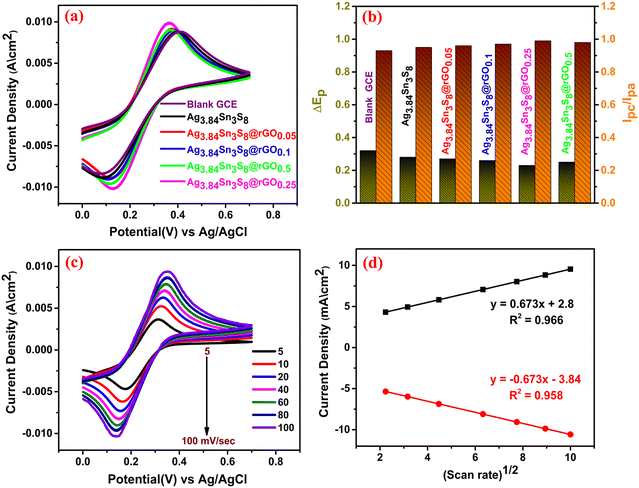 | ||
| Fig. 7 (a) The CV curves, (b) ΔEp and (Ipc/Ipa) of the blank and fabricated GCEs; (c) CV of Ag3.84Sn3S8@rGO0.25 with scan rate variation; (d) the current density vs. (scan rate)1/2 plot. | ||
| Materials | ECSA (cm2) |
|---|---|
| Ag3.84Sn3S8 | 0.0200 |
| Ag3.84Sn3S8@rGO0.05 | 0.0218 |
| Ag3.84Sn3S8@rGO0.1 | 0.224 |
| Ag3.84Sn3S8@rGO0.25 | 0.0241 |
| Ag3.84Sn3S8@rGO0.5 | 0.0229 |
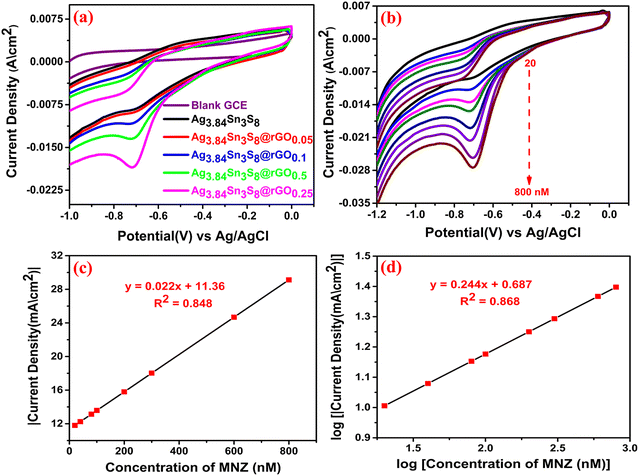
The effect of the concentration of MNZ on the proposed sensor was further deeply analyzed in the concentration range of 20 to 800 nM in an N2-saturated electrolyte (to ensure an inert atmosphere within the cell) while keeping the reaction conditions the same [Fig. 8(b)]. The results suggested that the increasing quantities of MNZ were readily recognized by the proposed sensor. It is important to note that there was no oxidation peak in the reverse scan of CV, which confirmed the irreversible reduction of MNZ. The calibration plot of peak |current density| vs. concentration could be expressed by the linear regression equation: I (mA) = 0.022 (nM) + 11.36 with R2 = 0.848 [Fig. 8(c)]. Further, the logarithmic calibration plot (log of reduction peak current density vs. log of concentration) [Fig. 8(d)] also demonstrated a linear regression equation: I (log mA) = 0.244 (nM) + 0.687, R2 = 0.868. These results conveniently suggest that the sensing mechanism followed first-order kinetics.
| Slope = n(1 − α)F/2.3RT | (5) |
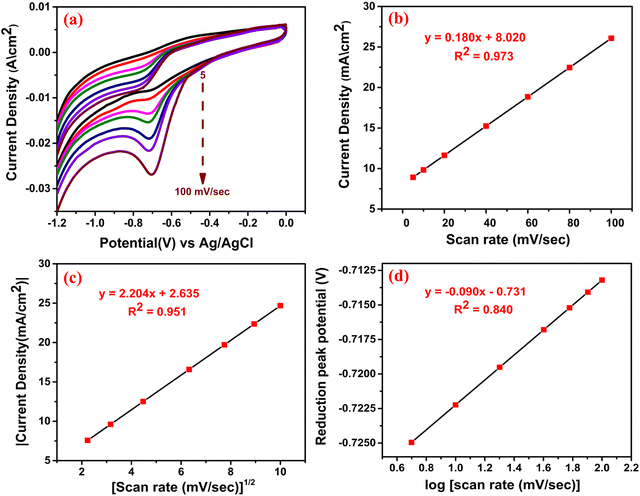 | ||
| Fig. 9 (a) CV at different scan rates; the calibration plots for (b) peak current density vs scan rate and (c) peak current density vs (scan rate)1/2 and (d) peak potential vs log of scan rate. | ||
 | ||
| Scheme 2 The mechanistic pathway of MNZ reduction on vacant active sites (S vacancies) on the catalyst surface. | ||
The corresponding terms in eqn (5) indicate standard parameters. ‘α’ was determined to be 0.99 by taking n = 4. The number of electrons (n) was calculated to be 3.89 based on eqn (6):52
| I = (2.99 × 10⁵)n[(1−α)n]1/2ACoDo1/2ν1/2 | (6) |
The corresponding terms in eqn (6) carry their usual meaning.
Further, the adsorption quantity of MNZ was estimated using eqn (7):
| I = n2F2AΓν/4RT | (7) |
The influence of pH on the sensing performance was examined in the 3.0 to 11.0 range [Fig. S9(a), ESI†]. This study revealed that the electrochemical reduction was linearly dependent on pH. The highest cathodic peak current density was obtained at pH 7, and the calibration plot [Fig. S9(b), ESI†] for reduction peak potential vs pH revealed that, with increasing pH, the potential shifted toward negative values, indicating the protonation–deprotonation characteristics of MNZ. The corresponding linear regression equation could be expressed as E = −0.047pH – 0.700, R2 = 0.959. It is interesting to note that the slope value of −0.047 was quite close to the theoretical approximation (0.059) obtained using the Nernst equation, further confirming the involvement of an equal number of e− and H+ in the reduction of MNZ.50,54 The probable reaction pathway involves the reduction of the nitro group to nitroso, which is subsequently reduced to hydroxyl amine (Scheme 3).55
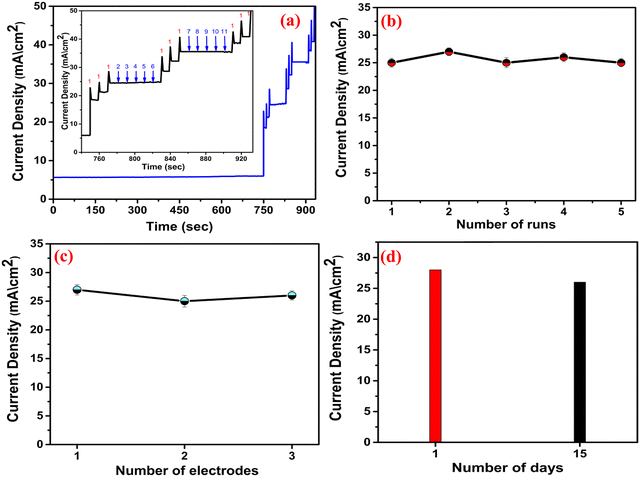
Anti-interference studies were performed to analyze the selectivity of the sensor toward MNZ base12d on chronoamperometric measurements in the presence of other co-interfering compounds individually in N2 saturated 0.05 (M) PBS (pH = 7.0). Here, we used the following co-interfering compounds: ornidazole (ODZ), ofloxacin (OXN), ciprofloxacin (CFX), tinidazole (TDE), imidazole (IZE), 5-nitroimidazole (5-NIZ), 4-nitrophenol (4-NP), 4-nitrobenzene (4-NB), Hg and uric acid (UA). The concentration of these compounds was kept 10 times higher than that of MNZ [Fig. 11(a)] to obtain a clear picture of selectivity. The obtained result conveniently confirms that the as-proposed sensor is perfectly suitable for the detection of MNZ in real samples.
To examine the repeatability, CV was performed in five different catalytic runs [Fig. 11(b)] keeping the same experimental parameters (the concentration of MNZ was 500 nM). The relative standard deviation (RSD) was estimated to be 2.1%, which is quite excellent in terms of repeatability.32 The reproducibility was further evaluated by CV [Fig. 11(c)] using three different electrodes, and the RSD was obtained as 1.6%, suggesting significant accuracy.55 The durability was examined by carrying out two CV runs [Fig. 11(d)], and 96% of the initial current density was retained even after two weeks, indicating excellent long-term stability. Overall, the stability experiments indicate excellent anti-interfering behavior, outstanding repeatability, acceptable reproducibility and very good durability of the proposed sensor. The comparative analysis of the sensing performance of different catalysts is presented in Table 4, and in terms of the linear electrochemical sensing range, LOD and sensitivity, the proposed sensor is excellent.
| Fabricated electrodes | Techniques | Linear range (μM) | LOD (μM) | Sensitivity (μA μM−1 cm−2) | Year | Ref. |
|---|---|---|---|---|---|---|
| DMIP | DPV | 0.04–200 | 0.0091 | — | 2016 | 56 |
| MWCNTs/CTS-Ni | DPV | 0.1–150 | 0.025 | 0.695 | 2017 | 57 |
| Cu(II)-CNP | SWV | 0.02–1.6 | 0.004 | 2017 | 58 | |
| GR-IL | DPV | 0.1–25 | 0.047 | 2017 | 59 | |
| Pt NS/PFFF | DPV | 2.5–500 | 0.05 | 2017 | 60 | |
| SDS-GR | DPSV | 0.08–200 | 0.0085 | 2018 | 61 | |
| Cu-poly(Cys) | LSV | 0.5–400 | 0.37 | 2018 | 62 | |
| ASPCE | DPV | 0.05–563, 753–2873 | 0.01 | 2018 | 63 | |
| SrMoSe2 | DPV | 0.05–914.12 | 0.001 | 1.13 | 2018 | 64 |
| PrV/SCN | Current-time | 0.001–2444.0 | 0.0008 | 1.386 | 2019 | 65 |
| CNF@Au NPs | DPV | 0.1–2000 | 0.024 | 2022 | 66 | |
| Ag3.84Sn3S8@rGO0.25 | Current-time | 0.01–1500 nM | 4 pM | 48 μA nM−1 cm−2 | 2023 | This work |
![[thin space (1/6-em)]](https://www.rsc.org/images/entities/char_2009.gif) :
:![[thin space (1/6-em)]](https://www.rsc.org/images/entities/char_2009.gif) 1), followed by centrifugation to filter out the undesired impurities. Then, to get the spiked sample solutions, a definite amount of MNZ was mixed with the urine, as well as water samples (in an N2-saturated cell). The standard addition method was employed to analyze the whole recovery process. In the electrochemical sensing experiments, the recoveries were observed in the range between 98.7 and 99.9%, indicating excellent selectivity and sensitivity for MNZ in real samples [Table S6, ESI†].
1), followed by centrifugation to filter out the undesired impurities. Then, to get the spiked sample solutions, a definite amount of MNZ was mixed with the urine, as well as water samples (in an N2-saturated cell). The standard addition method was employed to analyze the whole recovery process. In the electrochemical sensing experiments, the recoveries were observed in the range between 98.7 and 99.9%, indicating excellent selectivity and sensitivity for MNZ in real samples [Table S6, ESI†].
4. Conclusion
In summary, a very simple in situ solvothermal method has been developed to prepare a novel catalyst: Ag3.84Sn3S8@rGO, varying the concentration of rGO (0.05–0.5). The detailed analyses confirm the formation of the NC along with its potential as an efficient electrocatalyst and further, ensure the optimization of its catalytic efficiency (Ag3.84Sn3S8@rGO0.25). We found an outstanding response (sensitivity: 48 μA nM−1 cm−2 & LOD: 4 pM) of the optimal catalyst toward electrochemical MNZ sensing. The extended electrochemical studies reveal the enhanced electrocatalytic efficiency, excellent selectivity, significant stability and real sample applicability. These notable features of the proposed sensor might be due to the S vacancies in its crystal lattice sites, large surface area, excellent charge transfer capacity due to the presence of rGO, large carrier density and convenient bandgap energy. This study opens up a new in situ synthetic strategy to prepare an NC, which can serve as an excellent nanocatalyst, toward environmental sustainability.Conflicts of interest
There are no conflicts of interest to declare.Acknowledgements
Authors are thankful to Dr Divesh N. Srivastava, Principal Scientist, Analytical Division, Central Salt and Marine Chemicals Research Institute, Bhavnagar, India, for providing analytical facility. The author is indebted to UGC-RGNF (ID: RGNF-2015-17-SC-WES-690) for research funding. The authors are also grateful to the MHRD (India), the Department of Chemistry and Dr M. N. Dastur School of Materials Science and Engineering, IIEST, Shibpur for providing instrumental facilities.References
- R. He, X. Huang and L. Feng, Energy Fuels, 2022, 36(13), 6675–6694 CrossRef CAS.
- H. Park, J. Kwon, J. Kim, K. Park, T. Song and U. Paik, Cryst. Growth Des., 2020, 20(5), 3325–3333 CrossRef CAS.
- S. I. Sadovnikov and A. I. Gusev, J. Mater. Chem. A, 2017, 5, 17676 RSC.
- Y. Xie, G. Bertoni, A. Riedinger, A. Sathya, M. Prato, S. Marras, R. Y. Tu, T. Pellegrino and L. Manna, Chem. Mater., 2015, 27, 7531–7537 CrossRef CAS PubMed.
- H. Park, J. Kwon, H. Choi, D. Shin, T. Song and X. W. D. Lou, ACS Nano, 2018, 12, 2827–2837 CrossRef CAS PubMed.
- S. Hu, X. Chen, Q. Li, Y. Zhao and W. Mao, Catal. Sci. Technol., 2016, 6, 5884–5890 RSC.
- X. Li, Y. Wei, C. Ma, H. Jiang, M. Gao, S. Zhang, W. Liu, P. Huo, H. Wang and L. Wang, ACS Appl. Mater. Interfaces, 2021, 13, 11755–11764 CrossRef CAS PubMed.
- T. Iftikhar, Y. Xu, A. Aziz, G. Ashraf, G. Li, M. Asif, F. Xiao and H. Liu, ACS Appl. Mater. Interfaces, 2021, 13, 31462–31473 CrossRef CAS PubMed.
- S. Gupta and V. (Ravi) Subramanian, ACS Appl. Mater. Interfaces, 2014, 6(21), 18597–18608 CrossRef CAS PubMed.
- G. Xie, K. Zhang, B. Guo, Q. Liu, L. Fang and J. R. Gong, Adv. Mater., 2013, 25, 3820–3839 CrossRef CAS PubMed.
- M. N. Hossain, J. Wen and A. Chen, Sci. Rep., 2017, 7, 3184 CrossRef PubMed.
- Y. Gu, S. Sun, Y. Liu, M. Dong and Q. Yang, ACS Omega, 2019, 4(18), 17672–17683 CrossRef CAS PubMed.
- X. Bai, L. Li, H. Liu, L. Tan, T. Liu and X. Meng, ACS Appl. Mater. Interfaces, 2015, 7(2), 1308–1317 CrossRef CAS PubMed.
- D. A. Brewster, Y. Bian and K. E. Knowles, Chem. Mater., 2020, 32(5), 2004–2013 CrossRef CAS.
- P. Ganguly, S. Mathew, L. Clarizia, S. Kumar R, A. Akande, S. J. Hinder, A. Breen and S. C. Pillai, ACS Omega, 2020, 5, 406–421 CrossRef CAS PubMed.
- M. Baek, E. J. Kim, S. W. Hong, W. Kim and K. Yong, Photochem. Photobiol. Sci., 2017, 16, 1792–1800 CrossRef CAS PubMed.
- P. Ganguly, S. Mathew, L. Clarizia, S. Kumar R, A. Akande, S. Hinder, A. Breen and S. C. Pillai, Appl. Catal., B, 2019, 253, 401–418 CrossRef CAS.
- A. N. Anju, N. Sultana, S. M. A. Nayem, A. Awal, S. C. Roy, M. A. Aziz and A. J. S. Ahammad, J. Electron. Mater., 2022, 51, 2877–2888 CrossRef CAS.
- T. Yu, L. Glennon, O. Fenelon and C. B. Breslin, Talanta, 2023, 251, 123758 CrossRef CAS PubMed.
- R. Karim, P. Saha, R. Akter, R. Falguni, R. A. Shital, A. Awal, M. A. Mamun and Dr. A. J. S. Ahammad, ChemistrySelect, 2023, 8(9), e202204174 CrossRef CAS.
- M. Darbandi, M. F. Mohajer, M. Eynollahi and K. Asadpour-Zeynali, Chem. Phys., 2022, 560, 111590 CrossRef CAS.
- C. Balischewski, H.-S. Choi, K. Behrens, A. Beqiraj, T. Körzdörfer, A. Geßner, A. Wedel and A. Taubert, ChemistryOpen, 2021, 10, 272–295 CrossRef PubMed.
- B. Panigrahy and S. Srivastava, New J. Chem., 2016, 40, 3370–3384 RSC.
- E. Panha, H. Araki, Y. Akaki, M. Nakashima, T. Yamaguchi, S. Seto and S. Nakamura, 2 Thin-Film Compound Semiconductor PV., 2016.
- S. Nakamura, P. Eang, T. Yamaguchi, S. Seto, Y. Akaki, H. Katagiri and H. Araki, Phys. Status Solidi A, 2019, 216, 1800872 CrossRef.
- B. Yang, X. Zuo, P. Chen, L. Zhou, X. Yang, H. Zhang, G. Li, M. Wu, S. Jin and X. S. Chen, ACS Appl. Mater. Interfaces, 2015, 7, 137–143 CrossRef CAS PubMed.
- Z. Chen, S. Liu, M.-Q. Yang and Y.-J. Xu, ACS Appl. Mater. Interfaces, 2013, 5(10), 4309–4319 CrossRef CAS PubMed.
- B. Yang, X. Zuo, P. Chen, L. Zhou, X. Yang, H. Zhang, G. Li, M. Wu, S. Jin and X. S. Chen, ACS Appl. Mater. Interfaces, 2015, 7, 137–143 CrossRef CAS PubMed.
- A. Mondal, A. Prabhakaran, S. Gupta and V. R. Subramanian, ACS Omega, 2021, 6, 8734–8743 CrossRef CAS PubMed.
- J. Satra, U. K. Ghorui, P. Mondal, G. R. Bhadu and B. Adhikary, Dalton Trans., 2020, 49, 9464–9479 RSC.
- A. Rauf, M. S. Arif Sher Shah, J. Y. Lee, C. H. Chung, J. W. Bae and P. J. Yoo, RSC Adv., 2017, 7, 30533–30541 RSC.
- W. Li, J. Guo, L. Cai, W. Qi, Y. Sun, J. L. Xu, M. Sun, H. Zhu, L. Xiang, D. Xie and T. Ren, Sensors Actuators, B Chem., 2019, 290, 443–452 CrossRef CAS.
- H. Huang, X. Li, J. Wang, F. Dong, P. K. Chu, T. Zhang and Y. Zhang, ACS Catal., 2015, 5, 4094–4103 CrossRef CAS.
- U. K. Ghorui, J. Satra, P. Mondal, S. Mardanya, A. Sarkar, D. N. Srivastava, B. Adhikary and A. Mondal, Mater. Adv., 2021, 2(12), 4041–4057 RSC.
- D. Chaudhary, S. Singh, V. D. Vankar and N. Khare, J. Photochem. Photobiol., A, 2018, 351, 154–161 CrossRef CAS.
- P. Mondal, J. Satra, U. K. Ghorui, N. Saha, D. N. Srivastava and B. Adhikary, ACS Appl. Nano Mater., 2018, 1(11), 6015–6026 CrossRef CAS.
- P. Mondal, J. Satra, D. N. Srivastava, G. R. Bhadu and B. Adhikary, ACS Catal., 2021, 11, 3687–3703 CrossRef CAS.
- M. Sakthivel, R. Sukanya, S.-M. Chen and B. Dinesh, J. Phys. Chem. C, 2018, 122, 12474–12484 CrossRef CAS.
- J. Satra, P. Mondal, U. K. Ghorui and B. Adhikary, Sol. Energy Mater. Sol. Cells, 2019, 195, 24–33 CrossRef CAS.
- J. Satra and B. Adhikary, Advances in Energy Research, Springer Nature, 2020, vol. 1, pp. 81–88 DOI:10.1007/978-981-15-2666-4_9.
- U. K. Ghorui, P. Mondal, J. Satra, B. Adhikary and A. Mondal, Mater. Sci. Semicond. Process., 2022, 143, 106559 CrossRef CAS.
- J. Zhang, J. Yu, M. Jaroniec and J. R. Gong, Nano Lett., 2012, 12, 4584–4589 CrossRef CAS PubMed.
- H. B. Ammar, M. B. Brahim, R. Abdelhédi and Y. Samet, J. Mol. Catal. A: Chem., 2016, 420, 222–227 CrossRef CAS.
- T. Pérez, S. Garcia-Segura, A. El-Ghenymy, J. L. Nava and E. Brillas, Electrochim. Acta, 2015, 165, 173–181 CrossRef.
- C. Ding, K. Fu, Y. Pan, J. Liu, H. Deng and J. Shi, Catalysts, 2020, 10, 1097 CrossRef CAS.
- Q. Xiao, Z. Si, J. Zhang, C. Xiao and X. Tan, J. Hazard. Mater., 2008, 150, 62–67 CrossRef CAS PubMed.
- P. Wang, J. Xian, J. Chen, Y. He, J. Wang, W. Li, Y. Shao and D. Li, Appl. Catal., B, 2014, 144, 644–653 CrossRef CAS.
- J. Wang, P. Wang, Y. Cao, J. Chen, W. Li, Y. Shao, Y. Zheng and D. Li, Appl. Catal., B, 2013, 136–137, 94–102 CrossRef CAS.
- J. Johny, S. Sepulveda-Guzman, B. Krishnan, D. A. Avellaneda, J. A. Aguilar Martinez and S. Shaji, Chem. Phys. Chem., 2016, 18, 1061–1068 CrossRef PubMed.
- X. Liu, S. P. C. Hsu, W.-C. Liu, Y.-M. Wang, X. Liu, C.-S. Lo, Y.-C. Lin, S. C. Nabilla, Z. Li, Y. Hong, C. Lin, Y. Li, G. Zhao and R.-J. Chung, Nanoscale Res. Lett., 2019, 14(189), 1–9 CAS.
- P. Mondal, U. K. Ghorui, J. Satra, S. Mardanya, D. N. Srivastava, G. R. Bhadu and B. Adhikary, ACS Appl. Nano Mater., 2020, 3(4), 3876–3891 CrossRef CAS.
- C. M. A. Brett and A. M. O. Brett, Electrochemistry Principles, Methods, and Applications, Oxford University Press, Oxford, UK, 1st edn, 1993 Search PubMed.
- S. Ramaraj, S. M. Chen, B. Dinesh and K. H. Chen, J. Taiwan Inst. Chem. Eng., 2018, 82, 64–74 CrossRef.
- N. Karikalan, R. Karthik, S. M. Chen and H. A. Chen, Sci. Rep., 2017, 7, 1–10 CrossRef CAS PubMed.
- T. Kokulnathan and S.-M. Chen, ACS Appl. Mater. Interfaces, 2019, 11, 7893–7905 CrossRef CAS PubMed.
- N. Xiao, J. Deng, J. Cheng, S. Ju, H. Zhao, J. Xie, D. Qian and J. He, Biosens. Bioelectron., 2016, 81, 54–60 CrossRef CAS PubMed.
- A. Mao, H. Li, L. Yu and X. Hu, J. Electroanal. Chem., 2017, 799, 257–262 CrossRef CAS.
- E. Shahnazari-Shahrezaie and A. Nezamzadeh-Ejhieh, RSC Adv., 2017, 7, 14247–14253 RSC.
- J. Peng, C. Hou and X. Hu, Sens. Actuators, B, 2017, 169, 81–87 CrossRef.
- J. Huang, X. Shen, R. Wang, Q. Zeng and L. Wang, RSC Adv., 2017, 7, 535–542 RSC.
- M. Zhu, H. Ye, M. Lai, J. Ye, J. Kuang, Y. Chen, J. Wang and Q. Mei, Int. J. Electrochem. Sci., 2018, 13, 4100–4114 CrossRef CAS.
- Y. Gu, X. Yan, W. Liu, C. Li, R. Chen, L. Tang, Z. Zhang and M. Yang, Electrochim. Acta, 2018, 152, 108–116 CrossRef.
- P. Sundaresan, T. W. Chen, S. M. Chen, T. W. Tseng and X. H. Liu, Int. J. Electrochem. Sci., 2018, 13, 1441–1451 CrossRef CAS PubMed.
- M. Sakthivel, R. Sukanya, S. M. Chen and B. Dinesh, J. Phys. Chem. C, 2018, 122, 12474–12484 CrossRef CAS.
- T. Kokulnathan and S. M. Chen, ACS Appl. Mater. Interfaces, 2019, 11, 7893–7905 CrossRef CAS PubMed.
- L. Zhang, M. Yin, J. Qiu, T. Qiu, Y. Chen, S. Qi, X. Wei, X. Tian and D. Xu, Biosens. Bioelectron.: X, 2022, 10, 100102 CAS.
Footnote |
| † Electronic supplementary information (ESI) available. See DOI: https://doi.org/10.1039/d3ma00076a |
| This journal is © The Royal Society of Chemistry 2023 |

