 Open Access Article
Antibiofilm surfaces based on the immobilization of a novel recombinant antimicrobial multidomain protein using self-assembled monolayers†
Adriana R.
Kyvik
 a,
Ramon
Roca-Pinilla
 df,
Karla
Mayolo-Deloisa
 ae,
Xavier
Rodriguez Rodriguez
 a,
Marc
Martinez-Miguel
 ab,
Marta
Martos
 a,
Mariana
Köber
 ab,
Nora
Ventosa
 ab,
Jaume
Veciana
 ab,
Judith
Guasch
 abc,
Elena
Garcia-Fruitós
 d,
Anna
Arís
 d and
Imma
Ratera
 *ab
*ab
aInstitute of Materials Science of Barcelona (ICMAB-CSIC), Campus UAB, 08193 Bellaterra, Spain. E-mail: iratera@icmab.es
bNetworking Research Center on Bioengineering, Biomaterials and Nanomedicine (CIBER-BBN), Campus UAB, 08193 Bellaterra, Spain
cDynamic Biomimetics for Cancer Immunotherapy, Max Planck Partner Group, ICMAB-CSIC, Campus UAB, 08193 Bellaterra, Spain
dDepartment of Ruminant Production, Institut de Recerca i Tecnologia Agroalimentàries (IRTA), 08140 Caldes de Montbui, Spain
eTecnologico de Monterrey, Institute for Obesity Research, School of Engineering and Sciences, Av. Eugenio Garza Sada 2001, 64849 Monterrey, Nuevo León, México
fTranslational Vectorology Research Unit, Children's Medical Research Institute, The University of Sydney, Westmead, Australia
First published on 13th April 2023
Abstract
The constant increase of microorganisms resistant to antibiotics has been classified as a global health emergency, which is especially challenging when biofilms are formed. Herein, novel biofunctionalized gold surfaces with the antimicrobial multidomain recombinant protein JAMF1, both in the soluble form and nanostructured as nanoparticles, were developed. The interaction between His-tag termination of the protein and a nitriloacetic acid–Ni complex formed on mixed self-assembled monolayers (mixed SAMs) was exploited. The obtained antibiofilm surfaces based on the immobilization of the novel JAMF1 protein using self-assembled monolayers were characterized using a multi-technique approach including: cyclic voltammetry, X-ray photoelectron spectroscopy, atomic force microscopy and fluorescence, proving that the modification and immobilization of JAMF1 were successfully done. The antibiofilm activity against Escherichia coli and carbapenem-resistant Klebsiella pneumoniae showed that the immobilized antimicrobial proteins were able to reduce biofilm formation of both microorganisms. This strategy opens up new possibilities for controlled biomolecule immobilization for fundamental biological studies and biotechnological applications, at the interface of materials science and molecular biology.
Introduction
The increasing appearance of antibiotic resistant bacteria has become a global health emergency.1,2 The main pathogens responsible for resistance-associated deaths (Escherichia coli, Staphylococcus aureus, Klebsiella pneumoniae, Streptococcus pneumoniae, Acinetobacter baumannii, and Pseudomonas aeruginosa) were responsible for 929![[thin space (1/6-em)]](https://www.rsc.org/images/entities/char_2009.gif) 000 deaths attributable directly to antimicrobial resistance in 2019.3 The antibiotic resistance problem is even more complicated when bacteria form biofilms because they are 1000-fold resistant as compared with planktonic bacteria.2,4,5 Biofilms may form on a wide variety of surfaces, including living tissues, medical devices,6,7 or water system piping.8 Biofilms cause approximately 80% of chronic and recurrent human microbial infections.6 In this context, it is imperative to find new surface coating approaches to avoid biofilm formation. Antimicrobial peptides (AMPs) with antimicrobial activity due to the innate immunity of a variety of species are gaining interest as a possible alternative to antibiotics, also for biofilm-forming bacteria.9 Recently, we have described a new generation of antimicrobial multidomain proteins that combine several AMPs and complementary functional domains in a single polypeptide recombinantly produced as protein nanoclusters named protein nanoparticles (pNPs).10 However, the antibiofilm activity of such multidomain proteins has not been explored in detail.
000 deaths attributable directly to antimicrobial resistance in 2019.3 The antibiotic resistance problem is even more complicated when bacteria form biofilms because they are 1000-fold resistant as compared with planktonic bacteria.2,4,5 Biofilms may form on a wide variety of surfaces, including living tissues, medical devices,6,7 or water system piping.8 Biofilms cause approximately 80% of chronic and recurrent human microbial infections.6 In this context, it is imperative to find new surface coating approaches to avoid biofilm formation. Antimicrobial peptides (AMPs) with antimicrobial activity due to the innate immunity of a variety of species are gaining interest as a possible alternative to antibiotics, also for biofilm-forming bacteria.9 Recently, we have described a new generation of antimicrobial multidomain proteins that combine several AMPs and complementary functional domains in a single polypeptide recombinantly produced as protein nanoclusters named protein nanoparticles (pNPs).10 However, the antibiofilm activity of such multidomain proteins has not been explored in detail.
One of the strategies recently used to provide antimicrobial properties to medical devices, to avoid the need of systematic treatments, is based on the immobilization of AMPs achieved through their binding on different surfaces. Moreover, it has also been shown that the immobilized AMPs are capable of keeping their antimicrobial activity under specific conditions.11–14 This strategy allows higher availability of AMPs on the surface and more uniform distribution in comparison to the incorporation of AMPs through other adsorption methods that give place to non-homogeneous peptide distributions. In addition, the anchoring of AMPs on the surfaces has been reported to be a good strategy to avoid proteolytic degradation. Such advantages allow increasing stability and completely avoid toxicity associated with the use of high AMP dosages.15,16
Using self-assembled monolayers (SAMs) is a strategy used to anchor AMPs on surfaces and study the effect of their immobilization. SAMs are based on well-organized molecules on surfaces which are easy to prepare and functionalize, allowing a fine control at the molecular level.17,18 Thus, the use of the SAM strategy to anchor AMPs on surfaces has been shown to be one of the best strategies for achieving a controlled design of antibiofilm surfaces to coat medical devices.19
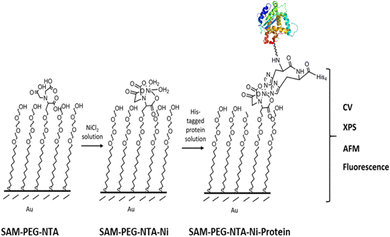
Herein, we report biofunctionalized gold surfaces using a new antimicrobial multidomain protein (JAMF1) formed by several AMPs by means of DNA recombinant technology in a soluble and protein nanoparticle (pNP) form, which has the potential to be a protein-slow release form. Furthermore, we report the formation of an antimicrobial surface through the immobilization of this novel generation of recombinant multidomain antimicrobial protein, JAMF1, using a mixed SAM strategy, as a proof of concept for coating medical devices. The mixed SAM is based on a mixture of ((1-mercapto-11-undecyl)-(tetra(ethylene glycol)) (SH-PEG) and nitriloacetic acid (NTA)-terminated (SH-PEG-NTA) molecules on gold (Scheme 1). Specifically, after Ni complexation of the NTA termination, we have used the interaction of the JAMF1 protein terminal His-tag with the S-PEG-NTA–Ni complex found on the gold functionalized with the mixed SAMs to anchor the protein to the surface (Fig. 1).
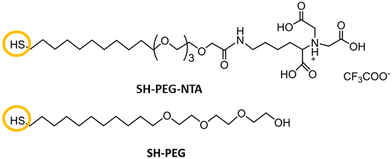 | ||
| Scheme 1 Structure of the molecules used for mixed SAMs formation. The NTA terminated thiol (SH-PEG-NTA) and the commercial pegylated alkanethiol (SH-PEG). | ||
Then, the immobilized novel antimicrobial protein in its soluble and pNP forms on mixed SAMs was characterized using a multi-technique approach to (i) verify the successful achievement of each SAM formation step, (ii) the specific immobilization of the protein and (iii) compare the differences when immobilizing the soluble versus the pNP form. Cyclic voltammetry (CV), X-ray photoelectron spectroscopy (XPS), atomic force microscopy (AFM) and fluorescence microscopy measurements were performed. Moreover, for in depth characterization of the functionalized surfaces, prefunctionalized patterned and non-patterned mixed polyethylene glycol (SH-PEG) and SH-PEG-NTA–Ni were prepared. Based on our previous expertise, to achieve spatial control of the distribution of the molecules20 and pNPs,21 the optimization of the microcontact printing (μCP) procedure of the NTA-terminated thiol (SH-PEG-NTA) and pegylated alkanethiol (SH-PEG) molecules was performed and a His-tagged green fluorescent protein (mGFPH6) as a reporter was used to optimize the procedure, easily visualizing the pattern.22–25
Finally, an antibiofilm activity assay was carried out to evaluate the actual antimicrobial effect of the surfaces modified with the novel recombinant antimicrobial protein in its soluble and pNP forms. The antimicrobial activity was tested against E. coli and K. pneumoniae carbapenemase (KPC) bacteria, this last one being an example of an antibiotic-resistant strain.
Materials and methods
Bacterial strains and medium
We used Escherichia coli BL21 (DE3) and E. coli Origami B strains for heterologous protein expression of antimicrobial proteins and a modified version of green fluorescent protein (mGFPH6), respectively. E. coli DH5α and carbapenem-resistant K. pneumoniae (KPC) were used to evaluate the antibiofilm activities. E. coli strains were grown in Luria–Bertani (LB) medium and KPC in Brain Heart-Infusion (BHI) broth (Scharlau, Barcelona, Spain).Antimicrobial protein genetic construct design
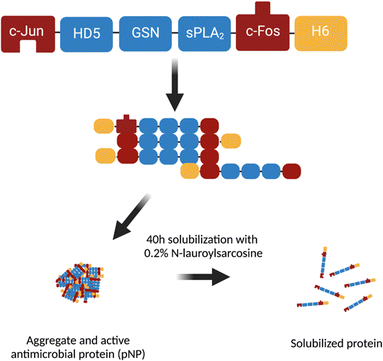
The gene encoding for the JAMF1 construct consisted of the sequences encoding Jun257-318 (Uniprot entry P05412), human α-defensin-5 (HD5) precursor (Uniprot entry Q01523), gelsolin 188–196 (Uniprot entry P06396), group-XIIA secretory phospholipase A2 (sPLA2) precursor (Uniprot entry Q9BZM1) and Fos118-210 (Uniprot entry P01100), from N-terminal to C-terminal. A linker sequence consisting of serine and glycine residues (SGGGSGGS) was used between each of the domains and a 6-histidine tag (H6-tag) at the C-terminal for protein purification. The fusion construct was codon optimized by GeneArt (Life technologies, Regensburg, Germany) and then cloned into pET22b (AmpR) (Novagen, Darmstadt, Germany) backbone for further E. coli transformation and recombinant production.Production of recombinant multidomain antimicrobial protein JAMF1
An E. coli BL21 (DE3)/pET22b-JAMF110 culture (0.5 L) was grown at 37 °C and 250 rpm in LB broth with ampicillin at 100 μg mL−1. Protein expression was induced by 1 mM isopropyl-β-D-thiogalactoside (IPTG) at OD600 = 0.4–0.6. Cultures were grown for 3 h post-induction. To obtain JAMF1 as pNP, the bacterial culture was processed with a mechanical disruption and washing steps, as described elsewhere.10 For soluble protein production, a 2 L culture was grown and centrifuged at 6000 × g and the pellets were recovered and resuspended in 120 mL of phosphate-buffered saline (PBS) with protease inhibitors (complete EDTA-free; Roche, Indianapolis, USA). The samples were sonicated for 4 rounds of 5 min at 10% amplitude under 0.5 s cycles, intercalated by a minimum of 5 min of rest in ice. Protein pellets were again recovered and washed twice with distilled water. The pellets were weighted and solubilized in 0.2% N-lauroyl sarcosine, 40 mM Tris and protease inhibitors at a ratio of 40 mL g−1 of the wet pellet as described previously.26 The mixture was incubated 40 h overnight (O/N) at room temperature (RT) under agitation and the supernatant was recovered through centrifugation (15![[thin space (1/6-em)]](https://www.rsc.org/images/entities/char_2009.gif) 000 × g for 45 min at 4 °C), for purification. NaCl and imidazole were added to the solubilized protein to equilibrate the samples, and immobilized metal affinity chromatography (IMAC) purification was carried out in an Äkta purifier 10 system (GE Healthcare; Uppsala, Sweden) using a 1 mL HisTrap HP column (GE Healthcare; Uppsala, Sweden). Both the binding and the elution buffer contained 0.2% N-lauroyl sarcosine. The final imidazole concentration in the elution buffer was 0.5 mM. Finally, the buffer of the selected purified protein fractions was changed to KPi (potassium phosphate buffer: 80.2% v/v 10 mM K2HPO4 and 19.8% v/v 10 mM KH2PO4) using a desalting column (Cytiva, US).10 Purified pNP and soluble protein were quantified by western blotting using a monoclonal anti-His antibody (1
000 × g for 45 min at 4 °C), for purification. NaCl and imidazole were added to the solubilized protein to equilibrate the samples, and immobilized metal affinity chromatography (IMAC) purification was carried out in an Äkta purifier 10 system (GE Healthcare; Uppsala, Sweden) using a 1 mL HisTrap HP column (GE Healthcare; Uppsala, Sweden). Both the binding and the elution buffer contained 0.2% N-lauroyl sarcosine. The final imidazole concentration in the elution buffer was 0.5 mM. Finally, the buffer of the selected purified protein fractions was changed to KPi (potassium phosphate buffer: 80.2% v/v 10 mM K2HPO4 and 19.8% v/v 10 mM KH2PO4) using a desalting column (Cytiva, US).10 Purified pNP and soluble protein were quantified by western blotting using a monoclonal anti-His antibody (1![[thin space (1/6-em)]](https://www.rsc.org/images/entities/char_2009.gif) :
:![[thin space (1/6-em)]](https://www.rsc.org/images/entities/char_2009.gif) 1000) (His-probe, Santa Cruz). As secondary anti-body, we used an anti-mouse IgG – alkaline phosphatase (1
1000) (His-probe, Santa Cruz). As secondary anti-body, we used an anti-mouse IgG – alkaline phosphatase (1![[thin space (1/6-em)]](https://www.rsc.org/images/entities/char_2009.gif) :
:![[thin space (1/6-em)]](https://www.rsc.org/images/entities/char_2009.gif) 20
20![[thin space (1/6-em)]](https://www.rsc.org/images/entities/char_2009.gif) 000) produced in goat (Sigma-Aldrich) (See Fig. S8, ESI†).
000) produced in goat (Sigma-Aldrich) (See Fig. S8, ESI†).
Production of mGFPH6
E. coli Origami B/pET22b-T22GFPH6 (mGFPH6)27 culture (2 L) was grown at 37 °C and 250 rpm in LB broth with ampicillin at 100 μg mL−1, kanamycin at 15 μg mL−1 and tetracycline at 12.5 μg mL−1. When OD600 = 0.5 was reached, protein production was induced with 1 mM IPTG (isopropyl-β-D-thiogalactoside) and the culture was grown O/N at 20 °C and 250 rpm. After O/N production, cultures were centrifuged at 6000 × g and 4 °C for 45 min. Then, the pellets were resuspended in 20 mM Tris-HCl (pH 8.0), with 500 mM NaCl, 20 mM imidazole and protease inhibitors (complete EDTA-free; Roche, Indianapolis, USA). Intra-cellular soluble protein was extracted by sonication with 4 × 5 min rounds (0.5 on, 0.5 off cycles) at 10% amplitude, with a minimum 10 min rest in ice between rounds. Finally, the protein was purified by IMAC using a 1 mL HisTrap HP column (GE Healthcare; Uppsala, Sweden) in an Äkta start protein purification system (GE Healthcare; Uppsala, Sweden). Protein separation was achieved with a linear imidazole gradient from 20 mM to 500 mM. Fractions were collected and dialyzed against 166 mM NaHCO3 at pH 7.4. The amount of protein was determined using a Nanodrop 1000 spectrophotometer (Thermo Scientific) at 280 nm and protein integrity was evaluated using western blot analysis as described above (See Fig. S8, ESI†).Preparation of patterned and non-patterned His-tagged protein SAMs
Substrates used were either glass slides with a 2-nm titanium adhesion layer and a 10-nm gold layer or silicon wafers with a 50-nm titanium adhesion layer and 100-nm gold layer. The substrates were cut to have an area of 1.5 × 1 cm and cleaned with HPLC gradient solvents during 5 min; first isopropanol, then acetone, and lastly ethanol. After drying them with a nitrogen gun very carefully, they were exposed to ozone (UVO CLEANER, Model No. 42-220) for 20 min and immersed in ethanol during 30 min.For the μCP procedure, the polydimethylsiloxane (PDMS) stamp of interest was cut using a scalpel, rinsed with ethanol, and dried off with a stream of nitrogen. Then, a solution of SH-PEG (ProChimia Surfaces, Scheme 1) 1 mM in ethanol was dropped (40 μL) on top of the PDMS stamp. The stamp was then dried off using a nitrogen gun. The substrates were then printed with the inked stamp by carefully placing the stamp on the substrate and leaving them in contact for 2 min. An empty and flat Petri dish was placed on top of the stamp to increase and homogenize the pressure. The stamp was removed carefully with tweezers and the substrates were incubated with 80 μL of SH-PEG-NTA (ProChimia Surfaces, Scheme 1) 1 mM in ethanol in a humid chamber during 2 h at RT. The substrates were transferred to a 6-well plate to perform the following immersions at RT: (i) Milli-Q water during 5 min (×2); (ii) HEPES buffer solution for 10 min (×1), (iii) 10 mM NiCl2 in HEPES during 30 min; (iv) HEPES for 2 min (×3).
Then, the substrates were incubated with mGFPH6 or antimicrobial protein JAMF1 in soluble (20 μM) and insoluble pNP forms (23 μM for evaluation against E. coli DH5α or 500 μM for evaluation against KPC) in a humid chamber during 1 h at RT. For the preliminary trials, 45 μL of mGFPH6 (20 μM) was used and the Petri dish was covered with an aluminum foil to avoid photobleaching. For the soluble JAMF1, we used 50 μL of 20 μM and for the pNP, 50 μL of 23 μM and 500 μM, for E. Coli and KPC, respectively, were used.
The samples were immersed in HEPES during 5 min (×2). For the negative control samples, a further treatment with EDTA was performed. EDTA acts as a competitive chelator for NTA because it cleaves the chelated Ni from NTA to form a Ni–EDTA complex. The effectiveness of this competition lies on the higher stability constant of the Ni–EDTA complex (18.56 in logarithmic) than the NTA–Ni complex (11.26 in logarithmic). Therefore, the His-tagged protein can no longer bind to S-PEG-NTA. The detailed steps were the following: (i) the substrates were immersed in 10 mM EDTA solution (or 100 mM for the NPs) during 20 min and rinsed again with HEPES afterwards; (ii) if they were not characterized straight away, the substrates were left immersed in HEPES in the fridge at 4 °C. The pH values of both HEPES and EDTA solutions were adjusted before their use to values of 8.0 and 7.31, respectively, using 0.1 M NaOH and 0.1 M H2SO4 solutions. For non-patterned substrates, no μCP procedure was used, and instead the entire area of the surface was functionalized with SH-PEG-NTA.
Immunostaining
The following immunostaining steps were performed: (1) after protein immobilization, the substrates were incubated with a solution of primary antibody sPLA2 (E-9) (Santa Cruz Biotechnology, Inc.) in a ratio of 1![[thin space (1/6-em)]](https://www.rsc.org/images/entities/char_2009.gif) :
:![[thin space (1/6-em)]](https://www.rsc.org/images/entities/char_2009.gif) 400 in bovine serum albumin (BSA) solution (1% in PBS). Each substrate was incubated with 50 μL in a humid chamber for 1 h. (2) The substrates were rinsed in PBS on the shaker at 50 rpm for 10 min. (3) The substrates were incubated with a solution of a secondary antibody, Alexa goat anti-mouse 488 IgG (Thermo Fisher Scientific), in a ratio of 1
400 in bovine serum albumin (BSA) solution (1% in PBS). Each substrate was incubated with 50 μL in a humid chamber for 1 h. (2) The substrates were rinsed in PBS on the shaker at 50 rpm for 10 min. (3) The substrates were incubated with a solution of a secondary antibody, Alexa goat anti-mouse 488 IgG (Thermo Fisher Scientific), in a ratio of 1![[thin space (1/6-em)]](https://www.rsc.org/images/entities/char_2009.gif) :
:![[thin space (1/6-em)]](https://www.rsc.org/images/entities/char_2009.gif) 100 in the BSA solution. Again, each substrate was incubated with 50 μL in a dark humid chamber for 45 min. (4) The substrates were rinsed in PBS on the shaker at 50 rpm during 10 min. (5) The substrates were mounted on glass slides with 50 μL of ProLong Gold Antifade Reagent (Thermo Fisher Scientific). They were left to dry O/N in a dark chamber.
100 in the BSA solution. Again, each substrate was incubated with 50 μL in a dark humid chamber for 45 min. (4) The substrates were rinsed in PBS on the shaker at 50 rpm during 10 min. (5) The substrates were mounted on glass slides with 50 μL of ProLong Gold Antifade Reagent (Thermo Fisher Scientific). They were left to dry O/N in a dark chamber.
Fluorescence microscopy
The instruments employed for the visualization of the samples were an Olympus BX51 microscope equipped with a CCD camera Olympus DP20 for S-PEG-NTA-Ni-mGFPH6 samples and an Axio Observer Z1m optical microscope (ZEISS) for the rest of the samples. The software Image J was used to extract the intensity profile of the striped pattern. The substrates observed were the following: patterned S-PEG-NTA-Ni-mGFPH6, immunostained patterned S-PEG-NTA-Ni-JAMF1-Sol, immunostained patterned S-PEG-NTA-Ni-JAMF1-pNP, together with the negative controls.Cyclic voltammetry
A solution of 5 mM of [Ru(NH3)6)]3+ was prepared in an electrolyte solution consisting in a 50 mM KCl aqueous solution. A platinum wire was employed as the counter electrode (CE) and an Ag/AgCl electrode as the reference electrode (RE). The working electrode (WE) was, depending on the measurement, the bare gold substrate, S-PEG-NTA, S-PEG-NTA–Ni-JAMF1-Sol, S-NTA–Ni-JAMF1-pNP or S-PEG-NTA–Ni-mGFPH6. The potentiostat used was AUTOLAB 204 and the software used for the data acquisition and analysis was Nova 2.3. The scan rate used was 0.1 V s−1 and the area of the WE immersed into the electrolyte solution was around 1.5 cm2.Atomic force microscopy
Surface topography and film thickness were examined by a Keysight 5500 SPM system from Agilent. The images were processed using the Gwyddion software. The samples analyzed had a 2-μm striped pattern of (A) S-PEG-NTA–Ni-JAMF1-Sol, (B) S-PEG-NTA–Ni-JAMF1-Sol-Ctrl (by treatment with 10 mM EDTA) (C) S-PEG-NTA–Ni-JAMF1-pNP, (D) S-NTA–Ni-JAMF1-pNP-Ctrl (by treatment with 100 mM EDTA), (E) S-PEG-NTA–Ni and (F) S-PEG-NTA. It is important to mention that the measurements were conducted under dry conditions and that surfaces analyzed are biological samples, so the protein on the surface is dehydrated. The topography images shown in Fig. 5 and 6 were processed using a mean plane subtraction and the ‘Revolve Arc’ function for flattening (30 pixels, 2.9 μm, horizontal direction). No image processing was applied on phase images. For profile extraction (Fig. 7), the images were processed using a mean plane subtraction, flattened base and offset subtraction.X-ray photoelectron spectroscopy (XPS)
The measurements were performed using a Phoibos 150 analyzer (SPECS GmbH) under ultrahigh vacuum conditions (base pressure 5 × 10⁻¹⁰ mbar) with a monochromatic aluminum K alpha X-ray source (1486.74 eV). The energy resolution measured by the FWHM of the Ag 3d5/2 peak for a sputtered silver foil was 0.6 eV. The spot size was 3.5 mm by 0.5 mm. Compositional survey and detailed scans (N 1s, S 2p, Ni 2p and O 1s,) were acquired. The samples measured were S-PEG-NTA–Ni-JAMF1-Sol, S-PEG-NTA–Ni-JAMF1-Sol-Ctrl (by treatment with 10 mM EDTA), S-PEG-NTA–Ni-JAMF1-pNP, S-PEG-NTA–Ni-JAMF1-pNP-Ctrl (by treatment with 100 mM EDTA), S-PEG-NTA–Ni and S-PEG-NTA. In all substrates, the prepared S-PEG-NTA was not patterned, so the incubation with SH-PEG-NTA was done directly without previous μCP of SH-PEG.Antibiofilm activity assay
Bacterial strains were grown O/N at 37 °C and 250 rpm. Before adding bacteria to a 24-well sterile plate for biofilm formation, either His-tagged protein-mixed SAMs were placed under sterile conditions in each well. After that, bacteria from the O/N culture were diluted 1![[thin space (1/6-em)]](https://www.rsc.org/images/entities/char_2009.gif) :
:![[thin space (1/6-em)]](https://www.rsc.org/images/entities/char_2009.gif) 200 in fresh medium supplemented with 0.2% (w/v) glucose. A total of 400 μL of diluted bacterial culture supplemented with glucose was incubated in each well at 37 °C for 24 h under static conditions. After the incubation, the supernatant was removed and wells were washed 3 times with 500 μL NaCl 0.9%, then fixated with 500 μL methanol for 10 min at RT. Methanol was removed and the plate was dried for 15 min at 37 °C. The remaining biofilm cells in the well were stained with crystal violet 1% (v/v) for 15 min at RT and washed 3 times with sterile dH2O. Finally, the stained cells were diluted in 33% (v/v) acetic acid and the absorbance was measured at 595 nm.28 All measurements were done by triplicate under sterile conditions.
200 in fresh medium supplemented with 0.2% (w/v) glucose. A total of 400 μL of diluted bacterial culture supplemented with glucose was incubated in each well at 37 °C for 24 h under static conditions. After the incubation, the supernatant was removed and wells were washed 3 times with 500 μL NaCl 0.9%, then fixated with 500 μL methanol for 10 min at RT. Methanol was removed and the plate was dried for 15 min at 37 °C. The remaining biofilm cells in the well were stained with crystal violet 1% (v/v) for 15 min at RT and washed 3 times with sterile dH2O. Finally, the stained cells were diluted in 33% (v/v) acetic acid and the absorbance was measured at 595 nm.28 All measurements were done by triplicate under sterile conditions.
Statistical analysis
For all assays, each condition was used in triplicate or quintuplicate (Fig. 9 and 10 are represented as the mean ± standard error of the mean. All data were checked for normality. The P-values correspond to t-test analyses for the antibiofilm activity assay.Results and discussions
Production of a novel antimicrobial protein
We used a multidomain AMP named JAMF1, which combines human α-defensin 5 (HD5), a bacterial binding domain (gelsolin), and an enzymatic antimicrobial peptide, group-XIIA secretory phospholipase A2 (sPLA2), flanked by two aggregation-seeding domains (a fragment of c-Jun and c-Fos leucine zippers at N- and C-terminals) (Fig. 2).10 The AMP was produced as pNP or as a source to obtain soluble protein. Both formats have previously shown activity against Gram-positive and Gram-negative bacteria10 in solution. JAMF1 pNPs also showed antibiofilm activity when they were used to decorate plastic surfaces.10 However, the activity of this protein anchored in SAMs has not been explored so far.HD5 and sPLA2 are those domains forming JAMF1 that have antimicrobial activity. The mechanism of action of HD5 is based on its cationic and amphipathic nature. HD5 is attracted by electrostatic forces to the negatively charged lipid bilayer forming the bacterial membrane and this induced a change on the membrane structure and, consequently, a pore is formed.29 sPLA2 is an enzyme also from the innate immunity, which effectively hydrolyses the phospholipids components of the bacterial membrane. Thus, the combination of both HD5 and sPLA2 domains makes JAMF1 protein a promising antimicrobial candidate against Gram-negative and Gram-positive bacteria.10
The gelsolin domain also included in JAMF1 is a bacterial binding domain whose role is to increase the efficiency of the JAMF1 molecule binding the pathogen to be treated.
His-tagged AMPs anchoring on micropatterned S-PEG-NTA-Ni SAMs
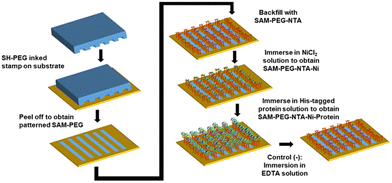
In order to improve the characterization of the AMPs anchoring process, surfaces with the immobilized proteins have been prepared using the μCP technique through a spatial control of the distribution of the SH-PEG-NTA and SH-PEG mixed SAMs (Fig. 3). Before using JAMF1, a His-tagged green fluorescent protein (mGFPH6) has been used for surface protein immobilization to easily visualize the pattern by fluorescence microscopy and optimize its spatial distribution. Briefly, a PDMS stamp inked with a SH-PEG ethanolic solution (1 mM) was put in contact with the clean gold surface and peeled off carefully. Thereafter, they were incubated with a SH-PEG-NTA ethanolic solution (1 mM) to backfill the non-patterned areas, obtaining a patterned S-PEG-NTA. Afterwards, the samples were incubated in a NiCl2 solution, obtaining S-PEG-NTA–Ni. Negative controls were prepared in the same way but finally treated with EDTA which acts as a competitive chelator, cleaving the Ni from NTA and leading to S-PEG-NTA again.The patterned S-NTA–Ni-mGFPH6 samples were prepared following the procedure depicted in Fig. 3. A fluorescent striped pattern was obtained as visualized in Fig. S1 (ESI†), demonstrating that mGFPH6 is correctly immobilized on the S-PEG-NTA–Ni samples. These results showed the successful optimization of the spatial control by SAM formation using the μCP technique and also the good affinity of the His-tag of the recombinant proteins for the NTA–Ni complex on the surface.
The absence of fluorescent patterns in the negative controls demonstrates that Ni is removed from the NTA and chelated by EDTA, inducing the removal of the His-tagged protein and, therefore, of the protein from the surface.
CV has also been used to examine the current barrier properties of the functionalized surface and further corroborate the integrity of the SAM and correct anchoring of mGFPH6. For this experiment, non-patterned surfaces were used. When performing CV experiments with mGFPH6 functionalized gold substrates, as working electrodes, (Fig. S2, ESI†) in the presence of a redox probe ([Ru(NH3)6)]3+), the current decreases when the mixed SAM is formed on the gold surface and decreases even more when mGFPH6 is immobilized. This fact is indicative of a higher blocking effect which hinders electrons to travel from the redox probe to the gold surface and vice versa. The anchoring of mGFPH6 on the surface hinders even more the access of electrons to the gold surface, not only because they imply a larger separation distance between the gold and redox probe acting like a new layer of impedance for the electrons to overcome, but because their bigger size and volume in comparison to the SAM molecules make the electron transfer even harder. In view of these results, we can conclude that a densely packed mixed SAM has been assembled and that mGFPH6 is correctly immobilized.
Patterned anchoring of AMP JAMF1
The correct immobilization of the JAMF1 active antimicrobial polypeptide using mixed SAMs was monitored using: (i) immunostaining and subsequent fluorescence microscopy, (ii) AFM, (iii) CV, and (iv) XPS. To produce the functional surfaces to be characterized by these techniques, first a S-PEG SAM is μCP on the substrate (20 μm stripes) and then the empty stripes are back filled with the NTA-terminated SAM. Finally, the substrate is immersed in the JAMF1 protein solution for its spatially controlled anchoring through His-tag termination (see Fig. 3).Immunostaining and fluorescence microscopy
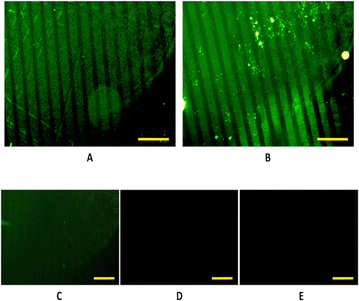
In this case, proteins are depleted of fluorescence, thus, to visualize the pattern, immunostaining had to be performed using a primary and secondary antibody as described in the experimental section. Following the procedure described in Fig. 3, a homogeneous functionalization of the antimicrobial protein onto patterned S-PEG-NTA–Ni samples was achieved, both with the soluble and pNP forms of the protein (Fig. 4A and B, respectively). In fact, it is the first time that the NTA–Ni strategy is used to anchor pNPs on surfaces. Even some aggregates are observed (Fig. 4B) due to the aggregation nature of the protein,24,25 the fluorescent stripes remain well delimited, and a uniform coverage of the protein is found along the pattern.The absence of fluorescent patterns in the negative controls, achieved by immersing the substrates in EDTA (10 mM), as shown in Fig. 4(C) and (D), indicates the reversibility of the union. Moreover, the dark images obtained from the generic negative control (Fig. 4(E)), which consisted in the immunostaining of a patterned S-PEG-NTA sample, show that the immunostaining technique worked correctly, and that the fluorescence is specific for the immunostained proteins.
In addition, the fluorescence intensity profiles (Fig. S3, ESI†) for the patterning of the soluble form and also with the pNP formats of the JAMF1 protein, show peaks with practically the same intensity in both cases, indicating a homogeneous coverage of the protein on the desired areas. A periodicity in the intensity peaks is observed: there is low or no fluorescence intensity between peaks, implying that there are no luminescent antibodies and therefore, no antimicrobial protein. Hence, the antimicrobial His-tagged protein is specifically attached only onto the NTA–Ni groups, and the SH-PEG molecules form a protein-repelling surface, as desired. These results also confirm that μCP allows a correct spatial control of protein immobilization.
Atomic force microscopy
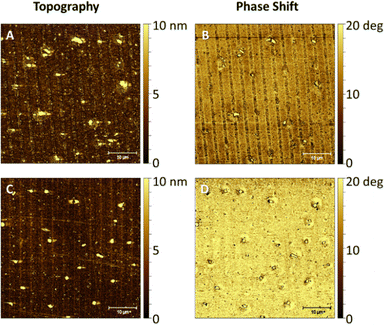
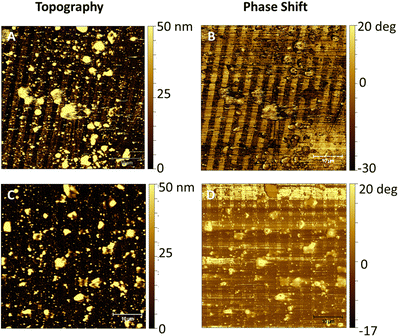
In order to match with the lateral resolution of the AFM technique, in this case, 2-μm wide striped patterns were printed (Fig. 3) for both soluble and pNP forms of the antimicrobial protein. Both topographical (Fig. 5(A) and Fig. 6(A)) and phase shift images (Fig. 5(B) and Fig. 6(B)) confirmed the correct protein immobilization. Fig. 5 and 6C, D are the topography and phase images of negative controls based on samples treated with EDTA which demonstrate the correct removal of the protein from the surface.With the topographical profiles (Fig. 7), we observed that the stripes of the soluble protein are better delimited than the ones of the pNP pattern which are also wider than the those of the soluble protein. The height of pNP is greater than the one from the soluble protein, indicative of the successful immobilization of both soluble and pNP. For analysis purposes, the average measurements of the height and the width of each sample are shown in Table 1.
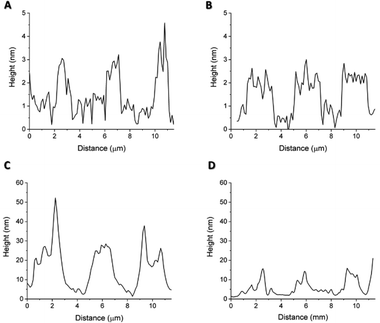 | ||
| Fig. 7 Topographic profiles of (A) patterned S-PEG-NTA–Ni-Sol, (B) patterned S-PEG-NTA–Ni-Sol-Ctrl, (C) patterned S-PEG-NTA–Ni-JAMF1-pNP and (D) patterned S-PEG-NTA–Ni-JAMF1-pNP-Ctrl. | ||
| Sample | Mean peak width [μm] | Mean peak height [nm] |
|---|---|---|
| S-PEG-NTA–Ni-JAMF1-Sol | 1.3 ± 0.1 | 3.0 ± 0.6 |
| S-PEG-NTA–Ni-JAMF1-Sol-Ctrl | 2.30 ± 0.02 | 2.0 ± 0.1 |
| S-PEG-NTA–Ni-JAMF1-pNP | 2.56 ± 0.08 | 37 ± 8 |
| S-PEG-NTA–Ni-JAMF1-pNP-Ctrl | 2.00 ± 0.09 | 12.7 ± 0.6 |
The difference in height between the negative controls (Fig. 7(B and D)) consisting in a patterned S-PEG-NTA sample, and the ones with bound protein (Fig. 7(A) and (C)), corresponds to the presence of the immobilized antimicrobial protein. Fig. 7C and 7D show that the EDTA strategy for the removal of pNP to generate the negative control is not as effective as it is for the soluble protein. It is important to note that measurements were conducted under dry conditions and the proteins on the surface are dehydrated, thus the measured value of their height is not comparable with other reported protein sizes, because normally, these measurements were done under aqueous conditions.30 As expected, the pNP sample is found to have higher values than those of the soluble one (Table 1). The measured values of their heights are not comparable with the other reported protein sizes, which are measured under aqueous conditions, important for protein hydration, 3D structure, dynamics and activity.31 AFM measurements are performed under dry conditions and thus, aqueous media around the protein provides a hydration layer which enhances the measured protein size.30,32 The removal of water from our substrates may have provoked a reduction in protein size and probably even the loss of their 3D structure. Nonetheless, these measurements give an insight regarding the protein mass immobilized on the surface. In fact, comparing the height of the soluble protein and the pNP, the height of the pNP is greater than the one from the soluble protein, indicative of the successful immobilization of both soluble and pNP forms. The width differences observed between peaks may be again due to the aggregated nature of the pNP, which when immobilized on the edge of the patterned NTA, can surpass the extension of the pattern, resulting in wider peaks compared to those obtained with the soluble protein.
Stiffness variations on the surface can be analyzed using phase imaging maps. A stiffer region has a more positive phase shift than a less stiff region and appears brighter in a phase image.33,34 In soft materials, the phase shift is highly dependent on the viscoelastic properties of the material.35 The antimicrobial protein in both soluble and pNP forms can be detected in the negative phase shift regions, appearing darker. The areas functionalized with SH-PEG appear stiffer than the areas with immobilized protein, which are only attached to the SAM by the His-tag, and are more likely to deform.
In negative controls, the pattern is not detected in the phase shift images, as shown in Fig. 5D since both SH-NTA and SH-PEG form a compact SAM with similar stiffness and viscoelastic properties, with their aliphatic chains interacting between each other.
Cyclic voltammetry
We have used CV to study the correct formation of the SAMs and the immobilization of the antimicrobial protein using the modified substrates as WE (Fig. S2 and S4, ESI†). A decrease in current is observed after S-PEG-NTA SAM formation (Fig. S2 and S4, red line, ESI†), as expected. From the NTA SAM, the protein immobilization gives rise to a current reduction which is not as large as in the case of mGFPH6 (Fig. S2, ESI†). The reason may be that mGFPH6 is much smaller than the antimicrobial protein: mGFPH6 has 238 amino acids, while the novel antimicrobial protein has 487 amino acids. Therefore, the attachment of mGFPH6 to NTA–Ni is easier than in the case of the larger antimicrobial multidomain protein. Also, due to its size, steric hindrance may play a role, making it more difficult to occupy all the NTA–Ni units. This is an indication that when the protein anchors the SAM, even a higher layer is formed, it becomes less compact. Hence, the coverage of the S-PEG-NTA–Ni-JAMF1-Sol, even if efficiently performed, as seen before, is not as homogeneous as with the smaller GFP. It presents more defects.The voltammogram obtained after immobilization of the pNP (S-PEG-NTA–Ni-JAMF1-pNP) shows a decrease of current for the positive voltage which is in accordance with the biggest size of the nanoparticles in comparison with the soluble protein thus, impairing more current flow.
X Ray photoelectron spectroscopy
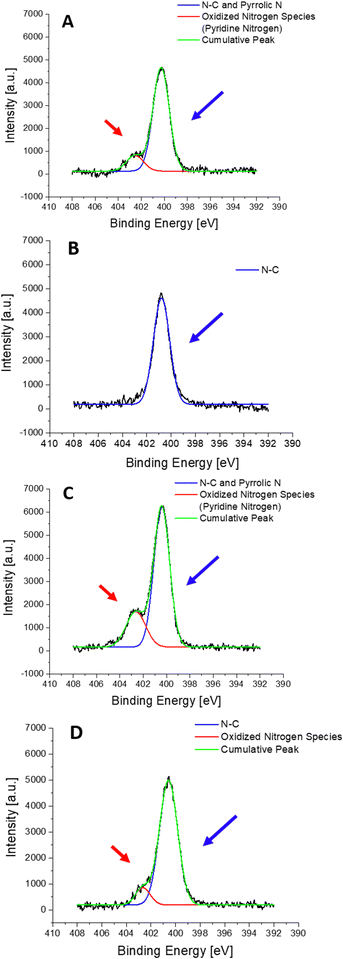
XPS measurements were performed for 4 different samples: (i) S-PEG-NTA–Ni-JAMF1-Sol, (ii) S-PEG-NTA–Ni-JAMF1-Sol-Ctrl (treatment with EDTA 10 mM), (iii) S-PEG-NTA–Ni-JAMF1-pNP and (iv) S-PEG-NTA–Ni-JAMF1-pNP-Ctrl (treatment with EDTA 100 mM). Nitrogen, sulfur, and oxygen were analyzed and their spectra deconvoluted, showing peaks, shifts and intensity relations that agree with the expected results, demonstrating successful protein immobilization.For the N 1s spectra (see Fig. 8 and Scheme 2), two peaks can be observed, one at 400–401 eV and another one at 402.5 eV. The peak at around 400–401 eV, which is observed for all the samples, corresponds to the N–C bond found in the NTA present in all the samples, but also in amino acids, and it is also attributed to ‘pyrrole-like nitrogen’ (typically assigned to peaks around 400.4 eV) present in histidine and tryptophan of the anchored proteins. Thus, samples presenting the His-tag, which in turn has imidazole groups that contain ‘pyrrole-like’ nitrogen, and the amino acid tryptophan, which also has ‘pyrrole-like’ nitrogen present this peak. Negative controls, which only have the NTA exposed on the surface, present N–C bonds and secondary amides and therefore, also present this peak. Also, amines and secondary amides present in the studied samples are attributed to the peaks with energies of 400.5 eV.
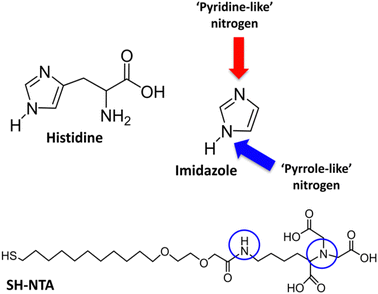 | ||
| Scheme 2 Representation of the different contribution to the nitrogen spectra: ‘pyrrole-like’ nitrogen (blue arrow and circles) and ‘pyridine-like’ amines (N–C) and secondary amides (red arrow). | ||
The peak at 402.5 eV is clearly observed in the samples with the protein (Fig. 8(A) and (C)) but for the negative controls, it is absent in Fig. 8(B) and it decreases in Fig. 8(D). This peak is assigned to pyridine-like nitrogen present in the His-tag and therefore only in the samples containing protein.
The S 2p spectra (Fig. S6, ESI†) show four peaks. The peak at 161.9 eV and the peak at around 162.8–163.4 eV are attributed to the split of the orbital 2p into the doublet 2p3/2 and 2p1/2, respectively. These peaks come from the thiol bond (S–Au) of the thiolated NTA chains to the gold surface, present in all samples. On the other hand, there are two more peaks, one at 168.5 eV and the other at around 169.7–171.8 eV, both corresponding to oxidized sulfur species, which can come from the thiol groups in the alkanethiols or from cysteine amino acids present in the antimicrobial proteins. These peaks only appear in the sample with immobilized protein, with this peak less intense in samples without protein (Fig. S6B, ESI†).
The O 1s spectra, shown in Fig. S6 (ESI†), present a big peak that can be deconvoluted in two. The peak at 532 eV corresponds to the C–O bond and the one at around 532.7–532.9 eV corresponds to the C![[double bond, length as m-dash]](https://www.rsc.org/images/entities/char_e001.gif) O bond. Besides, a peak at 537 eV is also observed with more intensity in the protein samples which is attributed to either adsorbed water, acetate species or oxygen species interacting with Ni. Therefore, it can be associated either to the presence of –COOH groups in the amino acids or to the interaction of oxygen and Ni in the chelating complexes. Both cases demonstrate the presence of His-tag and soluble protein/pNP, which is also confirmed by the fact that there is no peak in the S-PEG-NTA–Ni-JAMF1-Sol-Ctrl (Fig. S6(B), ESI†). The peak present in the negative control S-PEG-NTA–Ni-JAMF1-pNP-Ctrl (Fig. S7(D), ESI†) can be attributed to undesired oxidation due to the aging of the sample, which was analyzed three days after preparation. The ratio difference between the C–O and C
O bond. Besides, a peak at 537 eV is also observed with more intensity in the protein samples which is attributed to either adsorbed water, acetate species or oxygen species interacting with Ni. Therefore, it can be associated either to the presence of –COOH groups in the amino acids or to the interaction of oxygen and Ni in the chelating complexes. Both cases demonstrate the presence of His-tag and soluble protein/pNP, which is also confirmed by the fact that there is no peak in the S-PEG-NTA–Ni-JAMF1-Sol-Ctrl (Fig. S6(B), ESI†). The peak present in the negative control S-PEG-NTA–Ni-JAMF1-pNP-Ctrl (Fig. S7(D), ESI†) can be attributed to undesired oxidation due to the aging of the sample, which was analyzed three days after preparation. The ratio difference between the C–O and C![[double bond, length as m-dash]](https://www.rsc.org/images/entities/char_e001.gif) O peaks in the positive samples can be attributed to the differences between the soluble protein and pNP.
O peaks in the positive samples can be attributed to the differences between the soluble protein and pNP.
Antibiofilm activity assay
The antibiofilm activity assay showed that the JAMF1 multidomain antimicrobial protein in both soluble and pNP forms can significantly reduce biofilm formation (Fig. 9). S-PEG-NTA–Ni-Sol and S-PEG-NTA–Ni-pNP surfaces reduce E. coli survival up to 38% and 34%, respectively, showing that the strategy used to anchor the protein to the surface is highly promising. The same behavior is observed when S-PEG-NTA–Ni-pNP surfaces are used against an antibiotic-resistant KPC strain (Fig. 10), demonstrating that JAMF1 is also active against severe bacterial strains not responding to standard antibiotic treatments.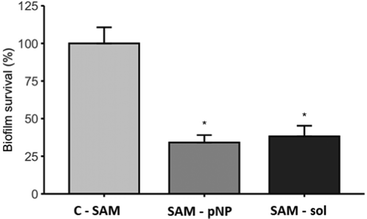 | ||
| Fig. 9 Biofilm formation ability (%) of E. coli DH5α on S-PEG-NTA-Ni-JAMF1-Sol and S-PEG-NTA-Ni-pNP. * indicates significant differences (p ≤ 0.05). | ||
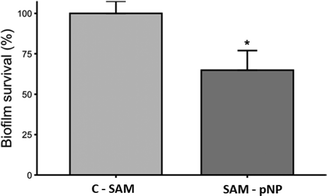 | ||
| Fig. 10 Biofilm formation ability (%) of KPC on S-PEG-NTA-Ni-pNP. * indicates significant differences (p ≤ 0.05). | ||
Although after the immobilization process of JAMF1 using SAMs, the activity of these molecule is slightly decreased compared to those proteins with no specific binding to the surface,10 the remaining activity is still high, which demonstrates that the strategy presented in this study is a promising approach for the design of materials with antimicrobial properties. Especially when the microorganism growth is observed in biofilm formation, this type of formation makes the microorganism more resistant, requiring up to 1000 times more antibiotic doses than in its soluble form.36 Furthermore, the strategy presented in this work, NTA–Ni interaction with His-tag, represents a platform for the immobilization of recombinant antimicrobial proteins produced with His-tag which can be easily exploited for the immobilization of other proteins.
Conclusions
Micropatterns of AMPs were successfully formed using the μCP technique through the NTA functionalization of gold surfaces assisted by a thiol group, combined with the His-tagged antimicrobial protein JAMF1, both in the soluble form and nanostructured as pNPs. The successful pattern formation not only was verified by fluorescence microscopy, but also by AFM and XPS measurements. This functionalization strategy was then applied to fully coated surfaces, demonstrating their effectiveness in preventing biofilm formation against E. coli. Specifically, the immobilized soluble and pNP forms reduced bacteria survival up to 38% and 34%, respectively. Moreover, the pNP surfaces also inhibited biofilm formation in a K. pneumoniae strain, which are unresponsive to standard antibiotic treatments. In conclusion, novel biofunctionalized surfaces with multidomain AMPs were developed and characterized in response to the need of new antimicrobial agents to overcome the antibiotic crisis, which could be applied to coat medical devices (e.g. catheters) or be incorporated into food packaging materials, among others.Abbreviations
| AFM | Atomic force microscopy |
| AMPs | Antimicrobial peptides |
| BHI | Brain heart infusion |
| BSA | Bovine serum albumin |
| CE | Counter electrode |
| CV | Cyclic voltammetry |
| HD5 | Human α-defensin-5 |
| IBs | Inclusion bodies |
| IMAC | Immobilized metal affinity chromatography |
| IPTG | Isopropyl-β-D-thiogalactoside |
| JAMF1 | Recombinant antimicrobial multidomain protein |
| KPC | Klebsiella pneumoniae |
| KPi | Potassium phosphate buffer |
| LB | Luria-Bertani |
| GFPH6 | His-tagged green fluorescent protein |
| Mixed SAMs | A mix of SH-PEG-NTA (%) and SH-PEG (%) on the self-assembled monolayers |
| NTA | Nitriloacetic acid |
| SAMs | Self-assembled monolayers |
| SH-PEG-NTA | NTA terminated tetra(ethylene glycol)-SAM |
| O/N | Overnight |
| PBS | Phosphate-buffered saline |
| PDMS | Polydimethylsiloxane |
| SH-PEG | ((1-Mercapto-11-undecyl)-(tetra(ethylene glycol)) |
| PEG | Polyethylene glycol |
| pNP | Protein nanoparticles |
| RE | Reference electrode |
| RT | Room temperature |
| S-NTA-Ni | NTA-Ni terminated SAMs |
| S-PEG-NTA-Ni-JAMF1-pNP | Mixed SAM with antimicrobial multidomain protein as inclusion bodies |
| S-PEG-NTA-Ni-JAMF1-Sol | Mixed SAM with soluble antimicrobial multidomain protein |
| S-PEG-NTA-Ni-mGFPH6 | His-tagged green fluorescent protein immobilized on SAMs |
| SAMs | Self-assembled monolayersSH-NTA, NTA terminated thiol |
| SH-PEG | Pegylated alkanethiol |
| sPLA2 | Group-XIIA secretory phospholipase A2 |
| WE | Working electrode |
| XPS | X-ray photoelectron spectroscopy |
| μCP | Microcontact printing |
Author contributions
The manuscript was written through contributions of all authors. All authors have given approval to the final version of the manuscript.Conflicts of interest
There are no conflicts to declare.Acknowledgements
This work has been developed under the Biochemistry and Biomedicine and Materials Science Program of Universitat Autònoma de Barcelona (UAB). The characterization has been performed by the ICTS ‘‘NANBIOSIS’’, more specifically by the Biomaterial Processing and Nanostructuring Unit (U6), Unit of CIBER-BBN located at ICMAB-CSIC. Authors are grateful for the financial support received from MICINN (PID2020-115296RA-I00 and PID2019–105622RB-I00), the Networking Research Center on Bioengineering, Biomaterials, and Nanomedicine (CIBER-BBN), GenCat (grant 2017-SGR-918, SGR Cat 2021-00438 and CERCA programme), the European Social Fund, and Fundació La Marató de TV3 (Nr. 201812). This project has received funding from the European Union's Horizon 2020 research and innovation program under the HORIZON-RIA project NABIHEAL (GA number 101092269), the Marie Skłodowska-Curie grant agreement No. 801342 (Tecniospring INDUSTRY) and the Government of Catalonia's Agency for Business Competitiveness (ACCIÓ; TECSPR19-1-0065). J.G. is grateful to MICINN for a ‘‘Ramón y Cajal’’ fellowship (RYC-2017-22614) as well as to the Max Planck Society through the Max Planck Partner Group “Dynamic Biomimetics for Cancer Immunotherapy” in collaboration with the Max Planck Institute for Medical Research (Heidelberg, Germany). R.R-P received a PhD fellowship from Secretaria d’Universitats i Recerca del Departament d’Economia i Coneixement de la Generalitat de Catalunya (AGAUR) and E.G-F a post-doctoral fellowship from INIA (DOC-INIA). ICMAB-CSIC acknowledges the support from the Severo Ochoa Programme for Centres of Excellence in R&D (FUNFUTURE, CEX2019-000917-S). Table of contents entry and Fig. 2 were designed with BioRender.com.References
- R. Smith and J. Coast, BMJ [Br. Med. J.], 2013, 346 Search PubMed.
- N. Goel, S. W. Fatima, S. Kumar, R. Sinha and S. K. Khare, Biotechnol. Rep., 2021, 30, e00613 CrossRef CAS PubMed.
- C. J. Murray, et al. , Lancet, 2022, 399, 629 CrossRef CAS PubMed.
- V. Nandakumar, S. Chittaranjan, V. M. Kurian and M. Doble, Polym. J., 2013, 45, 137 CrossRef CAS.
- R. M. Donlan and J. W. Costerton, Clin. Microbiol. Rev., 2002, 15, 167 CrossRef CAS.
- D. Sharma, L. Misba and A. U. Khan, Antimicrob. Res. Infec. Control, 2019, 76, 1 Search PubMed.
- S. L. Percival, L. Suleman, C. Vuotto and G. Donelli, J. Med. Microbiol., 2015, 64, 323 CrossRef PubMed.
- S. Srivastava and A. Bhargava, Biotechnol. Lett., 2016, 38, 1 CrossRef CAS.
- A. di Somma, A. Moretta, C. Canè, A. Cirillo and A. Duilio, Biomolecules, 2020, 10, 1 CrossRef.
- R. Roca-Pinilla, A. López-Cano, C. Saubi, E. Garcia-Fruitós and A. Arís, Microb. Cell Fact., 2020, 19, 122 CrossRef CAS PubMed.
- K. Yu, J. C. Y. Lo, M. Yan, X. Yang, D. E. Brooks, R. E. W. Hancock, D. Lange and J. N. Kizhakkedathu, Biomaterials, 2017, 116, 69 CrossRef CAS.
- F. Costa, S. Maia, J. Gomes, P. Gomes and M. C. L. Martins, Acta Biomater., 2014, 10, 3513 CrossRef CAS.
- F. M. T. A. Costa, S. R. Maia, P. A. C. Gomes and M. C. L. Martins, Biomaterials, 2015, 52, 531 CrossRef CAS.
- A. Rai, S. Pinto, M. B. Evangelista, H. Gil, S. Kallip, M. G. S. Ferreira and L. Ferreira, Acta Biomater., 2016, 33, 64 CrossRef CAS.
- F. Costa, I. F. Carvalho, R. C. Montelaro, P. Gomes and M. C. L. Martins, Acta Biomater., 2011, 7, 1431 CrossRef CAS.
- R. R. Silva, K. Avelino, K. L. Ribeiro, O. L. Franco, M. D. L. Oliveira and C. A. S. Andrade, Front. Biosci. Scholar, 2016, 1, 129 Search PubMed.
- Z. Wang, X. Han, N. He, Z. Chen and C. L. Brooks, J. Phys. Chem. B, 2014, 118, 5670 CrossRef CAS PubMed.
- V. Humblot, J. F. Yala, P. Thebault, K. Boukerma, A. Héquet, J. M. Berjeaud and C. M. Pradier, Biomaterials, 2009, 30, 3503 CrossRef CAS PubMed.
- C. Monteiro, F. Costa, A. M. Pirttilä, M. V. Tejesvi and M. C. L. Martins, Sci. Rep., 2019, 9, 10753 CrossRef PubMed.
- A. R. Kyvik, C. Luque-Corredera, D. Pulido, M. Royo, J. Veciana, J. Guasch and I. Ratera, J. Phys. Chem. B, 2018, 122, 4481 CrossRef CAS.
- M. Martínez-Miguel, A. R. Kyvik, L. M. Ernst, A. Martínez-Moreno, O. Cano-Garrido, E. García-Fruitós, E. Vazquez, N. Ventosa, J. Guasch, J. Veciana, A. Villaverde and I. Ratera, J. Mater. Chem. B, 2020, 8, 5080 RSC.
- O. Cano-Garrido, A. Sánchez-Chardi, S. Parés, I. Giró, W. I. Tatkiewicz, N. Ferrer-Miralles, I. Ratera, A. Natalello, R. Cubarsi, J. Veciana, A. Bach, A. Villaverde, A. Arís and E. Garcia-Fruitós, Acta Biomater., 2016, 43, 230 CrossRef CAS.
- W. I. Tatkiewicz, J. Seras-Franzoso, E. García-Fruitós, E. Vazquez, A. R. Kyvik, N. Ventosa, J. Guasch, A. Villaverde, J. Venciana and I. Ratera, ACS Biomater. Sci. Eng., 2019, 5, 10 Search PubMed.
- M. Martínez-Miguel, W. Tatkiewicz, M. Köeber, N. Ventosa, J. Venciana, J. Guasch and I. Ratera, Methods Mol. Biol., 2022, 2406, 479 CrossRef PubMed.
- M. Martínez-Miguel, W. Tatkiewicz, M. Köeber, N. Ventosa, J. Venciana, J. Guasch and I. Ratera, Methods Mol. Biol., 2022, 2406, 517 CrossRef PubMed.
- Š. Peternel, J. Grdadolnik, V. Gaberc-Porekar and R. Komel, Microb. Cell Fact., 2008, 7, 1 CrossRef PubMed.
- U. Unzueta, M. V. Céspedes, N. Ferrer-Miralles, I. Casanova, J. Cedano, J. L. Corchero, J. Domingo-Espín, A. Villaverde, R. Mangues and E. Vázquez, Int. J. Nanomed., 2012, 7, 4533 CAS.
- L. Shi, Y. Wu, C. Yang, Y. Ma, Q. Zhang, W. Huang, X. Zhu, Y. Yan, J. Wang, T. Zhu, D. Qu, C. Zheng and K. Zhao, Sci. Rep., 2019, 9, 20243 CrossRef CAS PubMed.
- Y. Shai, Biochim. Biophys. Acta, 1999, 1462, 55 CrossRef CAS PubMed.
- M. C. Bellissent-Funel, A. Hassanali, M. Havenith, R. Henchman, P. Pohl, F. Sterpone, D. van der Spoel, Y. Xu and A. E. Garcia, Chem. Rev., 2016, 116, 7673 CrossRef CAS PubMed.
- A. R. Bizzarri and S. Cannistraro, J. Phys. Chem. B, 2002, 106, 6617 CrossRef CAS.
- J. W. Bye, S. Meliga, D. Ferachou, G. Cinque, J. A. Zeitler and R. J. Falconer, J. Phys. Chem. A, 2014, 118, 83 CrossRef CAS PubMed.
- E. Nagao and J. A. Dvorak, Biophys. J., 1999, 76, 3289 CrossRef CAS PubMed.
- S. N. Magonov, V. Elings and M. H. Whangbo, Surface Sci. Lett., 1997, 375, L385 CrossRef CAS.
- J. Tamayo and R. García, Langmuir, 1996, 12, 4430 CrossRef CAS.
- M. Kazemzadeh-Narbat, B. F. L. Lai, C. Ding, J. N. Kizhakkedathu, R. E. W. Hancock and R. Wang, Biomaterials, 2013, 34, 5969 CrossRef CAS PubMed.
Footnote |
| † Electronic supplementary information (ESI) available. See DOI: https://doi.org/10.1039/d2ma00978a |
| This journal is © The Royal Society of Chemistry 2023 |

