 Open Access Article
Hierarchical cathode constructed by carbon coated Na3.5VMn0.5Cr0.5(PO4)3 nanoparticles on rGO for high-capacity and long-cycle life sodium storage†
Jinhao
Wang
,
Longzhu
Zhao
and
Fengqi
Lu
 *
*
Key Laboratory of New Processing Technology for Nonferrous Metal & Materials Ministry of Education, Guangxi Key Laboratory of Optical and Electronic Materials and Devices, College of Materials Science and Engineering, Guilin University of Technology, Guilin, 541004, P. R. China. E-mail: lufengqi@glut.edu.cn
First published on 30th March 2023
Abstract
Mn-substituted NASICON-type Na3+xMnxV2−x(PO4)3 compounds have been extensively studied as desirable cathode materials for sodium-ion batteries (SIBs) due to their higher operating voltage, low cost and weak biological toxicity compared with Na3V2(PO4)3. However, they present limited reversible capacity and cycling properties originating from the low electronic conductivity and irreversible phase transition caused by the Jahn–Teller active Mn3+. Herein, the electronic conductivity and structural stability of the material are ameliorated by constructing a double-carbon-layer hierarchical structure and substitution of Mn by Cr. As expected, the unique hierarchical Na3.5VMn0.5Cr0.5(PO4)3@C/rGO electrode demonstrates excellent sodium-ion storage properties, consisting of a 2.4-electron redox reaction, high energy density (472 W h kg−1), cycling performance with 94.7% capacity retention after 1600 cycles at 10C, along with a retention of 81% after 8000 cycles at 20C. Moreover, the full cell based on the Na3.5VMn0.5Cr0.5(PO4)3@C/rGO cathode and hard carbon anode demonstrates a reversible capacity of 119 mA h g−1 with an energy density of 405.8 W h kg−1 at 0.2C, and a high capacity retention ratio of 94.6% at 1C after 200 cycles. Such dual-carbon hierarchical engineering will facilitate the application of NASICON-type cathodes in sodium ion batteries for grid-scale energy storage systems.
Introduction
Sodium-ion batteries (SIBs) are considered to be ideal contenders for grid-scale stationary energy storage devices.1–5 To date, hard carbon (HC) may be the most suitable candidate anode for SIBs, owing to its low cost and abundance.6,7 As a key component, the properties of the cathode have a significant effect on the total performance of the battery.8–11 However, bottlenecks still exist in the energy density and cyclability of cathode materials.12–15 Thus, enhancing the cathode material working voltage, practical capacities and cyclability remain a critical prerequisite to design high-performance SIBs. However, there are still enormous challenges to overcome these bottlenecks.16 Various types of compounds, including transition-metal oxides, Prussian blue analogs and polyanion compounds, have been extensively investigated as cathode materials for SIBs.17–22 Among these material candidates, Na3V2(PO4)3, which belongs to polyanion compounds with a Na super ionic conductor (NASICON) structure, has great potential for application in SIBs owing to its high operating voltage, open framework for facilitating Na ion mobility, thermodynamic stability and high safety.23–29Regrettably, it faces extreme constrictions owing to limited vanadium (V) abundance, relatively high cost and high biological toxicity. To reduce the content of V and toxicity, as well as increase the energy density and operating voltage, various transition metal ions, such as Mn2+, Fe2+/Fe3+, Cr3+, Ti4+ and Zr4+, are used to replace V3+.30–38 In 2016, Goodenough reported on the use of NaxMV(PO4)3 (M = Mn, Fe, Ni) to enhance the working potential of the cathode by the modification of V4+/V3+, Mn3+/Mn2+, and Fe3+/Fe2+ redox centers.39 Afterwards, the Na4MnCr(PO4)3/C cathode was prepared and displayed a high output potential of about 3.53 V and a three-electron reaction (Mn2+/Mn3+, Mn3+/Mn4+ and Cr3+/Cr4+ couples) presenting a high specific energy of about 566 W h kg−1.40 Lavela et al. unveiled the effect of Cr substitution to enhance the behavior of Na4MnV(PO4)3 at high voltages and improve sodium diffusivity, leading to a net gain in the reversible extraction and low interface resistance for high substitution content (>0.6).41 Nevertheless, the cycling stabilities of Mn-based NASICON-type cathodes are sacrificed because the Jahn–Teller effect of Mn(III) seems to be inevitable during the whole reaction. Therefore, it is highly desirable but remains a big challenge to further develop a synergic strategy to inhibit the Jahn–Teller effect and improve the cycling durability of Mn-based NASICON-type cathodes.
Herein, we investigate the effects of Cr ion substitution on the crystal structure distortion and electrochemical performance of the NASICON-type Na3.5VMn0.5Cr0.5(PO4)3 cathode. A hierarchical structure incorporated with a double-carbon strategy is utilized to enhance the electronic conductivity and conductivity/ionic diffusion capability. As a result, the as-prepared Na3.5VMn0.5Cr0.5(PO4)3@C/rGO demonstrates a 2.4-electron redox reaction from V3+/V4+, Mn2+/Mn3+ and V4+/V5+ redox couples, leading to a high reversible capacity (136 mA h g−1 at 0.2C and 75.8 mA h g−1 at 20C) and high cycling retention (94.7% after 1600 cycles at 10C and 81% after 8000 cycles at 20C). Benefiting from the excellent electrochemical properties of VMC@C/rGO, the VMC@C/rGO//HC full cell realizes a desired energy density of 405.8 W h kg−1. This hierarchical engineering will shed light on the reasonable construction of a NASICON-structural cathode with high-energy for SIBs.
Experimental
Sample synthesis
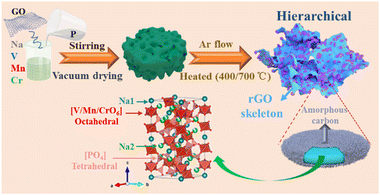
The hierarchical Na3.5VMn0.5Cr0.5(PO4)3@C/rGO (VMC@C/rGO) composite was synthesized via a sol–gel route, followed by an annealing calcination (Scheme 1). Graphene oxide (GO) was firstly prepared by Hummers’ method42 and dispersed in deionized water under sonication. Next, CH3COONa, Mn(CH3COO)2·4H2O, Cr(CH3COO)3, V2O5 and NH4H2PO4 were mixed in 60 mL deionized water with the molar ratios corresponding to the target chemical formula at 60 °C for 2 h. After adding the graphene oxide solution, the mixed solution was dried under stirring at 90 °C to a gel and vacuum-dried overnight. Finally, the dried-precursor was calcined at 400 °C for 2 h, followed by 700 °C for 6 h in an Ar atmosphere to generate the VMC@C/rGO composite. As compared, the Na3.5VMn0.5Cr0.5(PO4)3@C (VMC@C) sample was prepared using the same process without GO.Sample characterization
The powder X-ray diffraction pattern (XRD) data were recorded by a PANalytical EMPYREAN X-Ray Diffractometer with Cu Kα radiation (1.5418 Å). Rietveld refinements were performed using TOPAS-Academic. A thermogravimetric analyzer (TG, STA8000) was used to determine the carbon and rGO contents. The morphologies and microstructures of the powder samples were characterized by scanning electron microscope (SEM, ZEISS Sigma) and transmission electron microscopy (TEM, JEM2010-HR). The Raman spectra were recorded using the Laser Micro-Raman Spectrometer DXR series. The surface area and the pore-size distributions of the samples were tested and calculated using nitrogen adsorption and desorption isotherm measurements (TriStar II 3020). The elemental compositions of the samples were characterized via inductively coupled plasma-optical emission spectroscopy (ICP-OES) analysis using a PerkinElmer Optima 8000 analyzer.Electrochemical measurements
The working electrodes consisted of the active material, conductive carbon black, and polyvinylidene fluoride (PVDF) binder (7![[thin space (1/6-em)]](https://www.rsc.org/images/entities/char_2009.gif) :
:![[thin space (1/6-em)]](https://www.rsc.org/images/entities/char_2009.gif) 2
2![[thin space (1/6-em)]](https://www.rsc.org/images/entities/char_2009.gif) :
:![[thin space (1/6-em)]](https://www.rsc.org/images/entities/char_2009.gif) 1) to form the electrode slurry in N-methyl-2-pyrrolidone (NMP). The obtained slurry was coated on an Al foil, then dried under vacuum at 100 °C overnight. The mass loading of the active material was roughly 2 ± 0.2 mg cm−2. The hard carbon (HC) electrode was prepared with the ratio of 8
1) to form the electrode slurry in N-methyl-2-pyrrolidone (NMP). The obtained slurry was coated on an Al foil, then dried under vacuum at 100 °C overnight. The mass loading of the active material was roughly 2 ± 0.2 mg cm−2. The hard carbon (HC) electrode was prepared with the ratio of 8![[thin space (1/6-em)]](https://www.rsc.org/images/entities/char_2009.gif) :
:![[thin space (1/6-em)]](https://www.rsc.org/images/entities/char_2009.gif) 1
1![[thin space (1/6-em)]](https://www.rsc.org/images/entities/char_2009.gif) :
:![[thin space (1/6-em)]](https://www.rsc.org/images/entities/char_2009.gif) 1 by a similar process. Glass fiber (GF/D, Whatman) was used as the separator, and sodium metal was used as the counter electrode. Coin cells (CR2032) were assembled in a glove box filled with pure Ar and aged overnight before testing. The galvanostatic charge–discharge process and the galvanostatic intermittent titration technique (GITT) were carried out on a Neware battery test system (CT-4008T-5V10mA-164, Shenzhen Neware Co., Ltd, China). Cyclic voltammetry (CV) and (EIS) measurements were performed on an electrochemical workstation (CHI760E, Chenhua, Shanghai, China).
1 by a similar process. Glass fiber (GF/D, Whatman) was used as the separator, and sodium metal was used as the counter electrode. Coin cells (CR2032) were assembled in a glove box filled with pure Ar and aged overnight before testing. The galvanostatic charge–discharge process and the galvanostatic intermittent titration technique (GITT) were carried out on a Neware battery test system (CT-4008T-5V10mA-164, Shenzhen Neware Co., Ltd, China). Cyclic voltammetry (CV) and (EIS) measurements were performed on an electrochemical workstation (CHI760E, Chenhua, Shanghai, China).
Results and discussions
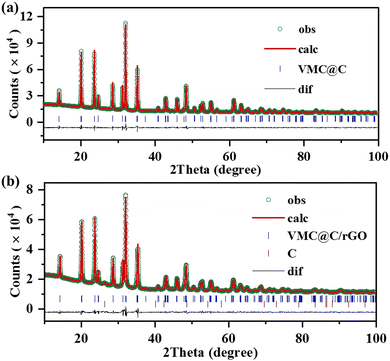
The crystal structures of the as-synthesized VMC@C and VMC@C/rGO were characterized by X-ray diffraction (XRD) measurement, and the XRD data were refined by the Rietveld method (Topas V4 program). The refined results of the VMC@C and VMC@C/rGO samples are displayed in Fig. 1. The refinement reliability factors are shown in Table S1 (ESI†), and the detailed structural information of the atom positions and occupancies of VMC@C/rGO are exhibited in Table S2 (ESI†). Both VMC@C and VMC@C/rGO samples have a rhombohedral NASICON structure with the space group of R![[3 with combining macron]](https://www.rsc.org/images/entities/char_0033_0304.gif) c. However, some new peaks are detected in VNM@C/rGO, which are characteristic of graphitized carbon. The refined lattice parameters of VMC@C/rGO are a = 8.8032(2) Å, c = 21.7323(7) Å, V = 1460.22(9) Å3. V, Mn and Cr atoms are located at the same site of 12c. The V/Mn/CrO6 octahedra and PO4 tetrahedra share common O corners to build a robust 3D framework. Both sodium sites, six-fold coordinated Na1 (6b) and eight-fold coordinated Na2 (18e), are occupied with the occupancy of 1 and 0.855, respectively, further confirming the stoichiometry of Na3.5VMn0.5Cr0.5(PO4)3.
c. However, some new peaks are detected in VNM@C/rGO, which are characteristic of graphitized carbon. The refined lattice parameters of VMC@C/rGO are a = 8.8032(2) Å, c = 21.7323(7) Å, V = 1460.22(9) Å3. V, Mn and Cr atoms are located at the same site of 12c. The V/Mn/CrO6 octahedra and PO4 tetrahedra share common O corners to build a robust 3D framework. Both sodium sites, six-fold coordinated Na1 (6b) and eight-fold coordinated Na2 (18e), are occupied with the occupancy of 1 and 0.855, respectively, further confirming the stoichiometry of Na3.5VMn0.5Cr0.5(PO4)3.
The morphologies of VMC@C and VMC@C/rGO were observed by SEM. The SEM image in Fig. 2a shows that the particles comprising the VMC@C samples assemble together with irregularity in shapes ranging from 200 to 500 nm. Fig. 2b and c reveals that the VMC@C particles are independent particles and tightly attach onto the surface of rGO in the VMC@C/rGO composite. This special hierarchical structure matrix could offer 3D pathways for fast electronic conductivity.43 The microstructure of VMC@C/rGO was further characterized by TEM. The TEM images (Fig. 2d and Fig. S1, ESI†) reveal that VMC particles with 200–400 nm scale are embedded in the carbon matrix. Such a composite architecture could guarantee the facilitated reaction kinetics involved in fast Na ion migration and favorable electron conduction. Furthermore, the (HRTEM) image (Fig. 2e) presents that the exterior surface of the Na3.5VMn0.5Cr0.5(PO4)3 particle is coated with a thin amorphous carbon layer (about 2.5 nm), which is derived from the pyrolysis of citric acid. Two distinguishable interplanar spacings of 0.62 nm and 0.37 nm match well with the (10![[2 with combining macron]](https://www.rsc.org/images/entities/char_0032_0304.gif) ) and (2
) and (2![[1 with combining macron]](https://www.rsc.org/images/entities/char_0031_0304.gif) 3) planes of the trigonal NASICON structure, respectively. The typical NASICON rhombohedral structure of VMC@C/rGO was further confirmed by SAED plot (Fig. 2f), which also indicates a high crystallinity of the as-prepared VMC@C/rGO compound. The EDS mapping images (Fig. 2g–m) show that the Na, V, Mn, Cr, P, O, and C elements are uniformly distributed in the particles. The ratio of the Na
3) planes of the trigonal NASICON structure, respectively. The typical NASICON rhombohedral structure of VMC@C/rGO was further confirmed by SAED plot (Fig. 2f), which also indicates a high crystallinity of the as-prepared VMC@C/rGO compound. The EDS mapping images (Fig. 2g–m) show that the Na, V, Mn, Cr, P, O, and C elements are uniformly distributed in the particles. The ratio of the Na![[thin space (1/6-em)]](https://www.rsc.org/images/entities/char_2009.gif) :
:![[thin space (1/6-em)]](https://www.rsc.org/images/entities/char_2009.gif) V
V![[thin space (1/6-em)]](https://www.rsc.org/images/entities/char_2009.gif) :
:![[thin space (1/6-em)]](https://www.rsc.org/images/entities/char_2009.gif) Mn
Mn![[thin space (1/6-em)]](https://www.rsc.org/images/entities/char_2009.gif) :
:![[thin space (1/6-em)]](https://www.rsc.org/images/entities/char_2009.gif) Cr metal elementals was determined to be 3.55
Cr metal elementals was determined to be 3.55![[thin space (1/6-em)]](https://www.rsc.org/images/entities/char_2009.gif) :
:![[thin space (1/6-em)]](https://www.rsc.org/images/entities/char_2009.gif) 1
1![[thin space (1/6-em)]](https://www.rsc.org/images/entities/char_2009.gif) :
:![[thin space (1/6-em)]](https://www.rsc.org/images/entities/char_2009.gif) 0.5
0.5![[thin space (1/6-em)]](https://www.rsc.org/images/entities/char_2009.gif) :
:![[thin space (1/6-em)]](https://www.rsc.org/images/entities/char_2009.gif) 0.49 by ICP-OES analysis, which is consistent with the designed stoichiometric ratio of the Na3.5VMn0.5Cr0.5(PO4)3 composition.
0.49 by ICP-OES analysis, which is consistent with the designed stoichiometric ratio of the Na3.5VMn0.5Cr0.5(PO4)3 composition.
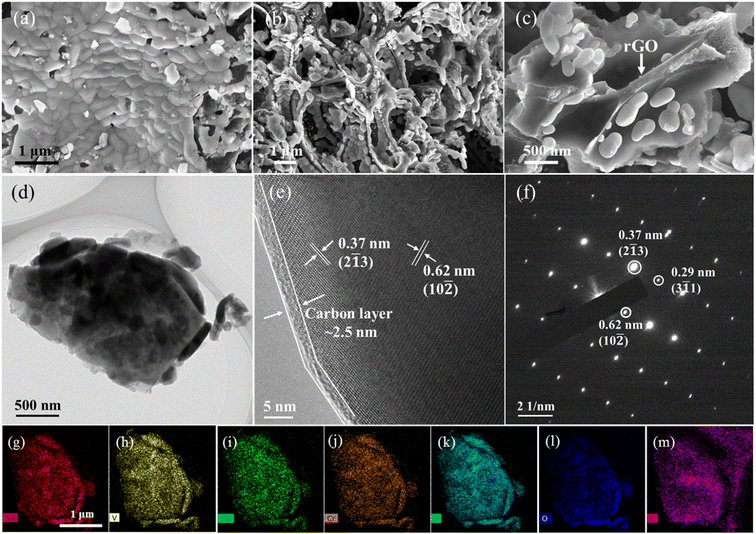 | ||
| Fig. 2 (a) SEM image of VMC@C. (b and c) SEM images, (d) TEM image, (e) HR-TEM image, (f) SAED plot, (g–m) elemental mappings of Na (g), V (h), Mn (i), Cr (j), P (k), O (l), and C (m) of VMC@C/rGO. | ||
The carbon contents of the VMC@C and VMC@C/rGO samples are calculated as 12.8% and 15.4% by thermogravimetric analysis (Fig. S2, ESI†), respectively. Raman spectra (Fig. S3, ESI†) were used to research the nature of the carbon materials in VMC@C and VMC@C/rGO. Two broad peaks located at 1334 cm−1 and 1598 cm−1 can be ascribed to the D-band (defects in the graphite structure) and G-band (graphite carbon) of the carbon materials, respectively.44–48 A high intensity ratio of the G-band and D-band for VMC@C/rGO (IG/ID = 1.13) indicates higher graphitized electronic conductivity than that of VMC@C (IG/ID = 0.98), which can be attributed to the highly graphitized rGO skeleton. Next, the nitrogen adsorption–desorption technique was utilized to characterize the specific surface area and pore structure of the composites (Fig. S4, ESI†). According to the Brunauer–Emmett–Teller (BET) method, the surface area of VMC@C/rGO is measured as 179 m2 g−1, which is much higher than that of VMC@C (127 m2 g−1). The Barrett–Joyner–Halenda (BJH) pore size distribution curves (the inset) reveal that the majority pore size in VMC@C and VMC@C/rGO are both about 4 nm. The high surface area and abundant pores are supposed to greatly enhance the high surface wettability, and result in a full utilization of the active material.
Electrochemical performances of the as-prepared cathodes were investigated by half coin-cells with sodium metal as anodes. The CV curves of VMC@C and VMC@C/rGO at a scan rate of 0.2 mV s−1 are shown in Fig. S5a (ESI†) and Fig. 3a. One couple of redox peaks in the CV curves of VMC@C and VMC@C/rGO centered at about 3.4/3.6 V are associated with the V3+/V4+ and Mn2+/Mn3+ redox couples, respectively. Moreover, there is a weak reversible redox peak of the V4+/V5+ redox couple located at about 4 V in the VMC@C/rGO electrode,49 which is verified by dQ/dV curve (inset of Fig. 3b) and absent in the VMC@C electrode. This phenomenon should be related to the conductance of the material. After innovation, the rGO conductive matrix in VMC@C/rGO can facilitate electron transfer, and the unique hierarchical structure can also shorten the migration path of Na+ during the redox reaction, thereby triggering the partial oxidation of V4+ to V5+.43,50
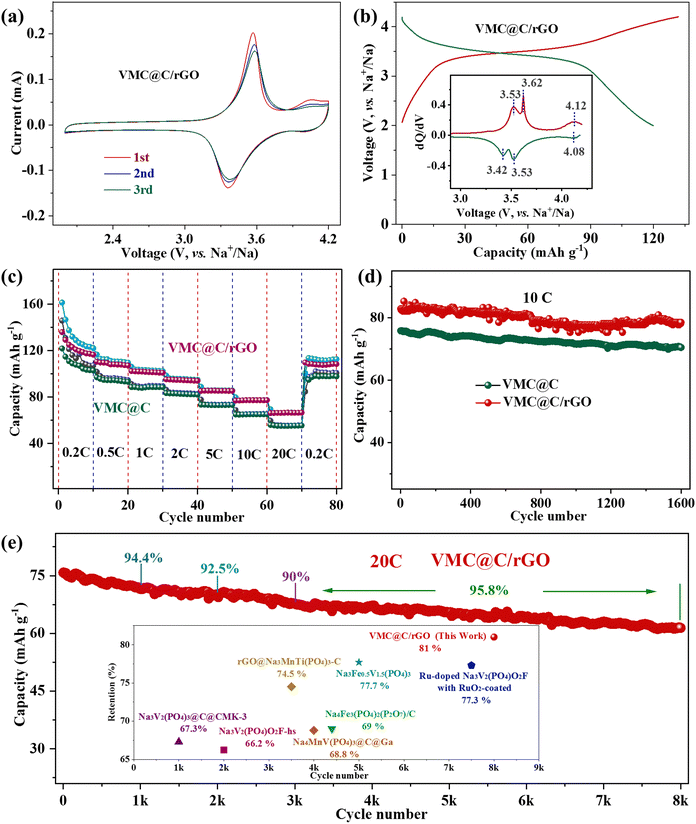 | ||
| Fig. 3 Electrochemical properties of the VMC@C and VMC@C/rGO cathodes. (a) CV curves of VMC@C/rGO. (b) Charge/discharge profile of VMC@C/rGO at 0.2C; the inset is the corresponded dQ/dV plot. (c) Rate capabilities from 0.2 to 20C. (d) Cycling performance at 10C. (e) Cycling performance of VMC@C/rGO at the high rate of 20C; inset compared with the long cycling stability of other NASICON-type cathodes, Na3V2(PO4)3@C@CMK-3,54 Na3V2(PO4)O2F-hs,55 rGO@Na3MnTi(PO4)3-C,56 Na4MnV(PO4)3@C@Ga,57 Na4Fe3(PO4)2(P2O7)/C,58 Na3Fe0.5V1.5(PO4)3,59 Ru-doped Na3V2(PO4)O2F with RuO2-coating.60 | ||
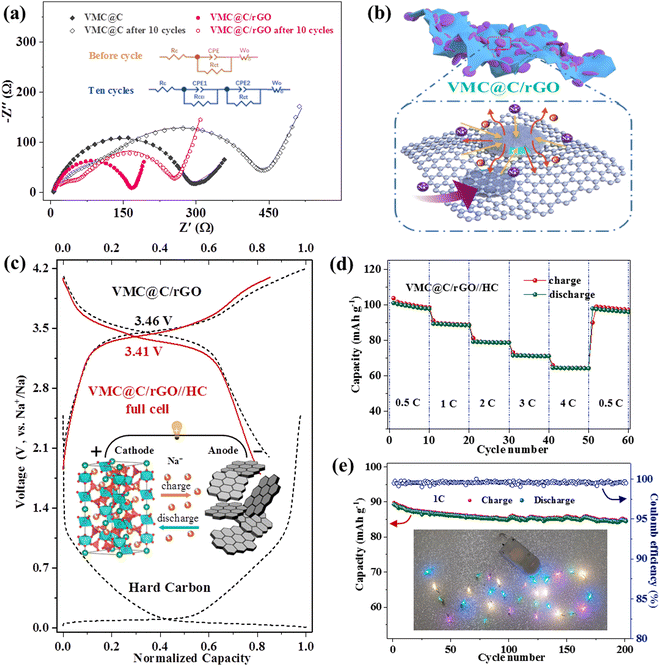
The rate capabilities of the VMC@C and VMC@C/rGO electrodes were characterized via galvanostatic testing at variable current densities from 0.2 to 20C in the voltage range of 2.0–4.2 V. In the charge–discharge profiles, both VMC@C (Fig. S5b, ESI†) and VMC@C/rGO (Fig. 3b) electrodes displayed similar correlative voltage plateaus with the above CV study. Three pairs of redox potentials at 3.42/3.53, 3.53/3.62, and 4.08/4.12 V are discovered in the dQ/dV plot of VMD@C/rGO (inset in Fig. 3b). The redox peaks correspond to the V3+/V4+ and Mn2+/Mn3+, and V4+/V5+ redox. Additionally, one irreversible oxidation peak is located at 4.11 V in the dQ/dV plot of VMC@C (inset of Fig. S5b, ESI†), which could be ascribed to the consumption of the electrolyte to yield the cathode electrolyte interphase (CEI) film.51 The VMC@C/rGO displays the initial discharge capacity of 136 mA h g−1 with a working voltage of 3.47 V. This capacity corresponds to a 2.4-electron redox reaction per cell unit, which is larger than the transfer number of Na3V2(PO4)3.52 Compared with VMC@C, the rate capability of VMC@C/rGO has greatly improved. The VMC@C/rGO electrode (Fig. 3c) can deliver a remarkable average revisable capacity of 122.4, 108.6, 101.6 94.6, 85.3 and 77.1 mA h g−1 from 0.2 to 10C. Even at the ultra-high rate of 20C, it is still able to display an average discharge capacity of 66.3 mA h g−1. When the current density shifts to 0.2C from 20C, the reversible capacity returns to 108.3 mA h g−1. However, VMC@C shows a much lower specific capacity under various current densities and only 55.3 mA h g−1 is obtained at 20C, indicating that the introduction of rGO is beneficial to the sodium storage capability of VMC@C/rGO. Moreover, the capacities of the electrodes slowly decay at the rate of 0.2C (Fig. 3c). This could be ascribed to the irreversible phase transition and the decomposition of the electrolyte to form the CEI film in the high voltage region,41 which could be verified by electrochemical impedance spectroscopy (EIS).
Next, the cycling stability of the electrodes was also explored. As shown in Fig. 3d, VMC@C/rGO shows excellent long-term cycling stability at a high rate of 10C with a stable capacity of 78.5 mA h g−1 even after 1600 cycles, corresponding to the capacity retention of 94.7%. Impressively, Fig. 3e shows that the VMC@C/rGO sample can deliver an initial capacity of 75.8 mA h g−1 at the ultrahigh rate of 20C and maintains a remarkable capacity of 61.4 mA h g−1 after 8000 cycles with the capacity retention of 81%, corresponding to a decay percentage of 0.0024% per cycle. It should be noted that the electrode can retain a capacity retention of 90% over 3000 cycles. The latter performance after 5000 cycles demonstrates excellent cycling stability, with a capacity retention of 95.8%. Compared with other NASICON-type cathode materials (inset in Fig. 3e and Table S3, ESI†), VMC@C/rGO exhibits the most beneficial cyclic stability in long cycles, which is closely linked to the special hierarchical structure matrix modification by rGO.
To further verify the underlying reasons behind the improved electrochemical performances of the VMC@C/rGO electrode, GITT was conducted to compare the kinetic behaviors of the VMC@C and VMC@C/rGO electrodes. The DNa+ of the VMC@C and VMC@C/rGO electrodes during the whole sodium insertion/extraction process were firstly characterized by GITT (Fig. S7, ESI†). During the GITT process, a current density of 0.1C was applied for 30 minutes to the electrode to control the Na-ion insertion and extraction, following by a relaxation process lasting for 120 minutes. The apparent Na-ion diffusion coefficient (DNa+) values were calculated using the equation:
| DNa+ = (4/πτ)(mBVm)/(MBS)2(ΔEs)/(ΔEτ)2 (τ ≤ I2/D) | (1) |
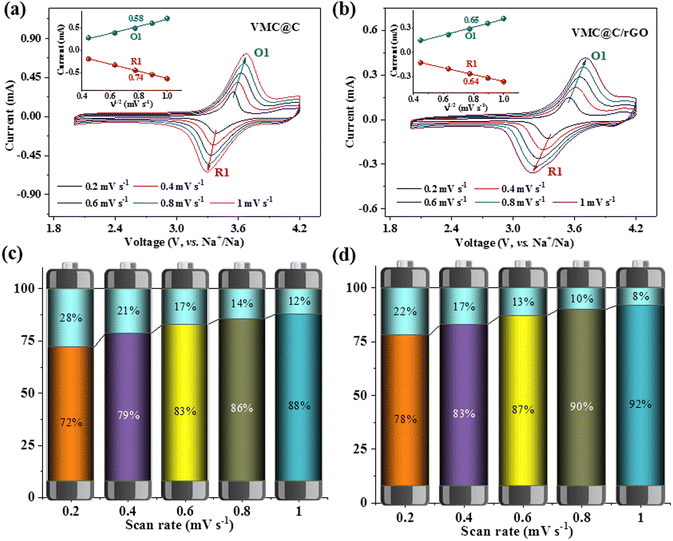
In general, there are two forms of charge storage behaviors toward an electrode material, one is a diffusion-controlled reaction, and the other one is the pseudo-capacitance. To expose the charge storage mechanism of the as-prepared samples, cyclic voltammetry (CV) curves were collected from 0.2 to 1 mV s−1. As displayed in Fig. 4a and b, the slight shifting of the cathodic/anodic peaks and well-preserved CV shapes show the weak voltage polarization and excellent electrochemical reversibility. The diffusion-dominated and capacitive-controlled capacities can be quantitatively calculated from the CV data. The current response (I) at a fixed potential (V) can be described as a function of the scan rate (v), and the equation can be written as:53
| I = avb | (2) |
| I (V) = k1v + k2v1/2 | (3) |
Furthermore, the Na+ diffusion coefficient (DNa+) can be calculated by the Randles–Sevcik equation based on the different CV scan rates.
| Ip = 2.69 × 10⁵n3/2ACoD1/2ν1/2 | (4) |
| DNa+ = R2T2/2n2A2Co2F4σω2 | (5) |
The excellent sodium storage properties of VNC@C/rGO, including high reversible capacity, stable cycling performance and remarkable rate capability, can be attributed to the following reasons and as illustrated in Fig. 5b. Firstly, the amorphous carbon tightly coated on surface of Na3.5VMn0.5Cr0.5(PO4)3 nanoparticles not only enhances the intrinsic electronic conductivity of Na3.5VMn0.5Cr0.5(PO4)3, but also shortens the diffusion distance of sodium ions during the Na+ insertion/de-insertion process.64,65 Second, the rGO skeleton acts as a conductive array, resulting in improved electrochemical reactivity and reversibility. Third, this nanoparticles-on-channel hierarchical structure not only affords a large the electrode/electrolyte contact area for the Na+ ion diffusion and tunnel, but also provides adequate space as a Na+ ion reservoir and for volume expansion during continuous charging/discharging. The V element also provides most of the capacity contribution. Mn not only provides part of the capacity, but also improves the working voltage.39 Cr substitution could decrease the energy barriers for Na+ ion migration and enhance the structural stability.36,66 Lastly, benefiting from the reasonably designed hierarchical nanostructure and synergistic effect of the doping element, the VMC@C/rGO material exhibits excellent sodium storage properties.
To further evaluate the practicability of the VMC@C/rGO cathode material in SIBs, we fabricated the coin-type sodium ion full cell using HC as an anode material, written as VMC@C/rGO//HC, and shown in Fig. 5c. Before assembling the full cell, the HC anode first underwent three cycles to reduce the dramatic initial irreversible capacity loss. The cycle performance of the HC electrode from the fourth cycle is shown in Fig. S8 (ESI†). The electrochemical properties of the full cells were studied in the range of 1.8–4.1 V at room temperature. As shown in Fig. 5c, the VMC@C/rGO//HC full cell exhibits an operating potential of 3.41 V with the reversible capacity of 119 mA h g−1 at 0.2C, and consequential energy density of 405.8 W h kg−1. Fig. 5d shows the rate capability of the VMC@C/rGO//HC full cell ranging from 0.5 to 4C. The obtained average specific capacities were 99.1, 88.8, 78.8, and 64.3 mA h g−1 at the rates of 0.5, 1, 2 3 and 4C, respectively. It can recover to 96.8 mA h g−1 when the rate returns to 0.5C. The lifespan of the full cell was evaluated under 1C (Fig. 5e). The reversible capacity is retained at 84.5 mA h g−1 after 200 cycles, corresponding to the capacity retention ratio of 94.6%, and the Coulombic efficiency is kept at above 99% during the whole cycling, indicating the excellent cycling stability of the VMC@C/rGO//HC full cell. Furthermore, two full cells connected in series can light up a 30 LED lights band in parallel with ‘VMC’ letters. Thus, our study confirms the potential of the hierarchical-structure Na3.5VMn0.5Cr0.5(PO4)3 cathode for use in energy storage devices.
Conclusions
In summary, bivalent Mn and trivalent Cr element were explored to replace half of V in Na3V2(PO4)3 to design a new NASICON-type Na3.5VMn0.5Cr0.5(PO4)3 cathode material. To overcome the drawback of inferior diffusion dynamics, a dual-carbon hierarchical Na3.5VMn0.5Cr0.5(PO4)3@C/rGO material was successfully fabricated via a sol–gel procedure. Benefiting from the reasonably designed hierarchical nanostructure and synergistic effect, Na3.5VMn0.5Cr0.5(PO4)3@C/rGO exhibits superior sodium storage capability. It can achieve a high energy density of 472 W h kg−1 at 0.2C, and a high capacity retention of 81% after 8000 cycles at 20C. The VMC@C/rGO//HC full cell also exhibits a high energy density of 405.8 W h kg−1 at 0.2C and excellent cycling stability (94.6% at 1C after 200 cycles). Furthermore, the nanoparticles-on-channel hierarchical-structure and cation substitution strategy illustrated in this work can be potentially applied to other high-performances NASIOCN-based cathode materials for SIBs.Author contributions
Jinhao Wang: experiment, investigation, conceptualization, writing – original draft, funding acquisition. Longzhu Zhao: material preparation, investigation. Fengqi Lu: funding acquisition, conceptualization, writing – review &editing.Conflicts of interest
There are no conflicts to declare.Acknowledgements
This work was financially supported by the National Natural Science Foundation of China (No. 22269006), Guangxi Natural Science Foundation (No. 2020GXNSAA159005) and Guangxi BaGui Scholars Special Funding.Notes and references
- H. Li, M. Xu, Z. Zhang, Y. Lai and J. Ma, Adv. Funct. Mater., 2020, 30, 2000473 CrossRef CAS.
- C. Delmas, Adv. Energy Mater., 2018, 8, 1703137 CrossRef.
- Y. You and A. Manthiram, Adv. Energy Mater., 2017, 8, 1701785 CrossRef.
- J. Zhang, D. W. Wang, W. Lv, L. Qin, S. Niu, S. Zhang, T. Cao, F. Kang and Q. H. Yang, Adv. Energy Mater., 2018, 8, 1801361 CrossRef.
- H. J. Liang, Z. Y. Gu, X. X. Zhao, J. Z. Guo, J. L. Yang, W. H. Li, B. Li, Z. M. Liu, W. L. Li and X. L. Wu, Angew. Chem., Int. Ed., 2021, 60, 26837–26846 CrossRef CAS PubMed.
- M.-S. Balogun, W. Qiu, W. Wang, P. Fang, X. Lu and Y. Tong, J. Mater. Chem. A, 2015, 3, 1364–1387 RSC.
- M. Thompson, Q. Xia, Z. Hu and X. S. Zhao, Mater. Adv., 2021, 2, 5881–5905 RSC.
- G. L. Xu, R. Amine, A. Abouimrane, H. Che, M. Dahbi, Z. F. Ma, I. Saadoune, J. Alami, W. L. Mattis, F. Pan, Z. Chen and K. Amine, Adv. Energy Mater., 2018, 8, 1702403 CrossRef.
- S. Chen, C. Wu, L. Shen, C. Zhu, Y. Huang, K. Xi, J. Maier and Y. Yu, Adv. Mater., 2017, 29, 1700431 CrossRef PubMed.
- X. Yang and A. L. Rogach, Adv. Energy Mater., 2020, 10, 2000288 CrossRef CAS.
- G. Chen, Q. Huang, T. Wu and L. Lu, Adv. Funct. Mater., 2020, 30, 2001289 CrossRef CAS.
- X. Qiu, X. Wang, Y. He, J. Liang, K. Liang, B. L. Tardy, J. J. Richardson, M. Hu, H. Wu, Y. Zhang, O. J. Rojas, I. Manners and J. Guo, Sci. Adv., 2021, 7, eabh3482 CrossRef CAS PubMed.
- K. Wang, Z. Zhang, S. Cheng, X. Han, J. Fu, M. Sui and P. Yan, eScience, 2022, 2, 529–536 CrossRef.
- Q. Zhang, X. Shen, Q. Zhou, K. Li, F. Ding, Y. Lu, J. Zhao, L. Chen and Y.-S. Hu, Energy Mater. Adv., 2022, 2022, 9828020 Search PubMed.
- H. Gao, N. S. Grundish, Y. Zhao, A. Zhou and J. B. Goodenough, Energy Mater. Adv., 2021, 2021, 1932952 Search PubMed.
- Y. Fang, X.-Y. Yu and X. W. D. Lou, Angew. Chem., Int. Ed., 2017, 56, 5801–5805 CrossRef CAS PubMed.
- J. Qian, C. Wu, Y. Cao, Z. Ma, Y. Huang, X. Ai and H. Yang, Adv. Energy Mater., 2018, 8, 1702619 CrossRef.
- Z. Jian, Y. S. Hu, X. Ji and W. Chen, Adv. Mater., 2017, 29, 1601925 CrossRef PubMed.
- K. Chayambuka, G. Mulder, D. L. Danilov and P. H. L. Notten, Adv. Energy Mater., 2018, 8, 1800079 CrossRef.
- Q. Liu, Z. Hu, M. Chen, C. Zou, H. Jin, S. Wang, S. L. Chou, Y. Liu and S. X. Dou, Adv. Funct. Mater., 2020, 30, 1909530 CrossRef CAS.
- M. Li, Z. Du, M. A. Khaleel and I. Belharouak, Energy Storage Mater., 2020, 25, 520–536 CrossRef.
- T. Wang, D. Su, D. Shanmukaraj, T. Rojo, M. Armand and G. Wang, Electrochem. Energy Rev., 2018, 1, 200–237 CrossRef CAS.
- W. Song, X. Cao, Z. Wu, J. Chen, K. Huangfu, X. Wang, Y. Huang and X. Ji, Phys. Chem. Chem. Phys., 2014, 16, 17681–17687 RSC.
- T. Wei, G. Yang and C. Wang, Nano Energy, 2017, 39, 363–370 CrossRef CAS.
- S. Li, P. Ge, C. Zhang, W. Sun, H. Hou and X. Ji, J. Power Sources, 2017, 366, 249–258 CrossRef CAS.
- Z. Yang, G. Li, J. Sun, L. Xie, Y. Jiang, Y. Huang and S. Chen, Energy Storage Mater., 2020, 25, 724–730 CrossRef.
- X.-X. Zhao, Z.-Y. Gu, J.-Z. Guo, C.-D. Zhao, X.-T. Wang, D. Xie, W.-H. Li and X.-L. Wu, Mater. Chem. Front., 2021, 5, 5671–5678 RSC.
- Q. Wang, H. Gao, J. Li, G. B. Liu and H. Jin, ACS Appl. Mater. Interfaces, 2021, 13, 14312–14320 CrossRef CAS PubMed.
- L. Zhu, Q. Zhang, D. Sun, Q. Wang, N. Weng, Y. Tang and H. Wang, Mater. Chem. Front., 2020, 4, 2932–2942 RSC.
- S. Ghosh, N. Barman, M. Mazumder, S. K. Pati, G. Rousse and P. Senguttuvan, Adv. Energy Mater., 2019, 10, 1902918 CrossRef.
- C. Xu, J. Zhao, E. Wang, X. Liu, X. Shen, X. Rong, Q. Zheng, G. Ren, N. Zhang, X. Liu, X. Guo, C. Yang, H. Liu, B. Zhong and Y. S. Hu, Adv. Energy Mater., 2021, 11, 2100729 CrossRef CAS.
- F. Lu, J. Wang, S. Chang, L. He, M. Tang, Q. Wei, S. Mo and X. Kuang, Carbon, 2022, 196, 562–572 CrossRef CAS.
- T. Zhu, P. Hu, X. Wang, Z. Liu, W. Luo, K. A. Owusu, W. Cao, C. Shi, J. Li, L. Zhou and L. Mai, Adv. Energy Mater., 2019, 9, 1803436 CrossRef.
- H. Gao, Y. Li, K. Park and J. B. Goodenough, Chem. Mater., 2016, 28, 6553–6559 CrossRef CAS.
- M. Hadouchi, N. Yaqoob, P. Kaghazchi, M. Tang, J. Liu, P. Sang, Y. Fu, Y. Huang and J. Ma, Energy Storage Mater., 2021, 35, 192–202 CrossRef.
- M. Chen, W. Hua, J. Xiao, J. Zhang, V. W. Lau, M. Park, G. H. Lee, S. Lee, W. Wang, J. Peng, L. Fang, L. Zhou, C. K. Chang, Y. Yamauchi, S. Chou and Y. M. Kang, J. Am. Chem. Soc., 2021, 143, 18091–18102 CrossRef CAS PubMed.
- J. Liu, K. Lin, Y. Zhao, Y. Zhou, X. Hou, X. Liu, H. Lou, K.-H. Lam and F. Chen, J. Mater. Chem. A, 2021, 9, 10437–10446 RSC.
- S. Ghosh, N. Barman and P. Senguttuvan, Small, 2020, 16, e2003973 CrossRef PubMed.
- W. Zhou, L. Xue, X. Lu, H. Gao, Y. Li, S. Xin, G. Fu, Z. Cui, Y. Zhu and J. B. Goodenough, Nano Lett., 2016, 16, 7836–7841 CrossRef CAS PubMed.
- J. Zhang, Y. Liu, X. Zhao, L. He, H. Liu, Y. Song, S. Sun, Q. Li, X. Xing and J. Chen, Adv. Mater., 2020, 32, e1906348 CrossRef PubMed.
- P. Lavela, R. Klee and J. L. Tirado, J. Power Sources, 2021, 495, 229811 CrossRef CAS.
- W. S. Hummers Jr and R. E. Offeman, J. Am. Chem. Soc., 1958, 80, 1339 CrossRef.
- Y. Fang, L. Xiao, X. Ai, Y. Cao and H. Yang, Adv. Mater., 2015, 27, 5895–5900 CrossRef CAS PubMed.
- Y. Zhou, X. Shao, K. H. Lam, Y. Zheng, L. Zhao, K. Wang, J. Zhao, F. Chen and X. Hou, ACS Appl. Mater. Interfaces, 2020, 12, 30328–30335 CrossRef CAS PubMed.
- C. Xu, J. Zhao, Y. A. Wang, W. Hua, Q. fu, X. Liang, X. Rong, Q. Zhang, X. Guo, C. Yang, H. Liu, B. Zhong and Y. S. Hu, Adv. Energy Mater., 2022, 12, 2200966 CrossRef CAS.
- Z. Zhang, Z. Chen, Z. Mai, K. Peng, Q. Deng, A. Bayaguud, P. Zhao, Y. Fu, Y. Yu and C. Zhu, Small, 2019, 15, e1900356 CrossRef PubMed.
- T. Zhu, P. Hu, C. Cai, Z. Liu, G. Hu, Q. Kuang, L. Mai and L. Zhou, Nano Energy, 2020, 70, 104548 CrossRef CAS.
- Y. Chen, J. Cheng, S. Sun, Z. Tian, X. Jiang, Y. Wang, Z. He, C. Liu, Q. Huang and L. Guo, J. Power Sources, 2021, 513, 230545 CrossRef CAS.
- N. S. Buryak, D. V. Anishchenko, E. E. Levin, S. V. Ryazantsev, V. Martin-Diaconescu, M. V. Zakharkin, V. A. Nikitina and E. V. Antipov, J. Power Sources, 2022, 518, 230769 CrossRef CAS.
- F. Li, Y.-E. Zhu, J. Sheng, L. Yang, Y. Zhang and Z. Zhou, J. Mater. Chem. A, 2017, 5, 25276–25281 RSC.
- R. Klee, P. Lavela and J. L. Tirado, Electrochim. Acta, 2021, 375, 137982 CrossRef CAS.
- Zelang Jian, Liang Zhao, Huilin Pan, Yong-Sheng Hu, Hong Li, Wen Chen and L. Chen, Electrochem. Commun., 2012, 14, 86–89 CrossRef CAS.
- X. Pu, D. Zhao, C. Fu, Z. Chen, S. Cao, C. Wang and Y. Cao, Angew. Chem., Int. Ed., 2021, 60, 21310–21318 CrossRef CAS PubMed.
- Y. Jiang, Z. Yang, W. Li, L. Zeng, F. Pan, M. Wang, X. Wei, G. Hu, L. Gu and Y. Yu, Adv. Energy Mater., 2015, 5, 1402104 CrossRef.
- L. Zhao, X. Rong, Y. Niu, R. Xu, T. Zhang, T. Li, Y. Yu and Y. Hou, Small, 2020, 16, e2004925 CrossRef PubMed.
- H. Li, M. Xu, C. Gao, W. Zhang, Z. Zhang, Y. Lai and L. Jiao, Energy Storage Mater., 2020, 26, 325–333 CrossRef.
- H. Li, T. Jin, X. Chen, Y. Lai, Z. Zhang, W. Bao and L. Jiao, Adv. Energy Mater., 2018, 8, 1801418 CrossRef.
- M. Chen, W. Hua, J. Xiao, D. Cortie, W. Chen, E. Wang, Z. Hu, Q. Gu, X. Wang, S. Indris, S. L. Chou and S. X. Dou, Nat. Commun., 2019, 10, 1480 CrossRef PubMed.
- R. Zhan, B. Shen, Q. Xu, Y. Zhang, Y. Luo, H. Liu, H. Chen, F. Liu, C. Li and M. Xu, Electrochim. Acta, 2018, 283, 1475–1481 CrossRef CAS.
- M. Peng, D. Zhang, L. Zheng, X. Wang, Y. Lin, D. Xia, Y. Sun and G. Guo, Nano Energy, 2017, 31, 64–73 CrossRef CAS.
- X. H. Rui, N. Ding, J. Liu, C. Li and C. H. Chen, Electrochim. Acta, 2010, 55, 2384–2390 CrossRef CAS.
- J. Wang, X. Li, Z. Wang, H. Guo, B. Huang, Z. Wang and G. Yan, J. Solid State Electrochem., 2014, 19, 153–160 CrossRef.
- C. Xu, R. Xiao, J. Zhao, F. Ding, Y. Yang, X. Rong, X. Guo, C. Yang, H. Liu, B. Zhong and Y.-S. Hu, ACS Energy Lett., 2021, 7, 97–107 CrossRef.
- X. Zhang, M. Yu, S. Zhao, F. Li, X. Hu, S. Guo, X. Lu and Y. Tong, Part. Part. Syst. Charact., 2016, 33, 531–537 CrossRef CAS.
- Y. Fang, X.-Y. Yu and X. W. Lou, Matter, 2019, 1, 90–114 CrossRef.
- H. Yu, X. Ruan, J. Wang, Z. Gu, Q. Liang, J. M. Cao, J. Kang, C. F. Du and X. L. Wu, ACS Nano, 2022, 16, 21174–21185 CrossRef CAS PubMed.
Footnote |
| † Electronic supplementary information (ESI) available. See DOI: https://doi.org/10.1039/d3ma00074e |
| This journal is © The Royal Society of Chemistry 2023 |

