 Open Access Article
Creative Commons Attribution 3.0 Unported Licence
Surfactant doped polyaniline coatings for functionalized gas diffusion layers in low temperature fuel cells†
Florian
Tritscher
 a,
Adrian
Mularczyk
 b,
Antoni
Forner-Cuenca
 b,
Viktor
Hacker
 a and
Merit
Bodner
 *a
*a
aInstitute of Chemical Engineering and Environmental Technology, Graz University of Technology, Inffeldgasse 25C, 8010 Graz, Austria. E-mail: merit.bodner@tugraz.at
bDepartment of Chemical Engineering and Chemistry, Eindhoven University of Technology, Helix, Het Kranenveld, 5612 AZ Eindhoven, The Netherlands
First published on 24th April 2023
Abstract
Gas diffusion layers (GDLs) are essential for the proper distribution of the reaction gases, the removal of excess water as well as electrical contact in polymer electrolyte fuel cells (PEFCs). The production of state-of-the-art GDLs consists of many steps such as graphitization at high temperatures and hydrophobic treatments with polytetrafluoroethylene (PTFE) which increase the cost. In this study, an electrically conductive and hydrophobic polyaniline (PANI) coating was deposited on carbon paper via dip-coating and electropolymerization to fabricate PTFE-free GDLs. As a proof-of-concept, PANI-coated GDLs were tested as a cathodic GDL in a single cell PEFC and achieved a 42% higher maximum power compared to the reference measurement with a commercial GDL. Furthermore, these PTFE-free GDLs achieved contact angles up to 144° which is in the range of commercial GDLs. The chemical composition of the PANI-coating was investigated via infrared spectroscopy and energy dispersive X-ray spectroscopy (EDX) and the morphology was examined via scanning electron microscopy (SEM). Hence, the proposed method emerges as a possible strategy to simultaneously substitute PTFE and apply a protective and durable coating.
Introduction
Fuel cells (FCs) are electrochemical systems which convert the chemical energy of a fuel to electrical energy using an oxidant. The most common type of fuel cell is the polymer electrolyte fuel cell (PEFC) which uses hydrogen as fuel and oxygen as oxidizing agent.1 FCs have gained popularity over the last few decades because of their carbon neutral principle in combination with high energy efficiency.2 According to eqn (1), the only products of the reaction in a PEFC are water and energy in the form of electricity and heat.1Total reaction in a PEFC:
| H2 + ½O2 → H2O | (1) |
Hydrogen oxidation reaction (HOR) at anode:
| H2 → 2H+ + 2e− | (2) |
Oxygen reduction reaction (ORR) at cathode:
| 2H+ + ½O2 + 2e− → H2O | (3) |
On the anode side, hydrogen is supplied via the bipolar plates (BPP) and the gas diffusion layers (GDL) to the anodic catalyst layer (CL) where the hydrogen oxidation reaction (HOR) (see eqn (2)) takes place.3 On the cathode side, oxygen is supplied in a similar manner to the cathodic CL where the oxygen reduction reaction (ORR) occurs.3 As shown in eqn (3), water is formed on the cathode side which subsequently needs to be disposed of to avoid a so-called water flooding of the cell, which would lead to a blocking of the active sites and reduce the efficiency and stability of the cell.3,4 On the other hand, a sufficient humidification is needed, since the perfluoro sulphonic acid (PFSA) membranes, commonly used in PEFCs, can only conduct protons when sufficiently hydrated.5 A drying of the membrane leads to increasing ohmic losses, temperature increase and degradation.5
In PEFCs GDLs are critical for this sensitive water management as well as the transport and even distribution of the reaction gases, electrons and heat.3,6 Therefore, materials for GDLs need to possess attributes such as adequate electrical and thermal conductivity and (electro)chemical stability in the environment of a PEFC.1,6 Furthermore, the wettability of the GDL needs to be suitable for a changing humidification of the gases as well as different rates of water production depending on the operating point.1 To fulfil these requirements, GDLs are designed as porous structures to simultaneously provide pathways for the transport of reactant gases and water as well as a solid network which serves as a mechanical support of the CL and transports electrons and heat.1
State-of-the-art GDLs consist of a carbon paper called macroporous substrate (MPS) and an additional microporous layer (MPL). The MPS is made up of carbon fibres (diameter 7–9 μm), which are randomly oriented as a sheet with thicknesses of 100–500 μm in uncompressed state.1,4 The pore size of the MPS is in the range of 10–100 μm, yielding a porosity of 65–90%.1 The MPL has a thickness between 10 and 100 μm and is composed of carbon powder as well as a hydrophobic agent such as PTFE.1
MPS are frequently fabricated from petroleum based polyacrylonitrile (PAN) fibres and a phenolic resin as binder which are subjected to temperatures of up to 2000 °C to achieve the required porosity and conductivity (see Fig. 1).7,8 Due to these high temperatures required during carbonization and graphitization steps, the polymer fibres are converted into carbon fibres with graphite-like properties whereas the binder persists as amorphous carbon.1 The high temperatures needed for the carbonization, the required post-treatment with polytetrafluoroethylene (PTFE) to improve the hydrophobic properties, as well as the application of the MPL, increase the manufacturing cost of the material.1,7 The GDL contributes 10% to the total production cost of the membrane electrode assembly (MEA), which is the most expensive component of the fuel cell stack.9,10 Moreover, the addition of PTFE limits the feasibility of recycling of the material due to the introduction of fluorine containing compounds.11 With increasing PTFE content the transport of electrons and heat is reduced.4 Furthermore, PTFE tends to agglomerate which can cause additional performance losses by blocking the porous structure and altering the capillary forces.12,13 In addition, due to concerns about the environment and human health, there is demand to reduce the utilization of fluorine containing compounds such as perfluoroalkyl substances (PFAS) and develop nonfluorinated alternatives.14
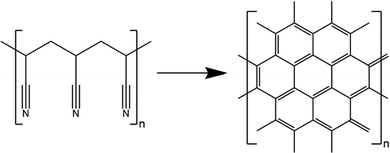 | ||
| Fig. 1 Conversion of polyacrylonitrile (PAN) to carbon paper via graphitization at 2000 °C.18 | ||
Another challenge of GDLs is the durability, since these carbon-based materials are prone to oxidation, leading to a loss of their properties and contributing to the ageing of the fuel cell.15 The oxidation of carbon in the presence of water starts at potentials as low as 0.207 V versus reversible hydrogen electrode (RHE) (see eqn (4)).15
Oxidation of carbon in the presence of water:
| C + 2H2O → CO2 + 4H+ + 4e−E = 0.207 V vs. RHE | (4) |
Due to the environmental concerns, there is a research focus on developing new kinds of GDLs based on renewable resources such as bagasse and jute to substitute the base material PAN.7,16 These renewable materials also require a graphitization step to achieve the electrical conductivity. However, due to the missing nitrile groups, they can be graphitized at lower temperatures compared to PAN, which helps to reduce the production costs.16 Moreover, the material costs of these natural feedstocks are lower compared to the petroleum-based PAN.16 Further, natural fibres with a high surface area have been used as GDLs in FCs without the need for an MPL, which is required for PAN based GDL substrates.17 However, natural fibres are prone to oxidation, require a hydrophobic treatment and may contain contaminants, harmful to fuel cells.7,16
Electrochemically stable conductive coatings
In this study, we investigate the use of coatings to prevent the oxidation of carbon and to simultaneously enable tunability of the wettability of GDLs. Conducting polymers are a class of materials with the potential to improve the properties of GDLs due to their tuneable wettability,19 electrical conductivity20–22 as well as electrochemical stability over a wide potential range.23,24The possibility of adapting the properties of conducting polymers over a wide range has enabled a variety of applications such as supercapacitors,25,26 photovoltaic cells27 and tissue engineering.28,29 PANI is one of the best investigated conducting polymers.30–34 It has been used as corrosion protection,31 as an electrode material for supercapacitors25 and in catalysis35 due to its high thermal30 and (electro)chemical stability24,33 in combination with low cost.30 An electrical conductivity of 400 S cm−1 has been reported.20 Further, the thermal stability of PANI is superior compared to other conducting polymers,36 its electrical conductivity has been reported to sustain 170 °C for 500 h.37 Good chemical stability in both acidic and alkaline media has been reported for PANI,38 however it loses its electrical conductivity in alkaline media.39 Due to the rigid backbone, PANI has a low solubility in most solvents, which can restrict its use in some applications as a result of the limited processibility.36,40
The possibility of using PANI in FCs has already been demonstrated in the form of a PANI/Pt catalyst.41 Furthermore, Fu et al. produced nanorod-like structures of PANI on an MPL to fabricate a catalyst support and Cindrella et al. successfully deposited PANI via spray coating on the MPL to reduce the contact resistance between the MPL and the CL.42,43
Conducting polymers can be distinguished from other polymers due to their alternating single and double (or triple) bonds in the backbone of the polymer. The charge transport is due to so-called π-conjugated bonds containing electrons which can move freely due to overlapping p-orbitals.44
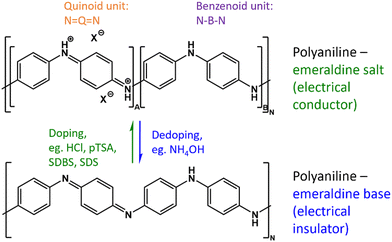
For most conductive polymers such as polyaniline (PANI), doping is required to achieve suitable conductivity. This is achieved through the creation of a charged structure and the insertion of counter ions to maintain overall charge neutrality (see Fig. 2).45 Although both of the depicted PANI structures in Fig. 2 consist of a 1![[thin space (1/6-em)]](https://www.rsc.org/images/entities/char_2009.gif) :
:![[thin space (1/6-em)]](https://www.rsc.org/images/entities/char_2009.gif) 1 ratio of oxidized to reduced units, only the doped emeraldine salt is an electrical conductor, whereas the dedoped emeraldine base is an insulator.33,35 Further, the ratio of oxidized to reduced units needs to be controlled since the fully oxidized pernigraniline as well as the fully reduced leucoemeraldine are considered non-conducting.35,46
1 ratio of oxidized to reduced units, only the doped emeraldine salt is an electrical conductor, whereas the dedoped emeraldine base is an insulator.33,35 Further, the ratio of oxidized to reduced units needs to be controlled since the fully oxidized pernigraniline as well as the fully reduced leucoemeraldine are considered non-conducting.35,46
The counter ions necessary to ensure the charge neutrality of the structure can be exploited to alter the properties of conducting polymers such as electrical conductivity,21,22 morphology,47 thermal stability46,48 and solubility.49
In this work, special emphasis is laid on the wettability of the coating. For the synthesis of the conducting emeraldine a low pH is required, which can be achieved by the addition of HCl.21 However, the addition of HCl increases the hydrophilicity of the polymer.21 Leng et al. used amphiphilic molecules as counter ions to alter the wettability and reported the fabrication of superhydrophobic PANI coatings.50 The negatively charged hydrophilic heads are attracted by the positively charged backbone of PANI, whereas the apolar tails point outward making the polymer hydrophobic.50
Since the sizes and shape of their hydrophobic tails of surfactants such as p-toluenesulphonic acid (pTSA), sodium dodecylsulphate (SDS) and sodium dodecylbenzenesulphonate (SDBS) differ, also the morphology as well as the electronic properties are expected to depend on the selected dopant. According to Oh et al. pTSA is superior to other surfactants since the conductivity of PANI is less interrupted by the benzene ring compared to the longer hydrocarbon chains of SDBS and SDS.51
In this study we investigate the application of PANI as protective coating for GDLs via (i) dip-coating and (ii) electropolymerization without the utilization of PTFE and an MPL. The decision was made not to use an MPL in order to isolate the impact of the additional layer and explore the possibility of omitting it. In addition, this study examines various dopants such as SDS, SDBS and pTSA to transform the hydrophilic PANI into a hydrophobic coating with suitable (electro)chemical stability and electrical conductivity.
Using ex situ techniques such as contact angle (CA) measurement, infrared (IR) spectroscopy and scanning electron microscopy (SEM) allowed a screening to determine the most promising coating. Ultimately, the most promising coatings were used to fabricate GDLs, which were in situ tested as cathodic GDL in a single cell PEFC and compared to a reference measurement using commercial carbon paper EP40T.
Experimental
Materials
All chemicals were used as received without further purification. (NH4)2SO4 (98%, ammonium persulfate (APS)) and sodium dodecylsulphate (>85%, SDS) were purchased from Merck. HCl, NH4OH and p-toluene sulphonic acid (≥98.5%, pTSA) were purchased from Sigma-Aldrich. Aniline (≥99.5%, Ani) was purchased from Roth, whereas sodium dodecylbenzenesulphonate (>85%, SDBS) was purchased from Fluka. For synthesis and washing, deionized water was used. The commercial carbon paper AvCarb EP40 was used as substrate for fabricating the PANI-coated GDLs. EP40T was used as an anode GDL for the in situ testing of the PANI-coated GDL and as both anode and cathode GDL for the reference measurement. The main difference between EP40 and EP40T is the hydrophobic treatment of EP40T with 13 wt% PTFE which influences properties such as the through-plane electrical resistivity which is increased from 8.0 mOhm cm2 to 13 mOhm cm2 and through-plane air permeability (Gurley method) which is increased from 4.5 s/100cc to 7.5 s/100cc.52 Furthermore, EP40 has a compressibility of 14% whereas EP40T has a compressibility of 10.5%.52 Catalyst coated membranes (CCM) of the type H25-N212 provided by Quintech were used for the in situ testing. The CCMs consist of 5 × 5 cm2 active area, with a cathode catalyst loading of 0.6 mg Pt per cm2 and an anode catalyst loading of 0.3 mg Pt per cm2. The reactant gases for the in situ testing were pure hydrogen on the anode side and synthetic air with an oxygen content of 20 ± 1% v/v on the cathode side. The purging of the cell was performed using pure nitrogen gas. All gases are of 5.0 quality and supplied by air liquid.Labelling of sample
For the identification of the different samples, a system of abbreviations such as A-HCl-1 was used. Table 1 explains the labelling. PANI/SDBS stands for SDBS doped PANI in general.| Gives the oxidant or indicates electropolymerization | Name of the dopant | Number to distinguish samples with similar dopant and oxidant | If given, indicates whether sample was dedoped or redoped, new dopant is given in brackets |
|---|---|---|---|
| E – electropolymerization | HCl | 1 | D – dedoped |
| A – APS | pTSA | 2 | R(pTSA) – redoped with pTSA |
| SDS | 3 | ||
| SDBS | 4 |
Dip-coating of carbon paper
The chemical oxidative polymerization of aniline was performed in aqueous solution at room temperature as previously reported by Xu et al.53 However, the drop-coating method used by Xu et al. was modified as follows to enable the dip-coating of the carbon paper and produce uniform coatings. For each dip-coating approach two reaction solutions A and B were prepared in a beaker. Both solutions contained the same concentration of dopants, solution A & B contained the aniline monomer and the oxidant APS, respectively. For a carbon paper of 5 × 5 cm2 both solutions A and B had a volume of 150 mL each. The concentration of the chemicals for each synthesis can be found in Table 2.| Sample | Concentration aniline (solution A)/mol L−1 | Concentration dopant (solution A&B)/mol L−1 | Oxidant APS (solution B)/mol L−1 | Electrochemical parameters (potential vs. Ag/AgCl) |
|---|---|---|---|---|
| A-HCl-1 | 0.036 | HCl: 0.067 | 0.036 | — |
| A-HCl-2 | 0.200 | HCl: 0.100 | 0.200 | — |
| A-pTSA-1 | 0.150 | pTSA: 0.450 | 0.150 | — |
| A-pTSA-2 | 0.029 | pTSA: 0.007 | 0.029 | — |
| A-SDS-1 | 0.024 | SDS: 0.014 | 0.024 | — |
| A-SDS-2 | 0.036 | SDS: 0.014, HCl: 0.067 | 0.036 | — |
| A-SDS-3 | 0.024 | SDS: 0.014 | 0.024 | — |
| A-SDBS-1 | 0.100 | SDBS: 0.056, HCl: 0.010 | 0.100 | — |
| A-SDBS-2 | 0.100 | SDBS: 0.012, | 0.120 | — |
| HCl: 0.060 | ||||
| E-HCl-1 | 0.100 | HCl: 0.500 | — | CV: 0.05 to 1.1 V, 7 cycles with 20 mV s−1 scan rate, final potential is 0.59 V |
| E-pTSA-1 | 0.100 | HCl: 0.100 | — | Constant current: 40 mA for 300 s |
| E-pTSA-2 | 0.100 | pTSA: 0.100 | — | CV: 0.05 to 0.9 V, 8 cycles with 20 mV s−1 scan rate, final potential is 0.58 V |
| E-pTSA-3 | 0.100 | pTSA: 0.100 | — | CV: 0.05 to 0.9 V, 13 cycles with 20 mV s−1 scan rate, final potential is 0.30 V |
| E-SDS-1 | 0.100 | SDS: 0.050, HCl: 0.100 | — | Constant potential: 0.7 V for 900 s |
| E-SDBS-1 | 0.100 | SDBS: 0.050, HCl: 0.100 | — | Const potential: 0.85 V for 300 s; after CP was turned around again 0.85 V for 300 s |
| E-SDBS-2 | 0.100 | SDBS: 0.050, HCl: 0.100 | — | Const potential: 0.85 V for 200 s; after CP was turned around again 0.85 V for 200 s |
| E-SDBS-3 | 0.100 | SDBS: 0.050, HCl: 0.100 | — | Const potential: 0.85 V for 150 s; after CP was turned around again 0.85 V for 150 s |
| E-SDBS-4 | 0.100 | SDBS: 0.050, HCl: 0.100 | — | CV: 0.05 to 0.9 V, 11 cycles with 20 mV s−1 scan rate, final potential is 0.71 V |
After preparing the solutions A&B, both solutions were kept stirring for 30 minutes at room temperature. To initiate the polymerization, solution B was rapidly poured into solution A. Consequently, the reaction solution was vigorously stirred for 30 seconds before reducing the stirring rate to 200 rpm and immersing the commercial carbon paper EP40 into the solution. After a reaction time of 21 hours, the coated carbon paper was taken out and gently washed with deionised water. Furthermore, the powder product was collected via vacuum filtration and washed with deionised water until the filtrate became colourless. Both the coated carbon paper as well as the powder product were dried in a furnace at 60 °C for 24 h.
Electropolymerization
For the electropolymerization of the polyaniline coating a three-electrode setup with carbon paper EP40, glassy carbon rod and Ag/AgCl (3 M KCl) as working electrode (WE), counter electrode (CE) and reference electrode (RE), respectively, was used. The electrochemical cell as well as the CE and RE were provided by redox.me. The electrochemical workstation reference 600 of Gamry Instruments was used to apply a current as described in Table 2. The syntheses were carried out at room temperature in air and the electrolyte consisted of the chemicals listed in Table 2. In a typical synthesis the geometric size of the carbon paper WE was 5 × 5 cm2 and the volume of the electrolyte solution was 350 mL. After the synthesis, the WE was gently washed with deionised water and dried in a furnace at 60 °C for 24 h.Dedoping and redoping
Selected coated carbon papers were dipped into 1 M NH4OH for 24 hours followed by a washing step with deionised water. Consequently, the carbon paper was immersed in 1 M pTSA for 24 hours, before being washed with deionised water and being dried in a furnace at 60 °C for 24 hours.Ex situ testing
The contact angles of the coated carbon papers and the commercial carbon papers were determined using the Ossila Contact Angle Goniometer L2004A1. On each sample, three different locations were chosen on which water drops with a volume of 10 μL each were deposited. After 3 seconds an image was recorded. The CA was recorded with the highest values used to rank the wettability of the samples. IR spectra of PANI powder and coated carbon paper were recorded using a Fourier-transform infrared spectrometer (Bruker Alpha II) in the range from 4000 to 400 cm−1. The morphology of the coated carbon papers and the elemental distributions were recorded via scanning electron microscopy (SEM) and energy dispersive X-ray spectroscopy (EDX), respectively. Both were performed using a JEOL JSM-IT100 at a potential of 5 kV and a working distance of 10 mm. The cyclic voltammetry (CV) for examining the electrochemical stability of the coating was performed in the range of 0.2 to 0.75 V vs. Ag/AgCl with a scan rate of 20 mV s−1 for 100 cycles. The CV was carried out with the same electrochemical cell used for the electropolymerization with an electrolyte containing 0.1 M HCl.In situ testing
Samples were assessed for their performance and stability in an operational fuel cell via CV, EIS and polarization curve. The in situ testing was performed on a Greenlight automated test station model G60. The testing station was equipped with a dew point and gas temperature control as well as automated humidification. For the single cell testing a Baltic cell qCf FC25/100 was used which has the advantage of a precise control of the applied pressure due to a hydraulic system which enables a better controlling and replication of the testing conditions. For all measurements the cell was compressed with a pressure of 1.6 MPa and the cell temperature was set to 80 °C. A triple serpentine flow field as described here54 was selected.The water management is more critical at the cathode since water is produced by the ORR. Hence the cathode was selected for testing the coated carbon paper. On the anode side, EP40T was used for both the testing of the PANI-coated GDLs as well as the reference measurement. Further, the in situ testing of the GDLs was carried out without the application of an MPL, although they are added as common practice in state-of-the-art materials, to prevent the MPL from influencing the performance and consequently enable a better traceability of the effect of the PANI-coating.
The activation of the cell was performed according to the Joint Research Centre (JRC) protocol which consisted of a cell break-in followed by cell conditioning.55
Electrochemical impedance spectroscopy (EIS)
For all measurements the RH was set on both sides to 50% and the frequency range was 200 kHz to 0.1 Hz. The EIS measurement was performed with a current of 280 mA cm−2 and an amplitude of 5% was applied which resulted in a cell voltage of about 0.63 V.Polarization curve
For each sample two polarization curves were recorded, one at 30% relative humidity (RH) and the other at 50% RH. For any measurement, the RH on both sides was identical. The stoichiometry on the anode was set to 1.3 and on the cathode, it was set to 1.5. According to the JRC protocol, the forward sweep of the polarization curve was started at the open-circuit voltage (OCV) and the current was increased stepwise until the voltage dropped below 0.4 V. Consequently, a backward sweep was carried out by stepwise reducing the current till the OCV was reached again.100 h stability
Sample E-SDBS-3 was kept running with a current density of 350 mA cm−2 for 100 h before repeating the polarization curve, EIS and CV with the same conditions as depicted above. For the 100 h hold, the RH was set to 50% and the temperature was set to 80 °C on both sides. The anode and cathode stoichiometry were set to 1.3 and 1.5, respectively.Results and discussion
Synthesis
Fig. 3 shows a dip-coated (A) and an electrocoated carbon paper (B), it can be seen that the coating is only formed on the parts immersed into the reaction solution (A) or the electrolyte (B).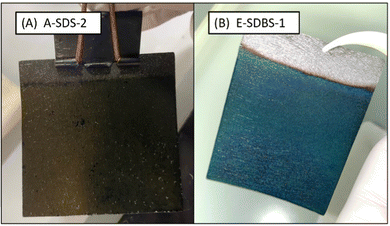 | ||
| Fig. 3 Carbon paper coated with surfactant doped PANI via dip-coating (left) and electropolymerization (right). | ||
As a first step, the two investigated coating techniques were compared in terms of their feasibility and coating quality. We found, the setup of the dip coating to be more straightforward compared to the electropolymerization which required more equipment (see ESI,† Fig. S1 and S2). In general, the electropolymerization is the faster technique since for the applied coating thickness it is done in minutes. However, the reaction time of the dilute chemical oxidative polymerization could be drastically reduced by increasing the concentration of the monomer and tolerating a poor conversion of the toxic monomer. For sample A-SDBS-2 the coating mass per area was measured over a timeframe of 21 hours. After 1, 3.5 and 21 hours the deposited mass of PANI per area was 2.1, 4.5 and 5.3 mg cm−2. Hence the deposition rate decreases after the first hours of the polymerization.
A further disadvantage of the chemical oxidative polymerization is the material waste due to the formation of PANI in the solution instead of on the carbon paper. Whereas in the case of the tested electrochemical techniques, the coating adhered to the carbon paper WE and no PANI was formed in the solution.
An additional advantage of the electropolymerization is that the deposited mass can be readily controlled through the used charge. However, for a uniform coating on both sides of the carbon paper WE, the WE needed to be turned around to alter the side facing the CE (see Surface morphology and coating distribution).
Ex situ testing
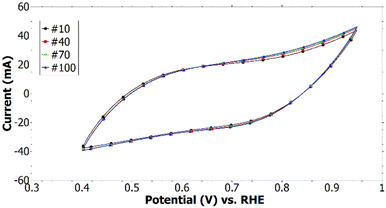
No redox peaks were detected which would indicate a transition of the emeraldine salt form of PANI to the pernigraniline (oxidized) or leucoemeraldine (reduced) form which are both unwanted due to being non-conducting.33,34 It can be seen that with increasing cycle number more faradaic current is measured (see Fig. 4). This could be due to an increasing surface area which allows to accept a higher amount of charge for the building up of the double-layer capacitance. A decrease in the detected current would have pointed toward a degradation of the coating since the emeraldine salt could have been converted to a non-conducting form or been removed from the carbon paper. Hence, the cyclic voltammogram suggests the PANI coating is stable in the potential range of a fuel cell and adheres to the carbon paper which is necessary for applications as protective coating for carbon-based materials.
Analysis of the chemical structure of the coating
Table 3 provides an overview of characteristic peaks for PANI and gives information about the influence of dopants. Of high importance are the peaks at 1245 and 1135 cm−1, since they indicate the presence of the groups that provide a high electrical conductivity. Further, the relative intensity of the peaks at 1574 cm−1 (stretching of quinoid rings) and 1485 cm−1 (stretching of benzenoid rings) can be used to estimate the amount of quinoid and benzenoid units which theoretically should be 1![[thin space (1/6-em)]](https://www.rsc.org/images/entities/char_2009.gif) :
:![[thin space (1/6-em)]](https://www.rsc.org/images/entities/char_2009.gif) 1 for emeraldine salt.56
1 for emeraldine salt.56
| Wavenumber of peak/cm−1 | Description PANI | Influence dopant/oxidant |
|---|---|---|
| 1680 | — | Indicates presence of non-conducting phenazine, a defect in PANI which can be produced by oxidant APS57 |
| 1574 | Stretching of quinoid rings57 | Becomes wider in presence of SDBS19 |
| 1485 | Stretching of C![[double bond, length as m-dash]](https://www.rsc.org/images/entities/char_e001.gif) C in benzenoid rings57 C in benzenoid rings57 |
Significant increase indicated presence of phenazine which reduces the conductivity57 |
| 1245 | C–N+˙ (bipolaron) stretching vibration, indicates conductivity19,21 | — |
| 1135 | C![[double bond, length as m-dash]](https://www.rsc.org/images/entities/char_e001.gif) NH+–C (protonated imine group), indicates higher conductivity19,56,57 NH+–C (protonated imine group), indicates higher conductivity19,56,57 |
Become wider in presence of SDBS19 |
| 1010 | — | S![[double bond, length as m-dash]](https://www.rsc.org/images/entities/char_e001.gif) O stretching58,59 O stretching58,59 |
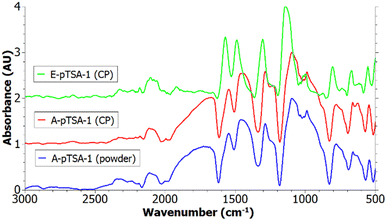
The IR spectra of PANI/pTSA coated carbon papers synthesized via electrochemical and chemical oxidative polymerization are depicted in Fig. 5 and contain the typical PANI peaks as described in Table 3. Furthermore, the recorded IR of PANI/pTSA powder formed in the solution during the dip-coating is shown. Since the peaks of the A-pTSA-1 powder are matching the peaks of the A-pTSA-1 coating, the other IR spectra recorded directly on the other coated carbon papers are valid for analysing the PANI coating.
The peaks of the chemically synthesized PANI are broader compared to E-pTSA-1 (see Fig. 5). Furthermore, the peaks of E-pTSA-1 are shifted to higher wavenumbers which could be due to a higher pH value during electropolymerization60 and the content of the reduced benzenoid units is higher in A-pTSA-1 which could be due to a too low APS oxidant concentration. The broad peak at 1664 cm−1 is only present in the spectra of chemical oxidative polymerization. According to Reza et al., this peak indicates the presence of phenazine which is often considered as a defect in PANI since it is non-conducting.57 Further, Reza et al. reported a correlation between high APS concentrations and the formation of phenazine,57 hence in E-pTSA-1 this peak is not visible.
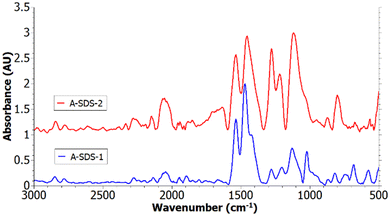
In Fig. 6 the spectra of A-SDS-1 and A-SDS-2 are depicted, the spectrum of A-SDS-3 can be found in ESI,† Fig. S7. These samples differ in the dopants used for the synthesis which were SDS for A-SDS-1 and SDS as well as HCl for A-SDS-2 and A-SDS-3. The HCl was added to ensure a low pH which is necessary for the synthesis of emeraldine salt.34 It can be seen that for A-SDS-2 the benzenoid and quinoid peaks are similar in size, opposed to A-SDS-1 where the benzenoid peaks are dominant which indicates a higher content of reduced units. The peaks assigned to the C–N+˙ vibration at 1245 cm−1 and to the ![[double bond, length as m-dash]](https://www.rsc.org/images/entities/char_e001.gif) NH+– at 1135 cm−1 are more dominant in the spectra of A-SDS-2, which indicate a higher electrical conductivity.
NH+– at 1135 cm−1 are more dominant in the spectra of A-SDS-2, which indicate a higher electrical conductivity.
After A-SDS-2 was tested in the PEFC, another IR spectrum was recorded (see ESI,† Fig. S3). The spectrum recorded after the in situ testing matches the spectrum of the pristine coating, which suggests that the PANI-coating was still present after the testing. However, the intensities of C–N+˙ and ![[double bond, length as m-dash]](https://www.rsc.org/images/entities/char_e001.gif) NH+– were slightly reduced which could indicate a conversion of the emeraldine salt to the emeraldine base.
NH+– were slightly reduced which could indicate a conversion of the emeraldine salt to the emeraldine base.
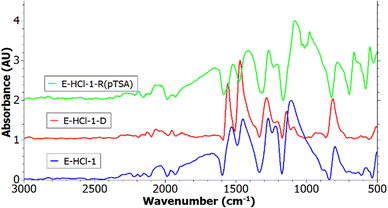
Sample E-HCl-1 was dedoped using NH4OH (E-HCl-1-D) followed by redoping using pTSA (E-HCl-1-R(pTSA)). The respective IR spectra after the electropolymerization, after the dedoping and after the redoping are shown in Fig. 7. It can be seen that the spectra of E-HCl-1 and E-HCl-1-R(pTSA) correlate except for one peak at 988 cm−1. This peak can be assigned to S![[double bond, length as m-dash]](https://www.rsc.org/images/entities/char_e001.gif) O stretching which suggests the insertion of pTSA.58,59 The detection of the characteristic PANI peaks demonstrates the coating sustained the base and acid treatment and was still adherent to the carbon paper. Furthermore, E-HCl-1 and E-HCl-1-R(pTSA) both have a dominant protonated imine peak which points towards emeraldine salt form, whereas for E-HCl-1-D this peak was not detected. The peaks of E-HCl-1-D are shifted to higher wavelengths due to the base treatment, which is in accordance with literature.60,61
O stretching which suggests the insertion of pTSA.58,59 The detection of the characteristic PANI peaks demonstrates the coating sustained the base and acid treatment and was still adherent to the carbon paper. Furthermore, E-HCl-1 and E-HCl-1-R(pTSA) both have a dominant protonated imine peak which points towards emeraldine salt form, whereas for E-HCl-1-D this peak was not detected. The peaks of E-HCl-1-D are shifted to higher wavelengths due to the base treatment, which is in accordance with literature.60,61
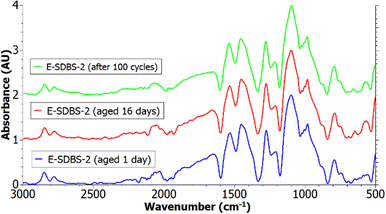
In Fig. 8 the recorded IR spectra of sample E-SDBS-2 one day after the synthesis as well as after storing it for 16 days under atmospheric conditions, are depicted. Govindaraj et al. reported an increasing hydrophobicity of emeraldine salt which was stored in atmospheric conditions for 30 days and they proposed a transition of the surface chemistry and the morphology being responsible for altered wettability of the material.56 Although we detected a change in the wettability (see Wettability of PANI-coated carbon papers), in the recorded FTIR spectrum the ratio of quinoid to benzenoid structures was not altered, as proposed by Govindaraj et al.56 Further, no deprotonation was detected, since the intensity of the protonated imine group peak did not decrease. This points toward a change in the morphology being the reason for the improved hydrophobicity.
However, these samples were prepared with constant potential opposed to CV, as in the case of Govindaraj et al. Further, the fabricated PANI-coated carbon papers were dried in a furnace at 60 °C for 24 hours after the synthesis and before recording the FTIR. Hence a transition in the surface chemistry as proposed by Govindaraj et al. could have been accelerated by heating in the furnace and been finalized before the first FTIR measurement was performed.
After the ageing, sample E-SDBS-2 was also subjected to 100 cycles of CV. It can be seen in Fig. 8 that the spectrum was not altered due to the cycling, which would indicate a degradation of the coating. Since the intensity of the S![[double bond, length as m-dash]](https://www.rsc.org/images/entities/char_e001.gif) O peak was not reduced it can be deduced that the SDBS dopants were not exchanged with the chloride ions present in the electrolyte. The IR spectra of E-SDBS-1, E-SDBS-3 and E-SDBS-4 are shown in ESI,† Fig. S8.
O peak was not reduced it can be deduced that the SDBS dopants were not exchanged with the chloride ions present in the electrolyte. The IR spectra of E-SDBS-1, E-SDBS-3 and E-SDBS-4 are shown in ESI,† Fig. S8.
Wettability of PANI-coated carbon papers
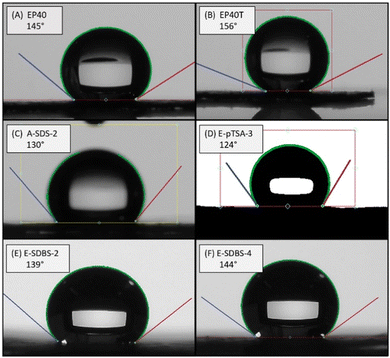
Despite a measurement of the external contact angle not being precise to determine the wettability of a GDL due to the influence of the roughness of the surface and not taking the capillary forces into account,62 goniometry allows rapid testing and an estimation of the hydrophobicity of the material. Further, the determined contact angles for the coatings vary in a range of 10–20° (see ESI,† Fig. S9). To enable rapid screening and comparison of the samples, the highest contact angle selected, as this gives an indication what hydrophobicity can be achieved.The contact angles of the pristine carbon paper EP40 and PTFE-treated carbon paper EP40T, as well as of the PANI-coated samples are depicted in Table 4. Images of the determined CA of selected samples and the reference are depicted in Fig. 9. In general, the CA of the samples increased over a timeframe of two weeks after the drying, hence the number of days since the synthesis are also given in Table 4. An increasing hydrophobicity of the carbon paper after storage under atmospheric conditions is in agreement with the reports of Govindaraj et al.56 who proposed an altered surface chemistry such as the transition of emeraldine salt to emeraldine base as well as morphological changes such as self-agglomeration being responsible for the increased hydrophobicity. However as discussed above, no change in the surface chemistry was detected with the FTIR, which points toward morphology modifications being responsible for the increased CA. Nevertheless, coatings not containing any surfactants such as A-HCl-1 were not able to achieve hydrophobic contact angles despite the ageing under atmospheric conditions which demonstrates the importance of the surfactant dopants for the hydrophobic coating.
| Sample | Days since synthesis | CA |
|---|---|---|
| EP40 | — | 142–145° |
| EP40T | — | 152–156° |
| A-HCl-2 | — | Hydrophilic |
| A-SDS-2 | 4 | 110–130° |
| A-SDS-2 | After in situ testing | 116–136° |
| E-pTSA-2 | 5 | 89–109° |
| E-pTSA-2 | 30 | 102–122° |
| E-pTSA-3 | 23 | 104–124° |
| E-SDBS-2 – front | 7 | 119–139° |
| E-SDBS-2 – back | 7 | 118–138° |
| E-SDBS-3 | 7 | 111–131° |
| E-SDBS-4 – front | 7 | 124–144° |
| E-SDBS-4 – back | 7 | 103–123° |
The highest CA achieved by the dip-coated samples was 130° (A-SDS-2) and the highest CA of the electrocoated samples was 144° (E-SDBS-4). The determined CAs depicted in Table 4 illustrate that using the dopants SDBS, SDS as well as pTSA CAs above 120° can be achieved. According to Liu et al. commercial GDLs have CAs in the range of 100 to 155°, depending on the application.63 Hence, these fabricated surfactant doped PANI coatings demonstrate the potential to produce PTFE-free GDLs.
Sample E-SDBS-4 was not turned around during the electrosynthesis. Since always the foreside was facing the CE, more coating was deposited on this side (see Surface morphology and coating distribution). The CA of the front and the back were 144° and 123°, respectively, which indicates a different wettability of the two sides. On the other hand, sample E-SDBS-2 was turned around during the electrosynthesis and the determined CAs of the front and back were 139° and 138°, respectively, which indicates a similar hydrophobicity on both sides.
Sample E-SDBS-2 was exposed to 100 cycles of CV and the determined CA of 139° was not altered by the cycling. Further, sample A-SDS-2, which was used as cathodic GDL in the in situ testing in the PEFC, had a CA of 130° before and 136° after the testing. This demonstrates the coating being able to sustain the hydrophobic properties over the duration of the testing.
According to Stejskal et al. the use of APS as oxidant leads to the formation and insertion of sulphate or hydrogen sulphate,21 which are attracted by the positively charged PANI chain, leading to a more hydrophilic material. Further, Stejskal et al. proposed using a base for dedoping of PANI followed by a redoping to insert the desired counter ion.21 In this study, we investigate whether the coatings sustains the basic dedoping and acidic redoping step starting from a hydrophilic E-HCl-1. As discussed above (see Fig. 7), the FTIR spectrum suggests redoped PANI being present on the carbon paper. Despite E-pTSA-3 achieving CAs of up to 124° which demonstrates the suitability of pTSA for hydrophobic coatings, the redoped E-HCl-1-R(pTSA) coating was as hydrophilic as the pristine E-HCl-1 coating. The coating E-HCl-1-R(pTSA) being hydrophilic, despite the insertion of the amphiphilic dopants, points towards a strong influence of the morphology, which could have preserved the hydrophilicity despite the redoping.
Nevertheless, the hydrophilic sample A-HCl-2 was successfully redoped to A-HCl-2-R(pTSA) which achieved hydrophobic CAs above 90°.
Surface morphology and coating distribution
The surface morphology of the electrocoated samples is exclusively composed of globular structures (see Fig. 10(K)), whereas the dip-coated samples also feature rod-like (see Fig. 10(O)) and sponge-like structures (see Fig. 10(G)).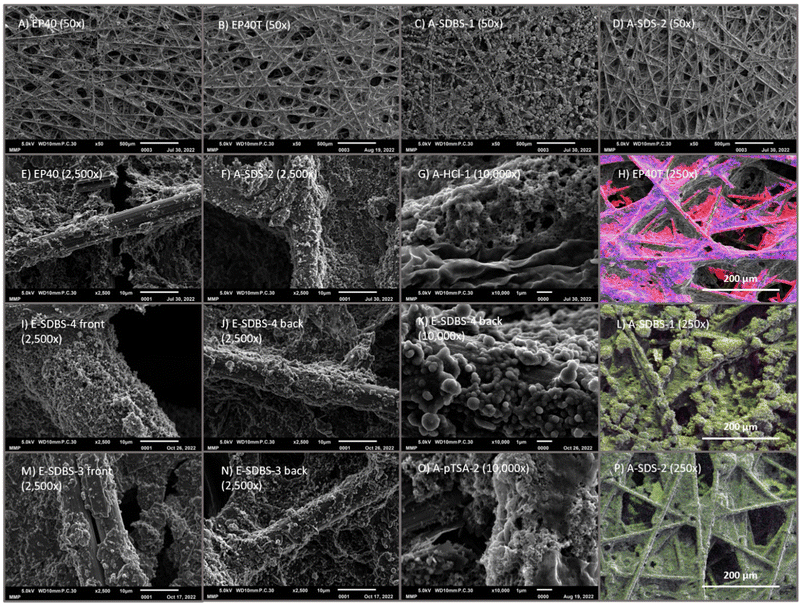 | ||
Fig. 10 SEM images of coated CP with magnification 50×, 2500× and 10![[thin space (1/6-em)]](https://www.rsc.org/images/entities/char_2009.gif) 000× and EDX mapping of the investigated samples and the reference (color code is depicted in Table 5, for simplicity carbon is not shown in the PANI-coated samples). Additional SEM & EDX images are shown in ESI,† Fig. S10. 000× and EDX mapping of the investigated samples and the reference (color code is depicted in Table 5, for simplicity carbon is not shown in the PANI-coated samples). Additional SEM & EDX images are shown in ESI,† Fig. S10. | ||
Comparing the two sides of the electrocoated sample E-SDS-1 (see ESI†) it can be seen that on the front a larger amount of coating is deposited and the majority of the fibres are coated, whereas on the backside there are bare fibres visible. Also, for sample E-SDBS-4 a difference between the two sides is observable (see Fig. 10(I) and (J)), however since overall more coating was deposited, also the fibres on the backside are covered with a PANI film, which is recognizable, when comparing the SEM images to the reference EP40 (see Fig. 10(E)).
The SEM images of the electrocoated sample E-SDBS-3 show a similar coating on both sides (see Fig. 10(M) and (N)), which demonstrates that a divergence between the two sides of the carbon paper can be avoided by turning the carbon paper around during the electrosynthesis. Moreover, no bare fibres are detected on either of the two sides.
By using two CEs one can spare the turning of the WE to achieve uniform coating on both sides. However, porosity gradients have demonstrated to improve the removal of water and the transport of reactant gases64,65 and could ultimately substitute an MPL. Whereas the determined CA suggest a different wettability on the two sides (see Wettability of the PANI-coated carbon papers), a different porosity and pore size can be seen in the SEM images (see ESI,† Fig. S10).
On the dip-coated sample A-SDS-2, no blank fibres are visible and the coating consists of globular structures (see Fig. 10(F) and (P)). In the case of A-pTSA-2 (Fig. 10(O)) there are both rod-like and sponge-like structures, however some fibres are not coated at all. An interesting feature of A-SDBS-1 (see Fig. 10(C)) are the chunks which are found all over the carbon paper. At a magnification of 10![[thin space (1/6-em)]](https://www.rsc.org/images/entities/char_2009.gif) 000× it is visible that there are some blank fibres next to the chunks (see ESI,† Fig. S10-C3). This suggests in this case PANI formation is favoured on already deposited PANI. A similar pattern can be observed for PTFE in EP40T. According to the EDX analysis the carbon paper EP40 consists of 100% carbon, whereas EP40T contains 75.70 atom% carbon and 24.30 atom% fluorine (see Table 5 and Fig. 10(H)). The fluorine content is due to the 13 wt% PTFE as wetproofing agent. In the EDX analysis of the PANI-coated carbon paper other elements were detected (see Fig. 10(L) and (P) and ESI,† Fig. S10-4, carbon is not depicted for clarity). Nitrogen can be assigned to the PANI, whereas a detection of S and Cl points toward the insertion of counter ions. Oxygen on the other hand could be introduced either as part of the surfactant counter ions or via oxidation of the PANI during storage. It can be seen that the nitrogen (green) and sulphur atoms are homogeneously distributed over the carbon paper. Further, also fibres where no coating was visible on the SEM images appear to be covered with PANI.
000× it is visible that there are some blank fibres next to the chunks (see ESI,† Fig. S10-C3). This suggests in this case PANI formation is favoured on already deposited PANI. A similar pattern can be observed for PTFE in EP40T. According to the EDX analysis the carbon paper EP40 consists of 100% carbon, whereas EP40T contains 75.70 atom% carbon and 24.30 atom% fluorine (see Table 5 and Fig. 10(H)). The fluorine content is due to the 13 wt% PTFE as wetproofing agent. In the EDX analysis of the PANI-coated carbon paper other elements were detected (see Fig. 10(L) and (P) and ESI,† Fig. S10-4, carbon is not depicted for clarity). Nitrogen can be assigned to the PANI, whereas a detection of S and Cl points toward the insertion of counter ions. Oxygen on the other hand could be introduced either as part of the surfactant counter ions or via oxidation of the PANI during storage. It can be seen that the nitrogen (green) and sulphur atoms are homogeneously distributed over the carbon paper. Further, also fibres where no coating was visible on the SEM images appear to be covered with PANI.
| C/atom% | N/atom% | O/atom% | S/atom% | F/atom% | |
|---|---|---|---|---|---|
| Color | Red | Green | Yellow | Magenta | Blue |
| EP40 | 100 | 0 | 0 | 0 | 0 |
| EP40T | 75.7 | 0 | 0 | 0 | 24.3 |
| A-SDBS-1 | 86.6 | 5.7 | 5.9 | 1.7 | 0 |
| A-SDS-2 | 89.5 | 5.1 | 4.2 | 1.0 | 0 |
| A-HCl-1 | 88.3 | 5.1 | 5.4 | 0.9 | 0 |
| A-pTSA-2 | 88.9 | 5.1 | 5.1 | 1.0 | 0 |
| E-SDS-1 | 88.2 | 5.0 | 5.4 | 1.4 | 0 |
| E-pTSA-8 | 92.3 | 3.9 | 2.9 | 0.9 | 0 |
| E-SDBS-1 | 86.3 | 5.2 | 6.2 | 2.4 | 0 |
| E-SDBA-3 front | 85.9 | 5.2 | 7.0 | 1.9 | 0 |
| E-SDBS-3 back | 90.1 | 4.1 | 4.6 | 1.2 | 0 |
| E-SDBS-4 front | 84.5 | 5.6 | 7.5 | 2.4 | 0 |
| E-SDBS-4 back | 90.4 | 4.0 | 4.3 | 1.4 | 0 |
In emeraldine salt, the chain is half-oxidized meaning for every nitrogen atom there should be 0.5 counter ions.34 Since the dopants SDBS, DBSA and pTSA all contain one sulphur atom as well as three oxygen atoms, there should be 0.5 S and 1.5 O atoms present for each N atom. The dopant SDS contains four oxygen atoms and one sulphur atom, hence 2.0 O and 0.5 S atoms for each N atom would be expected. As shown in Table 5, for each sample the S content is lower compared to the ideal dopant content and except for A-SDS-2 and A-HCl-1 no Cl was detected. Especially the dip-coated samples contain less dopants than expected for ideal ES. This could be because not all PANI is in the half-oxidized state or not all of the emeraldine base was doped to yield the emeraldine salt. Possibly the PANI on the surface of the coating is more easily doped since the large dopants are insufficiently transported into pores, or some agglomerates of PANI are better oxidized due to incomplete mixing in the reaction solution of the dip-coating. Further, the washing of the sample could reduce the amount of counter ions bound to PANI, however, the electrocoated sample such as E-SDBS-1 contain about the theoretical value of 0.5 counter ions despite being washed with deionized water.
Furthermore, the ratio of O to S is larger than expected for samples such as A-pTSA-2 and E-SDBS-3. Since the PANI was stored in air this could be due to oxidation reactions occurring during the ageing process, as has been reported by Govindaraj et al.56
In the EDX measurement for A-HCl-1 where HCl was the only dopant used, still S was detected. This is in agreement with the conclusion by Stejskal et al. that sulphate is inserted as counter ion if APS is used for the synthesis.21 Sulphate contains four O and one S atom, consequently the ratio of O to S would increase, since APS was used as oxidant.
In situ fuel cell testing
Although E-SDBS-4 has the highest CA of all samples, it was not used for in situ testing, since the CA on the side turned away from the CE during the synthesis, has a lower CA. Instead samples A-SDS-2 and E-SDBS-3 were selected since they have high CA on both sides of the carbon paper and the SEM & EDX images show a uniform coating.Electrochemical impedance spectroscopy
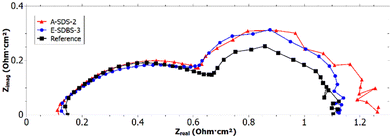
From the intersection of the recorded EIS (see Fig. 11) and the x-axis in the high frequency region66 it can be deduced that both A-SDS-2 and E-SDBS-3 have a lower ohmic resistance REL compared to the reference. The lower resistance could be due to the higher electrical conductivity of the PANI-coated GDL compared to the PTFE-treated reference.Whereas the anode charge transfer resistance RCT of all tested cells was identical, for the reference a slightly higher cathode RCT compared to the PANI-coated samples was determined. However, the mass transport resistance RMT of the PANI-coated samples was larger compared to the reference. This could be due to a too thick coating which blocked some of the pores necessary for the mass transport.
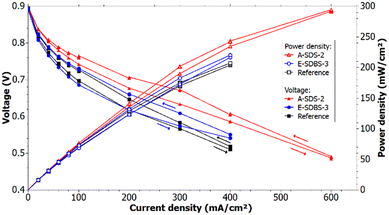
Polarization curve
The region up to 0.07 A cm−2 in the polarization curve can be used to identify the different activation losses for the samples (see Fig. 12). Since the voltage drop is larger for the reference compared to sample A-SDS-2 it can be deduced that the activity of the catalyst of A-SDS-2 is higher. The activation losses of the electrocoated sample and the reference are similar. We suspect that the difference in the catalyst activity is due to interfacial and contacting differences of the GDLs and the CL which could be due to a different morphology of the PANI depending on the coating technique and coating thickness.Comparing the polarization curves of the reference and the samples at the same RH, it can be seen that the ohmic losses are higher in the reference measurement. Applying a linear fit through the ohmic region starting at 200 mA cm−2, it can be determined that the slope of A-SDS-2 is 16% lower compared to the reference, whereas the slope of E-SDBS-3 is 21% lower. The better performance of the PANI-coated GDLs could be due to a better humidification of the electrolyte membrane since the PANI coating is more hydrophilic compared to the carbon paper EP40T. Furthermore, this could indicate a better electrical conductivity due to the PANI coating, which was also suggested by the EIS measurement. The conducting coating could lower the contact resistance between the GDL and its neighbouring components which are the bipolar plates and the catalyst layer.
Fig. 12 shows the calculated power density of the measurement with 50% RH. The power density at 30% RH is shown in ESI,† Fig. S5. It can be seen that the dip-coated and the electrocoated carbon papers can achieve higher maximum power compared to the reference at 30% and 50% RH. The calculated values for the maximum power density for each sample and the reference are depicted in Table 6. At a RH of 50% samples A-SDS-2 and E-SDBS-3 achieved a 42% and 6%, respectively, higher maximum power compared to the reference. The recorded polarization curves demonstrate the cells with the PANI-coated GDLs can achieve higher current and power density for a given voltage compared to the reference with PTFE treated GDLs.
| Relative humidity (RH) | Reference | A-SDS-2 | E-SDBS-3 (before 100 h hold) | E-SDBS-3 (after 100 h hold) | |
|---|---|---|---|---|---|
| 30% | OCV/V | 0.882 ± 0.001 | 0.880 ± 0.001 | 0.888 ± 0.001 | 0.863 ± 0.001 |
| Max current density/mA cm−2 | 300 | 400 | 300 | 300 | |
| Max power density/mW cm−2 | 141 ± 1 | 194 ± 1 | 146 ± 1 | 141 ± 1 | |
| 50% | OCV/V | 0.899 ± 0.001 | 0.902 ± 0.001 | 0.890 ± 0.001 | 0.869 ± 0.001 |
| Max current density/mA cm−2 | 400 | 600 | 400 | 400 | |
| Max power density/mW cm−2 | 207 ± 1 | 294 ± 1 | 220 ± 1 | 207 ± 1 |
The overall performance is lower than of state-of-the-art GDLs which use MPLs. However, in this study we wanted to focus on the impact of the PANI-coating on the GDL and prevent any overshadowing influence of the MPL on the performance.
The electrocoated GDL was subjected to a 100 h hold with a current density of 350 mA cm−2. At the beginning, the cell voltage was 0.61 V and during the hold the voltage dropped with an average of 0.55 mV h−1 to ultimately 0.55 V (see ESI,† Fig. S6). After the 100 h hold, the polarization curve was repeated and the maximum power densities at 30% RH and 50% RH were 6% and 11%, respectively, lower compared to the measurement before the hold (see ESI,† Fig. S4). As depicted in Table 6, the obtained values are identical with the reference measurement which was not subjected to a 100 h hold. Hence, despite the ageing the PTFE-free GDL was able to achieve a similar performance to the commercial PTFE-treated GDLs.
Conclusions
In this paper, commercial carbon paper (AvCarb EP40) was coated with PANI via dip-coating and electropolymerization to produce PTFE-free GDLs for PEFCs. The influence of various dopants such as HCl, SDS, SDBS and pTSA was investigated using ex situ and in situ techniques. Of them, SDS and SDBS showed to be the most promising.CA of up to 144° were achieved using SDBS which is in the range of commercial carbon paper (100–155°).63 The recorded infrared spectra of the coated carbon papers confirm the deposition of PANI. SEM images of selected samples indicate the electrochemically synthesized PANI coating has exclusively a globular morphology. In the case of dip coating, globular, rod-like and sponge-like structures were detected. EDX analysis suggests that on both dip-coated and electrocoated carbon paper, a homogeneous coating with PANI was achieved on the fibres, which is indicated by the detection of nitrogen. Furthermore, a nitrogen atom to dopant ratio of up to 3![[thin space (1/6-em)]](https://www.rsc.org/images/entities/char_2009.gif) :
:![[thin space (1/6-em)]](https://www.rsc.org/images/entities/char_2009.gif) 1 was measured. This is higher than the theoretical ratio of 2
1 was measured. This is higher than the theoretical ratio of 2![[thin space (1/6-em)]](https://www.rsc.org/images/entities/char_2009.gif) :
:![[thin space (1/6-em)]](https://www.rsc.org/images/entities/char_2009.gif) 1 for the conducting emeraldine salt. This divergence indicates that the surfactant dopants inserted into the coating to obtain the hydrophobicity are still present after washing the coating with deionised water. This is a promising finding in terms of retention of dopants and stability of hydrophobicity.
1 for the conducting emeraldine salt. This divergence indicates that the surfactant dopants inserted into the coating to obtain the hydrophobicity are still present after washing the coating with deionised water. This is a promising finding in terms of retention of dopants and stability of hydrophobicity.
The performed cyclic voltammetry furthermore shows that the coating adheres well to the carbon paper and is electrochemically stable in the potential range of a fuel cell. The deposited surfactant doped polyaniline layers are thus able to provide tuneable and stable hydrophobic properties in fuel cell gas diffusion layers.
Dip coated PANI/SDS and electropolymerized PANI/SDBS were tested in situ as cathodic GDL of a PEFC and compared to commercial carbon paper EP40T. The PANI-coated GDL achieved up to 42% higher power density compared to the reference and exhibited stable behaviour over 100 h of constant operation. Furthermore, EIS measurements showed that the PANI coating reduced the ohmic losses of the cell compared to the reference, which results in an 16% smaller slope in the ohmic region of the polarization curve.
Conflicts of interest
There are no conflicts of interest to declare.Acknowledgements
This work was funded by the Anschubsfinanzierung of the Field of Expertise “Mobility and Production” of the Graz University of Technology. Moreover, this project has received funding from the European Union's Horizon 2020 research and innovation programme under the Marie Skłodowska–Curie grant agreement no. 899987 as well as EIRES – Eindhoven Institute for Renewable Energy Systems. The authors are thankful to Mathias Heidinger for helping with performing the in situ testing as well as for the constructive feedback and to Maximilian Grandi for the constructive feedback.Notes and references
- A. Ozden, S. Shahgaldi, X. Li and F. Hamdullahpur, Prog. Energy Combust. Sci., 2019, 74, 50–102 CrossRef.
- A. A. Franco, Polymer electrolyte fuel cells: science, applications, and challenges, Pan Stanford, 2013 Search PubMed.
- P. C. Okonkwo and C. Otor, Int. J. Energy Res., 2021, 45, 3780–3800 CrossRef CAS.
- F. C. Lee, M. S. Ismail, D. B. Ingham, K. J. Hughes, L. Ma, S. M. Lyth and M. Pourkashanian, Renewable Sustainable Energy Rev., 2022, 166, 112640 CrossRef CAS.
- K. Jiao and X. Li, Prog. Energy Combust. Sci., 2011, 37, 221–291 CrossRef CAS.
- J. M. Morgan and R. Datta, J. Power Sources, 2014, 251, 269–278 CrossRef CAS.
- D. P. Leonard and R. L. Borup, ECS Meeting Abstracts, 2019, MA2019-02, 1426–1426.
- H. Kim, Y. J. Lee, S. J. Lee, Y. S. Chung and Y. Yoo, J. Mater. Sci., 2014, 49, 3831–3838 CrossRef CAS.
- US DRIVE Hydrogen Storage Tech Team Roadmap, https://www.energy.gov/sites/default/files/2017/08/f36/hstt_roadmap_July2017.pdf (accessed November 2022).
- S. T. Thompson, B. D. James, J. M. Huya-Kouadio, C. Houchins, D. A. DeSantis, R. Ahluwalia, A. R. Wilson, G. Kleen and D. Papageorgopoulos, J. Power Sources, 2018, 399, 304–313 CrossRef CAS.
- E. Dhanumalayan and G. M. Joshi, Adv. Compos. Hybrid Mater., 2018, 1, 247–268 CrossRef CAS.
- S. Liu, K. Wippermann and W. Lehnert, Int. J. Hydrogen Energy, 2021, 46, 14687–14698 CrossRef CAS.
- W. Pan, Z. Chen, D. Yao, X. Chen, F. Wang and G. Dai, Chem. Eng. Sci., 2021, 246, 117001 CrossRef CAS.
- A. Blum, S. A. Balan, M. Scheringer, X. Trier, G. Goldenman, I. T. Cousins, M. Diamond, T. Fletcher, C. Higgins, A. E. Lindeman, G. Peaslee, P. de Voogt, Z. Wang and R. Weber, Environ. Health Perspect., 2015, 123, A107–A111 CrossRef PubMed.
- I. Jiménez-Morales, A. Reyes-Carmona, M. Dupont, S. Cavaliere, M. Rodlert, F. Mornaghini, M. J. Larsen, M. Odgaard, J. Zajac, D. J. Jones and J. Rozière, Carbon Energy, 2021, 3, 654–665 CrossRef.
- FY2019 Progress Report for the DOE Hydrogen and Fuel Cells Program, https://www.nrel.gov/docs/fy20osti/76055.pdf (accessed November 2022).
- 2020 DOE Fuel Cell Technologies Office Annual Merit Review, https://www.hydrogen.energy.gov/pdfs/review20/fc319_borup_2020_p.pdf (accessed November 2022).
- B. A. Newcomb, Composites, Part A, 2016, 91, 262–282 CrossRef CAS.
- G. P. Song and D. X. Xia, Acta Phys.-Chim. Sin., 2014, 30, 583–588 CAS.
- J. Ouyang, Acta Phys.-Chim. Sin., 2018, 34, 1211–1220 CAS.
- J. Stejskal, J. Prokeš and M. Trchová, React. Funct. Polym., 2008, 68, 1355–1361 CrossRef CAS.
- J. Stejskal, D. Hlavatá, P. Holler, M. Trchová, J. Prokeš and I. Sapurina, Polym. Int., 2004, 53, 294–300 CrossRef CAS.
- V. Ratautaite, A. Ramanaviciene, Y. Oztekin, J. Voronovic, Z. Balevicius, L. Mikoliunaite and A. Ramanavicius, Colloids Surf., A, 2013, 418, 16–21 CrossRef CAS.
- M. F. Zainal, Y. Mohd and R. Ibrahim, IEEE Business Engineering and Industrial Applications Colloquium, 2013 DOI:10.1109/BEIAC.2013.6560208.
- S. ur Rahman, P. Röse, M. Surati, A. ul H. A. Shah, U. Krewer and S. Bilal, Polymers, 2020, 12, 2705 CrossRef CAS PubMed.
- W.-C. Chen, T.-C. Wen and H. Teng, Electrochim. Acta, 2003, 48, 641–649 CrossRef CAS.
- H. Kim, G. Veerappan and J. H. Park, Electrochim. Acta, 2014, 137, 164–168 CrossRef CAS.
- X. X. Wang, G. F. Yu, J. Zhang, M. Yu, S. Ramakrishna and Y. Z. Long, Prog. Mater. Sci., 2021, 115, 426–446 CrossRef.
- R. Balint, N. J. Cassidy and S. H. Cartmell, Acta Biomater., 2014, 10, 2341–2353 CrossRef CAS PubMed.
- A. M. Grancarić, I. Jerković, V. Koncar, C. Cochrane, F. M. Kelly, D. Soulat and X. Legrand, J. Ind. Text., 2018, 48, 612–642 CrossRef.
- F. Gao, J. Mu, Z. Bi, S. Wang and Z. Li, Prog. Org. Coat., 2021, 216, 110589 Search PubMed.
- A. Korent, K. Ž. Soderžnik and K. Ž. Rožman, Proceedings, 2020, 56, 32 Search PubMed.
- A. Korent, K. Žagar Soderžnik, S. Šturm and K. Žužek Rožman, J. Electrochem. Soc., 2020, 167, 106504 CrossRef CAS.
- G. D’Aprano, M. Leclerc and G. Zotti, Macromolecules, 1992, 25, 2145–2150 CrossRef.
- P. Kong, P. Liu, Z. Ge, H. Tan, L. Pei, J. Wang, P. Zhu, X. Gu, Z. Zheng and Z. Li, Catal. Sci. Technol., 2019, 9, 753–761 RSC.
- S. Bhadra, D. Khastgir, N. K. Singha and J. H. Lee, Prog. Polym. Sci., 2009, 34, 783–810 CrossRef CAS.
- J. Prokeš and J. Stejskal, Polym. Degrad. Stab., 2004, 86, 187–195 CrossRef.
- L. Brožová, P. Holler, J. Kovářová, J. Stejskal and M. Trchová, Polym. Degrad. Stab., 2008, 93, 592–600 CrossRef.
- J. Tarver, J. E. Yoo, T. J. Dennes, J. Schwartz and Y. L. Loo, Chem. Mater., 2009, 21, 280–286 CrossRef CAS.
- G. Liao, Q. Li and Z. Xu, Prog. Org. Coat., 2019, 126, 35–43 CrossRef CAS.
- K. Kocher and V. Hacker, ChemistryOpen, 2020, 9, 1109–1112 CrossRef CAS PubMed.
- X. Fu, S. Wang, Z. Xia, Y. Li, L. Jiang and G. Sun, Int. J. Hydrogen Energy, 2016, 41, 3655–3663 CrossRef CAS.
- L. Cindrella and A. M. Kannan, J. Power Sources, 2009, 193, 447–453 CrossRef CAS.
- M. Talikowska, X. Fu and G. Lisak, Biosens. Bioelectron., 2019, 135, 50–63 CrossRef CAS PubMed.
- X. Guo and A. Facchetti, Nat. Mater., 2020, 19, 922–928 CrossRef CAS PubMed.
- R. Ansari and M. B. Keivani, J. Chem., 2006, 3, 202–217 CAS.
- R. v Ingle, S. F. Shaikh, P. K. Bhujbal, H. M. Pathan and V. A. Tabhane, ES Mater. Manuf., 2020, 8, 54–59 CAS.
- M. O. Ansari and F. Mohammad, Sens. Actuators, B, 2011, 157, 122–129 CrossRef CAS.
- J.-Y. Kwon, E.-Y. Kim and H.-D. Kim, Macromol. Res., 2004, 12, 303–310 CrossRef CAS.
- W. Leng, S. Zhou, G. Gu and L. Wu, J. Colloid Interface Sci., 2012, 369, 411–418 CrossRef CAS PubMed.
- M. Oh and S. Kim, Electrochim. Acta, 2012, 78, 279–285 CrossRef CAS.
- Fuel Cell Store, https://www.fuelcellstore.com/fuel-cell-components/gas-diffusion-layers/carbon-paper/avcarb-carbon-paper/avcarb-ep40 (accessed November 2022).
- H. Xu, J. Liu, Y. Chen, J. Tang and Z. Zhao, J. Appl. Polym. Sci., 2016, 133, 44248 Search PubMed.
- M. Bodner, Ž. Penga, W. Ladreiter, M. Heidinger and V. Hacker, Energies, 2021, 14, 7929 CrossRef CAS.
- European Commision, Joint Research Centre, G. De Marco, T. Malkow, G. Tsotridis, A. Pilenga, Joint Research Centre, EU harmonised test protocols for PEMFC MEA testing in single cell configuration for automotive applications., Publications Office, 2016 DOI:10.2790/54653.
- Y. Govindaraj and S. Parida, Appl. Surf. Sci., 2019, 481, 174–183 CrossRef CAS.
- M. Reza, N. Srikandi, A. N. Amalina, D. P. Benu, F. V. Steky, A. Rochliadi and V. Suendo, IOP Conf. Ser.: Mater. Sci. Eng., 2019, 599, 012002 CAS.
- J. Stejskal, M. Hajná, V. Kašpárková, P. Humpolíček, A. Zhigunov and M. Trchová, Synth. Met., 2014, 195, 286–293 CrossRef CAS.
- J. Xing, M. Liao, C. Zhang, M. Yin, D. Li and Y. Song, Phys. Chem. Chem. Phys., 2017, 19, 14030–14041 RSC.
- M. Ohira, T. Sakai, M. Takeuchi, Y. Kobayashi and M. Tsuji, Synth. Met., 1987, 18, 347–352 CrossRef CAS.
- A. G. Macdiarmid, J.-C. Chiang, M. Halpern, W.-S. Huang, S.-L. Mu, L. D. Nanaxakkara, S. W. Wu and S. I. Yaniger, Mol. Cryst. Liq. Cryst., 1985, 121, 173–180 CrossRef CAS.
- V. Gurau, M. J. Bluemle, E. S. de Castro, Y. M. Tsou, J. A. Mann and T. A. Zawodzinski, J. Power Sources, 2006, 160, 1156–1162 CrossRef CAS.
- C. P. Liu, P. Saha, Y. Huang, S. Shimpalee, P. Satjaritanun and I. V. Zenyuk, ACS Appl. Mater. Interfaces, 2021, 13, 20002–20013 CrossRef CAS PubMed.
- R. Omrani and B. Shabani, Int. J. Hydrogen Energy, 2017, 42, 28515–28536 CrossRef CAS.
- I. M. Kong, A. Jung, Y. S. Kim and M. S. Kim, Energy, 2017, 120, 478–487 CrossRef CAS.
- V. Hacker and S. Mitsushima, Fuel Cells and Hydrogen, Elsevier, 2018 Search PubMed.
Footnote |
| † Electronic supplementary information (ESI) available. See DOI: https://doi.org/10.1039/d2ma01104b |
| This journal is © The Royal Society of Chemistry 2023 |

