
 Open Access Article
 This Open Access Article is licensed under a
 Creative Commons Attribution 3.0 Unported Licence
Synthesis, structure and electrochemical properties of a new cation ordered layered Li–Ni–Mg–Mo oxide†
Bo
Dong
 *ab,
Javier
Castells-Gil
ab,
Pengcheng
Zhu
bc,
Laura L.
Driscoll
ab,
Emma
Kendrick
bc,
Phoebe K.
Allan
ab and
Peter R.
Slater
*ab
*ab,
Javier
Castells-Gil
ab,
Pengcheng
Zhu
bc,
Laura L.
Driscoll
ab,
Emma
Kendrick
bc,
Phoebe K.
Allan
ab and
Peter R.
Slater
*ab
aSchool of Chemistry, University of Birmingham, Birmingham B15 2TT, UK. E-mail: b.dong@bham.ac.uk; p.r.slater@bham.ac.uk
bThe Faraday Institution, Harwell Science and Innovation Campus, Didcot OX11 0RA, UK
cSchool of Metallurgy and Materials, University of Birmingham, Birmingham B15 2TT, UK
First published on 13th January 2023
Abstract
Lithium-rich oxides are attracting intense interest as the next generation cathode materials for lithium-ion batteries due to their high theoretical capacity. Nevertheless, these materials suffer from a number of shortcomings, such as oxygen loss at high voltage, large hysteresis and poor rate capability. In this work, we show that through a dual cation substitution strategy replacing Ti with Mo and Mg, the disordered rocksalt (DRS) Li1.2Ni0.4Ti0.4O2 is transformed into a new cation ordered layered phase Li1.2Ni0.4Mo0.2Mg0.2O2, with the high valence dopant Mo6+ on the (0,0,0) site. Li1.2Ni0.4Mo0.2Mg0.2O2 showed improved performance compared to that of the similarly prepared DRS Li1.2Ni0.4Ti0.4O2 material (∼190 mA h g−1vs. ∼105 mA h g−1 after 10 cycles, respectively). The characteristics of the electrochemical process were studied using ex situ XRD and XAS, which indicated the involvement of both Ni and Mo redox during the cycling as well as the electrochemical instability of the layered phase which changes to a disordered rocksalt phase on cycling.
Introduction
Lithium-ion batteries (LIBs) are widely used as energy storage resources for portable electronics and electric vehicles due to their high energy densities.1 Nevertheless, in order to satisfy the consumer demand for the long driving range, systems with increased energy densities are being sought. Considering the much higher theoretical and practical capacities of anode materials, the optimisation of cathode materials is crucial in obtaining improved lithium-ion batteries with overall higher energy densities.2Spinel LiMn2O4, olivine LiFePO4 and layered LiNixCoyMn1−x−yO2 positive electrode materials have been commercially utilised in rechargeable lithium-ion batteries.3–6 Lithium excess electrode materials, such as Li2MnO3, with higher theoretical capacity have attracted much attention in the last decade.3,4 Theoretically, Li2MnO3 should be of limited use as a cathode due to the redox inactive Mn4+ in the structure. However, practically it has been shown to deliver high reversible capacity during cycling owing to the active redox of oxide ions (anion redox) instead of traditional transition metal ions. These results have inspired others to investigate Li excess cathode materials to obtain high capacities and understand this anion redox process. Combined spectroscopic studies first observed the formation of localized electron holes on the oxygen ions coordinated by Mn4+ and Li+ during the charge of Li1.2Ni0.13Co0.13Mn0.54O2.7 Recently, resonant inelastic X-ray scattering and 17O magic angle spinning NMR spectroscopy has demonstrated the formation of molecular O2, rather than O22−, which is trapped in the bulk, albeit a small quantity of O2 loss is observed from the surface, accounting for the capacity decay during the anion redox process.8
The high capacities achieved (>250 mA h g−1 associated with both cationic and anionic redox chemistry9–12) with these materials have therefore meant that lithium-rich oxides are attracting considerable interest as the next generation cathode materials for lithium-ion batteries. Still these materials can suffer from several drawbacks, such as oxygen loss at high voltage, large hysteresis and poor rate capability.10,13–18 To mitigate these drawbacks, a great deal of research has focused on the development of lithium-rich layered as well as disordered rocksalt cathodes, given the flexibility of these structures to incorporate different cation species.19,20
Of interest to the study we report here, the DRS Li1.2Mn0.4Ti0.4O2 has been reported to show 300 mA h g−1 capacity at 50 °C in the first cycle which rapidly decays to 200 mA h g−1 after six cycles. Its electrochemical performance can be further improved through mechanical ball milling with conductive carbons.21 Doping on the Mn site with Cr has led to high rate capability associated with non-topotactic reactions (octahedral-to-tetrahedral migration of Cr ions) in both Li1.2Mn0.2Ti0.4Cr0.2O2 and Li1.2Ni0.1Ti0.5Cr0.2O2.22 Furthermore, short-range ordering studies have revealed the improved performance of Li1.2Mn0.4Ti0.4O2 compared to that of Li1.2Mn0.4Zr0.4O2, which has been attributed to the high number of connected lithium sites and improved lithium diffusion within Li1.2Mn0.4Ti0.4O2.23 In comparison, the Ni analogue materials, Li1.2Ni0.4Ti0.4O2 have been less studied.24–27 Apart from DRS materials, lithium-rich layered materials have also attracted attention, and a series of layered materials, with a formula of Li4MM′O6 (M = Ni, Fe; M′ = Mo, Te, W) were reported and electrochemically characterised.9,28–30
In this work, we have studied the dual cation substitution (Mg2+ + Mo6+ Ξ 2Ti4+) in the disordered rocksalt (DRS) Li1.2Ti0.4Ni0.4O2 in order to try to improve the overal electrochemical performance of this DRS phase. Interestingly, rather than retaining the DRS structure, we show a change to a cation ordered layered material through this substitution strategy, and here we report the structure of this new system and the electrochemical performance.
Experimental
Synthesis
Li2CO3, Ni(NO3)2 6H2O, MoO3, C4H2Mg5O14·5H2O were chosen as starting materials. Li1.2Ni0.4Ti0.4O2, Li1.2Ni0.4Mo0.2Mg0.2O2, and Li1.1Ni0.6Mo0.15Mg0.15O2 were made through grinding together mixtures of starting materials in a mortar and pestle and heating at 650 °C/12 h with a rate of 2.5 °C min−1 to fully decompose carbonate, nitrate and hydrate from the starting materials. The mixture was then ball milled (with 10 – 15% excess lithium to compensate the lithium loss at high temperature) for 30 minutes using a Pulverisette 7 planetary ball mill (12 mL ZrO2 pots with 10 mm diameter ZrO2 balls) to gain fine powders. The powders were pressed into 16 mm diameter pellets at 0.2 tons and reheated at 900 °C/12 h with a rate of 5 °C min−1 for synthesis. The powders of Li1.2Ni0.4Mo0.2Mg0.2O2, and Li1.1Ni0.6Mo0.15Mg0.15O2 were further reground and reheated at 925 – 950 °C/12 h with a heating rate of 5 °C min−1 to gain the final product.X-Ray diffraction
X-Ray diffraction (XRD) data were collected using a Bruker D8 X-ray diffractometer with a linear position sensitive detector (PSD) (CuKα radiation). Room temperature XRD patterns were recorded over the 2θ range 15° to 80° with a 0.02° step size. For Rietveld refinement, data were collected over the 2θ range 15° to 120° with a 0.02° step size and structure refinement performed using the GSASII suite of Rietveld refinement software.31Electrochemical characterisation
The active materials and C65 (at the ratio of 9![[thin space (1/6-em)]](https://www.rsc.org/images/entities/char_2009.gif) :1) were ball milled at 400 rpm for 2 hours using a Pulverisette 7 planetary ball mill (45 mL Si3N4 pots with 10 mm diameter Si3N4 balls), before mixing with PVDF and C65 in NMP at a 8:1:1 ratio at 1800 rpm/20 min to create cathode ink slurry. The slurry was coated onto Al foil with a 150 micrometer doctor blade and dried at 120 °C in a vacuum oven overnight before use. Li metal (Aldrich) was used as the anode, which was rolled and punched into 15 mm disks. The composition of the electrolyte (R&D 281, Soulbrain) was 1.0 M LiPF6 in EC: EMC (ethylene carbonate/methyl carbonate, 3/7 V/V) with 1 wt% VC (Vinylene Carbonate) as an electrolyte additive. Microporous trilayer membrane(PP/PE/PP) (H1609, Celgard) was used as the separator.
:1) were ball milled at 400 rpm for 2 hours using a Pulverisette 7 planetary ball mill (45 mL Si3N4 pots with 10 mm diameter Si3N4 balls), before mixing with PVDF and C65 in NMP at a 8:1:1 ratio at 1800 rpm/20 min to create cathode ink slurry. The slurry was coated onto Al foil with a 150 micrometer doctor blade and dried at 120 °C in a vacuum oven overnight before use. Li metal (Aldrich) was used as the anode, which was rolled and punched into 15 mm disks. The composition of the electrolyte (R&D 281, Soulbrain) was 1.0 M LiPF6 in EC: EMC (ethylene carbonate/methyl carbonate, 3/7 V/V) with 1 wt% VC (Vinylene Carbonate) as an electrolyte additive. Microporous trilayer membrane(PP/PE/PP) (H1609, Celgard) was used as the separator.
The half cells using the components above were assembled as CR2032 coin cells in an argon-filled glove box. Galvanostatic charge/discharge with potential limitation (GVPL) measurements were conducted on the BCS805 cell tester (Bio-logic). The cells were cycled between 1.5 and 4.7/4.8 volts with constant current densities of 5–10 mA g−1 at either room temperature or 40 °C.
Scanning electron microscope (SEM)
Electrode samples were characterised by scanning electron microscopy (SEM, Apreo 2) utilising an EDT detector, with an accelerating voltage of 10 kV and spot size of 10. The working distance was set at around 10 mm. Magnifications of 200 and 500 were utilised for the observation of the samples. The elemental distributions on samples were measured by energy-dispersive X-ray spectroscopy (EDS) simultaneously with a fitted EDS detector (ChemiSEM).X-Ray absorption spectroscopy (XAS)
Ni K-edge XAS spectra of NiO, LiNiO2 and Li1.2Ni0.4Mo0.2Mg0.2O2 at cut-off voltages (pristine, 4.2 V, 4.7 V, 2.2 V and 1.5 V), and Mo K-edge XAS spectra of MoO2, MoO3 and Li1.2Ni0.4Mo0.2Mg0.2O2 at cut-off voltages (pristine, 4.2 V, 4.7 V, 2.2 V and 1.5 V) were collected at I19 beamline, diamond light source.Results and discussions
Structural characterisation
Li1.2Ni0.4Ti0.4O2 was successfully synthesised through solid state reaction in air, and was shown to adopt a disordered rock salt structure (a = b = c = 4.1158(3) Å, V = 69.72 (1) Å3) in agreement with prior reports.24 On replacing the Ti with a charge balanced combination of Mg and Mo (to give Li1.2Ni0.4Mo0.2Mg0.2O2), a change from a disordered rocksalt to a cation ordered layered phase was observed, as shown in Fig. 1(a). The XRD patterns of this new cation ordered layered phases are similar to Li4MoNiO6, Li4WNiO6 and Li4TeNiO6, whose structures are derived from that shown by Li5ReO6. A further system with higher Ni content, Li1.1Ni0.6Mo0.15Mg0.15O2, was also successfully prepared, and showed a similar XRD pattern (Fig. 1(a)).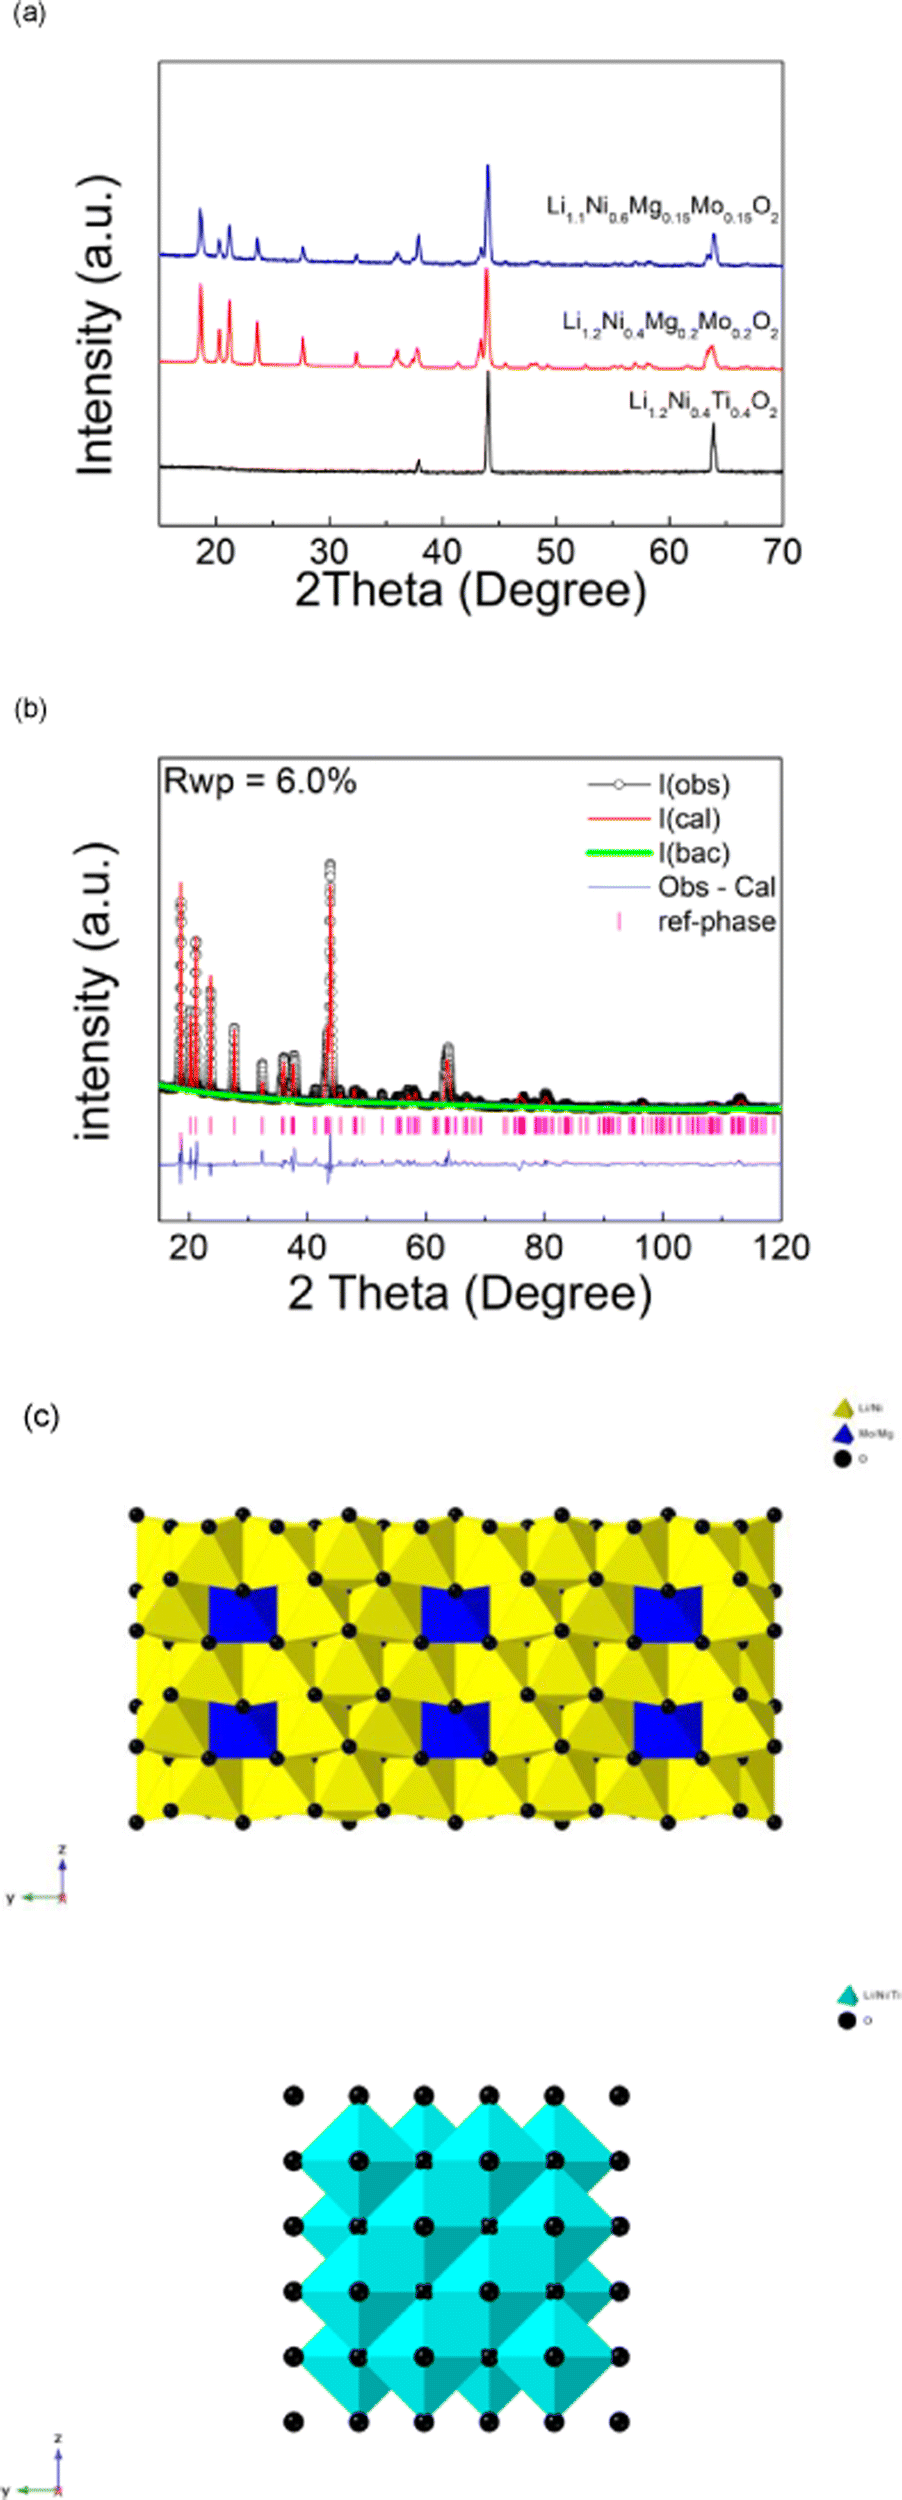 | ||
| Fig. 1 (a) XRD patterns of Li1.2Ni0.4Ti0.4O2, Li1.2Ni0.4Mo0.2Mg0.2O2 and Li1.1Ni0.6Mo0.15Mg0.15O2. (b) Observed, calculated and difference profiles from structure refinement for Li1.2Ni0.4Mo0.2Mg0.2O2. (c) Structure of Li1.2Ni0.4Mo0.2Mg0.2O2 and Li1.2Ni0.4Ti0.4O2. | ||
Structure refinement of Li1.2Ni0.4Mo0.2Mg0.2O2 was carried out using the XRD data. The starting model used was Li5ReO6 which has a monoclinic unit cell with C2/m space group. Re1 was replaced by Mo1/Mg1 while Ni1, Ni2 and Ni3 were added to Li1, Li2 and Li3 sites respectively. Constraints of the same atomic coordinates and Uiso values with overall full site occupancy were made for Mo1/Mg1 (occupancies were set 1 and 0 for Mo1 and Mg1), Ni1/Li1, Ni2/Li2 and Ni3/Li3. Uiso (atomic displacement parameters) of each atom was set to a default value, 0.02 Å2 and the scale factor, background (6 terms of shifted Chebyshev function) and lattice parameters were refined at first. The atomic coordinates of Mo1/Mg1, O1 and O2 were refined in turn and fixed after the convergency, followed by the refinement of the occupancies of Ni1/Li1, Ni2/Li2 and Ni3/Li3 (fixed after the convergency). The occupancies of Mo1/Mg1 were then refined which gave values of 0.58(1) for Mo1 and 0.42(1) for Mg1, which corresponds to all the Mo in the composition within errors and suggests that the remaining Mg was distributed on three Ni/Li sites. This observed preference of Mo on the (0,0,0) site is most likely the driving force for the change from the DRS to the layered phase.
To complete the structure refinement and to confirm that it was not a false structural minimum, the atomic positions of all atoms were then refined together along with the refinement of Uiso values of Mo1/Mg1, Ni1/Li1, Ni2/Li2 and Ni3/Li3 (Uiso values of O1 and O2 were fixed at 0.2 Å2). The final refined composition corresponded to Li3.79(4)Ni1.21(4)Mo0.58(1)Mg0.42(1)O6 (or Li1.26(2)Ni0.40(2)Mo0.19(1)Mg0.14(1)O2), which given the complex composition (4 different cations) is in good agreement with the expected composition. The final refined structural parameters of are shown in Table 1. A comparison of the structure of this phase to that of Li1.2Ni0.4Ti0.4O2 is shown in Fig. 1(c).
| Atom | x | y | z | Mult. | Occupancy | u iso (Å2) |
|---|---|---|---|---|---|---|
| Space group: C2/m, a = 5.0957(20) Å, b = 8.7638(5) Å, c = 5.0736(19) Å, beta = 110.18(1)°, V = 212.67 (1) Å3 | ||||||
| Mg1 | 0 | 0 | 0 | 2 | 0.42 | 0.020(2) |
| Mo1 | 0 | 0 | 0 | 2 | 0.58 | 0.020(2) |
| O1 | 0.290(1) | 0.340(1) | 0.726(1) | 8 | 1 | 0.020 |
| O2 | 0.311(1) | 0.5 | 0.172(1) | 4 | 1 | 0.020 |
| Ni1 | 0 | 0.663(1) | 0 | 4 | 0.375 | 0.023(2) |
| Li1 | 0 | 0.663(1) | 0 | 4 | 0.625 | 0.023(2) |
| Ni2 | 0 | 0.5 | 0.5 | 2 | 0.247 | 0.065(5) |
| Li2 | 0 | 0.5 | 0.5 | 2 | 0.753 | 0.065(5) |
| Ni3 | 0 | 0.168(2) | 0.5 | 4 | 0.106 | 0.015(5) |
| Li3 | 0 | 0.168(2) | 0.5 | 4 | 0.894 | 0.015(5) |
Electrochemical testing
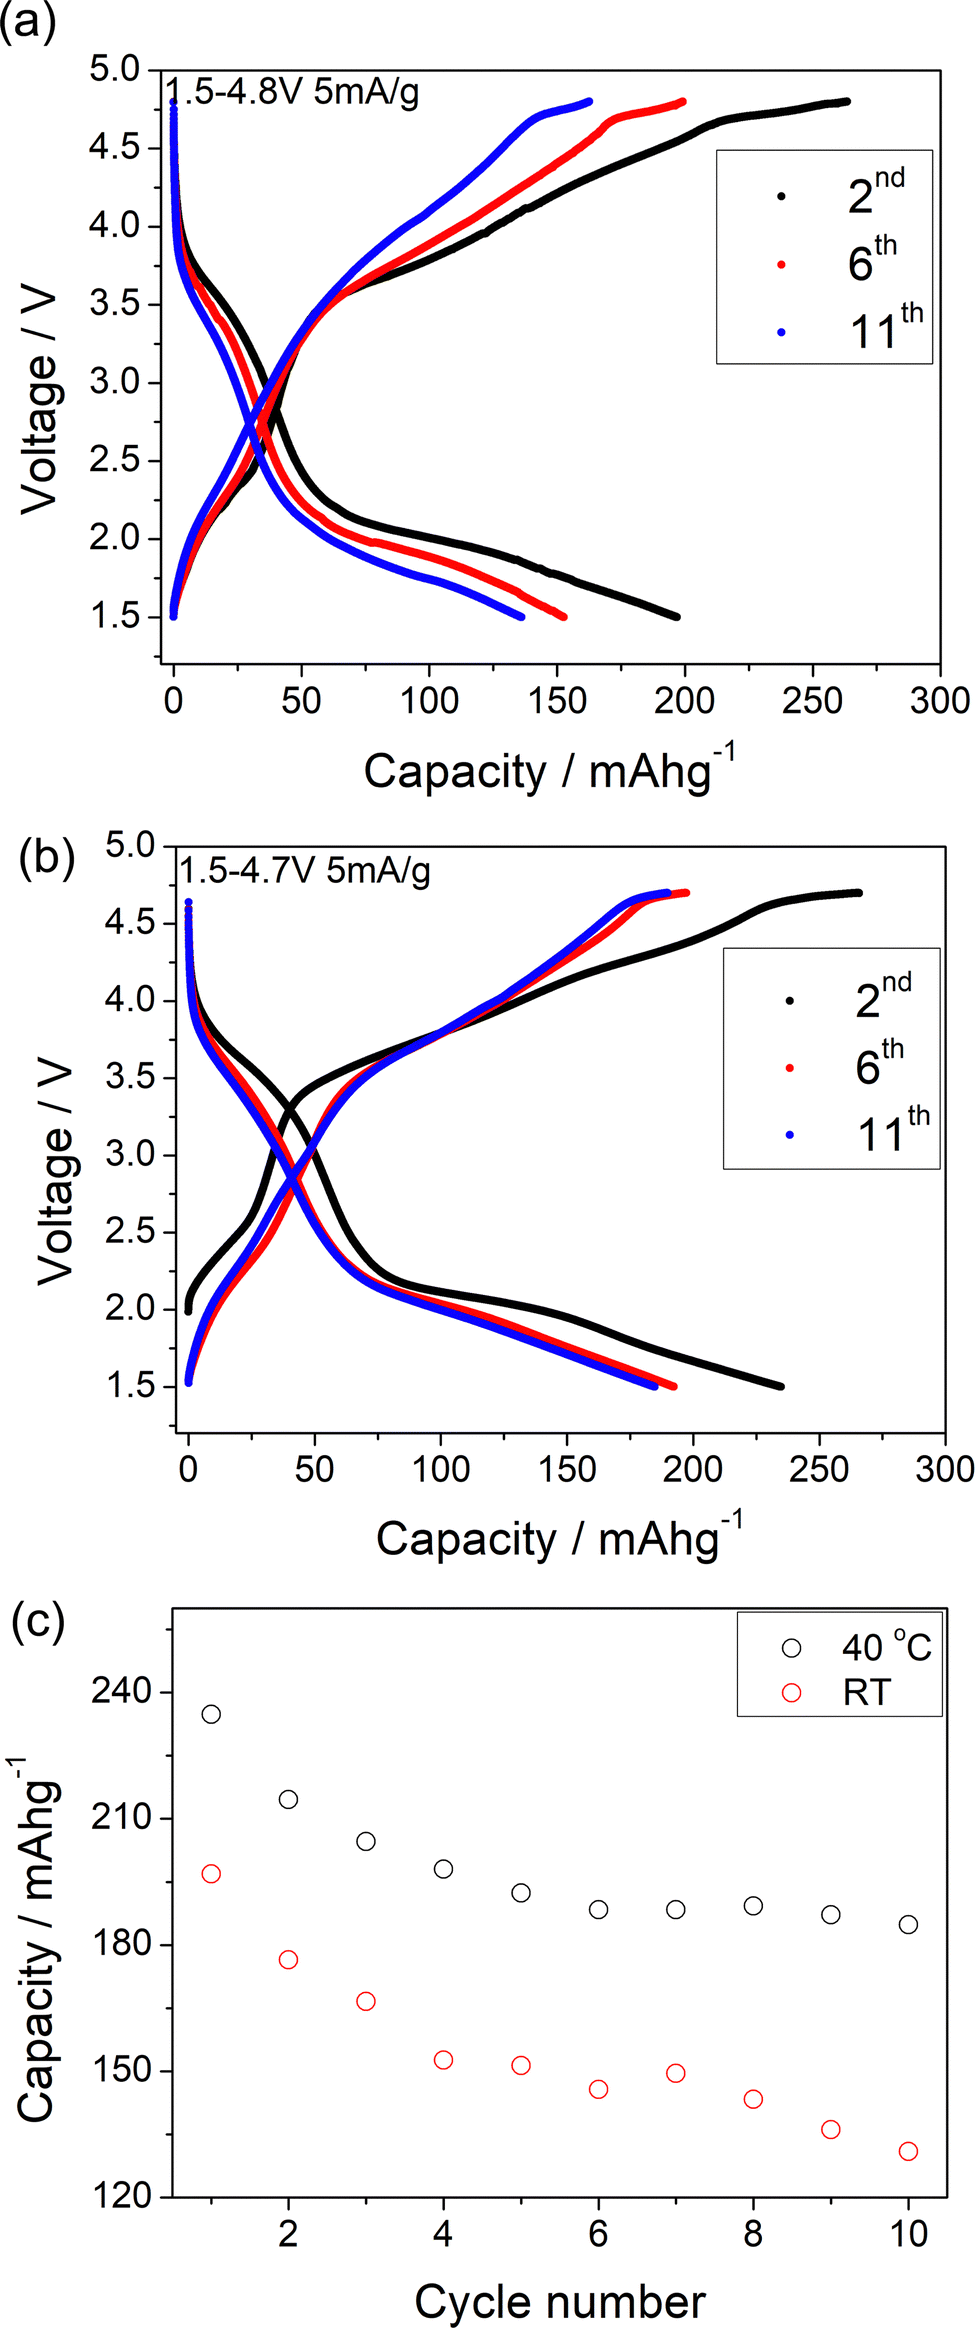 | ||
| Fig. 2 (a) Charge/discharge curves of Li1.2Ni0.4Mo0.2Mg0.2O2 between 1.5 and 4.8 V at 5 mA g−1 at RT. (b) Charge/discharge curves of Li1.2Ni0.4Mo0.2Mg0.2O2 between 1.5 and 4.7 V at 5 mA g−1 (≈C/40) at 40 °C. (c) Discharge capacity retention of Li1.2Ni0.4Mo0.2Mg0.2O2 cycled at room temperature and 40 °C. | ||
A comparison of the charge/discharge curves of Li1.2Ni0.4Ti0.4O2 and Li1.2Ni0.4Mo0.2Mg0.2O2 is shown in Fig. 3(a). Both samples show a high degree of hysteresis between charge/discharge, although this is slightly smaller for Li1.2Ni0.4Mo0.2Mg0.2O2 and this latter sample also delivered increased discharged capacity at low voltage compared to that of Li1.2Ni0.4Ti0.4O2. The charge/discharge retention of Li1.2Ni0.4Ti0.4O2 and Li1.2Ni0.4Mo0.2Mg0.2O2 are shown in Fig. 3(b). The Li1.2Ni0.4Mo0.2Mg0.2O2 displays improved cycling performance with a capacity retention of 83% compared to 77% for Li1.2Ni0.4Ti0.4O2. Additionally, the Li1.2Ni0.4Mo0.2Mg0.2O2 cathode offered a better coulombic efficiency (∼84% and 98% for Li1.2Ni0.4Ti0.4O2 and Li1.2Ni0.4Mo0.2Mg0.2O2), indicating the improvement in the electrochemical performance compared to Li1.2Ni0.4Ti0.4O2.
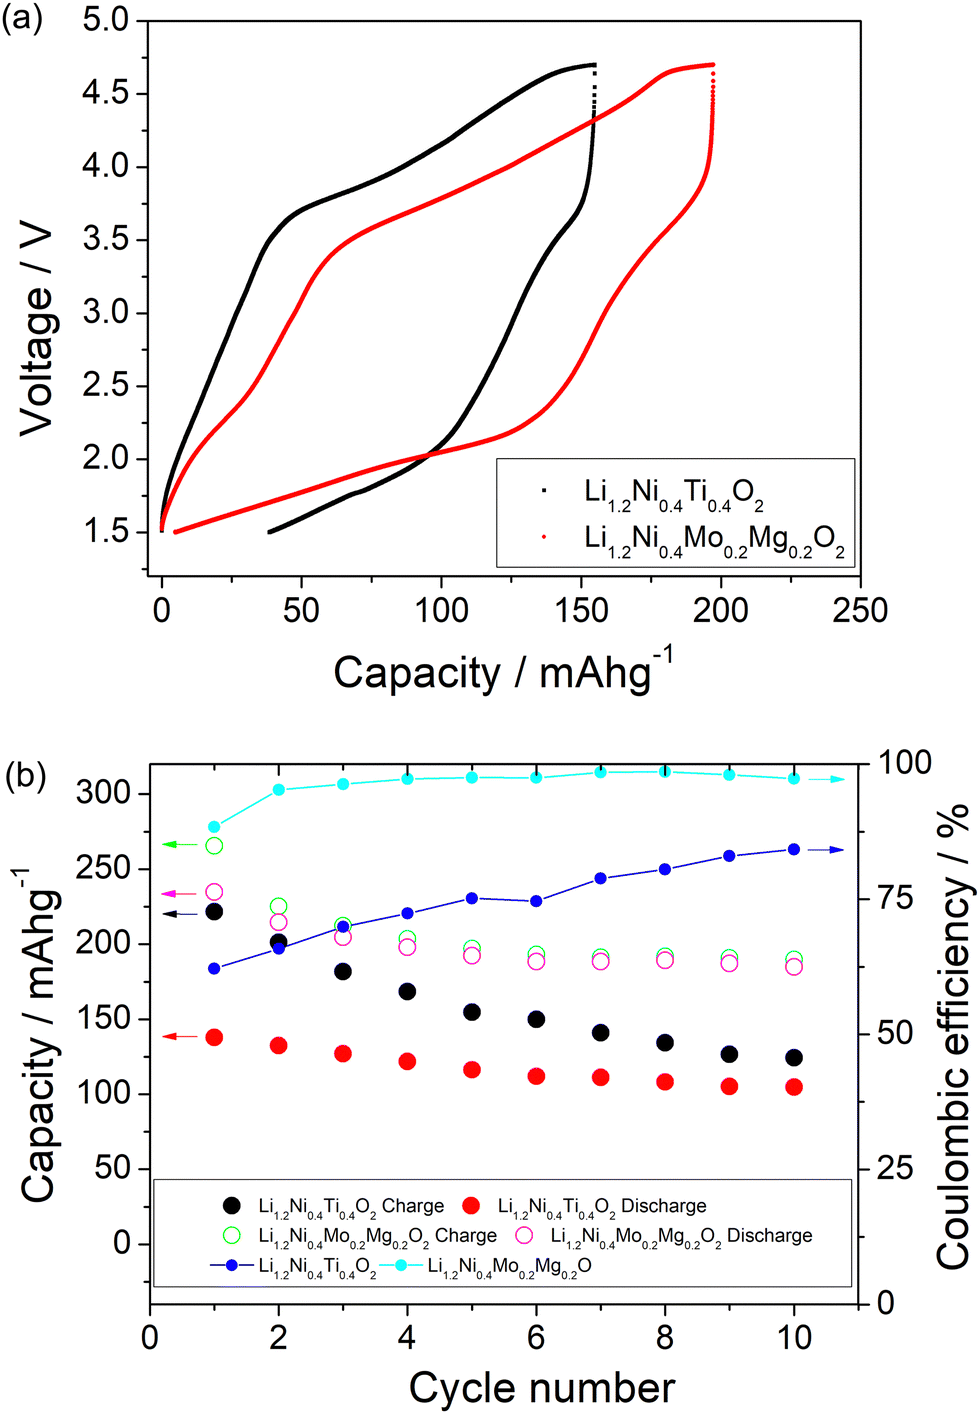 | ||
| Fig. 3 (a) Charge/discharge curves of Li1.2Ni0.4Ti0.4O2 and Li1.2Ni0.4Mo0.2Mg0.2O2 between 1.5 and 4.7 V at 5 mA g−1 at 40 °C, illustrating higher capacity and slightly reduced hysteresis for the latter. (b) Charge/discharge capacity retention and coulombic efficiency of Li1.2Ni0.4Ti0.4O2 and Li1.2Ni0.4Mo0.2Mg0.2O2 cycled at 40 °C. | ||
In Li1.2Ni0.4Mo0.2Mg0.2O2, the Mg is likely not involved in the electrochemical intercalation/deintercalation but shares the sites with both Mo and Li/Ni, and so may hinder the Li migration during the cycling and lead to the poor kinetics. In order to try to improve the performance, a further sample Li1.1Ni0.6Mo0.15Mg0.15O2, with higher Ni content and less Mg content was prepared in an attempt to increase the Ni redox contribution to the capacity. The position of the X-ray diffraction peaks in Li1.2Ni0.4Mo0.2Mg0.2O2 and Li1.1Ni0.6Mo0.15Mg0.15O2 are similar (Fig. 1), indicating these two structures have the same space group. The patterns show some differences in peak intensities, which may relate to the different compositions (increase in Ni, reduction in Li, Mg, Mo content) as well as some difference in the distribution of the cations in the structure. The samples also show different FWHM, which may relate to different particle sizes due to the slight difference in the temperature (925 vs. 950 °C) needed to prepare these two phases. With the increased Ni content and decreased Mg content, the results suggested an improvement in the redox kinetics of Li1.1Ni0.6Mo0.15Mg0.15O2, allowing for a good capacity to be achieved even at RT with a higher current density (10 mA g−1), although there was still significant capacity fade observed (the electrochemical data are shown in the Fig. S3 and S4, ESI†).
Ex situ characterisation
Ex situ X-ray diffraction characterization of Li1.2Ni0.4Mg0.2Mo0.2O2 was carried out at different cut-off voltages (uncharged state, 4.2 V, 4.7 V and 1.5 V) in order to understand the redox mechanism during the cycling of this layered system (Fig. 4). The ordered structure associated with peaks at low angles (∼30 degree) was retained to 4.2 V, although these peaks started to decrease in intensity with increasing cut-off voltage at 4.5 and 4.7 V. These peaks almost fully disappeared for the second cycle and the ordered layered structure was observed to transform into the disordered rocksalt structure. This observation indicates an irreversible phase change associated with the rearrangement of cations, such as Mo migration, and possible oxygen loss in the structure during the cycling. In the case of the latter, any oxygen vacancies created may facilitate cation migration aiding this transformation to the DRS structure. The large hysteresis may therefore be related to this additional slow cation movement, for example octahedral Mo6+ to tetrahedral Mo4+, similar to the reported Cr6+/Cr4+ migration within Li1.2Ni0.1Ti0.5Cr0.2O2.22 The hysteresis was reduced with increased temperature (shown in Fig. 2), which can most likely be related to the faster cation migration at elevated temperature The SEM image of pristine and post materials (after 2 cycles) showed a change in morphology, as shown in Fig. 5. The electrode before cycling shows a flat top surface (Fig. 5(a) and (c)) and electrode after cycling shows a rougher surface with raised particle clusters. The raised particle clusters are very likely formed by volume change during repeating lithiation and delithiation, which is common for Li-rich layered oxide electrodes, as shown in previously for Li1.2Ni0.13Mn0.54Co0.13O2.32 The raised particle clusters may lead to partial delamination and capacity decay.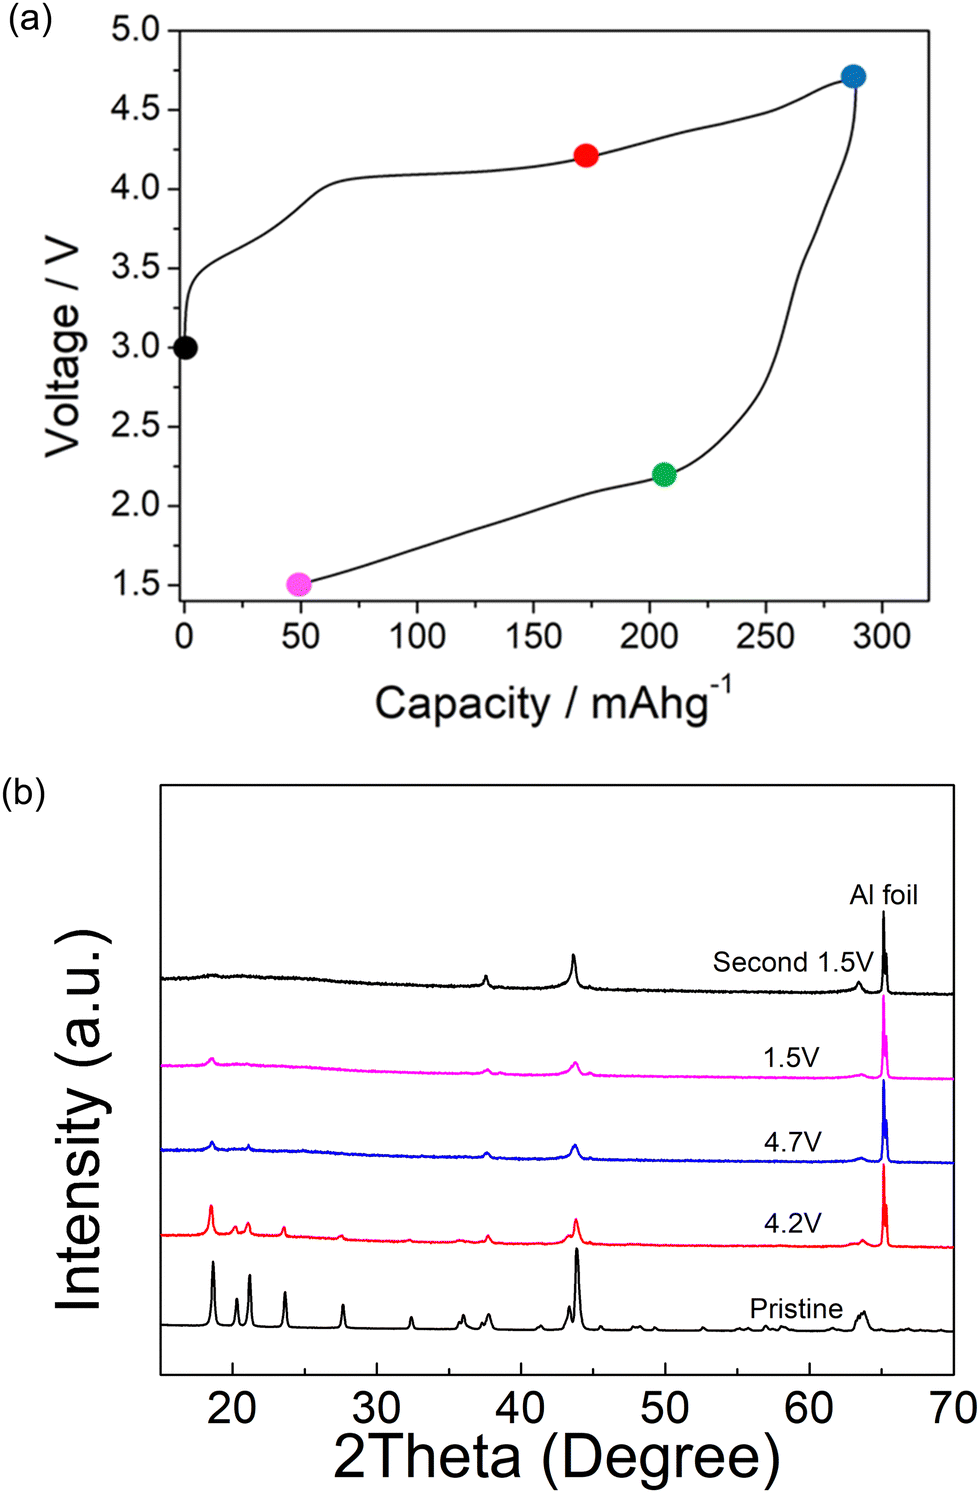 | ||
| Fig. 4 (a) schematic cut off points for ex situ characterization of Li1.2Ni0.4Mo0.2Mg0.2O2 during the cycling of the cell. (b) Ex situ XRD of Li1.2Ni0.4Mo0.2Mg0.2O2 at these different cut-off voltages. | ||
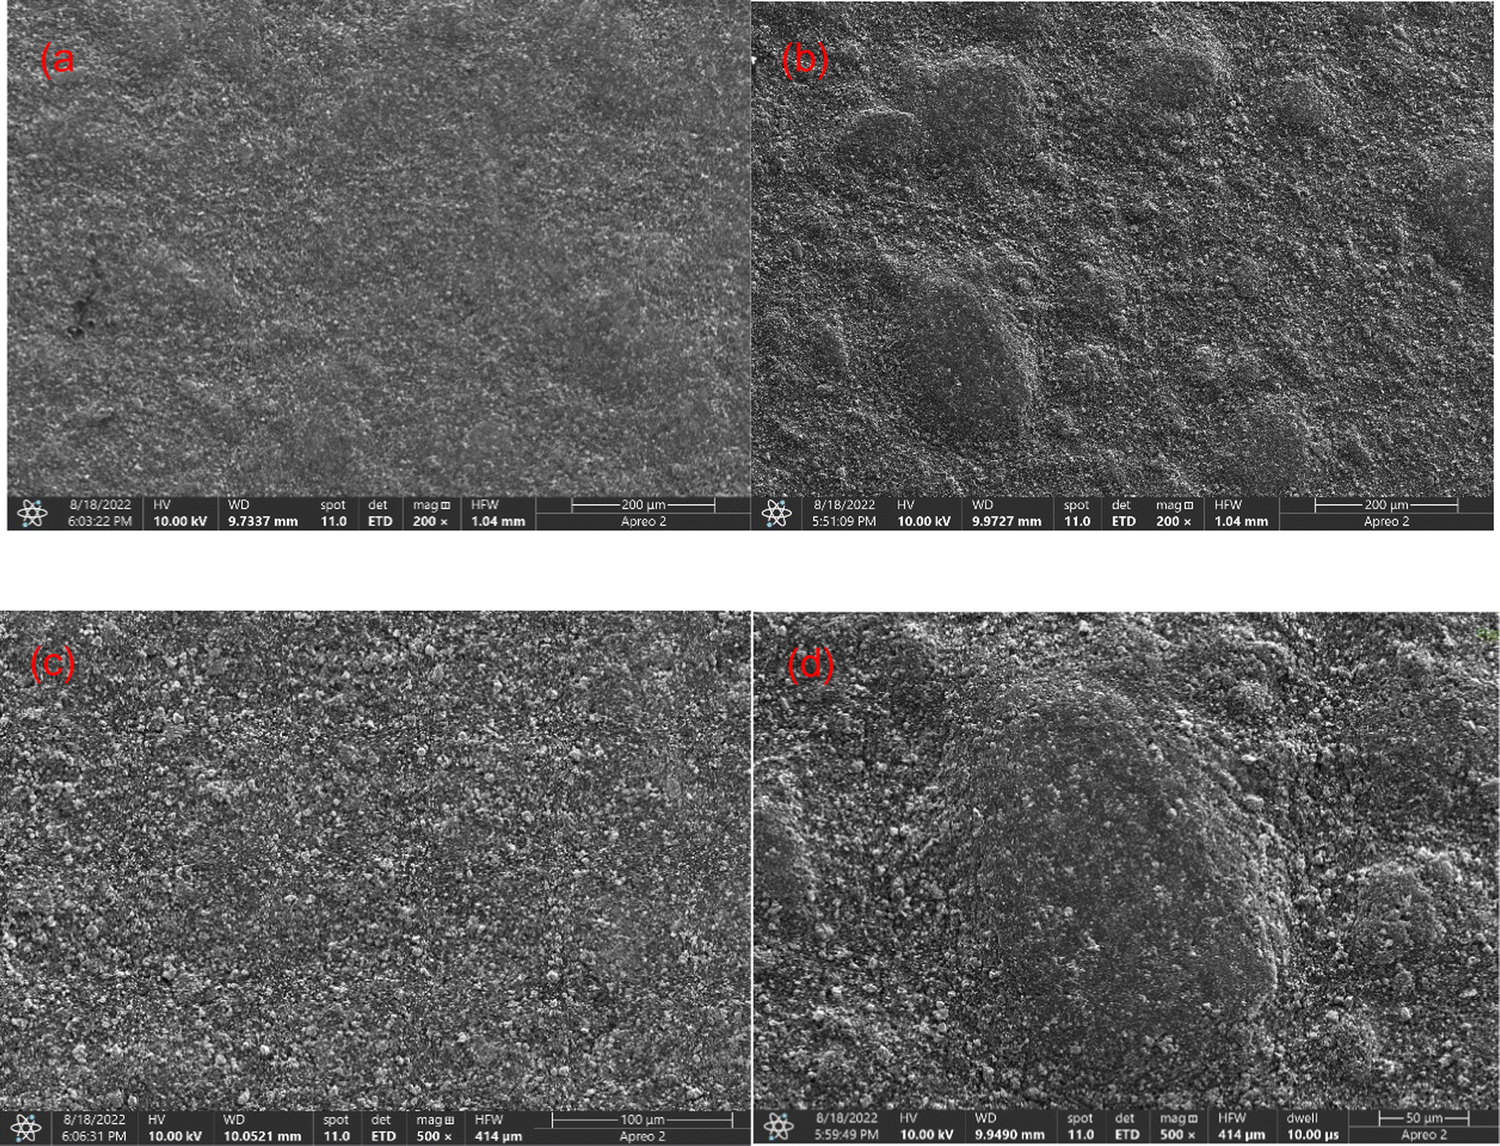 | ||
| Fig. 5 (a) and (c) SEM of pristine Li1.2Ni0.4Mo0.2Mg0.2O2 at 200 and 500× magnification (b) and (d) SEM of cycled Li1.2Ni0.4Mo0.2Mg0.2O2 at 200 and 500× magnification. | ||
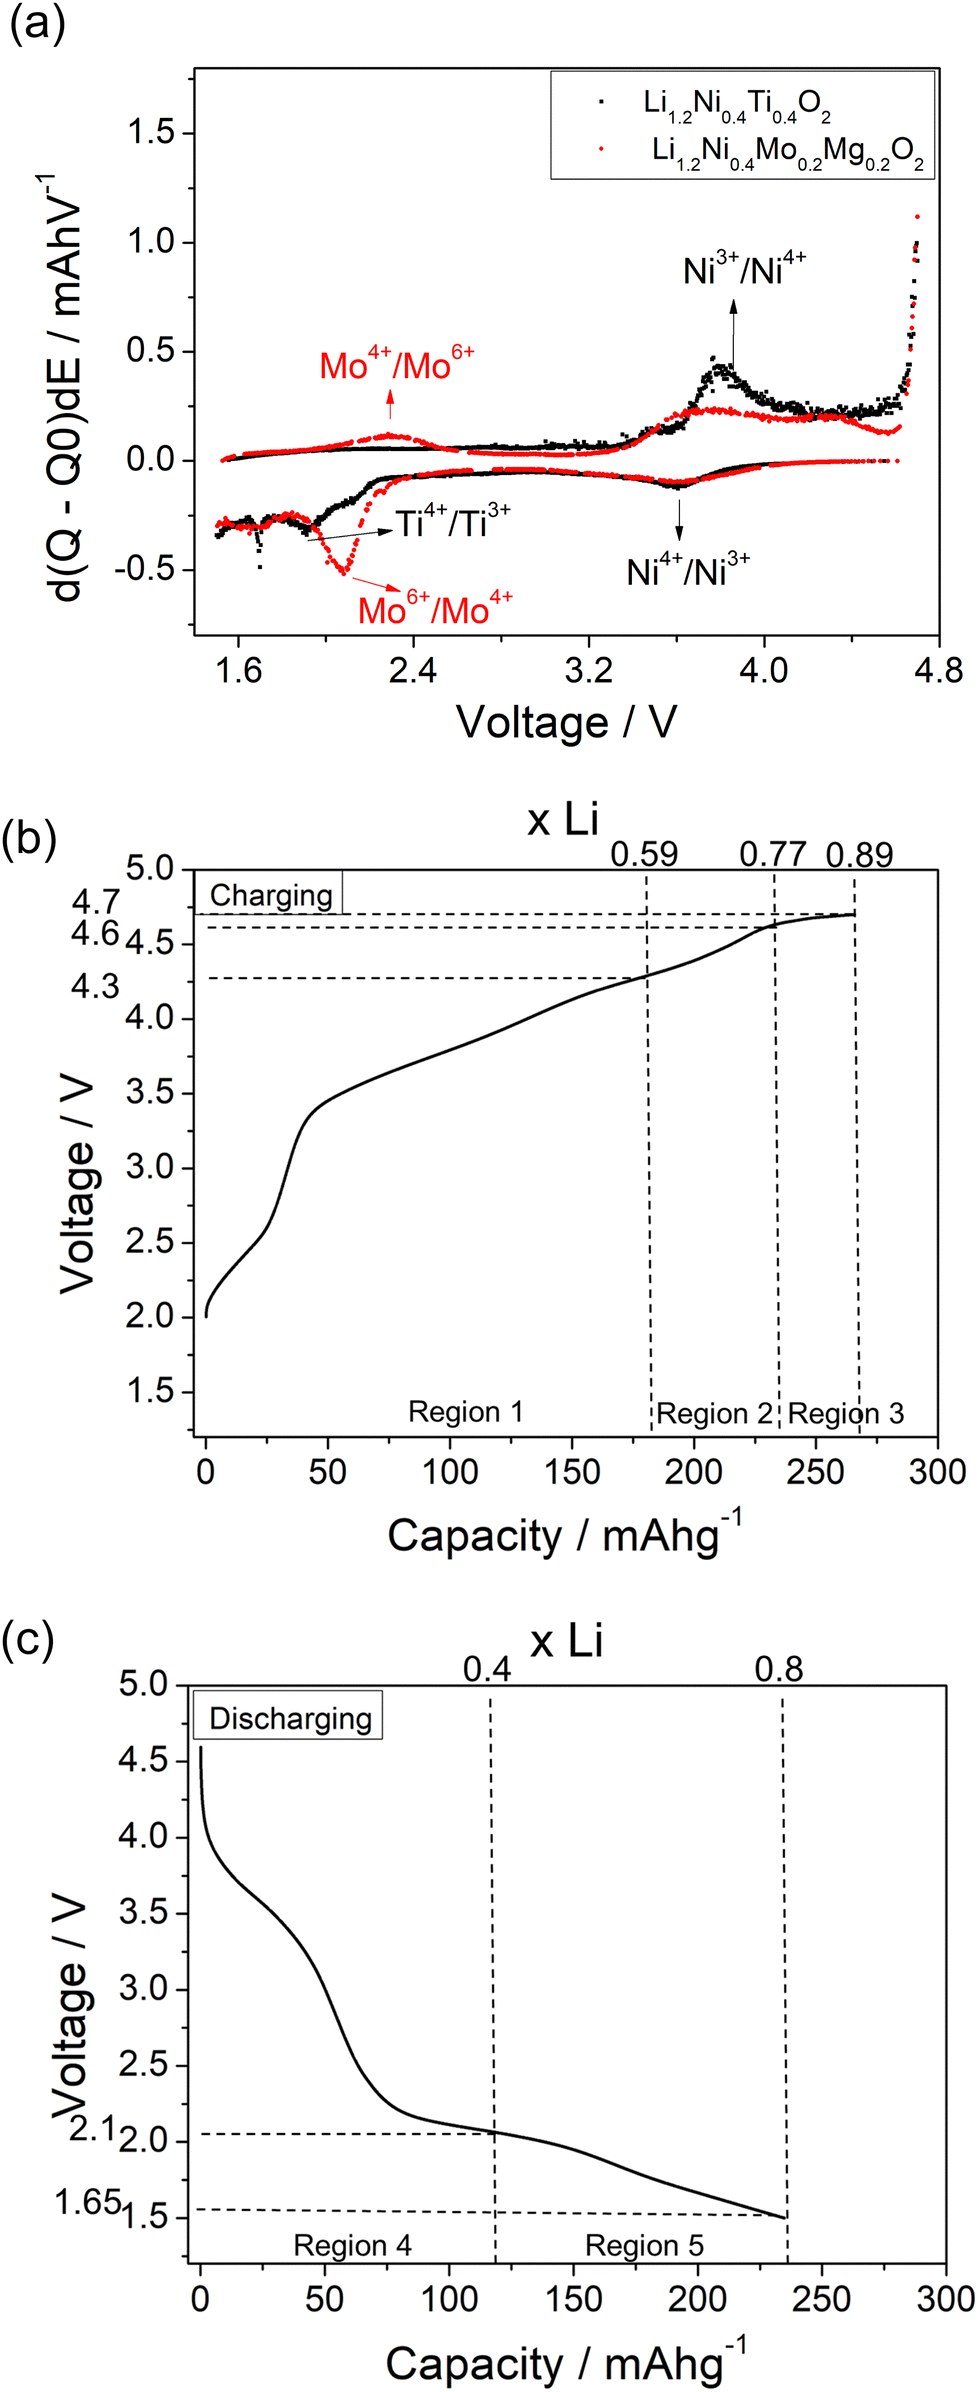
The dQ/dV vs. voltage plots of Li1.2Ni0.4Ti0.4O2 and Li1.2Ni0.4Mo0.2Mg0.2O2 are shown in Fig. 6(a). The main oxidation peak at ∼3.85 V associated with Ni3+/Ni4+ redox was observed for both samples and the corresponding Ni4+/Ni3+ reduction peak was seen at ∼3.6 V. When charging above 4 V, an additional small oxidation peak was seen at ∼4.3 V, which may be attributed to the bulk oxygen redox or O2 release from the surface of particles. In terms of the redox peaks at low voltage, a reduction peak attributed to Mo6+/Mo4+ at ∼2.1 V and the corresponding oxidation peak of Mo4+/Mo6+ at ∼2.3 V were seen for Li1.2Ni0.4Mo0.2Mg0.2O2, which is consistent with the XAS results (see below). In comparison, two very small reduction peaks at ∼1.9 and 1.7 V were observed for the Li1.2Ni0.4Ti0.4O2 which may be related to the reduction of Ti4+ and Ni3+. The lower voltage feature was not reversible, with no oxidation peak of Ti3+ below 3 V observed upon recharging.
 | ||
| Fig. 6 (a) dQ/dV curve of Li1.2Ni0.4Ti0.4O2 and Li1.2Ni0.4Mo0.2Mg0.2O2 at the fifth cycle. (b) Charge curve of Li1.2Ni0.4Mo0.2Mg0.2O2 between 1.5 and 4.7 V at 5 mAg−1 at 40 °C. (c) Discharge curve of Li1.2Ni0.4Mo0.2Mg0.2O2 between 1.5 and 4.7 V at 5 mAg−1 at 40 °C. | ||
In order to identify the redox mechanism during the cycling, Ni K-edge and Mo K-edge XAS were collected at different cut-off voltages. As shown in Fig. 6(b), during the 2nd charge of the cell, ∼180 mA h g−1 capacity was obtained at 4.3 cut-off voltage (region 1), which is attributed to both Mo4+/Mo6+ and Ni3+/Ni4+ redox (180 mA h g−1 accounts for ∼0.6 Li) as indicated in the dQ/dV plot (Fig. 6a). Ni K-edge XAS data (Fig. 7) also supported this result with the peak at 8353 eV slightly shifting to high energy, illustrating the oxidation of Ni3+. The additional 55 mA h g−1 capacity between 4.3 V and 4.6 V (region 2) associated with the broad peak at 4.35 V in the dQ/dV plot was attributed to either bulk oxygen redox, or O2 loss from the surface of particles. The change of slope in the voltage profile as well as a sharp peak in the dQ/dV plot above 4.6 V (region 3) was observed, which is a good indication of electrolyte decomposition. The electrolyte decomposition during the electrochemical reaction will usually generate unwanted gas, increase the internal cell pressure, and the decomposition products of the electrolyte can further react with the SEI layer or cathode material, thus generally leading to the degradation of the electrochemical performance.
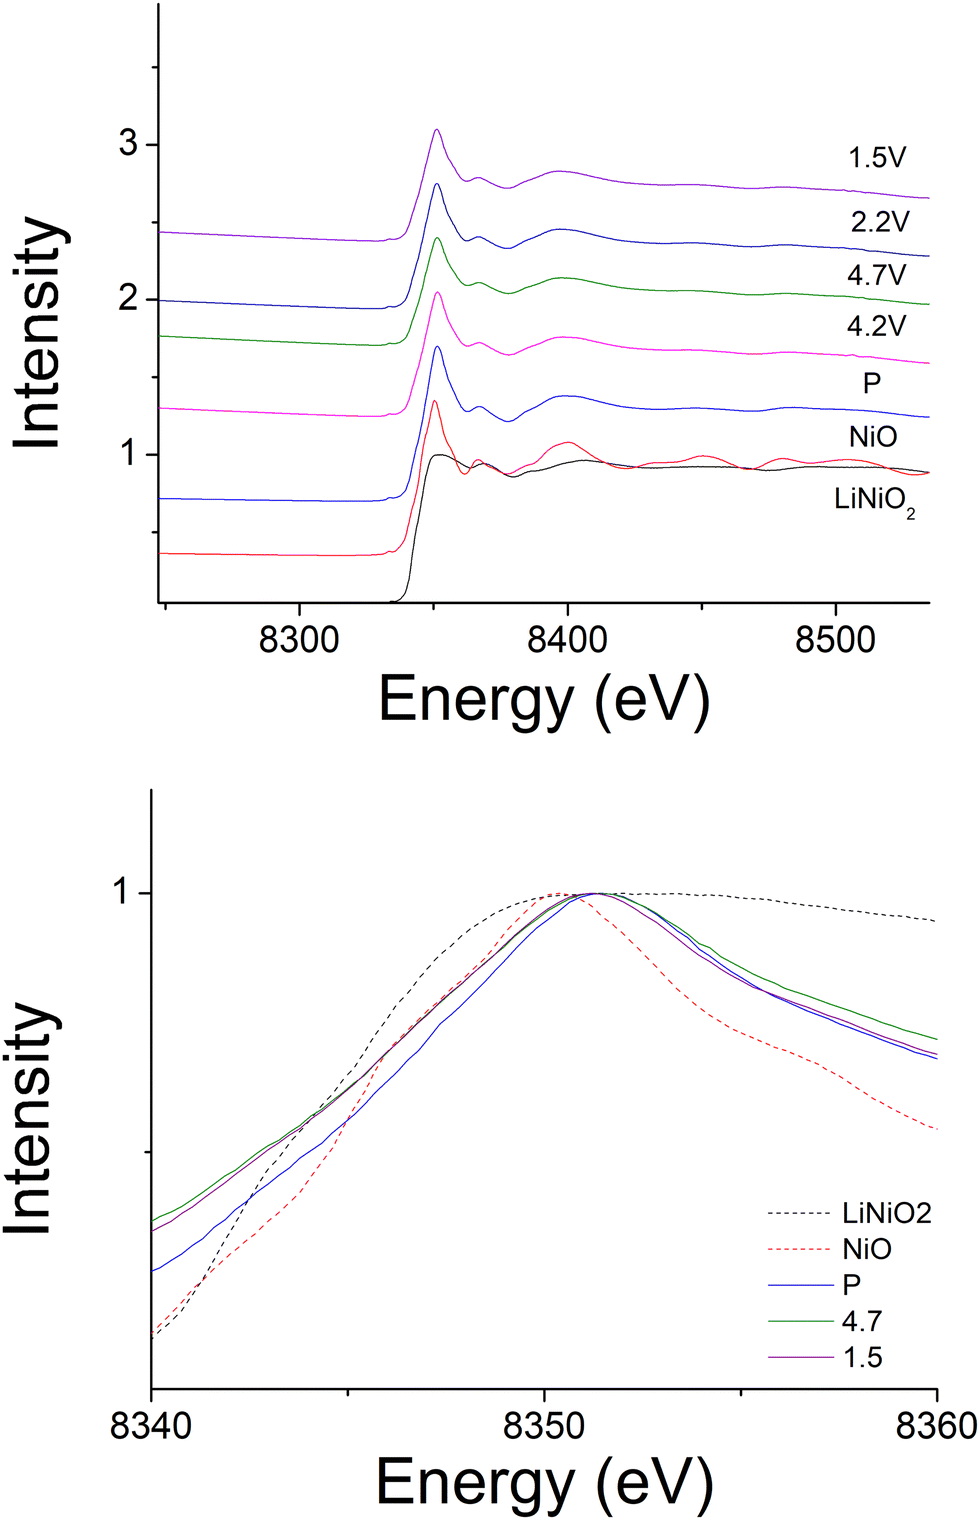 | ||
| Fig. 7 Ex situ Ni-edge XAS of Li1.2Ni0.4Mo0.2Mg0.2O2 at different cut-off voltages. | ||
240 mA h g−1 capacity was then gained on discharging in the 2nd cycle, which can be divided into two regions at 2.1 V (Fig. 6(c)). In the region 4, the voltage dropped sharply to 3.9 V without any redox peaks observed in the dQ/dV plot. The only redox peak observed over this region was the Ni4+/Ni3+ reduction peak at ∼3.6 V, which indicates the ∼120 mA h g−1 capacity was attributed to Ni redox. In the region 5, the main reduction peak (Mo6+/Mo4+) at 2.1 V and a tiny peak at 1.65 V which may be due to partially reduction Mo4+ or Ni3+ were observed. This suggests that the low voltage capacity is mainly from Mo6+/Mo4+ redox (100 mA h g−1). This is also supported by the Mo k-edge XAS (Fig. 8) where initially there was no change in the spectra on charge to 4.7 V in the 1st cycle, indicating only Mo6+. However, on discharging, the peak intensities at 19930 and 19995 eV (representative for Mo4+) increased slightly compared to the pristine material, supporting the presence of Mo6+/Mo4+ redox in subsequent cycle. The reduction of Mo6+ could then trigger the possible migration of Mo to tetrahedral sites, which may then move back to extracted Li+ sites on delithiation and thus also facilitate the transition from a layered phase to disordered rocksalt phase on cycling, and the corresponding hysteresis in the voltage profile observed. Compared to olivine LiFePO4 (165 mA h g−1), spinel LiMn2O4 (120 mA h g−1) and layered LiNi0.33Mn0.33Co0.33O2 materials (170 mA h g−1),33 this new material showed improved capacity (∼237 mA h g−1 at first cycle and 195 mA h g−1 after 10 cycles). However, the material suffers from slow kinetics, large hysteresis and capacity fade, and so further work is needed to overcome these issues, for example the investigation of additional substitution strategies, such as F doping.
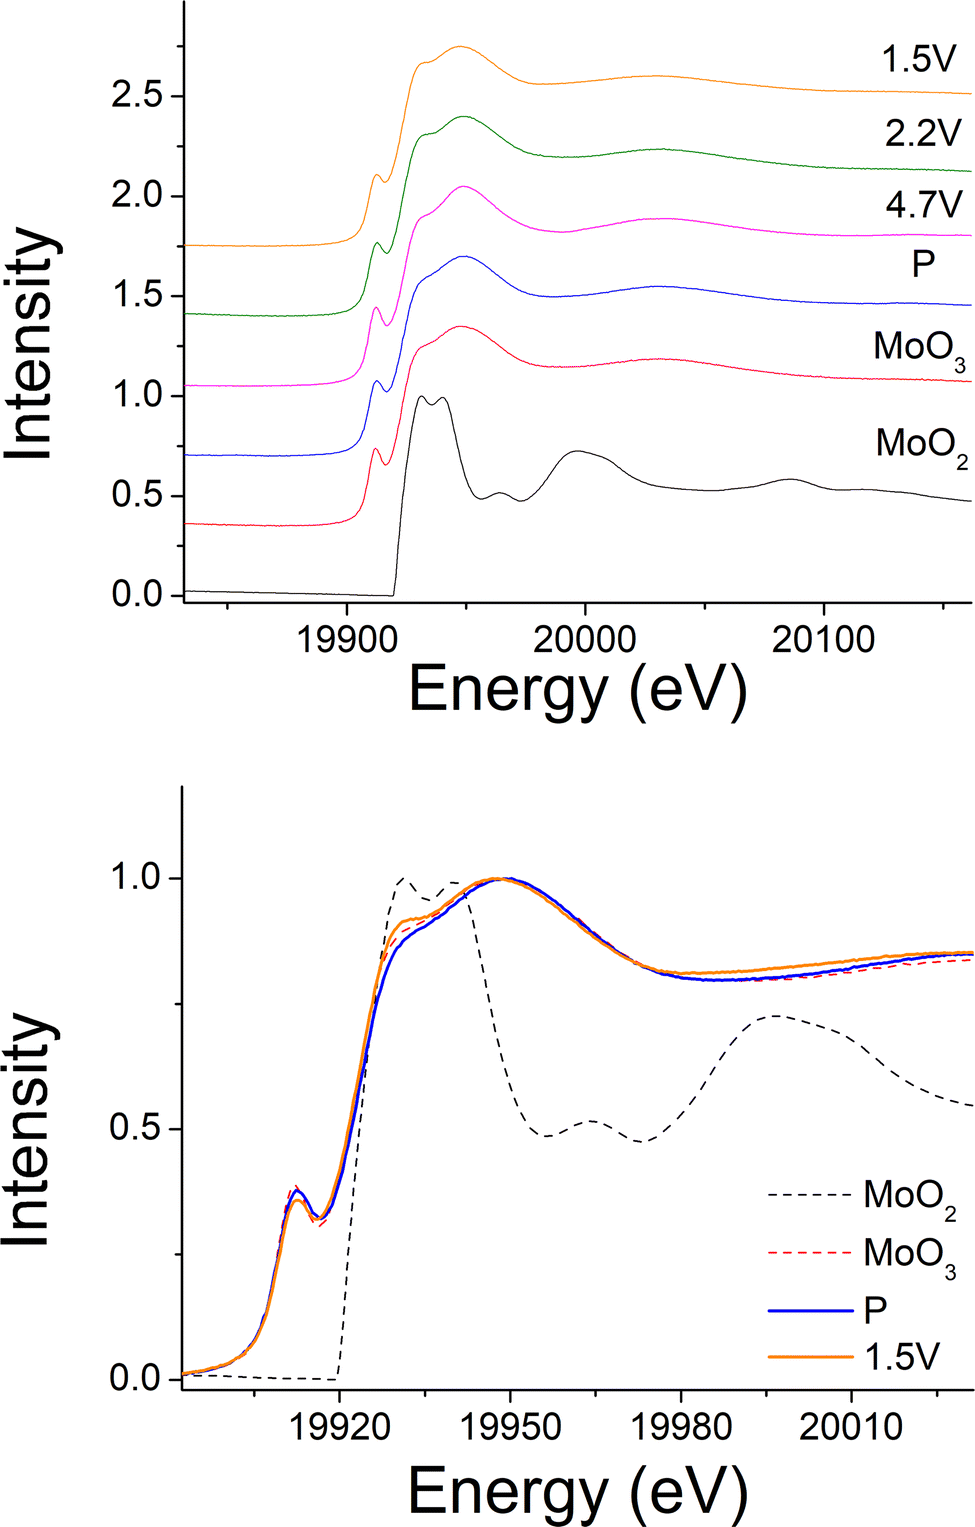 | ||
| Fig. 8 Ex situ Mo-edge XAS of Li1.2Ni0.4Mo0.2Mg0.2O2 at different cut-off voltages. | ||
Conclusions
In conclusion, through a dual cation substitution strategy replacing Ti with Mo and Mg, new cation ordered layered oxides with composition Li1.2Ni0.4Mo0.2Mg0.2O2 and Li1.1Ni0.6Mo0.15Mg0.15O2 were successfully prepared. Li1.2Ni0.4Mo0.2Mg0.2O2 delivered up to 195 mA h g−1 discharge capacity after 10 cycles, which was higher than observed for the corresponding Li1.2Ni0.4Ti0.4O2. Ex situ XRD indicated an irreversible phase change to a disordered rocksalt phase on cycling. Ex situ XAS and dQ/dV studies showed Ni3+/Ni4+ and Mo4+/Mo6+ redox as well as possible oxygen redox or O2 release happening on delithiation, while Ni4+/Ni3+ and Mo6+/Mo4+ redox occurred on lithiation. Structure refinement suggested that high valence dopant Mo6+ directs the cation ordering in as-prepared Li1.2Ni0.4Mo0.2Mg0.2O2, and the irreversible phase change to disordered rock salt on cycling is attributed to slow cation movement (e.g. Mo) to new sites. Overall, this work shows both the possibilities and challenges in designing new cathode materials in that the substitution strategy successfully led to a new modified cation ordered layered structure, which then reverted back to disordered rock salt on cycling.Conflicts of interest
The authors declare no conflict of interest.Acknowledgements
We would like to thank Faraday Institution CATMAT (FIRG016) and NEXTRODE (FIRG015) projects for funding. We would like to thank XAS data collection by Dr Giannantonio Cibin with Energy BAG scheme in Diamond. Raw experimental data can be found at https://doi.org/10.25500/edata.bham.00000892.References
- J.-M. Tarascon and M. Armand, Nature, 2001, 414, 359–367 CrossRef CAS PubMed.
- J. B. Goodenough and K. S. Park, J. Am. Chem. Soc., 2013, 135, 1167–1176 CrossRef CAS PubMed.
- A. D. Robertson and P. G. Bruce, Chem. Mater., 2003, 15, 1984–1992 CrossRef CAS.
- A. D. Robertson and P. G. Bruce, Chem. Commun., 2002, 2790–2791, 10.1039/b207945c.
- H. Huang, S. C. Yin and L. F. Nazar, Electrochem. Solid-State Lett., 2001, 4, A170–A172 CrossRef CAS.
- M. M. Thackeray, W. I. F. David, P. G. Bruce and J. B. Goodenough, Mater. Res. Bull., 1983, 18, 461–472 CrossRef CAS.
- K. Luo, M. R. Roberts, R. Hao, N. Guerrini, D. M. Pickup, Y. S. Liu, K. Edstrom, J. Guo, A. V. Chadwick, L. C. Duda and P. G. Bruce, Nat. Chem., 2016, 8, 684–691 CrossRef CAS PubMed.
- R. A. House, G. J. Rees, M. A. Pérez-Osorio, J.-J. Marie, E. Boivin, A. W. Robertson, A. Nag, M. Garcia-Fernandez, K.-J. Zhou and P. G. Bruce, Nat. Energy, 2020, 5, 777–785 CrossRef CAS.
- T. Matsuhara, Y. Tsuchiya, K. Yamanaka, K. Mitsuhara, T. Ohta and N. Yabuuchi, Electrochem., 2016, 84, 797–801 CrossRef CAS.
- E. McCalla, M. T. Sougrati, G. Rousse, E. J. Berg, A. Abakumov, N. Recham, K. Ramesha, M. Sathiya, R. Dominko, G. Van Tendeloo, P. Novak and J. M. Tarascon, J. Am. Chem. Soc., 2015, 137, 4804–4814 CrossRef CAS.
- B. Li and D. Xia, Adv. Mater., 2017, 29, 1701054 CrossRef.
- G. Assat and J.-M. Tarascon, Nat. Energy, 2018, 3, 373–386 CrossRef CAS.
- M. Han, J. Jiao, Z. Liu, X. Shen, Q. Zhang, H. J. Lin, C. T. Chen, Q. Kong, W. K. Pang, Z. Guo, R. Yu, L. Gu, Z. Hu, Z. Wang and L. Chen, Adv. Energy Mater., 2020, 10, 1903634 CrossRef CAS.
- D. Eum, B. Kim, S. J. Kim, H. Park, J. Wu, S. P. Cho, G. Yoon, M. H. Lee, S. K. Jung, W. Yang, W. M. Seong, K. Ku, O. Tamwattana, S. K. Park, I. Hwang and K. Kang, Nat. Mater., 2020, 19, 419–427 CrossRef CAS PubMed.
- Q. Jacquet, A. Iadecola, M. Saubanere, H. Li, E. J. Berg, G. Rousse, J. Cabana, M. L. Doublet and J. M. Tarascon, J. Am. Chem. Soc., 2019, 141, 11452–11464 CrossRef CAS PubMed.
- R. A. House, U. Maitra, L. Jin, J. G. Lozano, J. W. Somerville, N. H. Rees, A. J. Naylor, L. C. Duda, F. Massel, A. V. Chadwick, S. Ramos, D. M. Pickup, D. E. McNally, X. Lu, T. Schmitt, M. R. Roberts and P. G. Bruce, Chem. Mater., 2019, 31, 3293–3300 CrossRef CAS.
- R. A. House, U. Maitra, M. A. Perez-Osorio, J. G. Lozano, L. Jin, J. W. Somerville, L. C. Duda, A. Nag, A. Walters, K. J. Zhou, M. R. Roberts and P. G. Bruce, Nature, 2020, 577, 502–508 CrossRef CAS PubMed.
- R. A. House, J.-J. Marie, M. A. Pérez-Osorio, G. J. Rees, E. Boivin and P. G. Bruce, Nat. Energy, 2021, 6, 781–789 CrossRef CAS.
- Z. Lun, B. Ouyang, D. H. Kwon, Y. Ha, E. E. Foley, T. Y. Huang, Z. Cai, H. Kim, M. Balasubramanian, Y. Sun, J. Huang, Y. Tian, H. Kim, B. D. McCloskey, W. Yang, R. J. Clement, H. Ji and G. Ceder, Nat. Mater., 2021, 20, 214–221 CrossRef CAS.
- R. J. Clément, Z. Lun and G. Ceder, Energy Environ. Sci., 2020, 13, 345–373 RSC.
- K. Zhou, S. Zheng, H. Liu, C. Zhang, H. Gao, M. Luo, N. Xu, Y. Xiang, X. Liu, G. Zhong and Y. Yang, ACS. Appl. Mater. Interfaces, 2019, 11, 45674–45682 CrossRef CAS PubMed.
- J. Huang, P. Zhong, Y. Ha, D.-H. Kwon, M. J. Crafton, Y. Tian, M. Balasubramanian, B. D. McCloskey, W. Yang and G. Ceder, Nat. Energy, 2021, 6, 706–714 CrossRef CAS.
- H. Ji, A. Urban, D. A. Kitchaev, D. H. Kwon, N. Artrith, C. Ophus, W. Huang, Z. Cai, T. Shi, J. C. Kim, H. Kim and G. Ceder, Nat. Commun., 2019, 10, 592 CrossRef CAS PubMed.
- L. Zhang, H. Noguchi, D. Li, T. Muta, X. Wang, M. Yoshio and I. Taniguchi, J. Power Sources, 2008, 185, 534–541 CrossRef CAS.
- Y. Liu, S. Zheng, H. Wan, A. Dou, D. Chu and M. Su, J. Alloys Compd., 2017, 728, 659–668 CrossRef CAS.
- Z. Yu, X. Qu, A. Dou, M. Su, Y. Liu and F. Wu, ACS Appl. Mater. Interfaces, 2019, 11, 35777–35787 CrossRef CAS.
- J. Lee, D.-H. Seo, M. Balasubramanian, N. Twu, X. Li and G. Ceder, Energy Environ. Sci., 2015, 8, 3255–3265 RSC.
- Z. N. Taylor, A. J. Perez, J. A. Coca-Clemente, F. Braga, N. E. Drewett, M. J. Pitcher, W. J. Thomas, M. S. Dyer, C. Collins, M. Zanella, T. Johnson, S. Day, C. Tang, V. R. Dhanak, J. B. Claridge, L. J. Hardwick and M. J. Rosseinsky, J. Am. Chem. Soc., 2019, 141, 7333–7346 CrossRef CAS PubMed.
- N. Yabuuchi, Y. Tahara, S. Komaba, S. Kitada and Y. Kajiya, Chem. Mater., 2016, 28, 416–419 CrossRef CAS.
- M. Sathiya, K. Ramesha, G. Rousse, D. Foix, D. Gonbeau, K. Guruprakash, A. S. Prakash, M. L. Doublet and J. M. Tarascon, Chem. Commun., 2013, 49, 11376–11378 RSC.
- B. H. Toby, J. Appl. Crystallogr., 2001, 34, 210–213 CrossRef CAS.
- T. C. Liu, J. J. Liu, L. X. Li, L. Yu, J. C. Diao, T. Zhou, S. N. Li, A. Dai, W. G. Zhao, S. Y. Xu, Y. Ren, L. G. Wang, T. P. Wu, R. Qi, Y. G. Xiao, J. X. Zheng, W. Cha, R. Harder, I. Robinson, J. G. Wen, J. Lu, F. Pan and K. Amine, Nature, 2022, 606, 305–312 CrossRef CAS PubMed.
- N. Nitta, F. X. Wu, J. T. Lee and G. Yushin, Mater. Today, 2015, 18, 252–264 CrossRef CAS.
Footnote |
| † Electronic supplementary information (ESI) available. See DOI: https://doi.org/10.1039/d2ma00981a |
| This journal is © The Royal Society of Chemistry 2023 |