
 Open Access Article
 This Open Access Article is licensed under a Creative Commons Attribution-Non Commercial 3.0 Unported Licence
Evidence of thermal ionization induced luminescence quenching in CePO4 and GdPO4†
Suchinder K.
Sharma

Amity School of Physical Sciences, Amity University Punjab, IT City, Sector 82A, Mohali, 140308, India. E-mail: suchindersharma@gmail.com
First published on 8th November 2022
Abstract
The optical properties and their temperature dependence of two rare earth orthophosphates, CePO4 and GdPO4, are presented. CePO4 shows prominent luminescence emission at wavelengths of 392 and 425 nm, typical of interconfigurational 5d → 4f transitions. For GdPO4, the prominent emission is observed at a wavelength of 313 nm, due to intraconfigurational 4f → 4f transitions. Upon increasing the measurement temperature, the activation energy required to quench the luminescence emission is found to be 0.25 and 0.58 eV for CePO4 and GdPO4 samples, respectively. GdPO4 showed better thermal stability of the luminescence when compared to the CePO4 sample. Vacuum referred binding energy (VRBE) diagrams were prepared to determine the thermal quenching mechanisms in the two cases. It is observed that the quenching mechanism in both cases is dominated by thermal ionization of charges to the conduction band (CePO4) and the valence band (GdPO4). Thermoluminescence studies were performed to correlate the location of traps in the two samples and the corresponding thermal quenching mechanisms.
1 Introduction
The rare earth orthophosphates (REPO4, RE = La to Lu) require lower annealing temperature when compared to other refractory oxides and are excellent optical materials possessing high brightness along with stable physical and chemical properties.1 They also possess excellent thermal stability up to a temperature of 865 K, perfectly suitable for temperature sensing.2 Among the two known structure-types of REPO4, light-REs exhibit a monazite-type crystal structure (space group P21/n), while heavy-REs have a xenotime-type crystal structure (space group P41/amd). The rare earth ion Tb is an exception which can possess both crystal structure-types, monazite or xenotime. In our recent work on rare earth orthophosphates, we explored the temperature dependence of the optical properties of EuPO4 upon excitation with different wavelengths and established a new strategy to sense temperature.2 The temperature dependence of the photoluminescence (PL) spectra of SmPO4 was also studied extensively to infer a non-quenching luminescence behaviour even up to very high temperatures.3 The optical properties of single crystal samples of some other orthophosphates, TbPO4, DyPO4 and PrPO4, exhibiting prominent emission in the green (545 nm), yellow (574 nm) and red (616 nm) regions of the electromagnetic spectrum, were also studied and compared for their possible use in solid-state lighting devices.4 In these studies, theoretical studies based on the chemical shift model [vacuum referred binding energy (VRBE) diagrams] were performed and combined with optical and thermally stimulated luminescence studies to understand the charge trapping–detrapping dynamics.Within the same family of rare earth orthophosphates, two important members are cerium (Ce) and gadolinium (Gd) based CePO4 and GdPO4 orthophosphate samples. The Ce ion has 1 electron in the outermost shell which exhibits d → f type characteristic luminescence emission, with the possibility to tune the emission from the UV to the red region, based upon the host crystal-field strength. On the other hand, Gd ions are known to produce deep-UV luminescence emission with the capability of exhibiting magnetic behaviour which can be used for magnetic resonance imaging (MRI) applications.5 The presence of Gd is found to enhance the quality of MRI by altering the magnetic properties of water molecules within the body of the animal. By looking at the technological importance of Ce and Gd doped materials, and to extend our understanding of REPO4 hosts, the aim of the present work is to investigate single crystal samples of CePO4 and GdPO4, the optical properties, and their temperature dependence in a wide temperature range of 293–873 K. The development of new, thermally stable inorganic materials requires a thorough understanding of the mechanisms responsible for thermal quenching in these materials. Cerium-containing materials exhibiting quenching of the 5d → 4f emission transitions is a result of one or a combination of the following three mechanisms: (a) non-radiative 5d → 4f crossover relaxation via electron–phonon coupling, (b) thermal ionization of the 5d electron of cerium into the conduction band of the host lattice, followed by charge trapping at defects, and (c) thermally activated concentration quenching.6 The mechanism in CePO4 has not been explored so far and the mechanism in Gd doped materials is unclear and hence for both cases, detailed investigations are required. Based on these issues, another important objective of the present work is to understand the thermal quenching mechanisms in the two samples upon excitation into their absorption bands in the UV-region. It is observed that as soon as the sample temperature is increased above 450 K (for CePO4) and above 500 K (for GdPO4), the thermal quenching due to thermal ionization of charges is evident. The experimental observations were found to be in good agreement with the theoretical predictions performed for the two samples using VRBE diagrams suggesting that there is charge trapping and detrapping at the defects close to the conduction band and valence band for CePO4 and GdPO4 samples, respectively.
2 Experimental
2.1 Single crystal growth
The single crystal samples of CePO4 and GdPO4 were prepared by the flux technique in accordance with the synthesis procedure discussed in ref. 7 at the Oak Ridge National Laboratory, USA.8 The samples are part of the Smithsonian standard samples generally used for electron microprobe analysis (EMPA). In a typical procedure, cerium and gadolinium oxide precursors are placed in a tightly covered platinum crucible containing PbHPO4, to form the flux matrix at high temperature and fired at 1633 K for 16 h. The crucibles were cooled to 1173 K and later quenched to room temperature (300 K). The crystals were then dissolved in HNO3 to extract single crystal samples of CePO4 and GdPO4.2.2 Characterization
The high resolution colored two-dimensional images of the two single crystal samples were obtained on an Olympus LEXT OLS4000 confocal laser microscope with a 405 nm laser for surface profile analysis. The crystal structure was analyzed using VESTA software.12 The diffuse reflectance spectra were obtained in the wavelength range of 190–1060 nm, at room temperature using a SPECORD S-600 UV/Vis spectrophotometer, procured from Analytik Jena AG, Germany. The room temperature photoluminescence (PL) spectra were measured after excitation using an EQ-99X LDLSTM laser-driven light source with a SG-600–500 hyperchromator from Mountain Photonics GmbH, Germany. The signals were detected using a liquid nitrogen cooled CCD camera (Princeton Instruments SPEC-10:100 BR eXcelon) coupled to an Acton SP2560i monochromator. The spectra were corrected for excitation source and detection optics. For the temperature dependent PL measurements, a Daybreak 1150 thermoluminescence (TL) reader was modified to simultaneously excite the sample, and record emission, in a temperature range of 293–865 K. The signal was detected using a Newton 920 CCD camera from Andor Technology (Oxford Instruments), with Solis software for data acquisition. The CCD camera was attached to an Andor Shamrock SR163 Czerny-Turner spectrograph with a 300 g mm−1 grating for the spectral resolution. The data was corrected for the blackbody radiation at high temperatures (>653 K).3 Results
3.1 Confocal microscopy and structure
The 2D images of the surface of the two single crystal samples in real-space and false-color height images are shown in Fig. 1(a and b). In the real-space images, the CePO4 and GdPO4 samples appear rigid with dimensions of ∼750 × 1200 μm and ∼1700 × 1800 μm (length × width), respectively. The false color images evince different colors, green, blue and yellow, which could be due to different absorption/emission characteristics. The different heights in the false color images are encoded by different colors where the yellow color represents greater intensity (greater height) followed by green and blue colors having comparably lower height. Although, the growth of crystals is found to be uniform, cf.Fig. 1(a and b). | ||
| Fig. 1 (a) Real space image (left) and false color height image (right) of the single crystal sample of CePO4; (b) real space image (left) and false color height image (right), to be considered relatively, of the single crystal sample of GdPO4; (c) variation of lattice parameters and axial ratio (a/c) for CePO4 and GdPO4 samples;9,10 and (d) monazite-type crystal structure of LnPO4 (Ln = Ce, Gd). The different heights in the false color images are encoded by different colors. | ||
The structural parameters used in our present study have been reported in ref. 9 and 10 for CePO4 and GdPO4 samples, respectively. A comparison of the lattice parameters and axial ratio (a/c) is shown in Fig. 1(c). The real-time images for these two samples have also been reported in ref. 13. The lattice parameters decrease while the axial ratio (a/c) increases, as we increase the number of electrons from Ce to Gd. Both the samples possess a monazite-type crystal structure, Fig. 1(d). In the structure, the Ln atoms (Ce and Gd) are coordinated to nine oxygen atoms forming an REO9 polyhedron, also described as a pentagonal interpenetrating tetrahedron. Such variation is due to a very slight distortion of the phosphate tetrahedron leading to bidentate bonding, resulting in a rigid structure where one corner of the adjacent PO4 tetrahedra rotates towards the RE ion, transforming REO8 into REO9 polyhedra, due to the larger ionic radius of La in comparison to Lu, which forms a xenotime-type crystal structure. The detailed lattice parameters for the two samples are shown in Table S1 (ESI†).
3.2 Luminescence studies at room temperature
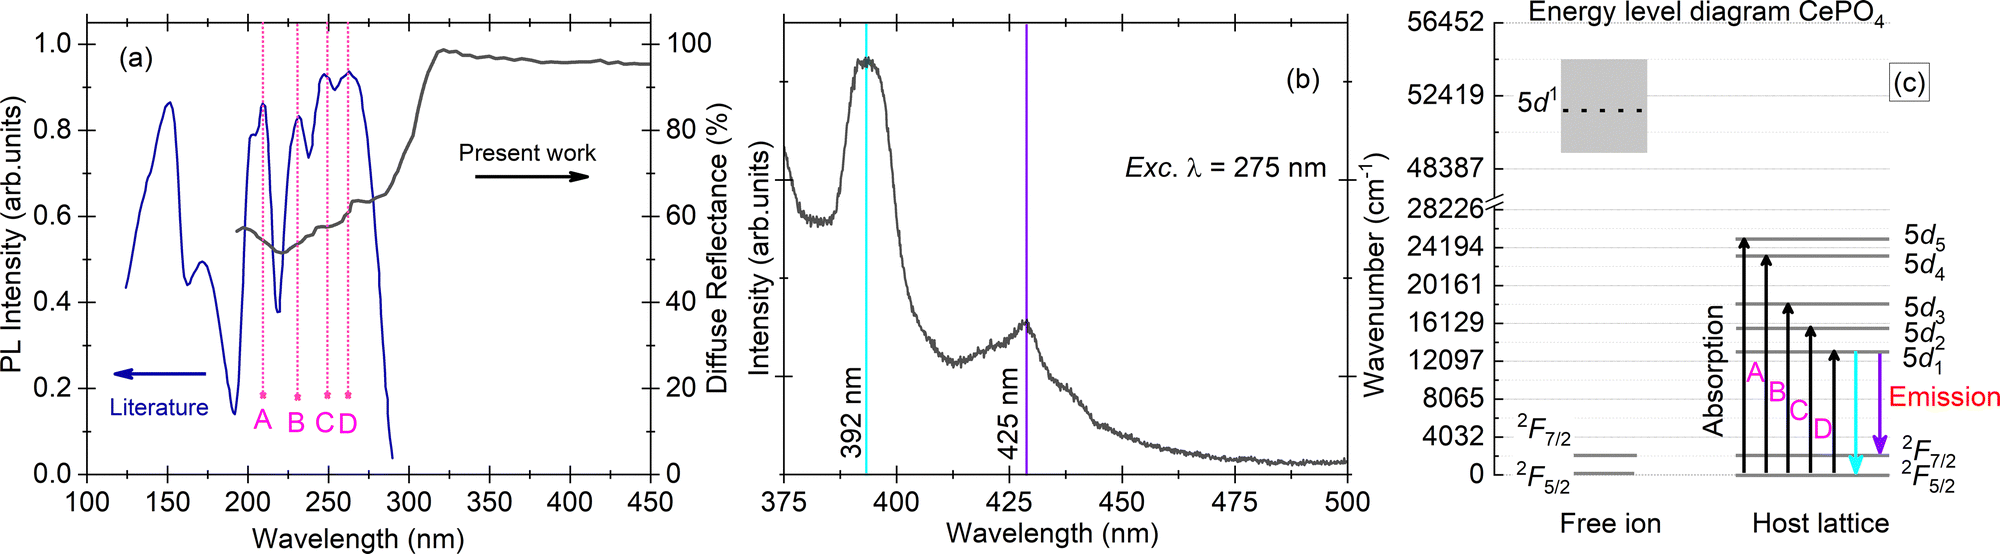 | ||
| Fig. 2 (a) Diffuse reflectance spectrum for a single crystal sample of CePO4 (present work, dark black line) and excitation spectrum for the same sample from the literature (royal blue line),11 along with marked positions of the Ce3+ 4f → 5d transitions (A–D); (b) PL emission spectrum with maxima at 392 and 425 nm, measured for excitation at a wavelength of 275 nm; and (c) energy level diagram of the Ce3+ ion in a vacuum and in the CePO4 host. All the measurements were performed at room temperature. | ||
Hund described the fundamental state of Ce3+ to be 2F5/2 which was later proved and corrected by Lang using X-ray spectra, stating that the lowest Ce-4f state is a 2F5/2–2F7/2 doublet separated from each other by 2253 ± 250 cm−1 and 50![[thin space (1/6-em)]](https://www.rsc.org/images/entities/char_2009.gif) 000 cm−1 from the higher 5d level.14,15 The emission spectrum of CePO4 upon excitation at a wavelength of 275 nm exhibits two bands at 392 (25510 cm−1) and 425 nm (23529 cm−1) with a total separation of 1980 cm−1. The value is in good agreement with the expected separation between 2F5/2 and 2F7/2,15 suggesting that these two emissions originate purely from Ce3+ 5d → 4f [2F(5/2),(7/2)] transitions. The respective absorption and emission transitions are compared for a Ce3+ ion in a vacuum and in the CePO4 host using an energy level diagram as shown in Fig. 2(c). The absorption/excitation is typically due to interconfigurational 4f → 5d transitions (upward arrows), while the emission is due to 5d1 → 4f transitions (downward arrows), respectively.
000 cm−1 from the higher 5d level.14,15 The emission spectrum of CePO4 upon excitation at a wavelength of 275 nm exhibits two bands at 392 (25510 cm−1) and 425 nm (23529 cm−1) with a total separation of 1980 cm−1. The value is in good agreement with the expected separation between 2F5/2 and 2F7/2,15 suggesting that these two emissions originate purely from Ce3+ 5d → 4f [2F(5/2),(7/2)] transitions. The respective absorption and emission transitions are compared for a Ce3+ ion in a vacuum and in the CePO4 host using an energy level diagram as shown in Fig. 2(c). The absorption/excitation is typically due to interconfigurational 4f → 5d transitions (upward arrows), while the emission is due to 5d1 → 4f transitions (downward arrows), respectively.
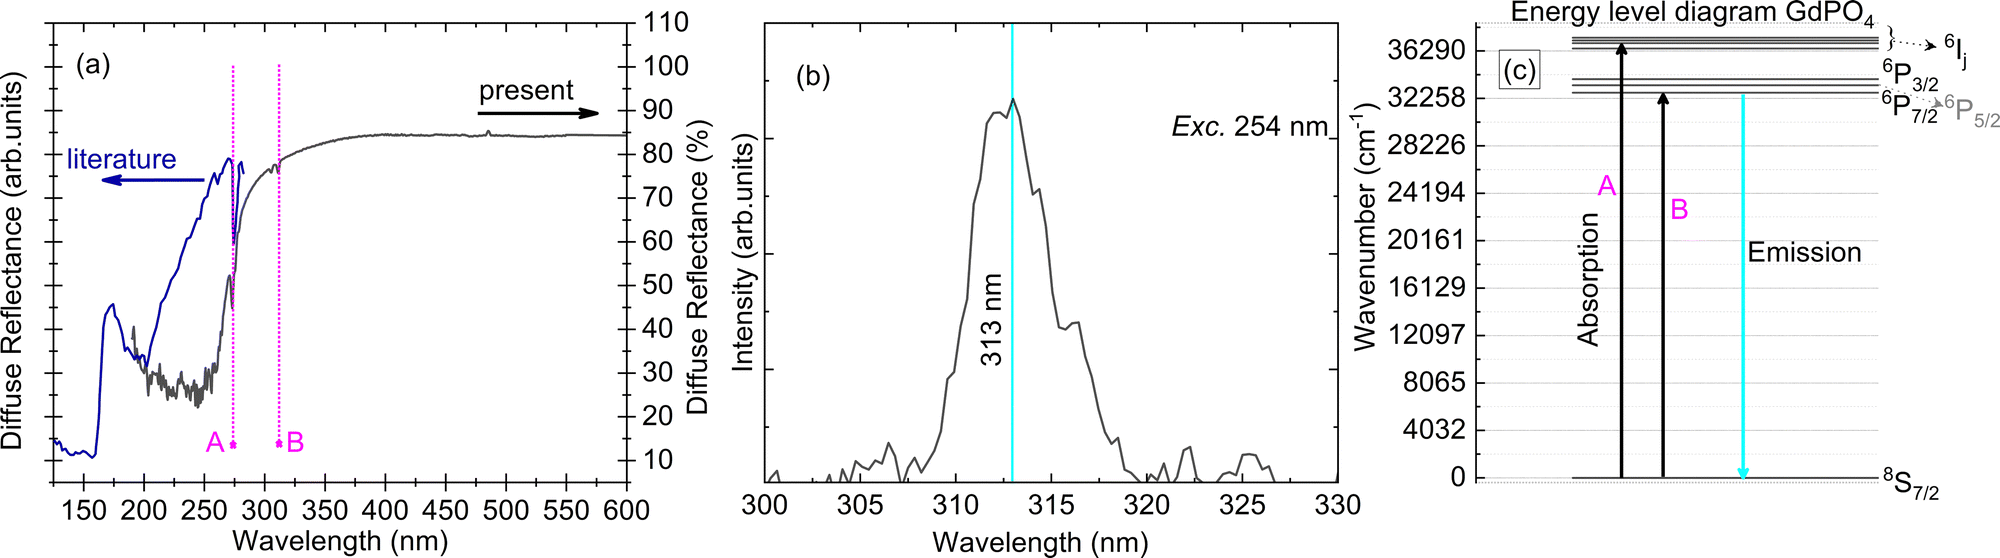 | ||
| Fig. 3 (a) Diffuse reflectance spectrum for a single crystal sample of GdPO4 (present work, dark black line) and from the literature (royal blue line),11 along with marked positions of the Gd3+ 4f–4f transitions (A and B); (b) PL emission spectrum with maxima at 313 nm, measured for excitation at a wavelength of 254 nm; and (c) energy level diagram of the Gd3+ ion in a vacuum along with marked transitions for absorption and emission. All the measurements were performed at room temperature. | ||
The Gd3+ luminescence emission spectrum is shown in Fig. 3(b). The emission spectrum is located in the UV-region of the electromagnetic spectrum with a maximum at 313 nm along with some other lines at wavelengths of 323 and 326 nm. These higher wavelength transitions are assigned to the weak vibronic transitions of Gd3+ and are in accordance with the expected value of ∼1350 cm−1 below the prominent emission at 313 nm.17 The main transition at a wavelength of 313 nm can be assigned to the 6P7/2 → 8S7/2 electronic transition. Moreover, we also observe small kinks in the emission spectrum for the main transition at 313 nm, cf.Fig. 3(b). These can be assigned to the higher crystal field levels of the 6P7/2 level. Since the crystal field for lanthanides with f–f type transitions is expected to be small, measurements at helium temperature are required to provide detailed investigations on the influence of crystal field on 6P7/2 multiplets, which paves the way for further research. Usually, one can expect four different crystal-field levels of 6PJ upon excitation with UV, and other 6P, 6I, 6D and 6G level related emission upon excitation with higher energy, for example, when excited with X-rays.18
The energy level scheme of the Gd3+ ion was first discussed by Piksis19 for energy up to 40590 cm−1, and later by Wegh20 in the vacuum ultraviolet energy region (50000–70000 cm−1). The Gd3+ ion has a half-filled configuration, [Xe]4f75s25p6, which gives a stable 8S7/2 ground state. The 8S7/2 state is orbitally non-degenerate and cannot be split by the crystal field resulting in a single line. The excited state of Gd3+ has two set of multiplets corresponding to 6PJ and 6IJ in the UV-region (J is the quantum number for total angular momentum), along with other higher energy multiplets due to 6DJ in the vacuum ultra-violet region [the ones corresponding to 6PJ and 6IJ are shown in Fig. 3(c)]. Because the 4f7 shell is shielded by 5s2 and 5p6 electrons, the position and order of 6PJ, 6IJ and 6DJ are almost independent of host choice. The diffuse reflectance spectra in Fig. 3(a) show two absorption lines (marked A and B) which correspond to transitions from the ground state, 8S7/2 to higher 6PJ and 6IJ states, respectively, in increasing order of energy. The Stark components of these transitions (in absorption and emission) could not be resolved further due to experimental limitations. The band gap of the material is 7.8 eV as determined in an earlier report.11
3.3 Luminescence studies at high temperature
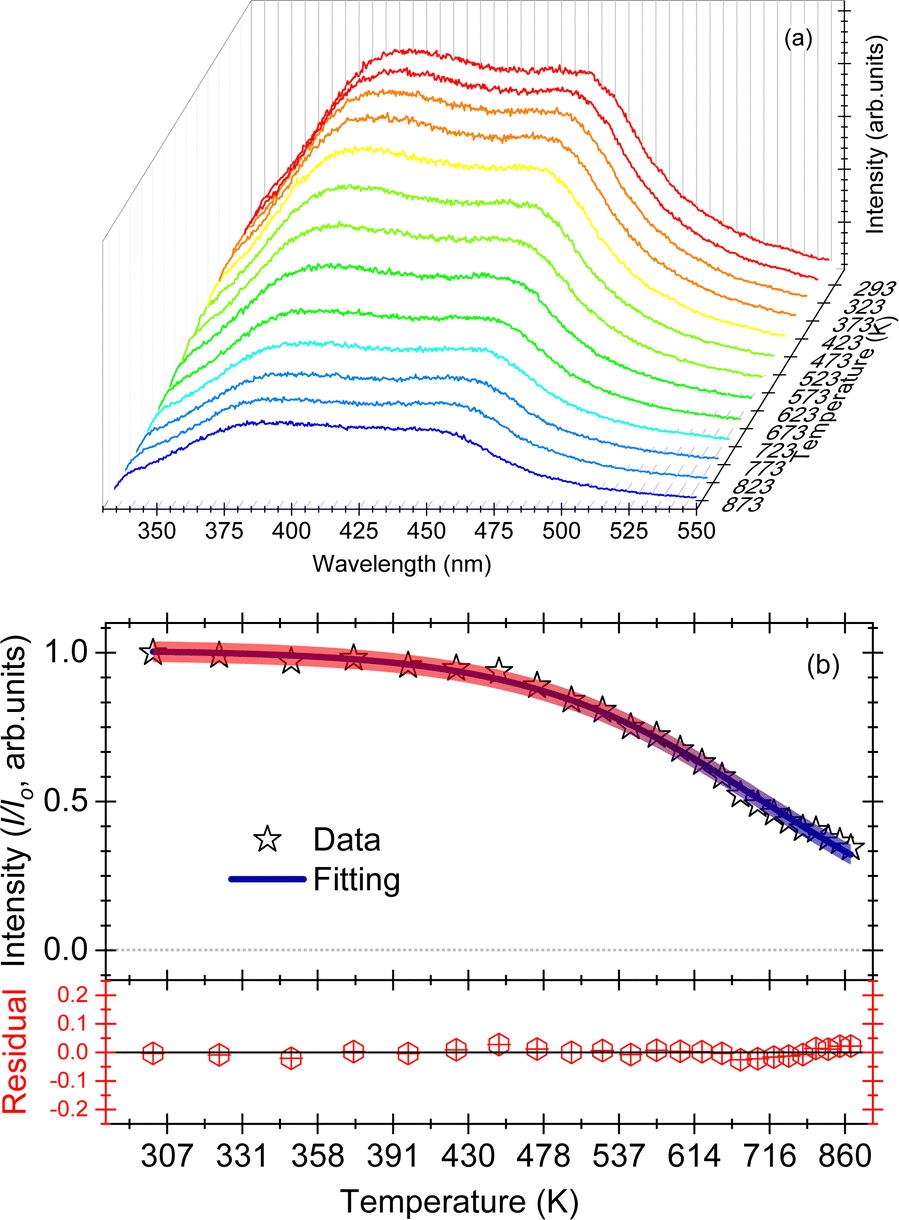 | ||
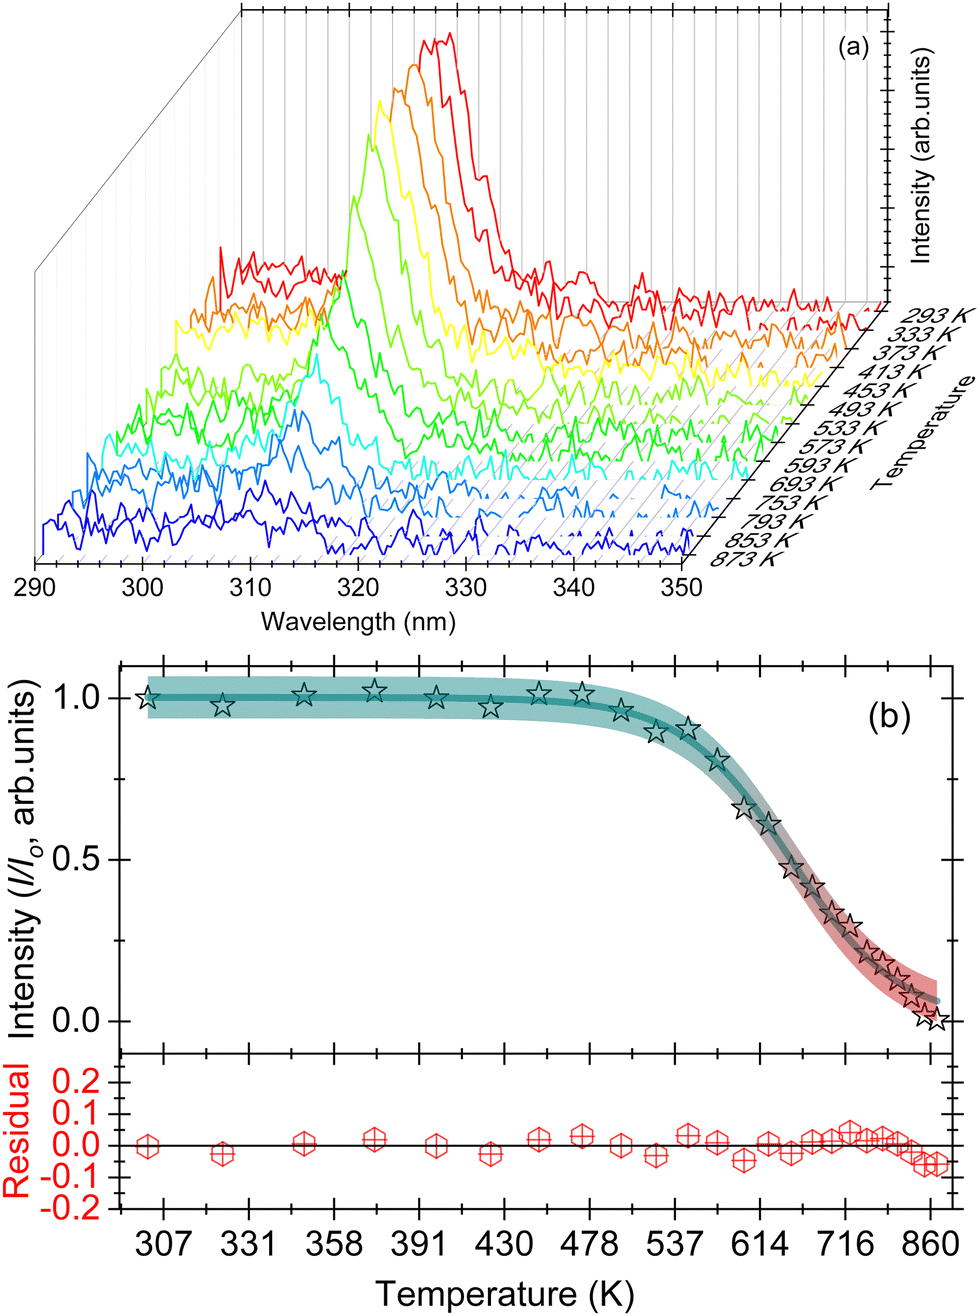
| Fig. 4 (a) Waterfall plots of PL intensity of CePO4 between temperatures of 293 and 873 K, for excitation at a wavelength of 254 nm; (b) integrated PL emission intensity between wavelengths of 360 and 550 nm, as a function of increasing temperature. The residual obtained after subtracting the fitted data from the experimental data is also shown for a comparison. | ||
The effect of temperature on the thermal quenching of CePO4 is determined by normalizing the high temperature luminescence curves up to 873 K with respect to the emission spectrum measured at 273 K. The onset of the quenching temperature (T95%) and the thermal quenching temperature (T50%) can be defined as the temperatures at which the emission intensity decreases to 95% and 50% of the initial emission intensity at room temperature, respectively. For CePO4, T95% is evaluated to be a temperature of 430 K, while T50% is found to be a temperature of 640 K, cf.Fig. 4(b). The sample showed lower stability of the PL in comparison to TbPO4 (T50% = 730 K), and better thermal stability than PrPO4 (T50% = 540 K) and DyPO4 (T50% = 490 K). Although, in all the above cases, different excitation wavelengths can also lead to a change in the T50% temperature. To determine the activation energy, a single barrier quenching model was used to fit the thermal quenching curve in Fig. 4(b) using eqn (1):22
 | (1) |
 | ||
| Fig. 5 (a) Waterfall plots of PL intensity of GdPO4 between temperatures of 293 and 873 K, for excitation at a wavelength of 254 nm; (b) integrated PL emission intensity between 300 and 320 nm as a function of increasing temperature. The residual obtained after subtracting the fitted data from the experimental data is also shown for a comparison. | ||
The thermal quenching curve for the sample GdPO4 is shown in Fig. 5(b). The onset of the quenching (T95%) and the thermal quenching temperature (T50%) for the GdPO4 sample are evaluated to be 510 and 665 K, respectively [cf.Fig. 5(b)]. We used eqn (1) to fit the thermal quenching curve as shown in Fig. 5(b) where the residual (experimental − fitted data) is also shown. The activation energy upon fitting the data is calculated at 0.58 ± 0.03 eV having a good agreement between the experimental data and the fitted data.
3.4 Thermoluminescence
The thermoluminescence (TL) glow curves for the two samples under a β-dose fluence of 20 Gy are shown in Fig. 6. The glow curve for CePO4 shows a maximum at 365 K with approximate trap depth (activation energy, Ea) of 0.78 eV calculated using a first order kinetic equation, 25kBTm,23 where kB is Boltzmann's constant and Tm is the glow curve maximum. The glow curve maximum at 365 K is similar to that observed for DyPO4,4 SmPO4 and EuPO4 samples,3 suggesting that the origin of this glow curve maximum is an intrinsic defect which is formed due to the host lattice and is independent of the choice of the rare earth ion. This defect has similar trap depth in all the samples. The high temperature increase in the TL signal for temperature >560 K in the CePO4 sample is related to the black body radiation from the stainless steel disc used for placing the sample inside a TL reader. The glow curve for GdPO4 possesses three maxima at 365, 500 and 590 K, with Ea = 0.78, 1.02 and 1.30 eV, respectively [cf.Fig. 6]. The glow peak maximum at 365 K is similar to that observed for the CePO4 sample.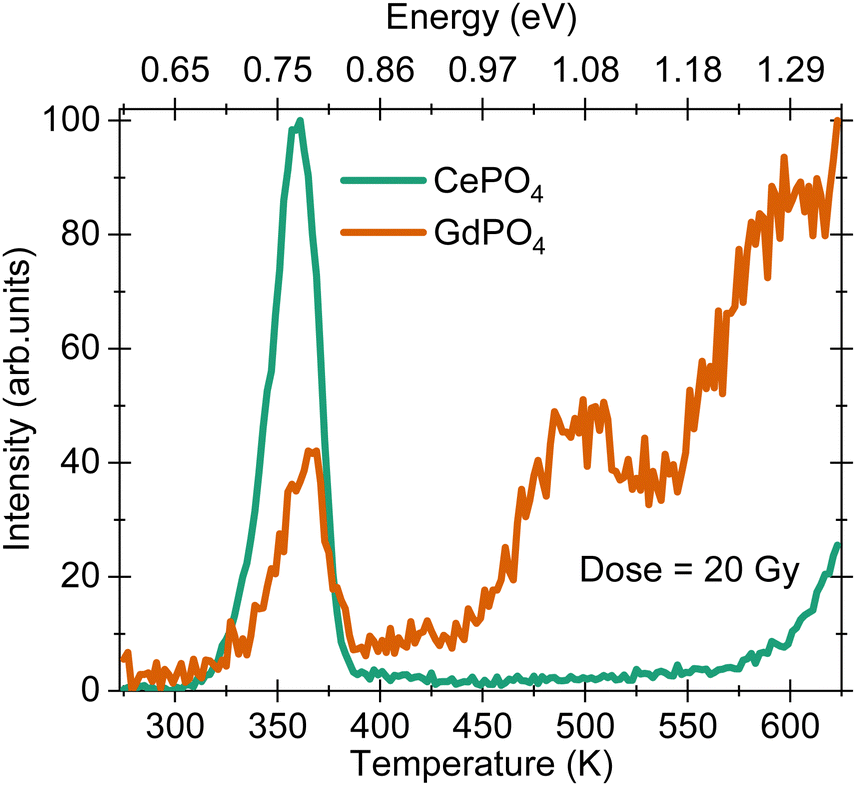 | ||
| Fig. 6 Thermoluminescence glow curves of CePO4 and GdPO4 samples recorded upon exposure to a 20 Gy β-dose. The glow curves were recorded with a heating rate of 2 K s−1 without using any filter in the detection path. | ||
4 Discussion
CePO4 and GdPO4 are two interesting and important members of the rare earth orthophosphate family. For CePO4, the Ce3+ ion acts as a luminescent center with prominent emission at 392 and 425 nm due to electric- and spin-allowed dipole transitions from the 5d state to the multiplets of the fundamental 4f configuration. Depending upon the site symmetry, the five most distinct 4f–5d transitions can be observed in the absorption spectra of Ce3+. Since the electron–phonon coupling spectra of the 4f and 5d electrons are different in Ce3+, the parity allowed electron–dipole transitions between the 4f and 5d states exhibit broad absorption and emission bands and the average position of the 5d bands decreases when compared to the position of free ions, which is also called centroid or barycentre shift.24 The energy of the radiative transitions depends on the energy of the 5d component in the crystal field and also its degree of coupling with the lattice phonons. Fig. 7 compares the emission transitions of Ce3+ in different rare earth orthophosphate hosts, YPO4, LaPO4, CePO4, and LuPO4. While LaPO4 and CePO4 possess a monazite-type crystal structure, the YPO4 and LuPO4 hosts have a xenotime-type crystal structure. The impact of crystal structure is found to influence the crystal field of Ce3+ ions in these hosts. As we move from La to Ce based rare earth orthophosphates, the crystal field decreases thus increasing the overall separation between the lowest of the 5d1 and 4f levels. The decrease in crystal field is in direct correlation with the lanthanide contraction effect where the ionic and atomic radii decrease with an increase in the atomic number.13 For the xenotime type structure, the influence/crystal field is found to be higher when compared to the orthophosphates with monazite-type structure. This implies that the separation between the lowest 5d1 and 4f levels is the lowest with a prominent emission around a wavelength of 340 nm. For LaPO4, the prominent emission is observed in the UV-region at a wavelength of 320–340 nm, while the prominent emission in the case of CePO4 is observed at 392 and 425 nm. Overall, the band gap of CePO4 is 8.0 eV upon combining diffuse reflectance spectra from the present and the earlier work, and the crystal field effect is much greater in rare earth orthophosphates with a xenotime-type crystal structure when compared with rare earth orthophosphates exhibiting a monazite-type crystal structure.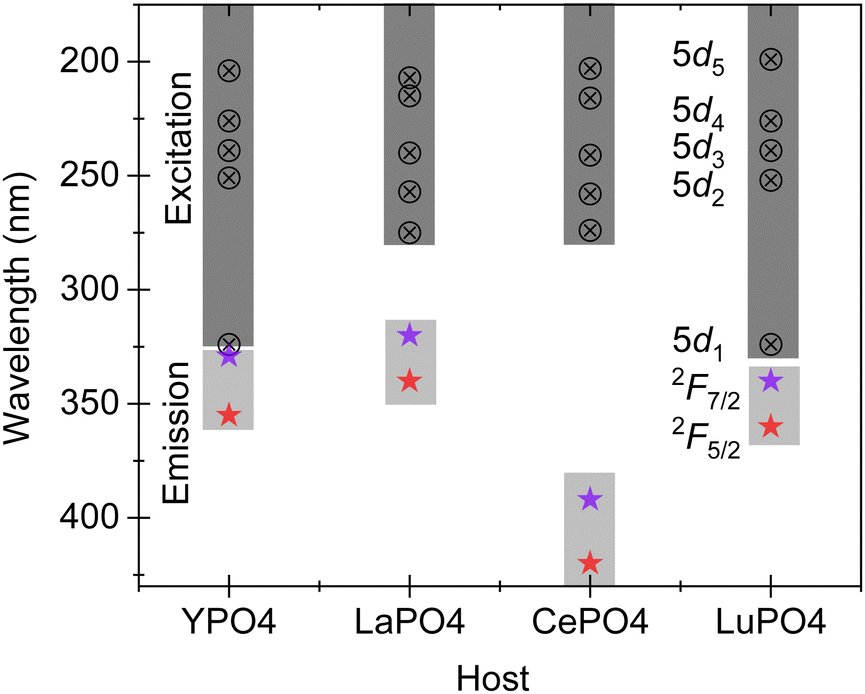 | ||
| Fig. 7 Comparison of five different Ce3+ related absorption bands and emission bands among different hosts; YPO4 and LuPO4 possess a xenotime-type crystal structure while LaPO4 and CePO4 have a monazite-type crystal structure. | ||
However, when Gd3+ is present as a luminescence center in samples with a monazite-type crystal structure, for example LaPO4,25 and GdPO4 (the present work), or in YPO426 with a xenotime-type structure, the emission maximum is consistent at 312 ± 1 nm suggesting that the crystal field has negligible or no effect despite their comparatively different crystal structures. This clearly suggests that there is shielding of Gd3+ 4f levels both in the ground as well as the excited states.
Finally, to understand the causes of variation in thermal quenching temperature and activation energy (Ea), we prepared vacuum referred binding energy (VRBE) diagrams for LaPO4 and GdPO4, Fig. S1 and S2 (ESI†), respectively. The data used to construct the VRBE diagram has been published by Dorenbos.27 In LaPO4, Ce3+ is located ∼0.25 eV below the conduction band edge, Fig. S1 (ESI†). This value is in good agreement with the Ea value calculated from the thermal quenching curve, cf.Fig. 4(b). This Ea (0.25 eV) when translated to the TL glow curve, should show up at ∼115 K on the temperature vs. intensity scale (TL curve). This temperature is much lower than the current temperature range, 273–873 K, used to record TL glow curves. For GdPO4, the Ea evaluated from the thermal quenching curves is 0.58 ± 0.03 eV, cf.Fig. 5(b). When we compare this value with the separation between the conduction band edge and the highest 4f state of Gd3+ ions, a value of 1.29 eV is expected. This value is also observed in the TL glow curve for the GdPO4 sample where a glow curve maximum is observed at 1.30 eV along with other maxima at 0.78 and 1.02 eV, cf.Fig. 6. The trap with trap depth 1.30 eV matches closely with the predicted value of 1.29 eV from the VRBE diagram suggesting that this defect acts as an electron trap. The nature of other defects at 1.02 eV could not be determined although based on the earlier observations, the trap with trap depth 0.78 eV is anticipated to belong to the intrinsic defect corresponding to the release of a hole from an unidentified host associated hole trap.16 There can be two different ways to understand the luminescence quenching mechanisms in rare earth doped hosts: (a) via electron ionisation to the conduction band, and (b) via hole ionisation to the valence band. The Ea = 0.58 eV for GdPO4 matches closely with the 0.78 eV value (host associated hole trap). Hence, the thermal quenching in GdPO4 is due to the thermal ionization of holes close to the valence band, while for the CePO4 sample, thermal ionization of electrons close to the conduction band dominates. The Ea = 0.58 eV for GdPO4 is also found to be higher than that of the CePO4 sample which suggests that the GdPO4 sample has higher thermal stability and can act as a better charge reservoir than the CePO4 sample.
5 Conclusions
The present work investigates, in detail, the optical properties of single crystal samples of CePO4 and GdPO4, under UV excitation for possible use as charge reservoirs. CePO4 shows double band emission spectra with maxima at wavelengths of 392 and 425 nm, with a separation of about 1980 cm−1 which corresponds to Ce3+ 5d → 4f interconfigurational transitions. The emission in GdPO4 is typical of intraconfigurational f–f type with prominent UVB emission at a wavelength of 313 nm. The CePO4 and GdPO4 samples possess different thermal quenching temperatures, 640 and 665 K, with GdPO4 exhibiting better thermal stability for charge storage applications. The activation energy in the two cases is found to be 0.25 and 0.58 eV for CePO4 and GdPO4 samples, respectively. The values are in good agreement with the theoretical calculations performed using the chemical shift model (VRBE diagrams), suggesting that the thermal quenching in CePO4 is dominated by thermal ionization of charges to the conduction band. In the case of GdPO4 the thermal quenching is dominated by thermal ionization of charges to the valence band, suggesting that the thermal quenching phenomenon in both cases is dominated by the thermal ionization mechanism.Conflicts of interest
There are no conflicts to declare.Acknowledgements
The author thanks Prof. Johannes Heitmann and Dr Jan Beyer of the Institute of Applied Physics, TU Bergakademie Freiberg, Germany for providing experimental facilities and their input on the draft of the manuscript. The author also thanks Prof. Richard Gloaguen and Dr Margret Fuchs of Helmholtz-Institute Freiberg for Resource Technology, Freiberg-Germany, and the Department of Mineral Sciences of the Smithsonian Institution, for providing the reference samples [Catalog # NMNH 168484 (CePO4) and NMNH 168488 (GdPO4)]. The author thanks Thomas Behm for measurement support with the confocal microscope, and Thomas Köhler for support with UV-Vis diffuse reflectance spectra of both the samples.Notes and references
- S. Achary, S. Bevara and A. Tyagi, Coord. Chem. Rev., 2017, 340, 266–297 CrossRef CAS.
- S. K. Sharma, T. Kohler, J. Beyer, M. Fuchs, R. Gloaguen and J. Heitmann, Phys. Chem. Chem. Phys., 2019, 21, 16329–16336 RSC.
- S. K. Sharma, J. Beyer, R. Gloaguen and J. Heitmann, Phys. Chem. Chem. Phys., 2019, 21, 25669–25677 RSC.
- S. K. Sharma, J. Beyer, R. Gloaguen and J. Heitmann, Phys. Chem. Chem. Phys., 2020, 22, 10247–10255 RSC.
- C. Richard, B.-T. Doan, J.-C. Beloeil, M. Bessodes, V. Tóth and D. Scherman, Nano Lett., 2008, 8, 232–236 CrossRef CAS.
- Y.-C. Lin, M. Bettinelli and M. Karlsson, Chem. Mater., 2019, 31, 3851–3862 CrossRef CAS.
- R. S. Feigelson, J. Am. Ceram. Soc., 1964, 47, 257–258 CrossRef CAS.
- E. Jarosewich and L. A. Boatner, Geostand. Newsl., 1991, 15, 397–399 CrossRef CAS.
- G. Beall, L. Boatner, D. Mullica and W. Milligan, J. Inorg. Nucl. Chem., 1981, 43, 101–105 CrossRef CAS.
- D. F. Mullica, D. A. Grossie and L. A. Boatner, Inorg. Chim. Acta, 1985, 109, 105–110 CrossRef CAS.
- A. Mayolet, PhD thesis, Institut de Physique Nucleaire, UniversiteParis - SUD, Orsay, France, 1995.
- K. Momma and F. Izumi, J. Appl. Crystallogr., 2011, 44, 1272–1276 CrossRef CAS.
- S. K. Sharma, T. Behm, T. Köhler, J. Beyer, R. Gloaguen and J. Heitmann, Crystals, 2020, 10(7), 593 CrossRef CAS.
- F. Hund, Z. Phys., 1925, 33, 855–859 CrossRef CAS.
- R. J. Lang, Can. J. Res., 1936, 14a, 127–130 CrossRef.
- T. Lyu and P. Dorenbos, J. Mater. Chem. C, 2018, 6, 369–379 RSC.
- G. Blasse, Int. Rev. Phys. Chem., 1992, 11, 71–100 Search PubMed.
- G. L. H. Brixner, Chem. Phys. Lett., 1989, 157, 283–288 CrossRef.
- A. H. Piksis, G. H. Dieke and H. M. Crosswhite, J. Chem. Phys., 1967, 47, 5083–5089 CrossRef CAS.
- R. T. Wegh, H. Donker, A. Meijerink, R. J. Lamminmäki and J. Hölsä, Phys. Rev. B: Condens. Matter Mater. Phys., 1997, 56, 13841–13848 CrossRef CAS.
- N. Ekthammathat, T. Thongtem, A. Phuruangrat and S. Thongtem, J. Nanomater., 2012, 2012, 958593 Search PubMed.
- C. W. Struck and W. H. Fonger, J. Lumin., 1975, 10, 1–30 CrossRef CAS.
- C. Furetta, Handbook of thermoluminescence, World Scientific Pub., 2003, p. 461 Search PubMed.
- S. K. Sharma, Phosphors: Synthesis and Applications, 2018, 49 Search PubMed.
- A. Chauhan, A. Gawande and S. Omanwar, Optik, 2016, 127, 6647–6652 CrossRef CAS.
- V. Singh, A. Prasad, A. Rao, S. W. Jung, N. Singh and M. Irfan, Optik, 2021, 225, 165804 CrossRef CAS.
- P. Dorenbos, J. Phys.: Condens. Matter, 2013, 25, 225501 CrossRef.
Footnote |
| † Electronic supplementary information (ESI) available: Fig. S1 and S2. See DOI: https://doi.org/10.1039/d2ma00951j |
| This journal is © The Royal Society of Chemistry 2023 |