DOI:
10.1039/D2MA00902A
(Paper)
Mater. Adv., 2023,
4, 122-133
Sulfur incorporation into NiFe oxygen evolution electrocatalysts for improved high current density operation†
Received
14th September 2022
, Accepted 24th October 2022
First published on 26th October 2022
Abstract
The efficient production of green hydrogen via electrochemical water splitting is important for improving the sustainability and enabling the electrification of the chemical industry. One of the major goals of water electrolysis is to utilize non-precious metal catalysts, which can be accomplished with alkaline electrolyzer technologies. However, there is a continuing need for designing catalysts that can operate in alkaline environments with high efficiencies under high current densities. Here we describe a simple, aqueous-based synthesis method to incorporate sulfur into NiFe-based electrocatalysts for the oxygen evolution reaction (OER). Sulfur incorporation was able to reduce the overpotential for the OER from ca. 350 mV on a NiFe catalyst to ca. 290 mV on the NiFeS catalyst at 100 mA cm−2 on a flat supporting electrode. Electrochemical impedance spectroscopy data showed a small decrease in the charge transfer resistance of the NiFeS catalysts, showing that sulfur incorporation may improve the electronic conductivity. Surface-interrogation scanning electrochemical microscopy (SI-SECM) studies combined with Tafel slope analysis suggested that the NiFeS catalyst was able to have vacant surface sites available under OER conditions and was able to maintain a Tafel slope of 39 mV dec−1. This is in contrast to the NiFe catalyst, for which the SI-SECM studies showed a saturated surface under OER conditions with the Tafel slope transitioning from 39 mV dec−1 to 118 mV dec−1. The low Tafel slope enabled the NiFeS catalyst to maintain low overpotentials under high current densities, which we attribute to the ability of the NiFeS catalyst to maintain vacant sites during the OER.
1 Introduction
The production of green hydrogen from water electrolysis is gaining considerable interest due to its role in sustainable chemical processing,1 in grid level energy storage,2 and as a transportation fuel.3–5 Generally, water electrolysis is either performed in acidic environments in proton exchange membrane (PEM) electrolyzers, which utilize acidic solid polymer electrolytes, or in liquid alkaline environments.6 Alkaline electrolyzers are seeing a renewed interest due to their ability to utilize earth-abundant catalysts and stainless steel internal stack components. However, a significant problem with alkaline electrolyzers is that they typically produce hydrogen at less than half the rate per unit surface area (i.e., half the total current density) of PEM electrolyzers.7 Thus, there is a need to develop new electrocatalysts for both of the water-splitting half reactions (the hydrogen evolution reaction, HER, and the oxygen evolution reaction, OER) that can operate at high current densities with low overpotentials.8
Typically, the OER is considered to be the limiting half reaction due to the slow kinetics of the four proton-coupled electron transfer steps needed to convert hydroxide ions (or water) to oxygen.9 Traditionally, IrO2 and RuO2 have been considered some of the most active OER electrocatalysts.10 More recently, Ni-based electrocatalysts have been studied as an alternative to platinum group metal (PGM) catalysts for the OER in alkaline media.11–16 However, the activity of nickel hydroxide/oxyhydroxide (Ni(OH)2/NiOOH) electrocatalysts have been attributed to the intentional or unintentional incorporation of Fe.13,17–19 Thus, recent studies focused on mixed Ni and Fe oxide electrocatalysts found that NiFe mixtures are among the most active non-precious OER catalysts in alkaline electrolytes.20–24 In particular, layered double hydroxide (LDH) and amorphous structures have shown some of the highest reported performances to date.25–30
In addition to oxides and (oxy)hydroxides, transition metal chalcogenides and anion doping have also been investigated as OER electrocatalysts.31–36 In fact, sulfur-doping is thought to be promising due to the synergistic effect of the OH and S ligands on the catalyst surface.37–40 It has been suggested that this effect can tune the electronic structure of the active metal centers and create optimal binding energies with the OER intermediates to enhance OER activity and stability.40 Moreover, there is evidence that S incorporation may improve the poor electrical conductivity of NiFe-LDHs since surface adsorbed S ions may adjust the electronic structure and coordination environment of the active sites.38
Recently, our group reported a facile aqueous-based synthesis method for producing amorphous mixed-metal oxide electrocatalysts.20,21 This method is based on first synthesizing mixed-metal carbonates and then converting them to mixed-metal oxides using a microwave heating step. In this work, we set out to determine if a similar aqueous-based synthesis method could also enable S incorporation into mixed metal NiFe electrocatalysts. Here, we report that mixtures of nickel and iron sulfate precursors titrated with sulfite salts will result in the formation of NiFeS catalysts in aqueous media without a microwave heating step. This synthesis method also directly allowed us to compare traditional NiFe- and NiFeS-based catalysts. Furthermore, we observed that S-incorporation reduced the overpotential for the OER at current densities exceeding 100 mA cm−2. In fact, we observed that the Tafel slope for the NiFeS catalyst was ca. 39 mV dec−1, while the Tafel slope for the NiFe catalyst was ca. 118 mV dec−1. Electrochemical impedance spectroscopy (EIS) measurements showed a slight attenuation of the charge-transfer resistance upon incorporating S, suggesting that S incorporation improves electronic conductivity. In addition, surface-interrogation SECM (SI-SECM) showed that the surface of NiFe catalysts becomes fully saturated with adsorbed intermediates. Still, incorporating S enables vacant catalytic sites to be available at more positive potentials. The availability of vacant sites on NiFeS catalysts may be one reason for the improved high-current density performance and the low Tafel slope of the NiFeS catalysts.
2 Materials and methods
2.1 Materials
Nickel sulfate hexahydrate (Crystalline/Certified ACS, Fischer Chemical), iron(III) sulfate pentahydrate (97%, Thermo Scientific), sodium sulfite anhydrous (Crystalline/Certified ACS, Fisher Chemical), iron(III) nitrate nonahydrate (98%+, ACS Reagent, Acros), nickel(II) nitrate hexahydrate (99%, Fisher Scientific), and sodium bicarbonate (Tech, Fisher Science Education) were used as received without additional purification. Fluorine doped in a tin oxide (FTO) coated glass slide with a surface resistivity of ∼7 Ω was obtained from Aldrich Chemistry. All ultrapure water was obtained using a Synergy water purification system by Millipore conditioned to 18.2 MΩ water.
2.2 Catalyst synthesis
The NiFeS catalyst was synthesized through a titration method, while the NiFe catalyst was synthesized through a previously reported microwave method from our group.20 For the NiFeS catalyst, a 0.2 M solution in a 1![[thin space (1/6-em)]](https://www.rsc.org/images/entities/char_2009.gif) :1 ratio was prepared using 4.8996 g of Fe2(SO4)3·5H2O and 2.6285 g of NiSO4·6H2O dissolved in 18.2 MΩ water for a volumetric total of 100 mL. In conjunction, 2.989 grams of Na2SO3 was dissolved in 18.2 MΩ water for a volumetric total of 100 mL. With the nickel and iron sulfate solution on ice, the sodium sulfite solution was titrated into the mixed-metal sulfate solution using a peristaltic pump at a rate of 0.35–0.96 mL min−1 as the metal sulfate solution was stirred. A gradual color change from blue-green to orange occurred as the titration continued. The titration took approximately 4 hours to complete. After the titration process concluded, the solution was allowed to stir for 1 hour and then stored in glass jars. A similar procedure was used for the NiFe catalyst except that 4.04 g of Fe(NO3)3·9H2O and 2.9081 g of Ni(NO3)2·6H2O replaced the metal sulfates and 1.992 g of NaHCO3 replaced the sodium sulfite. This solution was then poured into a Nalgene bottle and microwaved in a 1050 W conventional microwave oven for 2 minutes, stopping and swirling every 15–30 seconds. Bubbling occurred as the solution was microwaved.
:1 ratio was prepared using 4.8996 g of Fe2(SO4)3·5H2O and 2.6285 g of NiSO4·6H2O dissolved in 18.2 MΩ water for a volumetric total of 100 mL. In conjunction, 2.989 grams of Na2SO3 was dissolved in 18.2 MΩ water for a volumetric total of 100 mL. With the nickel and iron sulfate solution on ice, the sodium sulfite solution was titrated into the mixed-metal sulfate solution using a peristaltic pump at a rate of 0.35–0.96 mL min−1 as the metal sulfate solution was stirred. A gradual color change from blue-green to orange occurred as the titration continued. The titration took approximately 4 hours to complete. After the titration process concluded, the solution was allowed to stir for 1 hour and then stored in glass jars. A similar procedure was used for the NiFe catalyst except that 4.04 g of Fe(NO3)3·9H2O and 2.9081 g of Ni(NO3)2·6H2O replaced the metal sulfates and 1.992 g of NaHCO3 replaced the sodium sulfite. This solution was then poured into a Nalgene bottle and microwaved in a 1050 W conventional microwave oven for 2 minutes, stopping and swirling every 15–30 seconds. Bubbling occurred as the solution was microwaved.
2.3 Electrode synthesis
The NiFe and NiFeS catalysts were electrophoretically deposited onto FTO glass using a CHI potentiostat. FTO glass was used as a support to enable the SI-SECM measurements. The FTO glass was rinsed with soap, water, and ethanol and then ultrasonicated in ethanol for 15 minutes. The FTO glass was then stored in ethanol and taken out before use. For the electrophoretic deposition process, copper tape was attached to the FTO support before the support was placed in a custom Teflon cell. The catalyst suspension was pipetted into the well exposed to the FTO support. An Ag/AgCl reference electrode and Pt counter electrode were placed into the Teflon cell to complete a three-electrode system before applying a constant potential of −1.1 V vs. Ag/AgCl for 10 minutes.
2.4 Materials characterization
Scanning Electron Microscopy (SEM) and Energy Dispersive X-ray Spectroscopy (EDS) were carried out using a Hitachi S4700 SEM. The binding energies of the C 1s, O 1s, Ni 2p, Fe 2p, and S 2p orbitals were collected using an X-ray Photoelectron Spectroscope (XPS, Physical Electronics, Inc USA) with a monochromatic Al X-ray source. All XPS fitting and elemental quantification were performed using the CasaXPS software using a Shirley background. X-Ray Diffraction (XRD) data were collected using a step width of 0.013° and step time of 54.57 s with a 2θ range of 5.0–80.0°. Transmission Electron Spectroscopy (TEM) images were obtained using a Hitachi H-8100 TEM.
2.5 Electrochemical characterization
Electrochemical experiments were performed on the catalyst-coated electrode using a CHI potentiostat. A custom Teflon testing cell was assembled using a Hg/HgO reference electrode and a 200 μm Pt wire counter electrode. An area of 0.1781 cm−2 was determined for the working electrode using o-rings. The electrolyte solution used for all cyclic voltammograms was 3 M KOH. Electrochemical impedance spectroscopy (EIS) was performed from a frequency of 0.1 Hz to 100000 Hz with an amplitude of 0.005 V for three cycles and 5 points at each frequency range.
Benchmarking experiments (i.e. cyclic voltammetry, chronoamperometry, and chronopotentiometry) were performed using the NiFeS catalyst electrodeposited onto the FTO support with the same setup as the initial cyclic voltammetry experiments. 24 hour stability experiments were performed at current densities of 10 and 100 mA cm−2. Reproducibility studies were also conducted on both NiFe and NiFeS.
A Scanning Electrochemical Microscope (SECM)41 was used for surface interrogation and substrate generation tip collection experiments. For the surface interrogation experiments, 3 M KOH with ca. 50 mM Fe(III)–TEA was bubbled in Argon for 10 minutes before the start of each experiment. A custom Teflon cell was used to hold the catalyst-loaded electrode. A 200 μm Pt wire counter electrode and an Ag/AgCl reference electrode were used. A 100 μm radius glassy carbon electrode was used as the SECM tip. The tip electrode was held at −1.1 V vs. Ag/AgCl and moved towards the substrate until a current attenuation of 0.4 was reached (negative feedback). A masking technique was used for the NiFeS sample. Briefly, several holes were drilled into a square of Teflon FEP Film (50A, American Durafilm) with a 100 μm diameter drill bit (One Piece, Drill Bits Unlimited) in a CNC mill. The FEP film mask was placed over the catalyst sample dropcast on FTO glass. The FEP film mask was heat-bonded to the substrate by placing in a furnace above 271 °C for 30 minutes. Electrochemical reactivity maps were generated until a hole in the mask containing the catalyst was found. The SECM tip was then moved to the location of this hole and then reapproached until a current enhancement of 0.4. The surface interrogation experiment was then performed at −1.1 V vs. Ag/AgCl on the tip electrode with the substrate set to 0.5 V vs. Ag/AgCl and a 20 s time step. COMSOL Multiphysics v. 6.0 was used to perform finite element analysis simulations. For the substrate generation/tip collection experiments, a 200 μm Pt tip electrode was moved towards the NiFeS catalyst substrate electrode in a ca. 0.5 mM ferrocene methanol solution with 0.1 M NaNO3 supporting electrolyte. To calibrate the collection efficiency, the cyclic voltammetry was performed on the NiFeS substrate electrode from 0 to 0.4 V vs. Ag/AgCl while holding the potential of the Pt tip electrode constant at 0 V vs. Ag/AgCl. Then the solution was replaced with 3 M KOH, and voltammetry was performed on the NiFeS electrode to generate oxygen while maintaining a potential of −0.6 V vs. Ag/AgCl on the Pt tip electrode.
3 Results and discussion
3.1 Catalyst synthesis and materials characterization
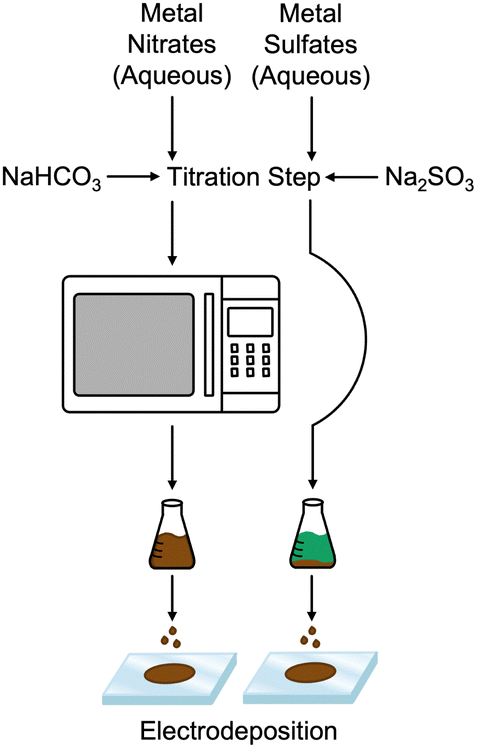
Fig. 1 compares the synthesis methods for our previously reported nanoamorphous NiFe electrocatalysts using the microwave-assisted technique using the simplified method to produce a NiFeS catalyst reported herein. Synthesis of the NiFeS catalysts was achieved by first dissolving a mixture of iron(III) sulfate and nickel(II) sulfate in water, both soluble at the concentrations used. Upon titration with sodium sulfite, a gradual color change from blue-green to orange occurred as the titration continued, and a precipitate was formed. The NiFeS catalyst was deposited onto the supporting electrodes without any heating steps. As we previously reported, a microwave heating step is necessary to activate the traditional NiFe catalysts due to the inactivity of the carbonate particles formed upon titration;20 however, we observed that the microwave heating step was not necessary for the synthesis of the NiFeS catalyst.
 |
| | Fig. 1 Synthesis method of amorphous NiFe (left) and NiFeS (right). | |
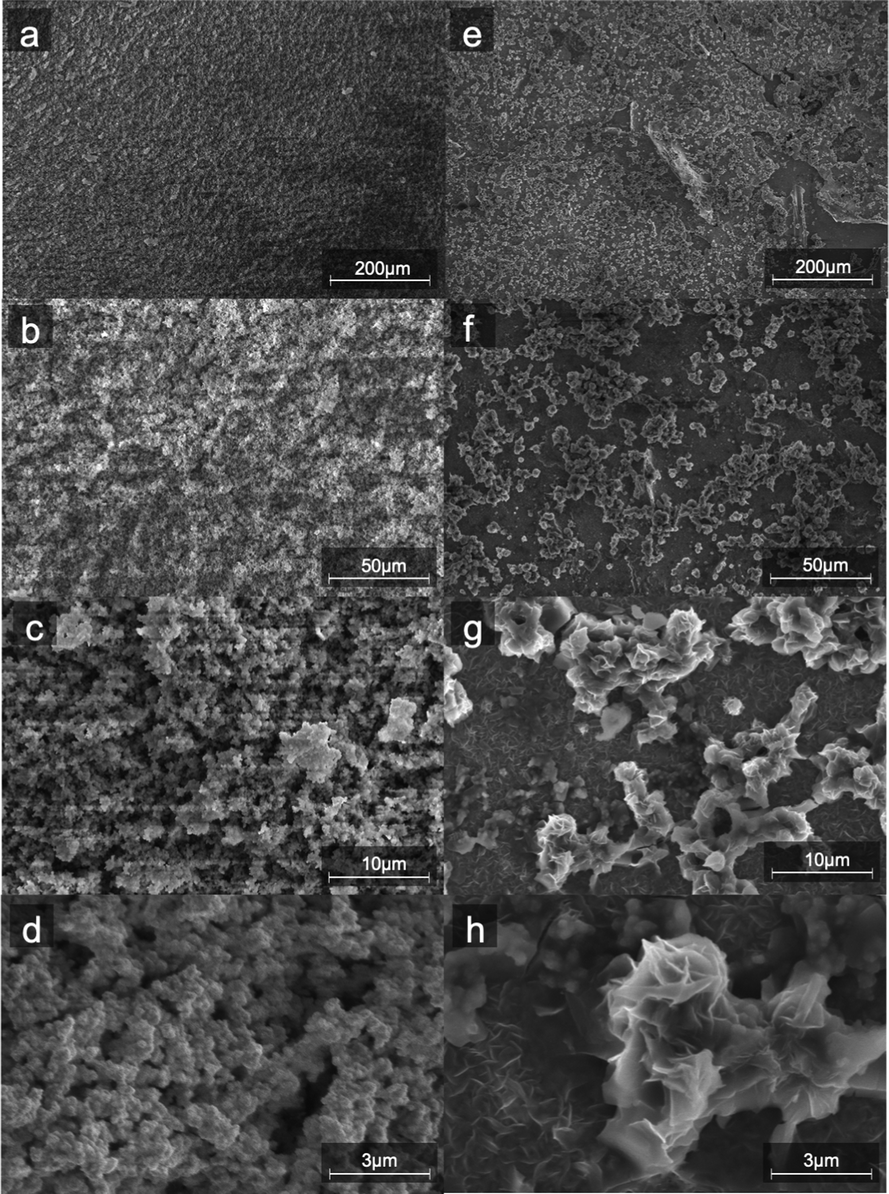
SEM images (Fig. 2) of the aqueous-based microwaved NiFe catalysts after deposition (Fig. 2a–d) show a network of particles ca. a few hundred nanometers in diameter. This morphology is assumed to have been created during the microwave process when the carbonate species decomposes and releases CO2. EDS measurements (ESI,† S3) show an even distribution of Ni and Fe throughout the catalyst. SEM images of the NiFeS (Fig. 2e–h) show a more fractal structure with sharp edges. EDS measurements of the NiFeS (ESI,† S3) also show an evenly distributed overlay of Ni, Fe, and S throughout. TEM images of the catalysts prior to deposition (ESI,† S1) further show that instead of individual particles, both the NiFe and NiFeS exist as an unstructured network. No crystalline structures were detected at a scale of 20 μm, and X-ray diffractograms of both catalysts showed no diffraction spots, thus indicating that both catalysts are more amorphous with a low degree of crystallinity.
 |
| | Fig. 2 SEM images of NiFe (a–d) and (e–h) NiFeS electro-deposited on FTO coated glass at four different magnifications. | |
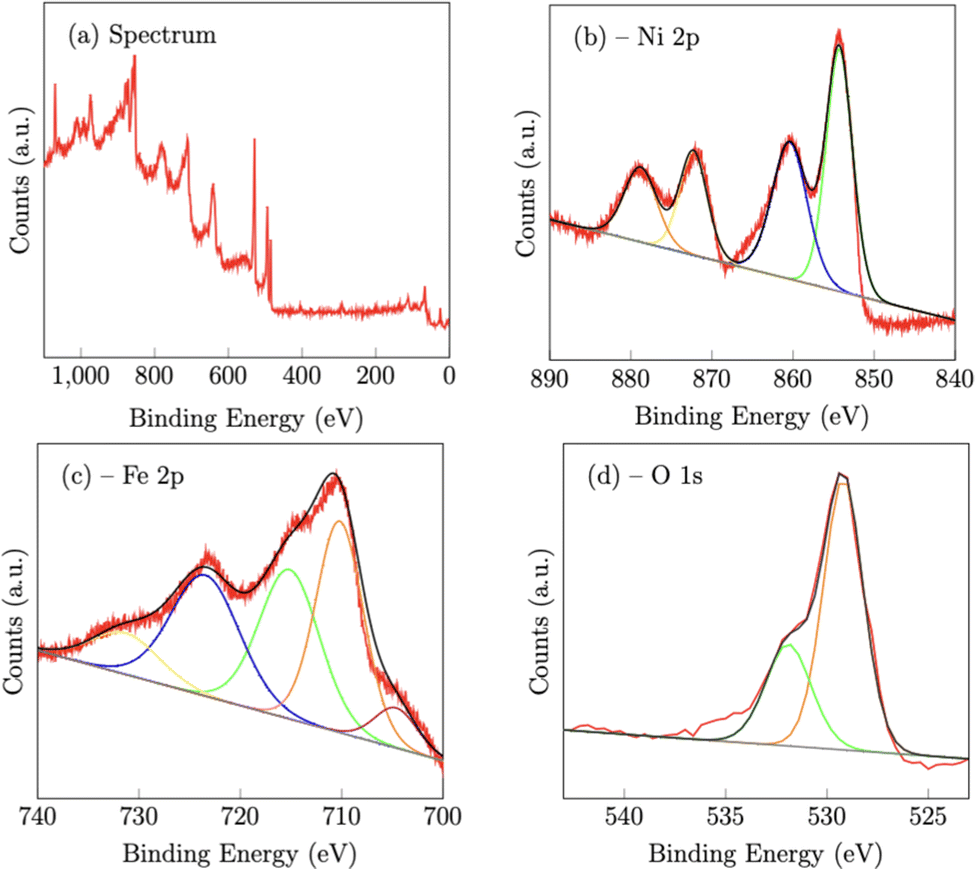
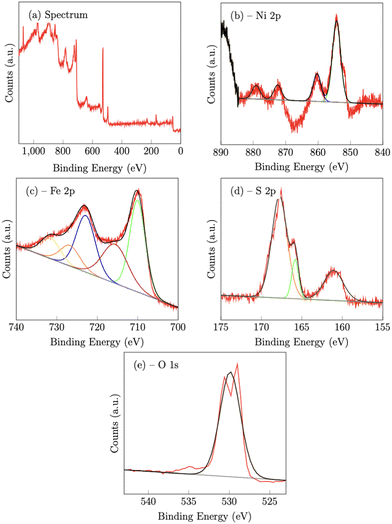
X-Ray photoelectron spectroscopy (XPS) confirmed the chemical composition of both the NiFe (Fig. 3) and NiFeS (Fig. 4) catalysts after deposition on the FTO support electrodes. On the NiFe sample, the Ni 2p spectrum consists of two spin–orbit doublets of Ni 2p3/2 at 854.3 eV and Ni 2p1/2 at 872.3 eV along with two satellites at 860.4 eV and 878.8 eV, which is consistent with nickel oxide and/or nickel hydroxides.42 The Fe 2p spectrum consists of five peaks. The peaks at 710.2 eV (2p3/2) and 723.5 eV (2p1/2) along with the two satellite peaks at 715.1 eV and 731.4 V are consistent with iron oxides with iron in the Fe3+ chemical state.42–44 The peak at 704.6 eV is more constant with metallic Fe that may partially form during the electrodeposition step.45 The O 1s peak at 529.2 eV is ascribed to metal–oxygen bonds, while the peak at 531.9 eV is consistent with weakly adsorbed water on the surface of the material.46
 |
| | Fig. 3 X-Ray photoelectron spectroscopy spectra of the NiFe catalyst deposited on a FTO support. | |
 |
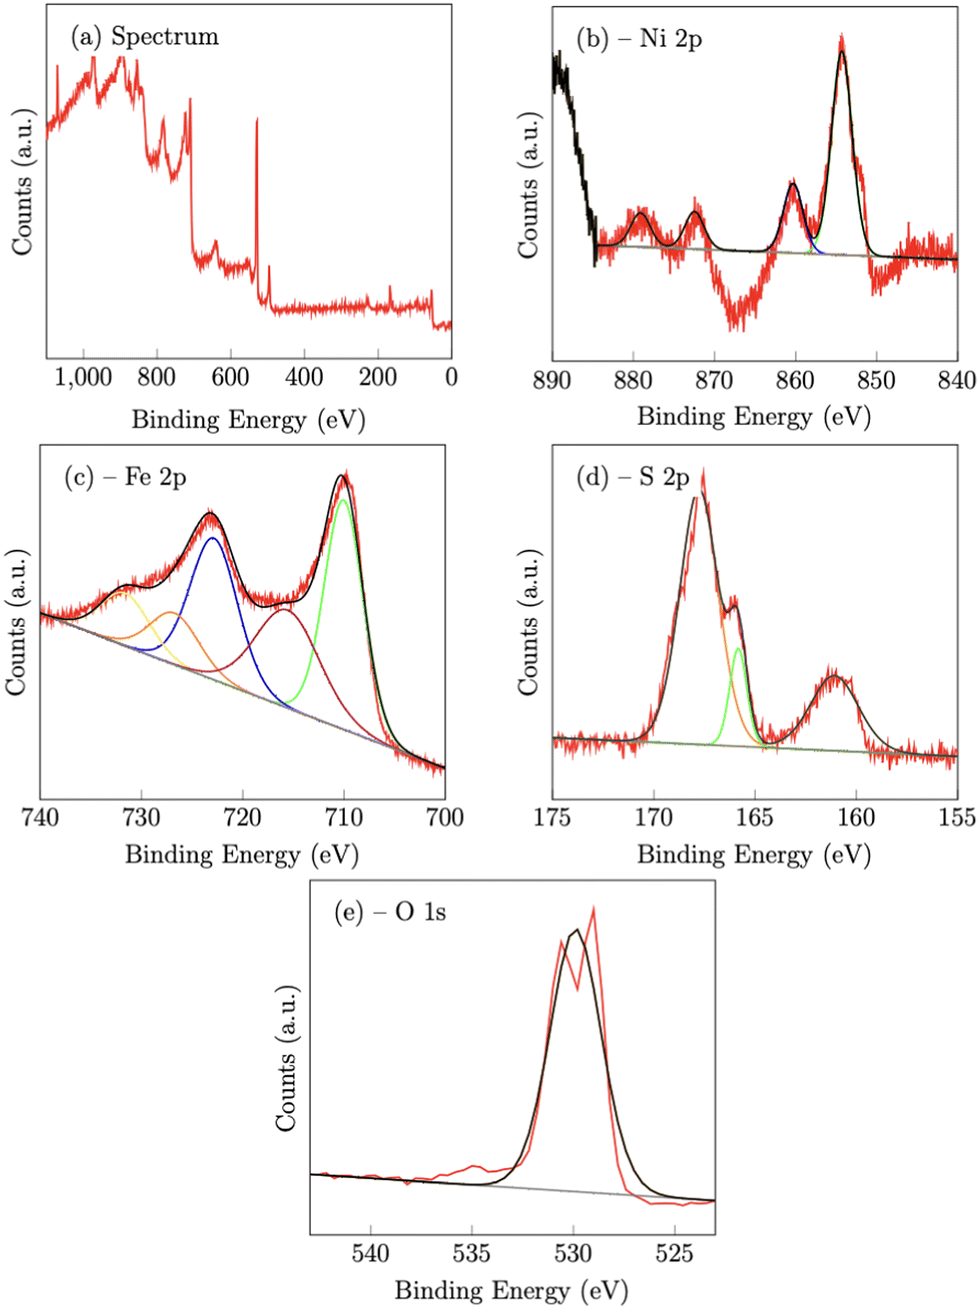
| | Fig. 4 X-Ray photoelectron spectroscopy spectra of NiFeS catalyst deposited on an FTO support. | |
On the NiFeS sample, the Ni 2p spectrum consists of 4 peaks at 854.3 eV (2p3/2) 860.3 eV (2p3/2,sat), 872.5 eV (2p1/2) and 881 eV (2p1/2,sat), which are again consistent with nickel oxides.47 The Fe 2p spectrum again consists of five peaks. The peaks at 710 eV (2p3/2) and 729.9 eV (2p1/2) along with the two satellite peaks at 715.6 eV and 731.6 eV are also consistent with iron oxides. However, the presence of an additional peak at 726.7 eV is strong evidence of the presence of Fe–S bonds.48
For the S 2p spectra, the S 2p3/2 peak at 161.1 eV, and the 2p1/2 peak at 165.8 eV, also suggest metal sulfur bonds.47,49 Meanwhile, the peak at 167.8 eV may indicate the presence of oxidized sulfur, such as sulfate and/or sulfite.47 The O 1s peak at 529.9 eV can be assigned to the lattice oxygen incorporated into the structure.50
Elemental analysis from the XPS data (see the ESI†) shows an equal ratio of Fe to Ni in the NiFe catalyst. However, the XPS shows a higher concentration of Fe compared to Ni in the as-deposited sample of the NiFeS, perhaps signaling a preference for Fe-based materials to be electrodeposited on the FTO sample. X-Ray diffraction (ESI,† Fig. S2) on the NiFeS catalyst prior to electrodeposition demonstrates the amorphous structure of these catalysts. No discernible nickel–iron sulfide peaks are visible, while some unreacted Na2SO3 and iron sulfates are still present.
Thus, the materials characterization studies strongly suggest that the NiFeS catalyst is an amorphous material prior to electrodeposition and it comprises Ni, Fe, S, and O. After electrodeposition, a fractal material is formed on the FTO electrode surface, and the Ni, Fe, S, and O elements are retained in the deposited catalyst. However, the crystal phases and exact chemical composition are difficult to determine precisely due to the amorphous nature of the material.
3.2 OER electrochemical performance characterization
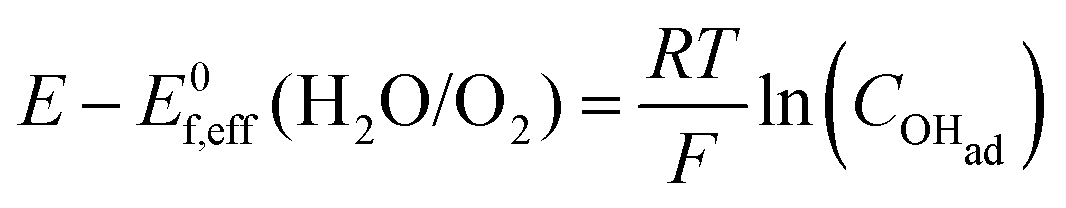
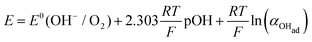
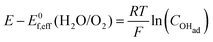
Cyclic voltammetry (Fig. 5) was used to compare the electrocatalytic performance for the OER of the NiFe and NiFeS catalysts with both samples deposited on a flat, inert FTO coated glass support electrode. The overpotential for the OER was calculated from the effective formal potential as shown in eqn (1) and (2). Reproducibility measurements from additional samples are shown in the ESI,† Fig. S4 and S5.| | | η = Emeasured − E0f,eff + Eref | (1) |
| | 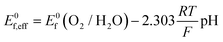 | (2) |
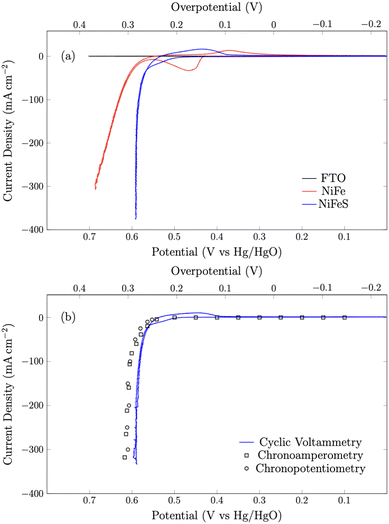 |
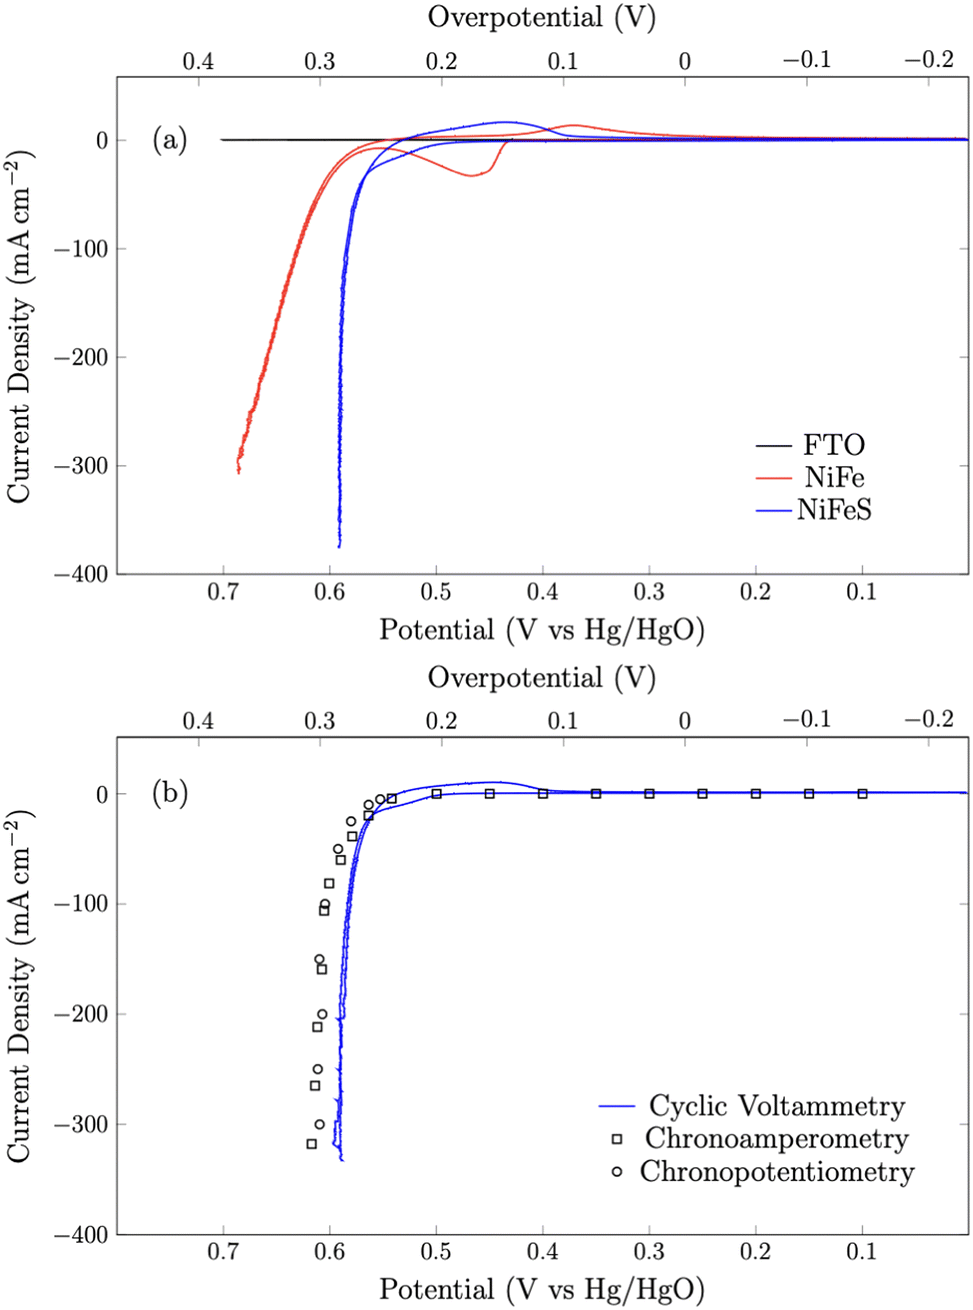
| | Fig. 5 (a) Cyclic voltammograms of NiFeO and NiFeS on the FTO support and blank FTO glass at a scan rate of 50 mV s−1. (b) Cyclic voltammetry data overlayed with 30-second chronoamperometry and chronopotentiometry benchmarking experiments. All experiments were performed in 3 M KOH and corrected for uncompensated resistance (RΩ). | |
First, the shape of the voltammograms for the NiFe and NiFeS catalysts are distinctly different. The NiFe catalyst shows the classic NiII/NiIII at ca. 0.45 V vs. Hg/HgO with the reverse NiIII/NiII reduction occurring at ca. 0.35 V vs. Hg/HgO on the reverse scan. Interestingly, on the NiFeS catalyst, a pre-catalytic wave is observed at more positive potentials (ca. 0.5 V vs. Hg/HgO), but this pre-catalytic wave appears to be more reversible with the reduction happening at ca. 0.45 V vs. Hg/HgO on the reverse scan. When no catalyst is present, no catalytic wave is observed on the FTO support electrode.
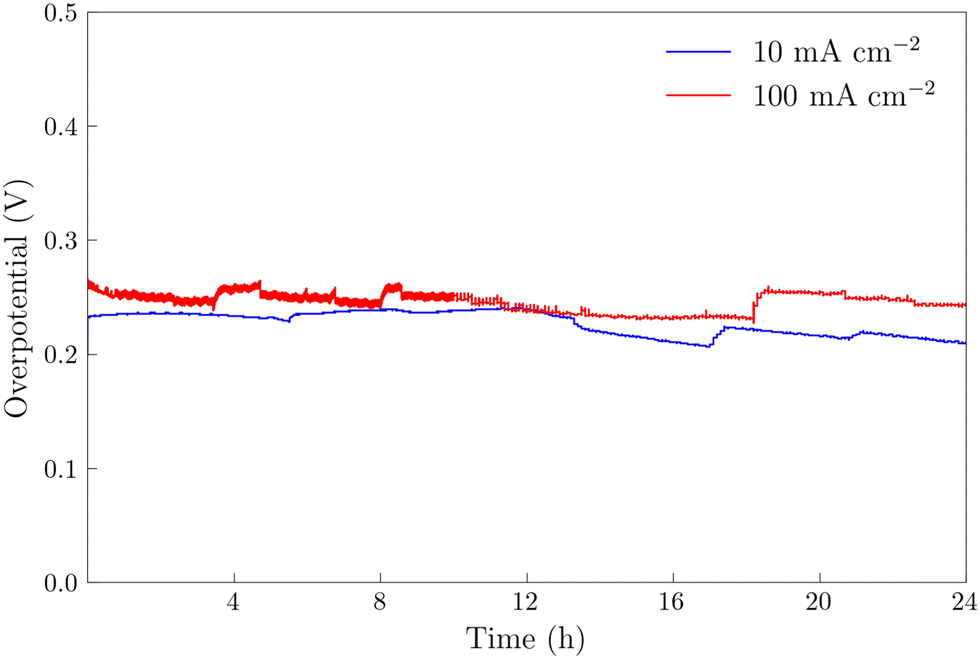
The NiFeS electrocatalyst demonstrated better OER performance than the NiFe catalyst with an overpotential of 265 mV at 10 mA cm−2 and 300 mV at 100 mA cm−2 compared to 285 and 340 for the NiFe catalyst at 10 and 100 mA cm−2 respectively. To benchmark the catalytic performance of the NiFeS electrocatalyst, the overpotential was measured under steady state conditions. The chrononoamperometry (squares on Fig. 5b) and chronopotentiometry (circles on Fig. 5b) measurements taken from 30 s experiments matched up to the cyclic voltammogram verifying the overpotential results. Twenty-four hour chronopotentiometry experiments at 10 and 100 mA cm−2 were performed on a NiFeS sample in order to assess the catalyst stability. Two different effects can be seen in Fig. 6. First, several sudden rises and falls in the overpotential were measured, attributed to bubble formation and release during the experiments performed at high current densities. Second, the overpotential decreased slightly throughout the 24 hour experiment, with the final overpotential measured of 248 mV and 282 mV at 10 mA cm−2 and 100 mA cm−2, respectively. The decrease in the overpotential overtime may be attributed to surface restructuring during the OER.51
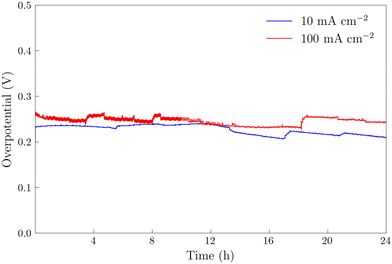 |
| | Fig. 6 Chronopotentiometry experiments on NiFeS electrodeposited FTO at current densities of 100 mA cm−2 and 10 mA cm−2 for 24 hours. All experiments were performed in 3 M KOH and corrected for uncompensated resistance (RΩ). | |
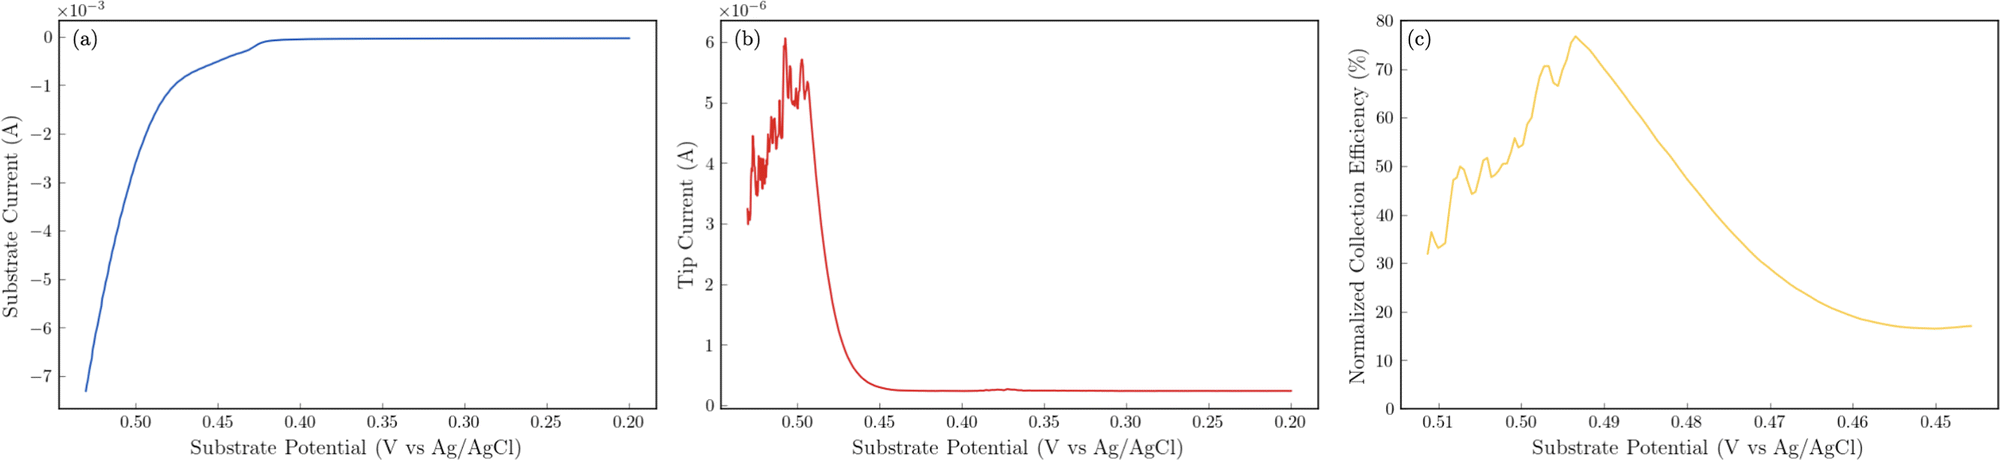
The 24 hour stability measurements shown in Fig. 6 provide strong evidence that the catalyst is stable and is capable of evolving oxygen. If oxidation of the catalyst (include the incorporated sulfur) was a major contributor, we would expect to see a decrease in the performance of the catalyst over the 24 stability experiments. However, to provide additional semi-quantitative evidence that the catalytic wave shown in the voltammetry experiments corresponds to the evolution of oxygen, we performed substrate-generation/tip collection scanning electrochemical microscopy (SG/TC SECM). In this experiment, a 200 μm Pt tip electrode is placed in close proximity to the catalytic NiFeS electrode, and the potential of the NiFeS substrate is swept positively to evolve oxygen while the Pt tip electrode is held very negative to collect and reduce any oxygen that is generated which diffuses off the substrate. Fig. 7a shows the NiFeS substrate current vs substrate potential. Just as in the cyclic voltammetry experiments shown in Fig. 5 a precatalytic wave is shown at ca. 0.4 V vs. Ag/AgCl with the catalytic wave at ca. 0.45 V vs. Ag/AgCl. By measuring the reducing current on the Pt tip electrode as a function of the substrate potential (Fig. 7b), we see reduction occurring at the same potentials where the catalytic wave begins (ca. 0.45 V vs. Ag/AgCl). This is very strong evidence for oxygen being generated at the NiFeS substrate at these potentials and collecting on the Pt tip electrode. Furthermore, at potentials more positive than ca. 0.5 V vs. Ag/AgCl, we see abrupt changes in the tip current most likely caused by oxygen bubble formation and blockage of the tip electrode. Because the SECM tip electrode (ca. 200 μm) is significantly smaller than the substrate electrode (ca. 3 mm) the magnitudes of the currents are different. However, to provide a semi-quantitative measure of the amount of oxygen collected, it is possible to normalize the collection efficiency to that that of an outer-sphere redox mediator at the same tip/substrate distance (see the ESI,† Fig. S7 for details). Fig. 7c shows that the normalized collection efficiency of oxygen prior to bubble formation is ca. 80% again providing strong evidence that the observed catalytic wave is oxygen evolution.
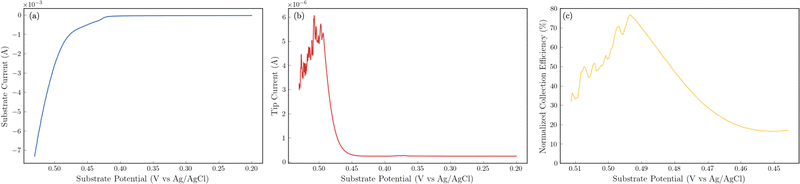 |
| | Fig. 7 Substrate generation/tip collection SECM results to detect oxygen evolving from the NiFeS catalyst. Substrate electrode: ca. 3 mm NiFeS deposited on FTO. Tip electrode: 200 μm Pt disc held at a constant potential of −0.6 V vs. Ag/AgCl to collect and reduce O2. Electrolyte: 3 M KOH. Scan rate: 5 mV s−1. All substrate potentials were corrected for uncompensated resistance (RΩ). (a) Substrate current as a function of substrate potential. (b) Tip current as a function of substrate potential. (c) Normalized collection efficiency as a function of substrate potential. | |
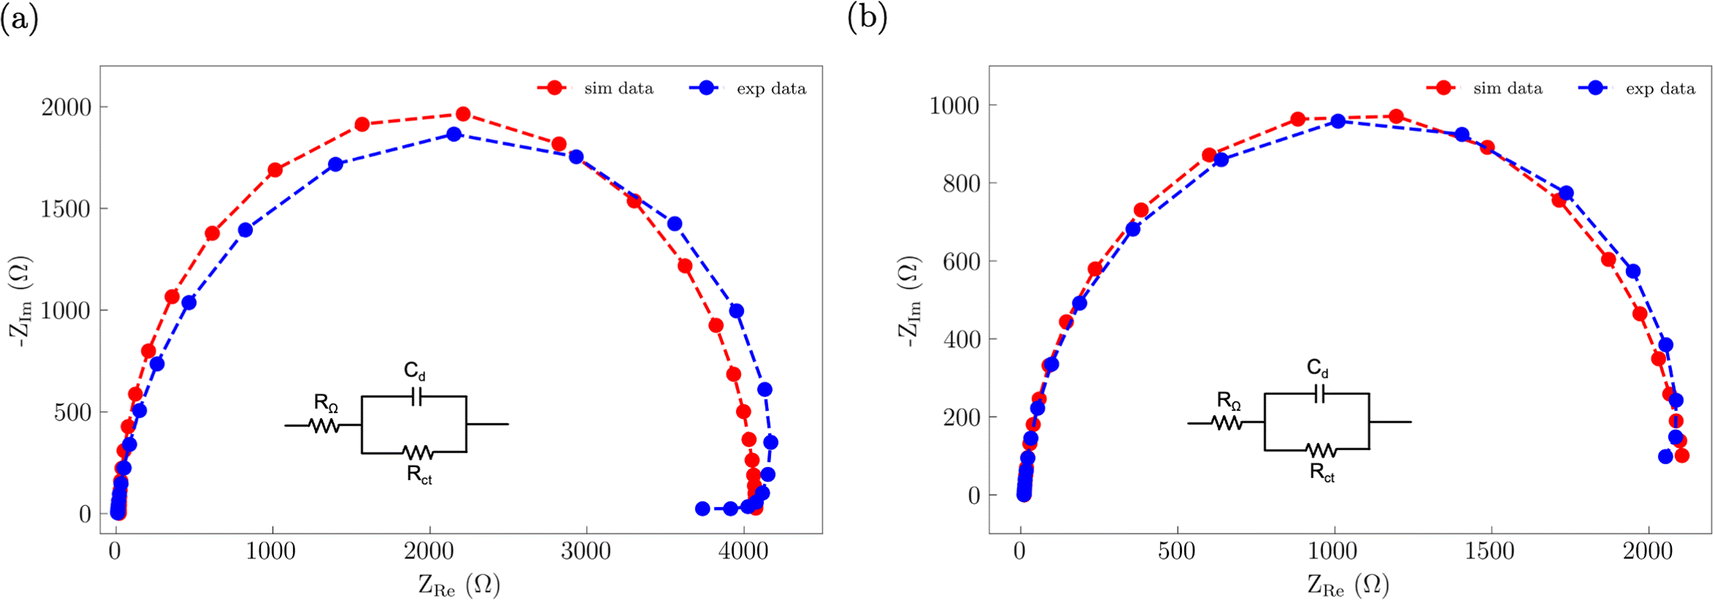
Electrochemical impedance spectroscopy (EIS) was used to assess how S incorporation into the NiFe catalyst changes the electronic properties (Fig. 8). The EIS data for both the NiFe and NiFeS catalysts were fitted to a R–RC equivalent circuit. Both samples had similar Rs values of ca. 9 Ω which is attributed to the uncompensated solution resistance. Both samples showed a larger midfrequency arc in the Nyquist plots is indicative of increased recombination resistance at the surface of the electrode/electrolyte interface.52 We observed that the NiFe sample had a slightly higher charge transfer resistance Rct of ca. 4000 Ω compared to a Rct of ca. 2100 Ω for the NiFeS. This lower charge transfer resistance suggests that there may be some improvement in the electronic properties of the catalyst with S incorporation.
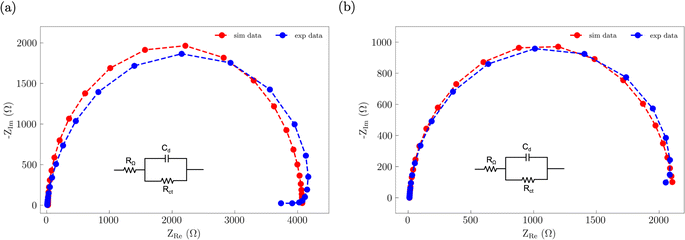 |
| | Fig. 8 Nyquist plots of the EIS data along with the corresponding best fit R–RC equivalent circuit for (a) NiFe and (b) NiFeS. | |
3.3 Surface-interrogation SECM and Tafel slope analysis
A surprising result of the NiFeS catalysts is the small change in the overpotential for the OER when the current density increases from 10 mA cm−2 to 100 mA cm−2. Thus, to probe what is happening on the surface, we performed Surface-interrogation scanning electrochemical microscopy (SI-SECM) as shown in Fig. 9. SI-SECM can give information about the potential-dependent active site coverage of adsorbed intermediates on a catalyst surface. This is done utilizing a redox-mediator in solution, in this case Fe(III)–TEA, which can be reduced on the SECM tip electrode (eqn (3)). The reduced Fe(II)-TEA can then react with surface-adsorbed oxygenated species on the catalyst surface (eqn (4)). This regeneration of the Fe(III)–TEA causes an increase in the mass-transfer (and thus an increase in the measured tip current) only when M–OH, or any adsorbed oxygenated species, sites are present. Finite element analysis simulations can then reveal the potential dependent surface coverage of intermediates.| | | Fe(III)–TEA + e− → Fe(II)–TEA | (3) |
| | | Fe(II)–TEA + M–OH → Fe(III)–TEA + M + OH− | (4) |
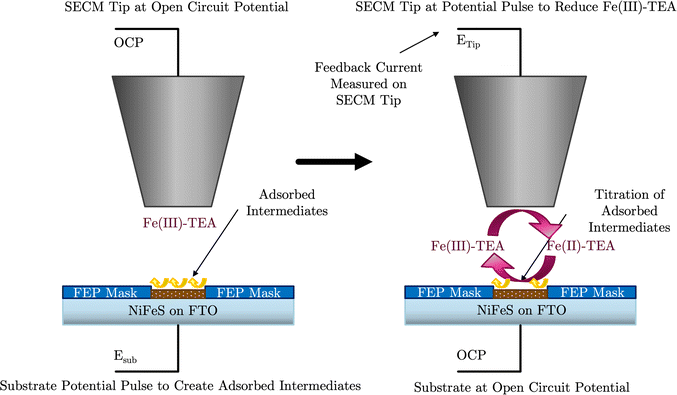 |
| | Fig. 9 SI-SECM schematic showing a potential pulse applied to the catalytic substrate for the creation of active sites (left). Then a potential pulse is applied to the SECM tip to generate redox active titrant (Fe(II)-TEA) which titrates the active sites on the substrate with the substrate under open-circuit conditions. | |
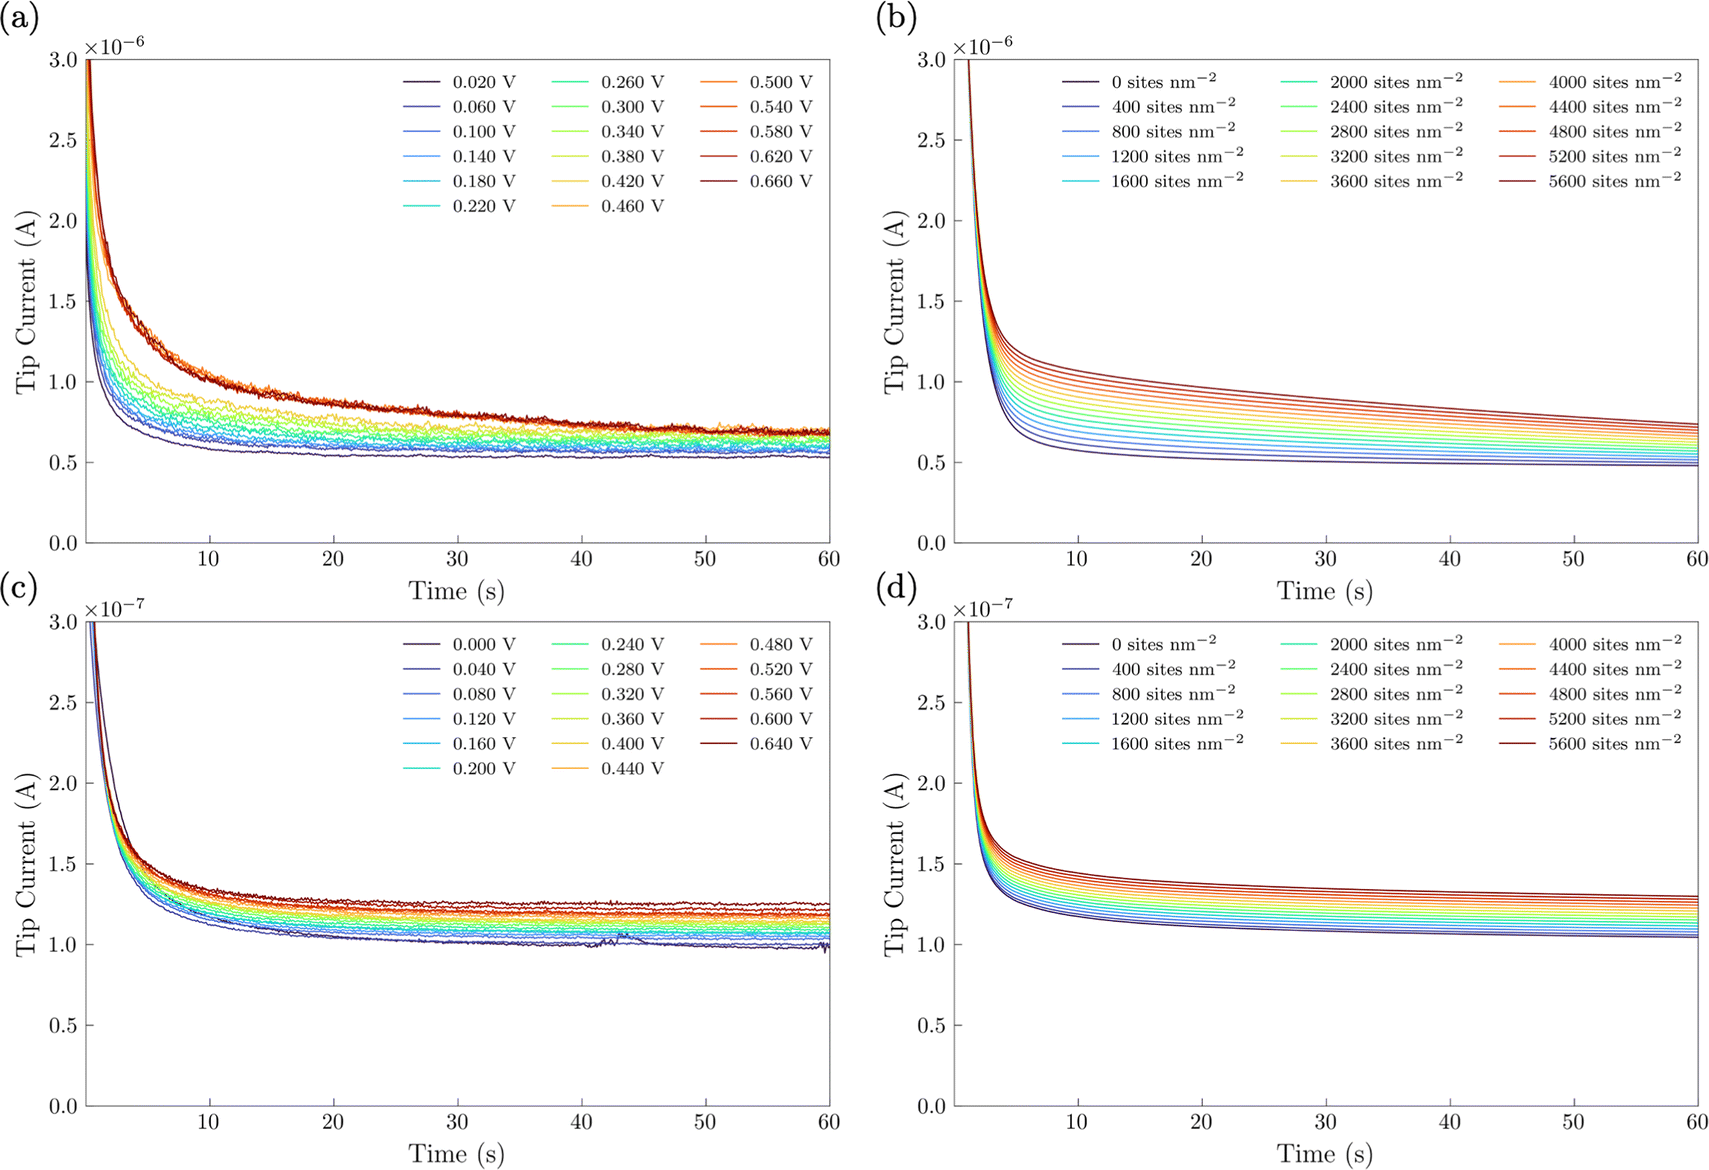
In the SI-SECM experiment, it is important to have the substrate electrode and the tip electrode be approximately the same size to avoid open-circuit positive feedback. Thus, we incorporated a masking technique as we previously reported.25 A mapping technique was first used to find the hole in the FEP film containing the catalyst (ESI,† Fig. S6). The SECM tip electrode was then positioned to a height of ca. 14 μm above the substrate. Once the tip electrode is in position, various potential pulses of 20 s durations were applied to the NiFe or NiFeS substrate electrode, Esub, ranging from 0 to 0.66 V vs. Ag/AgCl. These potential pulses were used to generate surface-active species. After the potential pulse, the substrate electrode was automatically switched to open-circuit and a potential of −1.1 V vs. Ag/AgCl was applied to the tip electrode. The experimental tip current was then measured as a function of time and shown in Fig. 10a for the NiFe catalyst and Fig. 10c for the NiFeS catalyst.
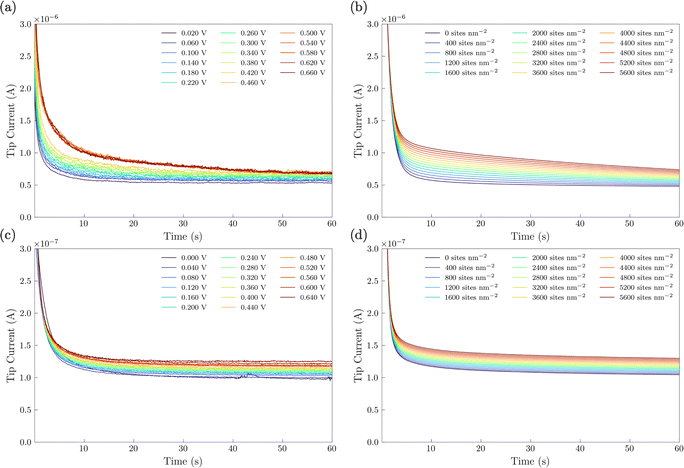 |
| | Fig. 10 Surface interrogation chronoamperograms performed in 3 M KOH with ca. 50 mM Fe(III)–TEA. (a and c) Experimental chronoamperograms and (b and d) COMSOL simulated chronoamperograms showing positive feedback at elevated potentials of NiFe and NiFeS catalysts. | |
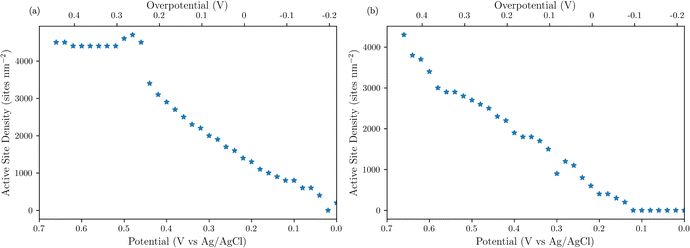
To obtain the active site densities as a function of applied potential, the SECM tip currents were simulated with different active sites densities using COMSOL Multiphysics finite element analysis simulations. Active site density calculations from SI-SECM are critical for NiFe-based catalysts due to the non-conducting behavior of Ni(OH)2 in the potential window less positive than the OER.25 The COMSOL simulations for the NiFe and NiFeS catalyst are shown in Fig. 10b and d, respectively. The simulations show that as the density of surface intermediates increases, higher levels of positive feedback is predicted on the tip, as we measured experimentally. A least-squares fit between the experimental and simulated data was performed in order to determine the active site density as a function of potential. As shown in Fig. 10 a good correlation between the experimental and simulated SI-SECM data was obtained for both the NiFe and NiFeS catalysts. Based on our previous work,25 the COMSOL simulations are very sensitive to both ksr and the active site density, and we estimate the error in the site density from the least squares fit to be less than 10%. Fig. 11 shows the dependence of active site density on the substrate potential for both the NiFe and NiFeS catalysts. Both samples showed high active site densities of greater than 4000 sites nm−2, which is consistent with the permeable and porous amorphous NiFe catalyst that we have previously reported.20,25 However, there is one key difference between the NiFe and NiFeS catalysts. At the potential where the NiFe catalyst reaches 100 mA cm−2 (ca. 300 mV overpotential) the surface is fully saturated with adsorbed intermediates. However, on the NiFeS catalyst, the surface is not fully saturated with adsorbed intermediates at the potential when the catalyst reaches 100 mA cm−2 (ca. 250 mV overpotential). This implies that there are vacant free sites available when the catalyst is operating at 100 mA cm−2.
 |
| | Fig. 11 SI-SECM measurements of active site density as a function of catalyst potential for (a) NiFe and (b) NiFeS. | |
An additional piece of information that the finite elemental analysis simulations can reveal is the kinetics the reaction of the activated redox mediator (in this case Fe(II)-TEA) with the adsorbed intermediate (ksr). The kinetics of the surface reaction can be semi-qualitatively determined by the shape of the tip current profiles. The finite element analysis simulations can quantify the surface reaction kinetics. Comparing the ksr of the two catalysts showed that the ksr = 5 × 10⁻⁵ m3 mol−1 s−1 for the NiFeS and was ksr = 2 × 10⁻⁴ m3 mol−1 s−1 for the NiFe. The difference in the kinetics of the surface reaction may imply that the adsorption strength of the intermediates is different between the NiFe and the NiFeS catalyst.
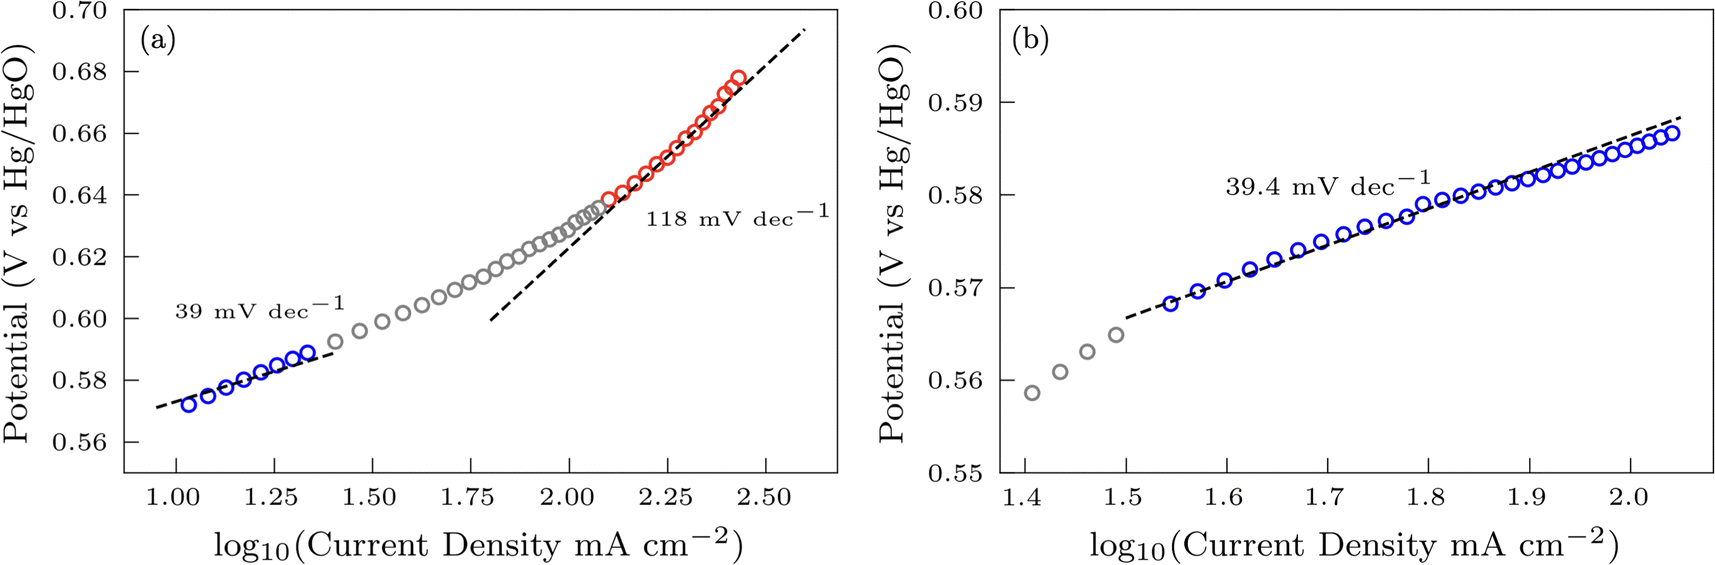
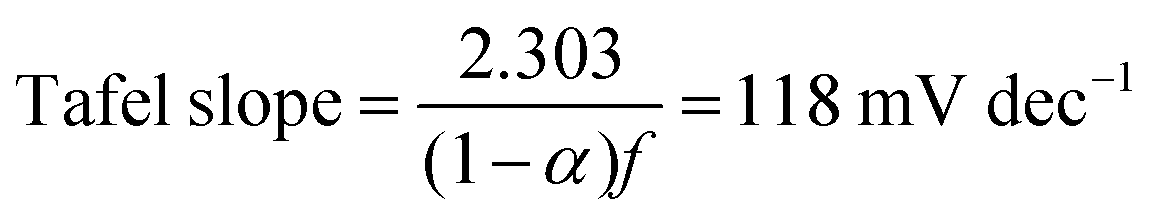
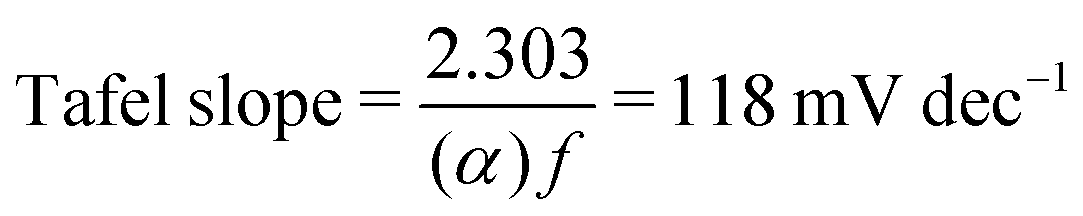
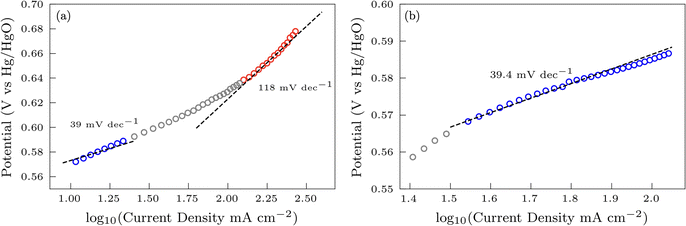
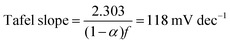
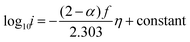
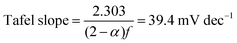
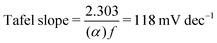
Additional insights into the rate-determining steps can be determined by combining Tafel slope analysis with the SI-SECM data.53 As is typically seen with the HER, the Tafel slope will vary depending on which step in the mechanism is rate-determining. Fig. 12 shows the Tafel slopes taken from the cyclic voltammetry data for the NiFeS and NiFe catalysts. The NiFeS catalyst showed a single Tafel slope of ca. 39 mV dec−1, where the NiFe catalyst showed a Tafel slope transition from ca. 39 mV dec−1 at low overpotentials to 118 mV dec−1 at higher overpotentials.
 |
| | Fig. 12 Tafel slope determination for the NiFe (a) and NiFeS (b) catalyst. | |
While there is no definitive mechanism for the OER, a commonly accepted simplified mechanism in alkaline media is shown in eqn (5a)–(5d).54
| | | M–OH + OH− ↔ M–O + H2O + e− | (5b) |
| | | M–O + OH− ↔ M–OOH + e− | (5c) |
| | | M–OOH + OH− ↔ M + O2 + H2O + e− | (5d) |
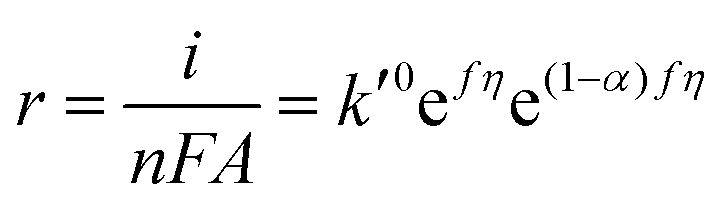
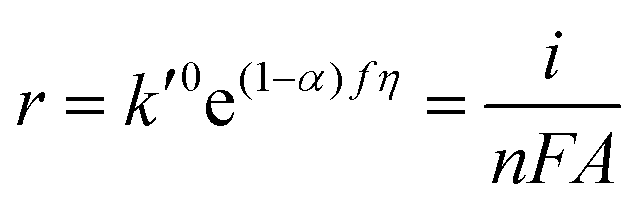
The Tafel slope of the OER will change depending on the rate-determining step. For example, if the initial adsorption step is rate-determining, then the rate of the OER is governed by the forward rate of eqn (5):
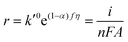
| | | r = kCOH−CM = k0COH−CMe(1−α)fη | (6) |
where
α is the transfer coefficient,
f =
F/
RT, and
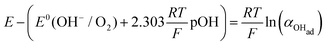
η is the overpotential defined as
E −
E0f,eff. In alkaline media, the concentration of OH
− is sufficiently high such that its concentration at the electrode surface will not change significantly during oxygen evolution. In addition, if the initial adsorption step is rate-determining, the surface concentration of free sites,
CM, would be constant because the surface coverage will always be close to zero. Thus, the rate of reaction becomes
where
k′
0 is the pseudo-zero-order rate constant. It should be noted, however, that even though the rate is pseudo-zero-order in OH
−, the rate still increases as the potential becomes more positive due to the potential dependence of the rate constant. Writing the rate in terms of measured current results in
| | 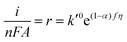 | (8) |
Re-writing eqn (8) in terms of Tafel slopes results in
| |  | (9) |
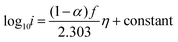
The Tafel slope can then be written as
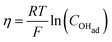
| |  | (10) |
with
α = 0.5. Thus, if the first initial step is rate-determining, one would expect the Tafel slope to always be 118 mV dec
−1, and the surface coverage is always near zero. Since we observed a surface coverage as a function of potential for both the NiFe and NiFeS samples, and neither had a constant Tafel slope of 118 mV dec
−1 is evidence for the initial adsorption step not being rate-determining for either material.
If any of the steps (5b)–(5d) are rate-determining, the overall rate would be governed by
| | | r = k0COHadCOH−e(1−α)fη | (11) |
where
COHad represents any of the adsorbed oxygenated species (M–OH, M–O, or M–OOH).
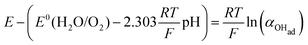
Again, under highly alkaline conditions, the concentration of OH− is relatively constant at the electrode surface, resulting in the overall reaction rate equation becoming
| | | r = k′′0COHade(1−α)fη | (12) |
where
k′′
0 is the effective pseudo-first-order rate constant.
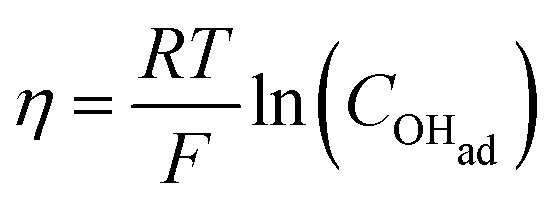
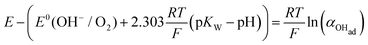
There are two cases that describe the potential dependent OH− adsorption. First, under low OHad coverage, the first adsorption step is in pre-equilibrium, and thus the Nernst equation applies:
| | 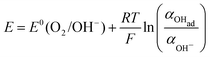 | (13) |
with the activity of water taken as 1.
Using eqn (13) to determine COHad yields
| |  | (14a) |
| |  | (14b) |
| |  | (14c) |
| |  | (14d) |
| |  | (14e) |
| |  | (14f) |
Substituting COHad from eqn (14g) into eqn (12) gives
| |  | (15) |
Re-writing eqn (15) in terms of Tafel slopes results in
| |  | (16) |
The Tafel slope can then be written as
| |  | (17) |
for the case in which the reaction of the OH
− with an adsorbed species is rate-determining and there are available vacant sites in pre-equilibrium, such as in the first step.
Now, if any of the steps (5b)–(5d) is rate-determining but is sufficiently slow such that nearly all surface sites are occupied by OHad, then COHad is no longer a function of potential and is now constant. Eqn (12) can now be written as
| |  | (18) |
where
k′
0 is the effective pseudo-zero order rate constant.
Re-writing eqn (18) in Tafel form results in
| |  | (19) |
Combining the Tafel slope analysis with the SI-SECM data, we can see that there are surface-adsorbed intermediates at the potentials where the OER is occurring on the NiFeS catalyst. Still, they do not fully saturate the surface. In addition, the Tafel slope is ca. 39 mV dec−1 over the entire potential range. This implies that the kinetics of the intermediate steps may be fast enough that vacant free sites are continually available under OER conditions. However, on the NiFe catalyst, the surface is fully saturated with adsorbed intermediates under OER potentials. The Tafel slope changes from ca. 39 mV dec−1 at low surface coverage to 118 mV dec−1 under high surface coverage. This implies that vacant sites are unavailable during the OER, which may be why the overpotentials at higher current densities are increased.
4 Conclusions
In this work, we demonstrate a one-step synthesis technique for incorporating sulfur into NiFe-based OER electrocatalysts. This was based on a simple titration technique of nickel and iron sulfates with sodium sulfite. Materials characterization confirms the presence of Ni, Fe, S, and O, but the exact chemical structure was difficult to determine precisely due to the amorphous nature of the material. Electrochemical characterization showed that the S-incorporation reduced the overpotential for the OER compared to a plain NiFe catalyst, with additional gains at higher current densities. In fact, the NiFeS catalyst only had a ca. 39 mV increase in the overpotential between operating at 10 mA cm−2versus 100 mA cm−2 on a flat support electrode. The ability of this catalyst to operate at low overpotentials at high current densities was analyzed using SI-SECM and Tafel slope analysis. Here we showed that the surface of the NiFeS catalyst was not fully saturated at OER potentials and was able to maintain a constant Tafel slope of 39 mV dec−1 indicative of the first adsorption step in a pre-equilibrium with available vacant catalytic sites. In contrast, the NiFe catalysts showed that the surface became fully saturated with intermediates at OER potentials, confirmed by the Tafel slope transitioning from 39 mV dec−1 at low surface coverage to 118 mV dec−1 at high surface coverage. We attribute the ability of these NiFeS catalysts to operate at high current densities to the availability of vacant sites throughout the OER potential window.
Author contributions
K. C. L. was the principal investigator of the project and oversaw all aspects. J. W. was the experimental lead and performed the catalyst synthesis and characterization experiments and performed data analysis. J. M. B. and K. C. L. assisted with data analysis and experimental planning. All authors contributed to the writing of the manuscript.
Conflicts of interest
J. M. B. and K. C. L. are minority shareholders of a start-up company Avium, LLC, which is commercializing water-splitting technology based on catalysts similar to the ones reported here. However, this did not impact the results reported herein.
Acknowledgements
SEM images and XPS spectra were obtained with help from Dr Prem Thapa. We acknowledge support from the NSF Small Business Innovative Research SBIR Program (award number SBIR-1951216) and the NSF Research and Traineeship (NRT) Program (award number DGE-1922649).
Notes and references
- Y. Wang, J. Kowal, M. Leuthold and D. U. Sauer, Energy Procedia, 2012, 29, 657–667 CrossRef.
- C. Zhang, Y. L. Wei, P. F. Cao and M. C. Lin, Renewable Sustainable Energy Rev., 2018, 82, 3091–3106 CrossRef CAS.
- G. Kyriakarakos, A. I. Dounis, S. Rozakis, K. G. Arvanitis and G. Papadakis, Appl. Energy, 2011, 88, 4517–4526 CrossRef CAS.
- G. D. Berry, A. D. Pasternak, G. D. Rambach, J. R. Smith and R. N. Schocks, Energy, 1996, 2, 289–303 CrossRef.
- J. M. Ogden, Int. J. Hydrogen Energy, 1999, 24, 709–730 CrossRef CAS.
- E. Zoulias, E. Varkaraki, N. Lymberopoulos, C. N. Christodoulou and G. N. Karagiorgis, TCJST, 2004, 4, 41–71 Search PubMed.
- J. Chi and H. Yu, Chin. J. Catal., 2018, 39, 390–394 CrossRef CAS.
- J. Turner, G. Sverdrup, M. K. Mann, P. C. Maness, B. Kroposki, M. Ghirardi, R. J. Evans and D. Blake, Int. J. Energy Res., 2008, 32, 379–407 CrossRef CAS.
- T. R. Cook, D. K. Dogutan, S. Y. Reece, Y. Surendranath, T. S. Teets and D. G. Nocera, Chem. Rev., 2010, 110, 6474–6502 CrossRef CAS.
- B. Weng, F. Xu, C. Wang, W. Meng, C. R. Grice and Y. Yan, Energy Environ. Sci., 2017, 10, 121–128 RSC.
- S. Marini, P. Salvi, P. Nelli, R. Pesenti, M. Villa, M. Berrettoni, G. Zangari and Y. Kiros, Electrochim. Acta, 2012, 82, 384–391 CrossRef CAS.
- S. Klaus, Y. Cai, M. W. Louie, L. Trotochaud and A. T. Bell, J. Phys. Chem. C, 2015, 119, 7243–7254 CrossRef CAS.
- F. Bao, E. Kemppainen, I. Dorbandt, F. Xi, R. Bors, N. Maticiuc, R. Wenisch, R. Bagacki, C. Schary, U. Michalczik, P. Bogdanoff, I. Lauermann, R. V. D. Krol, R. Schlatmann and S. Calnan, ACS Catal., 2021, 11, 10537–10552 CrossRef CAS.
- R. Xiang, C. Tong, Y. Wang, L. Peng, Y. Nie, L. Li, X. Huang and Z. Wei, Chin. J. Catal., 2018, 39, 1736–1745 CrossRef CAS.
- C. C. McCrory, S. Jung, I. M. Ferrer, S. M. Chatman, J. C. Peters and T. F. Jaramillo, J. Am. Chem. Soc., 2015, 137, 4347–4357 CrossRef CAS.
- J. R. Swierk, S. Klaus, L. Trotochaud, A. T. Bell and T. D. Tilley, J. Phys. Chem. C, 2015, 119, 19022–19029 CrossRef CAS.
- H. Park, I. J. Park, M. G. Lee, K. C. Kwon, S. P. Hong, D. H. Kim, S. A. Lee, T. H. Lee, C. Kim, C. W. Moon, D. Y. Son, G. H. Jung, H. S. Yang, J. R. Lee, J. Lee, N. G. Park, S. Y. Kim, J. Y. Kim and H. W. Jang, ACS Appl. Mater. Interfaces, 2019, 11, 33835–33843 CrossRef CAS PubMed.
- Y. F. Li and A. Selloni, ACS Catal., 2014, 4, 1148–1153 CrossRef CAS.
- M. Görlin, P. Chernev, J. F. D. Araújo, T. Reier, S. Dresp, B. Paul, R. Krähnert, H. Dau and P. Strasser, J. Am. Chem. Soc., 2016, 138, 5603–5614 CrossRef PubMed.
- J. M. Barforoush, D. T. Jantz, T. E. Seuferling, K. R. Song, L. C. Cummings and K. C. Leonard, J. Mater. Chem. A, 2017, 5, 11661–11670 RSC.
- T. E. Seuferling, T. R. Larson, J. M. Barforoush and K. C. Leonard, ACS Sustainable Chem. Eng., 2021, 9, 16678–16686 CrossRef CAS.
- J. Landon, E. Demeter, N. Inoǧlu, C. Keturakis, I. E. Wachs, R. Vasić, A. I. Frenkel and J. R. Kitchin, ACS Catal., 2012, 2, 1793–1801 CrossRef CAS.
- Z. Liu, B. Tang, X. Gu, H. Liu and L. Feng, Chem. Eng. J., 2020, 395, 125170 CrossRef CAS.
- H. Chen, J. Yan, H. Wu, Y. Zhang and S. Liu, J. Power Sources, 2016, 324, 499–508 CrossRef CAS.
- J. M. Barforoush, T. E. Seuferling, D. T. Jantz, K. R. Song and K. C. Leonard, ACS Appl. Energy Mater., 2018, 1, 1415–1423 CrossRef CAS.
- L. Yang, L. Chen, D. Yang, X. Yu, H. Xue and L. Feng, J. Power Sources, 2018, 392, 23–32 CrossRef CAS.
- M. Gong, Y. Li, H. Wang, Y. Liang, J. Z. Wu, J. Zhou, J. Wang, T. Regier, F. Wei and H. Dai, J. Am. Chem. Soc., 2013, 135, 8452–8455 CrossRef CAS.
- G. Marcelin, N. J. Stockhausen, J. F. M. Post and A. Schütz, J. Phys. Chem., 1989, 93, 4646–4650 CrossRef CAS.
- D. Tang, J. Liu, X. Wu, R. Liu, X. Han, Y. Han, H. Huang, Y. Liu and Z. Kang, ACS Appl. Mater. Interfaces, 2014, 6, 7918–7925 CrossRef CAS.
- Z. Lu, W. Xu, W. Zhu, Q. Yang, X. Lei, J. Liu, Y. Li, X. Sun and X. Duan, Chem. Commun., 2014, 50, 6479–6482 RSC.
- R. A. Marquez-Montes, K. Kawashima, Y. J. Son, J. A. Weeks, H. H. Sun, H. Celio, V. H. Ramos-Sánchez and C. B. Mullins, J. Mater. Chem. A, 2021, 9, 7736–7749 RSC.
- S. Anantharaj, S. R. Ede, K. Sakthikumar, K. Karthick, S. Mishra and S. Kundu, ACS Catal., 2016, 6, 8069–8097 CrossRef CAS.
- O. Mabayoje, A. Shoola, B. R. Wygant and C. B. Mullins, ACS Energy Lett., 2016, 1, 195–201 CrossRef CAS.
- D. Xu, M. B. Stevens, M. R. Cosby, S. Z. Oener, A. M. Smith, L. J. Enman, K. E. Ayers, C. B. Capuano, J. N. Renner, N. Danilovic, Y. Li, H. Wang, Q. Zhang and S. W. Boettcher, ACS Catal., 2019, 9, 7–15 CrossRef CAS.
- S. Chandrasekaran, L. Yao, L. Deng, C. Bowen, Y. Zhang, S. Chen, Z. Lin, F. Peng and P. Zhang, Chem. Soc. Rev., 2019, 48, 4178–4280 RSC.
- J. H. Kim, D. H. Youn, K. Kawashima, J. Lin, H. Lim and C. B. Mullins, Appl. Catal., B, 2018, 225, 1–7 CrossRef CAS.
- L. Peng, J. Wang, Y. Nie, K. Xiong, Y. Wang, L. Zhang, K. Chen, W. Ding, L. Li and Z. Wei, ACS Catal., 2017, 7, 8184–8191 CrossRef CAS.
- R. Guo, Y. He, T. Yu, P. Cheng, J. You, H. Lin, C.-T. Chen, T. Chan, X. Liu and Z. Hu, Chem. Eng. J., 2021, 420, 127587 CrossRef CAS.
- Y.-N. Zhou, W.-L. Yu, Y.-N. Cao, J. Zhao, B. Dong, Y. Ma, F.-L. Wang, R.-Y. Fan, Y.-L. Zhou and Y.-M. Chai, Appl. Catal., B, 2021, 292, 120150 CrossRef CAS.
- S. Li, J. Liu, S. Duan, T. Wang and Q. Li, Chin. J. Catal., 2020, 41, 847–852 CrossRef CAS.
- J. M. Barforoush, T. D. McDonald, T. A. Desai, D. Widrig, C. Bayer, M. K. Brown, L. C. Cummings and K. C. Leonard, Electrochim. Acta, 2016, 190, 713–719 CrossRef CAS.
- C. Liang, P. Zou, A. Nairan, Y. Zhang, J. Liu, K. Liu, S. Hu, F. Kang, H. J. Fan and C. Yang, Energy Environ. Sci., 2020, 13, 86–95 RSC.
- T. M. D. L. Alves, B. F. Amorim, M. A. M. Torres, C. G. Bezerra, S. N. D. Medeiros, P. L. Gastelois, L. E. F. Outon and W. A. D. A. Macedo, RSC Adv., 2017, 7, 22187–22196 RSC.
- J. Qi, W. Zhang, R. Xiang, K. Liu, H.-Y. Wang, M. Chen, Y. Han and R. Cao, Adv. Sci., 2015, 2, 1500199 CrossRef PubMed.
- K. M. Jeerage, S. L. Candelaria and S. M. Stavis, Sci. Rep., 2018, 8, 1–10 CrossRef CAS.
- J. Huang, J. Han, R. Wang, Y. Zhang, X. Wang, X. Zhang, Z. Zhang, Y. Zhang, B. Song and S. Jin, ACS Energy Lett., 2018, 3, 1698–1707 CrossRef CAS.
- C. Kim, S. H. Kim, S. Lee, I. Kwon, S. Kim, C. Seok, Y. S. Park and Y. Kim, J. Energy Chem., 2022, 64, 364–371 CrossRef CAS.
- P. Ganesan, A. Sivanantham and S. Shanmugam, J. Mater. Chem. A, 2016, 4, 16394–16402 RSC.
- C. E. Mitchell, D. Santos-Carballal, A. M. Beale, W. Jones, D. J. Morgan, M. Sankar and N. H. D. Leeuw, Faraday Discuss., 2021, 230, 30–51 RSC.
- H. M. Amin, M. Attia, D. Tetzlaff and U. P. Apfel, ChemElectroChem, 2021, 8, 3863–3874 CrossRef CAS.
- S. Samira, J. Hong, J. C. A. Camayang, K. Sun, A. S. Hoffman, S. R. Bare and E. Nikolla, JACS Au, 2021, 1, 2224–2241 CrossRef CAS PubMed.
- A. R. Bredar, A. L. Chown, A. R. Burton and B. H. Farnum, ACS Appl. Energy Mater., 2020, 3, 66–98 CrossRef CAS.
- D. T. Jantz, T. E. Seuferling and K. C. Leonard, ChemElectroChem, 2020, 7, 4863–4872 CrossRef CAS.
- J. Mohammed-Ibrahim, J. Power Sources, 2020, 448, 227375 CrossRef CAS.
|
| This journal is © The Royal Society of Chemistry 2023 |
Click here to see how this site uses Cookies. View our privacy policy here. 
 Open Access Article
 This Open Access Article is licensed under a Creative Commons Attribution-Non Commercial 3.0 Unported Licence
 *ab
*ab