 Open Access Article
Exploring how exposure to radiolysis and harsh chemical reagents impact americium-241 extraction chromatography†
Brian T.
Arko
 ab,
David
Dan
a,
Sara
Adelman
*a,
David B.
Kimball
 *a,
Stosh A.
Kozimor
 *a,
Marki M.
Martinez
a,
Tara
Mastren
 c,
Daniel L.
Huber
a,
Veronika
Mocko
a,
Jung
Rim
a,
Jenifer C.
Shafer
 *b,
Benjamin W.
Stein
 a and
E. Miller
Wylie
a
aLos Alamos National Laboratory, Los Alamos, NM 87545, USA. E-mail: sadelman@lanl.gov; dkimball@lanl.gov; stosh@lanl.gov
bDepartment of Chemistry, Colorado School of Mines, Golden, CO 90401, USA. E-mail: jshafer@mines.edu
cDepartment of Nuclear Engineering, University of Utah, Salt Lake City, UT 84112, USA
First published on 1st December 2022
Abstract
Improving control over radiolysis would advance nuclear technologies, spanning from radiotherapeutics to national security. There is therefore a need to better understand the impact from radiolysis on chemical transformations. Unfortunately, it is difficult to distinguish the impact from radiolysis vs. conventional stimuli for many processes that involve radionuclides. This problem was addressed herein by studying how radiolysis and exposure to chemical processing agents impacted a key separation step in the large-scale production of 241Am for industrial use, via ChLoride Extraction And Recovery (CLEAR). To achieve this goal, aliquots of the McKee-carbamoylmethylphosphine oxide (m-CMPOTBP) resin used in active 241Am(aq) CLEAR process columns were obtained and characterized for (1) americium retention/release, (2) contaminant removal, and (3) resin degradation. The separative performance from these ‘veteran’ resins (having been exposed to 241Am and processing agents) was evaluated against ‘pristine’ (not exposed to 241Am and processing agents) m-CMPOTBP, rare earth (RE), tetraoctyldiglycolamide (TODGA), and tetraethylhexyldiglycolamide (TEHDGA) resins. The separative performances of ‘pristine’ resins were evaluated after systematic exposure to radiation and acid [HCl(aq)]. Our results showed that TODGA and TEHDGA were more resistant to chemical degradation and outperformed m-CMPOTBP and RE for americium binding capacity, recovery, and purification. These studies also demonstrated how two important extractant classes (CMPO and DGA) succumbed to radiolytic and chemical degradation, leading us to conclude that the DGA resins retained separative performance to a larger extent than the CMPO alternatives. In terms of application, the data suggested that CLEAR processing of 241Am(aq) for industrial use would be more robust and effective if TODGA or TEHDGA was used in place of m-CMPOTBP.
Introduction
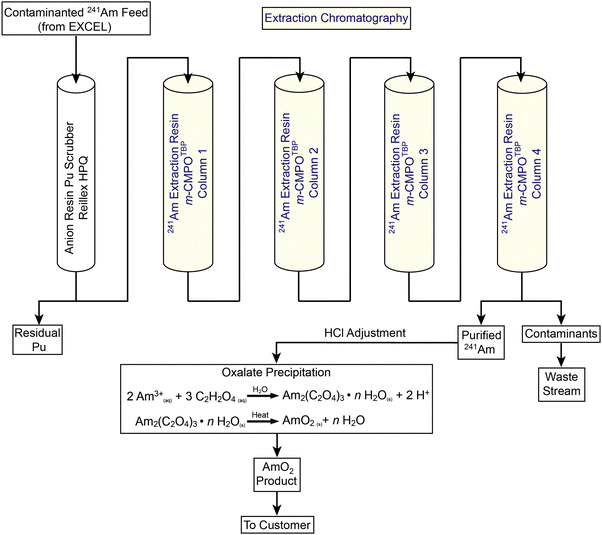
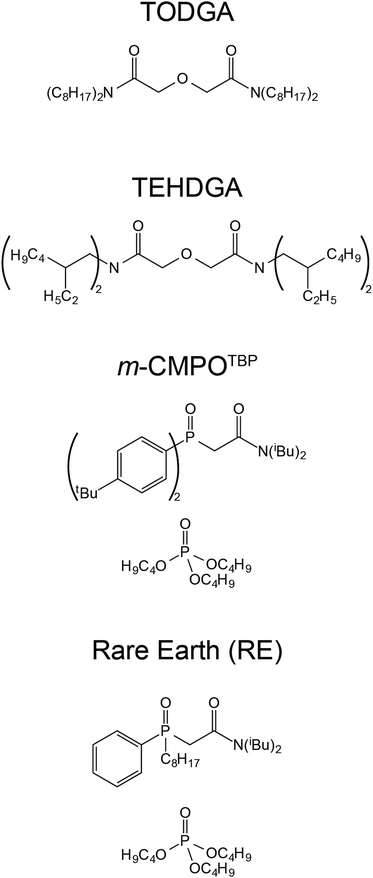
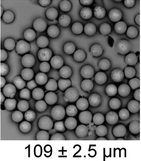
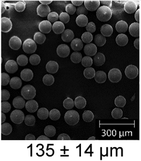
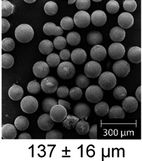
Better understanding of radiolysis would advance many nuclear technologies.1,2 One important area involves the large-scale processing of americium-241 (241Am). Numerous technologies rely on this radioisotope's [t1/2 = 432.6(6) years]3 nuclear properties. Examples include oil-well logging and drilling exploration, soil compaction testing, thickness determination of metal sheets and glasses, neutron radiography, moisture analyses, and nuclear reactor start-up.4–13 Since the 1950s, the U.S. has maintained an inventory of 241Am for these industrial uses. Then, in 1984, U.S. production stopped and the inventory was depleted. Subsequently, global industries became reliant on a single non-U.S. supplier. The U.S. Department of Energy Isotope Program identified this sole source dependence as a vulnerability and found a waste stream from plutonium processing at Los Alamos National Laboratory (LANL) that could serve as an alternative source. To diversify commercial access to 241Am, the Isotope Program and LANL established the ChLoride Extraction and Actinide Recovery (CLEAR) processing line (Fig. 1).14–17 Value in maintaining and improving CLEAR processing became more apparent in February of 2022, when the 241Am supply chain was disrupted by economic sanctions following the Russian invasion of Ukraine. Hence, the need to strengthen CLEAR processing capabilities is more important today than ever before.18A critical manipulation in CLEAR processing involves an extraction chromatography step (Fig. 1). This step utilizes a LANL-developed resin that is made in house by co-adsorbing an extractant (m-CMPO) and a phase transfer catalyst (e.g., tributyl phosphate, TBP) onto a methyl methacrylate bead (Pre-filter resin; 50–100 μm; Fig. 2). This m-CMPOTBP resin is used to separate 241Am(aq) from contaminants present in feed materials.19,20 Although 241Am(aq) extraction, purification, and recovery is operational and demonstrated on a large-scale (∼20 g of 241Am per process batch), there is a need to reduce variability from batch-to-batch in terms of purity, yield, and processing time. Researchers and engineers speculate that radiolysis may be a contributing factor to the process variations, which seems reasonable because 241Am emits high-energy α-particles [5.4 MeV (13.1%) and 5.5 MeV (84.8%)], has soft γ-radiation (59.5 keV), and is processed in large quantities.3 However, there is no data to substantiate this proposition. Better defining radiolytic impact on 241Am processing would provide insight and transform speculation about 241Am radiolysis into predictable and better controlled phenomena.
Radiolysis chemistry occurs via direct and indirect means. Direct radiolysis happens when ionizing radiation cleaves chemical bonds, e.g., A–B + ionizing radiation → A˙ + B˙. This reaction has potential to decompose chemical agents important for experimentation and chemical processing, e.g., CMPO extractant and TBP phase transfer agents used in the CLEAR process.21,22 Direct radiolysis also generates a “wave” of radicals (A˙ + B˙) that can propagate and induce additional chemical transformation via indirect means.23,24 Like direct radiolysis, indirect radiolysis also has the potential to decompose important chemical agents.25 Limited understanding of these direct and indirect reactions render it difficult to identify if radiolysis is responsible for experimental outcomes or if standard chemical transformations lead to the observed result.26,27 This obscurity breeds speculation and scientific debate. Researchers can question for any system that includes a radionuclide if radiolysis is a major contributor or not.28,29 It would be easier to identify when radiolysis is happening (and to what extent) if it were better understood. This insight would enable experiments and processing schemes to be designed that control and account for radiolytic contributions.30
Motivated by the aforementioned need to maintain and strengthen CLEAR capabilities and by scientific interest to advance fundamental understanding of radiolysis, we launched a campaign to characterize key aspects of radiolysis on extraction chromatography materials relevant to CLEAR 241Am(aq) processing. We evaluated how radiolysis and chemical transformations impacted three 241Am(aq) processing variables: (1) americium retention and release, (2) contaminant removal, and (3) resin degradation (in terms of morphological and chemical). To achieve this, we pulled m-CMPOTBP aliquots from active CLEAR line columns currently in use for 241Am(aq) processing and characterized the ‘veteran’ resin performance. Those results were compared against the performance of ‘pristine’ m-CMPOTBP (never exposed to 241Am(aq) and HCl(aq)) samples, the commercially available Rare Earth (RE) resin, and a series of diglycolamide (DGA) resins, namely tetraoctyldiglycolamide (TODGA) and tetraethylhexyldiglycolamide (TEHDGA) (Fig. 2). The RE resin was selected because it is similar to m-CMPOTBP (CMPO based) and DGA resins were chosen because they show potential for 241Am(aq) processing.19,31
Our results suggested that the m-CMPOTBP resin was susceptible to radiolysis and chemical degradation. Morphological changes (swelling), decomposition of the m-CMPO extractant, the TBP phase transfer agent, and diminished resin performance for 241Am(aq) processing were observed. Surprisingly, RE, TODGA, and TEHDGA appeared less impacted by both radiolysis and chemical degradation. The DGA resins also outperformed m-CMPOTBP and RE on all fronts examined. Collectively, these data demonstrated how two important extractant classes (CMPO and DGA) succumbed to radiolytic and chemical degradation. The results also supported the proposition that switching the extraction resin used in large-scale 241Am(aq) CLEAR processing from m-CMPOTBP to TODGA and TEHDGA could make 241Am(aq) harvesting more robust and effective.
Results and discussion
EXCEL and CLEAR processes
We found it helpful for the reader to include a high-level description of the 241Am(aq) CLEAR processing method prior to reporting our data because (1) the 241Am(aq) CLEAR processing method has not been extensively described in the open literature, beyond a few LANL technical reports; and (2) this information will help contextualize our experimental plan and results. A schematic of aqueous CLEAR line processing for 241Am(aq) containing waste is summarized in Fig. 1. The CLEAR line is preceded by the Experimental Chloride Extraction Line (EXCEL), which has been in operation at LANL since 1993 and is utilized to recover plutonium from LANL-generated waste.32 Effluent from the EXCEL line contains the 241Am β-decay product from the 241Pu parent radionuclide. This radioactive daughter is extracted from the waste by passing effluent from the EXCEL line through a series of five columns using CLEAR processing.33 The CLEAR procedure starts by moving the waste solutions through an anion exchange column that scrubs the 241Am(aq) (+3 oxidation state) feed stock of any residual plutonium that may have slipped through the preceding EXCEL processing steps.34 Next, the 241Am(aq) containing solution passes through a series of four large columns (3.4 L each) that contain the m-CMPOTBP extraction chromatography resin. This resin is made in-house by co-adsorbing an extractant (m-CMPO) and a phase transfer catalyst (e.g., tributyl phosphate, TBP) onto a methyl methacrylate bead (Pre-filter resin; 50–100 μm; Fig. 2).16 Approximate ratios are 30% by weight m-CMPO and 10% by weight phase transfer catalyst and 60% by weight Pre-filter resin. In a typical processing campaign, the 241Am(aq) containing stream (∼20 L feed) is loaded onto the columns in strong HCl(aq) (6–8 M). Under these conditions, 241Am(aq) is retained on the resin and many contaminants flow through the column. After sufficiently washing the resin with HCl(aq) (6–8 M), Am3+(aq) is eluted by flowing dilute HCl(aq) (0.1 M) through the columns. The eluted fractions are then combined. Finally, the 241Am(aq) product is precipitated with oxalic acid and subsequently converted to AmO2(s). Typical process batch sizes enabled around 20 g of 241Am to be isolated.Evaluated resins
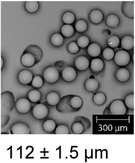
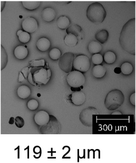
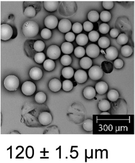
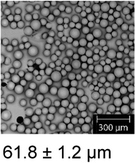
Resins were sampled from Columns #2, #3, and #4 (not Column #1) from the 241Am(aq) CLEAR processing line (Fig. 1). These samples were ‘veterans,’ meaning the m-CMPOTBP resin aliquots had been in service for 950 day and processed approximately 150 g of 241Am. During the processing time, these ‘veteran’ resins experienced cycling of large volumes of dilute and highly concentrated HCl(aq) (ranging 0.1 to 8 M) and received a substantial dose from the processing activities; estimated to be >5 MGy total. This estimate accounted for the α (5.49 MeV), γ (59.54 keV), X-ray (27.197 keV), 91.7 keV recoil energy, and the 28.97 keV Auger electrons that accompany 241Am decay.35 The estimate also accounted for the resin contact time with 241Am, which was 3 to 4 days during an individual 241Am process campaign (∼20 g 241Am per batch; 700 to 1000 kGy per batch). We acknowledge that the real-world situation is more complicated than this crude model. Consider that quantitative removal of 241Am from the resin is never achieved, not all of the radiation is completely adsorbed by resin, and that the 241Am content is heterogeneously distributed throughout the four columns. Resin housed in Column #1 binds the majority of 241Am during the column loading and washing processes. Residual 241Am trickles subsequently into Column #2, #3, and #4. Hence, the contact time with 241Am and dose received by the resin cascades diminishingly from Column #1 to #4. For this reason, Column #1 was not sampled. The residual 241Am content in Column #1 was too high and exceeded the radiological inventory limits for the radiological facility where our experiments were carried out.The following studies focused on characterizing the performance of ‘veteran’ resins in extraction chromatography. To evaluate the resin performance as a function of radiation dose received, comparative studies were carried out on ‘pristine’ batches of m-CMPOTBP (Fig. 2). ‘Pristine’ is defined here as being the m-CMPOTBP resin inventory that was made 20 years ago (still used operationally) and has not been exposed yet to either radiation (α, β, and γ) or any acids, like HCl(aq). When deemed relevant, the performance of the ‘veteran’ and ‘pristine’ m-CMPOTBP resins were further evaluated against the chemically similar RE resin as well as the TODGA and TEHDGA resins shown in Fig. 2.31
Distribution coefficients (Kd) from m-CMPOTBP ‘veteran’ and ‘pristine’ resins
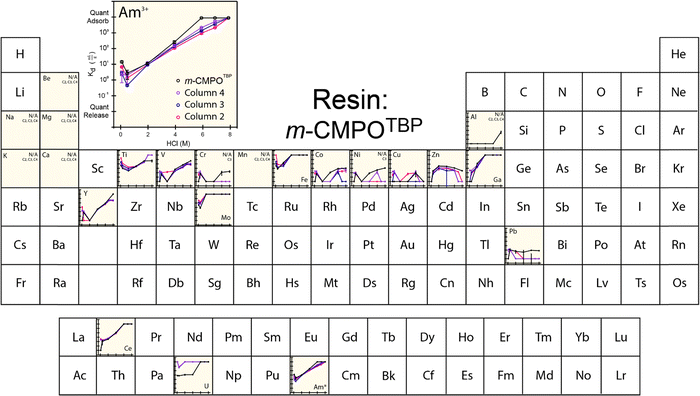
The extraction characteristics from the aforementioned resins were characterized for americium binding vs. binding of a series of common contaminants found typically in the 241Am process feed. These contaminants included Al, Be, Ca, Ce, Co, Cr, Cu, Fe, Ga, K, Mg, Mo, Mn, Ni, Pb, Ti, U, V, Y, and Zn. For the ‘veteran’ resins, we were unable to make Kd measurements directly on the 241Am radionuclide because of the substantial amounts of 241Am that lingered on the CLEAR resins from previous processing activities. Instead, we made the reasonable assumption that the 243Am isotope would behave equivalently to 241Am. Hence, americium Kd measurements were made using an 243Am(aq) radiotracer. Note: (1) γ-spectroscopy confirmed the initial absence of 243Am activity in each ‘veteran’ m-CMPOTBP resin; (2) residual 241Am left on the resin may impact measured ‘veteran’ Kd values for all of the above-mentioned elements (including 243Am). However, the impact from residual 241Am is relevant and representative of 241Am large-scale processing conditions.The 243Am(aq)Kd values from ‘veteran’ m-CMPOTBP resins were characterized as a function of HCl(aq) concentration (ranging from 0.1 M to 8 M; Fig. 3). The range of HCl(aq) concentrations were selected because they simulated large-scale processing conditions when americium was bound to the extraction resin [in 6 to 8 M HCl(aq)], when the resin was washed [in 6 to 8 M HCl(aq)], and when 241Am was eluted from the resin [in dilute 0.1 M HCl(aq)]. In general, this data showed low uptake of 243Am(aq) in dilute HCl(aq) (<2 M). Increasing the HCl(aq) concentrations monotonically increased 243Am(aq) retention until quantitative adsorption was achieved at 8 M HCl(aq). Another characteristic associated with this 243Am(aq)Kd plot was the upturn in 243Am(aq) retention that occurred at very dilute HCl(aq) concentrations. For example, decreasing the HCl(aq) concentration from 2 to 0.5 M forced the 243Am(aq)Kd value to drop to a minimum at 1 mL g−1. Decreasing the HCl(aq) concentration further to 0.1 M generated the opposite response and the 243Am(aq)Kd value increased to 10 mL g−1. Although the origin for this disparate performance remains unclear, it has been observed and discussed previously.36,37
The general line shapes that described 243Am(aq)Kd dependence in HCl(aq) from the ‘veteran’ resins were similar to one another and to that from ‘pristine’ m-CMPOTBP resins. Despite these similarities, some subtle and important distinctions should be noted. Increased exposure to 243Am(aq) by progressing from the ‘pristine’ resin to Columns #4, #3, and then to #2 decreased 243Am(aq) retention at high HCl(aq) concentrations (between 4 and 8 M). This change is undesirable from a processing standpoint. These Kd results suggested that prolonged exposure to processing conditions – either 241Am or HCl(aq) – led to resin degradation, which is consistent with the rest of the data reported below. This decomposition decreased CLEAR resin's aptitude for extracting 241Am(aq) from the feed during column loading (high HCl concentrations). We also observed that the resin's ability to release 241Am(aq) during the elution process (low HCl concentrations) was complicated. The 241Am(aq) recoverability at 0.1 M HCl(aq) was better for the ‘veteran’ resins vs. the ‘pristine’ m-CMPOTBP, however, recoverability from Column #2 (largest 241Am exposure) was worse than Columns #3 and #4 (smallest 241Am exposure).
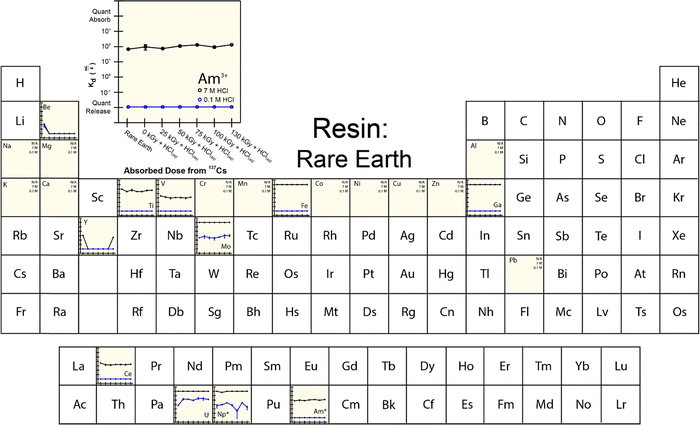
Exposing resins to 241Am also impacted retention of common contaminants potentially present in the CLEAR feed stock. Exposure to 241Am decreased the ‘veteran’ resins’ propensity for binding V, Cr, Co, Zn, Y, and Pb at high HCl(aq) concentrations. Exposure decreased the ‘veteran’ resins’ capability for releasing V, Fe, Y, Ce, and U at low HCl(aq) concentrations. Interaction with the other common contaminants was either unaffected (Be, Na, Mg, K, Ca, Mn, Al) or difficult to rationalize (Cu).
Distribution coefficients (Kd) from ‘pristine’ m-CMPOTBP, RE, TODGA, and TEHDGA resins
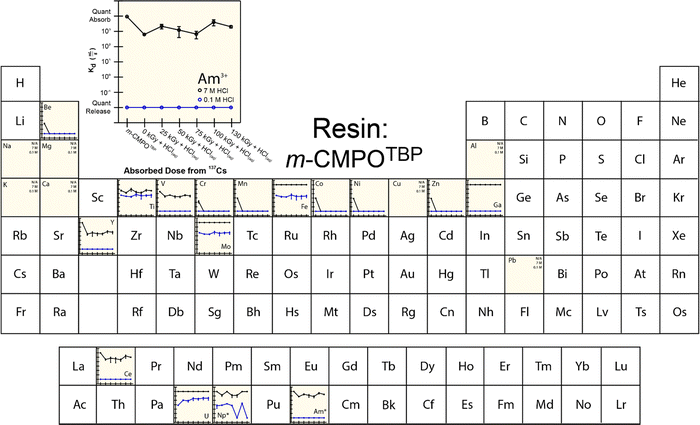
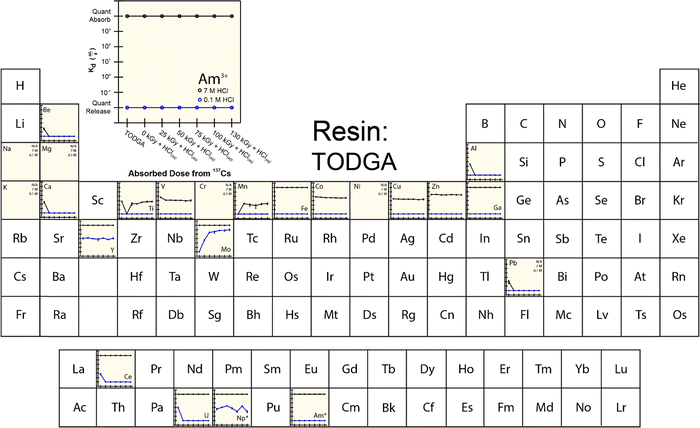
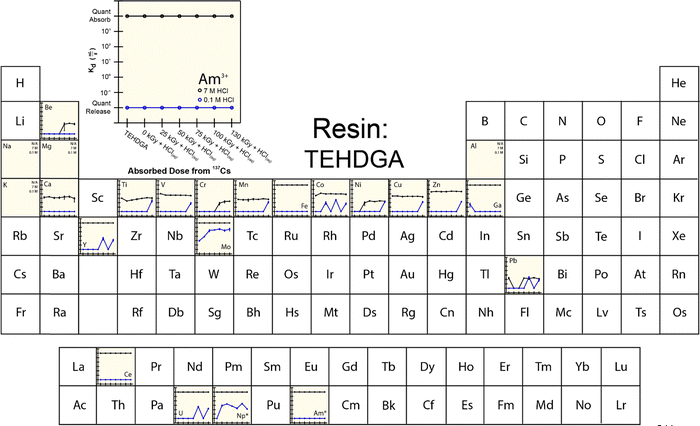
To provide more insight into what caused 241Am(aq) retention to change when resins were exposed to 241Am and HCl(aq), we designed and carried out a series of radiation exposure experiments on the resins shown in Fig. 2. These experiments (Fig. 4–8) involved exposing the ‘pristine’ versions of m-CMPOTBP, RE, TODGA, and TEHDGA resins for 130 d to dilute HCl(aq) [0.1 M; 241Am(aq) column elution conditions], for 130 d to higher concentration HCl(aq) [7 M; 241Am(aq) column loading and washing conditions], and to radiolysis induced from 137Cs radiation (β− and γ; 0 to 130 kGy). Note, this 130 kGy β− and γ dose exceeded the estimated β− and γ dose (calculated to be 50 kGy) received by the resin during the time period (3.5 day) for processing one single batch of 241Am (∼20 g).35 Also note, impact from α induced radiolysis was not captured in these experiments, α radiolysis increases estimated doses to be between 700 to 1000 kGy per batch (see above). These experiments showed that HCl(aq) contact decreased 241Am(aq) retention for m-CMPOTBP and that the resins performance for m-CMPOTBP after the 7 M HCl(aq) exposure matched (within error) that from the ‘veteran’ resin (Kd ∼ 103). Exposure to γ-radiation did not have any observable impact on 241Am binding for m-CMPOTBP, which suggested that α-induced radiolysis may be more impactful than that from γ-radiation. We were surprised to observe that HCl(aq) exposure did not affect the other tested resins (RE, TODGA, and TEHDGA) and that none of these resins displayed changes in 241Am(aq) retention during column loading (at high HCl(aq) concentration) and during 241Am(aq) release (at low HCl(aq) concentration) after exposure to 137Cs radiation.The retention of potential metal contaminants by the m-CMPOTBP and RE resins were impacted by exposure to HCl(aq) and to a lesser extent exposure to 137Cs radiation (130 kGy). For example, for the m-CMPOTBP, contacting this resin with higher concentration HCl(aq) (7 M; column loading conditions) decreased the binding of Be, V, Cr, Mn, Y, Ni, Co, Ti, and Zn (high HCl(aq) concentrations) and did not impact Fe, Ga, Na, Mg, K, Ca, Cu, Al, and Pb binding. At low HCl(aq) concentration (0.1 M; americium eluting conditions), Kd values increased for U and decreased for Np.38 Exposure to 137Cs radiation alone had negligible impact on the m-CMPOTBP and RE resins ability to bind any of the contaminants. Exposing TODGA and TEGDGA to 137Cs radiation (130 kGy) and HCl(aq) had no impact on metal contaminant binding, with one exception. Binding of Mo increased when DGA resins received prolonged exposure to 137Cs radiation and dilute HCl(aq) (0.1 M).
Americium loading capacity
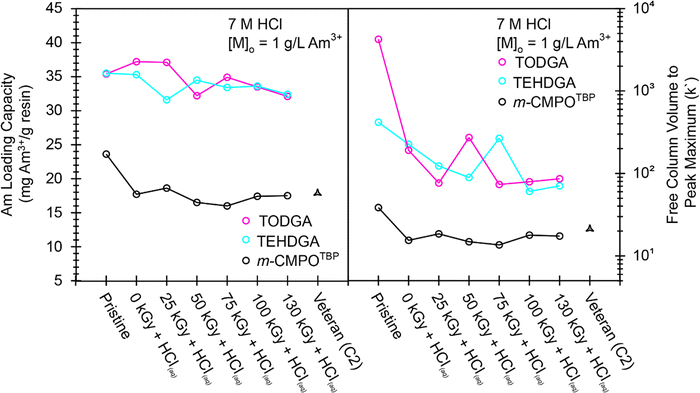
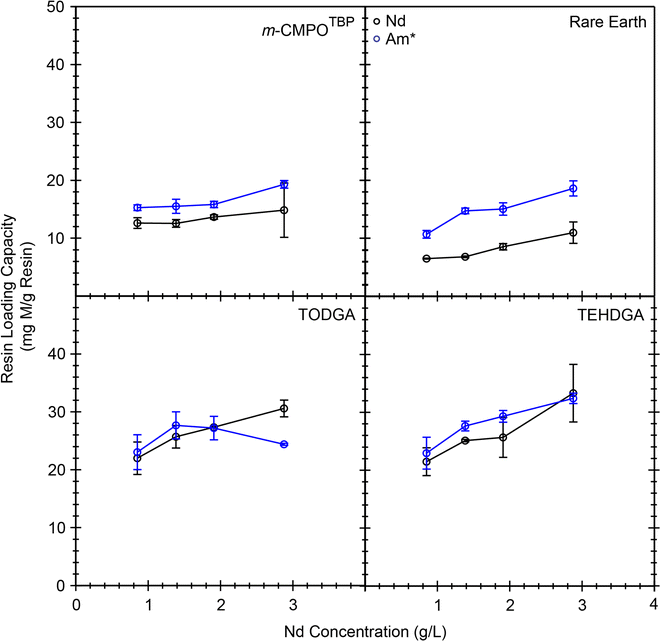
The studies described above were carried out under conditions where the resin was always in extreme excess in comparison to americium. We realize that this is not the case during large-scale production campaigns.32 For this reason, we developed safe protocols for conducting metal binding capacity experiments with macroscopic amounts of americium that would better inform on resin binding capacity for 241Am(aq), a critical variable for designing and optimizing large-scale 241Am(aq) processing. In these experiments we used the slightly less radioactive 243Am isotope [t1/2 = 7364(22) year] in place of 241Am [t1/2 = 432.6(6) year] to mitigate the radiation dose received by the researchers and sidestep measurement challenges presented by the ‘veteran’ resins that had residual 241Am(aq).3 The measured 243Am(aq) binding capacities (see eqn (5)) from ‘veteran’ m-CMPOTBP resins were compared against those from ‘pristine’ m-CMPOTBP, TEHDGA, and TODGA resins that had been exposed to HCl(aq) (7 M) as well as 137Cs radiation (see Fig. 8). In general, 243Am(aq) binding capacities from DGA resins were about 40% higher (at ∼35 mg 243Am per g resin) than from the ‘pristine’ m-CMPOTBP resin (∼25 mg 243Am per g resin). The 243Am(aq) binding capacity from ‘pristine’ m-CMPOTBP resin was around 25% higher than the ‘veteran’ resin from Column #2 (17.5 ± 0.1 mg 243Am per g resin) and m-CMPOTBP resin that had been exposed to either 137Cs radiation (130 kGy) or HCl(aq) (7 M), which were also around 17 mg 243Am per g resin). Exposing the DGA based resins to 137Cs (130 kGy) radiation and HCl(aq) (7 M) decreased the 243Am(aq) binding capacity by ∼9% (32.4 ± 0.1 mg 243Am per g resin for TEHDGA and 32.1 ± 0.1 mg 243Am per g resin for TODGA). This decrease was substantially smaller than the decrease observed for m-CMPOTBP resin that had been exposed to 137Cs (130 kGy); approximately a 26% decrease was observed to be 17.4 ± 0.1 mg 243Am per g resin.The Am3+ resin capacity measurements described above provided insight into the amount of extractant that should be adsorbed onto pre-filter beads to achieve maximum 241Am(aq) retention during extraction chromatography. These data suggested 4.71 ± 0.01 equivalents of TEHDGA extractant were required to bind one equivalent of Am3+ because the TEHDGA resin was 40% by weight and 243Am(aq) binding maximized at 35.5 ± 0.1 mg 243Am per g resin. Equivalent results (within the measurement uncertainty) were obtained for the TODGA: 40% TODGA by weight and 35.4 ± 0.1 mg 243Am per g resin. In contrast, more extractant (and consequently, phase transfer agent) was required for the m-CMPOTBP resin. Up to 6.38 ± 0.03 equivalents of m-CMPO extractant were needed for one equivalent of Am3+ (23.6 ± 0.1 mg 243Am per g resin), assuming the resin was loaded at 30% by weight m-CMPO. It was tempting to correlate these americium mass loading numbers with stoichiometries for the extracted Am3+(aq) species. However, we refrained from concluding that the average chemical speciation for extracted 241Am was “Am(TEHDGA)4.6” and “Am(m-CMPO)6.4” because it was possible that not all of the extractant was participating in Am3+(aq) binding. Hence, this data serves as motivation for future efforts that characterize Am3+ speciation on the CMPO and DGA resin beads.39 Consequently, these characterization experiments are underway.
Additional confidence and credibility for the above described 243Am(aq) mass loading experiments were obtained by carrying out complimentary mass loading experiments using milligram quantities of Nd3+(aq) (1–2.5 g L−1) traced with radioanalytical quantities of 241Am(aq) (20 nCi mL−1, 6 × 10⁻¹⁰ g mL−1).40 These experiments showed that the Nd3+(aq) binding capacity from the DGA resins was higher than that from CMPO resins and that the 241Am(aq) activity “carried on” Nd3+(aq) (followed or mimicked) (Fig. 9). The Nd3+(aq) binding capacity at 1 g L−1 in 7 M HCl(aq) was 21 mg Nd per g resin for both of the DGA resins (0.15 mmol Nd3+ per g resin). This value compared well with the analogous 241Am(aq) measurement recorded in Fig. 8; 35 mg Am3+ per g resin; 0.15 mmol Am3+ per g resin at 1 g L−1 in 7 M HCl(aq). Similar agreement was observed for Nd3+(aq) and Am3+(aq) binding capacities from CMPO resins and the CMPO resins showed an overall lower capacity for Nd3+(aq) and Am3+(aq) than the DGA resins. All of these binding capacity measurements supported our ranking for metal binding capability, from highest metal binding capacity to lowest metal binding capacity:
| TEHDGA ∼ TODGA ≫ m-CMPOTBP > RE |
Another valuable metric obtained from these mass loading experiments was the free column volume to peak maximum, which is also known as the resin capacity factor, k′ (calculated directly from Kd under excess metal conditions, see eqn (8)).41Fig. 8, right outlines how k′ from m-CMPOTBP, TODGA, and TEHDGA varied as a function of dose received and upon exposure to HCl(aq) (7 M). These k′ measurements estimated 241Am(aq) to breakthrough as a function of eluent passed through a column and informed on volume restraints that prevented 241Am(aq) loss during column washing. Overall, these experiments highlighted that k′ for TODGA was approximately an order of magnitude higher than TEHDGA and that k′ for TEHDGA was an order of magnitude higher than ‘pristine’ m-CMPOTBP. Exposure to HCl(aq) (7 M) decreased k′, such that k′ from TODGA and TEHDGA were essentially equivalent and approximately 10 times larger than that from m-CMPOTBP. The impact from 137Cs radiation slightly decreased the k′ values further for TODGA and TEHDGA. Despite this decrease, k′ from TODGA and TEHDGA remained substantially larger than m-CMPOTBP, whose k′ was only marginally impacted by exposure to ionizing radiation from 137Cs or 241Am (Column #2).
Characterization of the irradiated resins
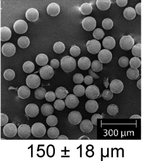
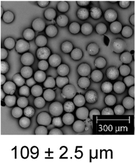
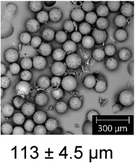
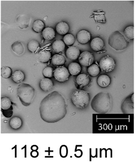
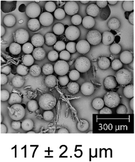
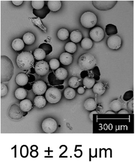
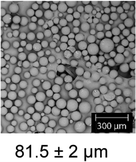
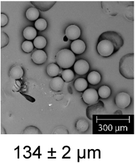
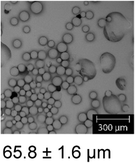
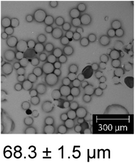
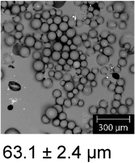
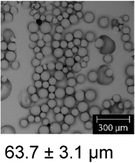
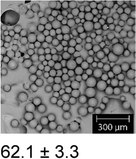
The adsorbed extractants and phase transfer agents present in CMPO and DGA resins were characterized to provide insight into why the performance of some resins changed after exposure to 241Am (and its daughters) as well as to HCl(aq). The resins were characterized using numerous spectroscopic methods. Infrared spectroscopy (IR) and scanning electron microscopy (SEM) assays were made directly on the resins that had been dried under ambient conditions for two weeks. The effectiveness of the drying procedure was confirmed gravimetrically. Gas chromatography mass spectrometry (GCMS) and 1H and 31P nuclear magnetic resonance (NMR) spectroscopy assays were performed on solutions obtained after stripping the extractant and the phase transfer catalyst from the dried resin bead. Deuterated-dimethyl sulfoxide (DMSO-d6) was used for the NMR measurements and ethyl acetate for the GCMS assay (see the Methods section). For each resin, there was value in reviewing all five pieces of data – IR, SEM, GCMS, 1H NMR, and 31P NMR – because degradation products identified by one method (e.g., 31P NMR) may not be observable using other analytical techniques (e.g., GCMS). Admittedly, we were unable to unambiguously characterize the exact identity of each degradation product. Instead, we simply use the data to identify when degradation was occurring.The SEM images also showed that crystallites (shaped as needles) formed when the m-CMPOTBP resins were exposed to HCl(aq) and 137Cs radiation. Elemental analyses using energy dispersive spectroscopy (EDS) on these needles identified C, N, O and P, whose origin was reasonably attributed to desorption of the m-CMPO extractant and/or TBP phase transfer catalyst from the resin bead. We posit similar desorption was operative for the ‘veteran’ samples even though no crystallites were observed by SEM. Absence of crystals in the ‘veteran’ SEM images was attributed to differences in sample treatment. For example, the ‘veteran’ resins were housed within a column through which a mobile phase flowed during operation. This arrangement provided a mechanism to remove the desorbed extractant and phase transfer catalyst from the ‘veteran’ resin samples prior to SEM assay. In contrast, the 137Cs contacted samples were housed in Eppendorf tubes and the mobile phase was static. Under these conditions desorbed extractants and phase transfer catalysts were trapped alongside the resin bead and could not be removed prior to SEM analyses. No needle formation was observed with the RE resin. Overall, these data demonstrate that TODGA and TEHDGA are more stable toward morphological changes induced by HCl(aq) and radiolysis than m-CMPOTBP and RE resins.
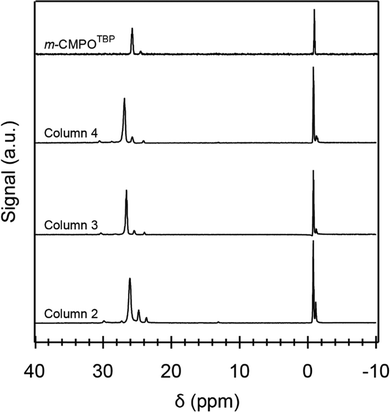
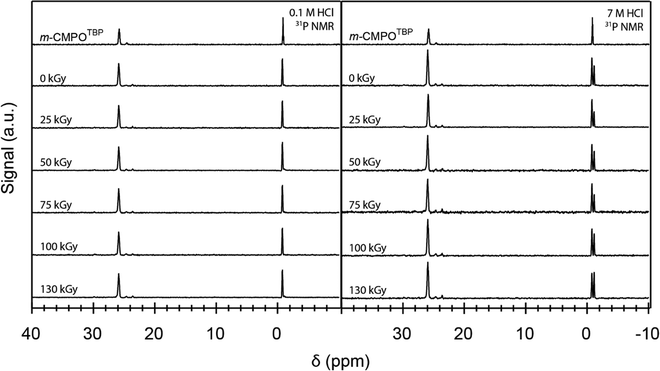
To provide some insight into the origin for ‘veteran’ resin degradation, we compared the ‘veteran’ 31P NMR spectra with spectra from ‘pristine’ resins exposed to dilute HCl(aq) (0.1 M), high concentration HCl(aq) (7 M), and 137Cs radiation. These comparisons showed that the phosphine oxide functional group in m-CMPO was susceptible to degradation from exposure to both HCl(aq) and 137Cs radiation (Fig. 11). Notice the 31P spectrum from ‘pristine’ m-TBP (near δ 0 ppm) contained the characteristic TBP septet (see Fig. 11 and the ESI†). Exposing the resin to HCl(aq) caused a quintet to emerge near δ −1 ppm. We attributed this change to degradation of the TBP to dibutyl phosphate (DBP), which has been documented in the literature.38,43–46 Exposing the resin to 137Cs radiation increased the degradation slightly, as evident from the subtle increased quintet peak intensity (δ 26 ppm). Comparing the 31P NMR spectra from ‘veteran’ resins to the ‘pristine’ and irradiated m-CMPOTBP spectra demonstrated – for the most part – that the harsh conditions associated with industrial use [combined exposure to 241Am exposure and HCl(aq)] impacted integrity for the m-CMPO extractant and TBP phase transfer catalyst. There was substantially more degradation for the ‘veteran’ m-CMPO resins than for those exposed to 137Cs radiation, likely due to the larger 241Am α-radiation dose.21,22 We also observed a slight increase in TBP degradation for the 137Cs exposed samples. Initially it seemed that TBP degradation was more pronounced for the 137Cs exposed samples than for the ‘veteran’ resins. However, for the same reasons that we cannot quantify crystallite formation in the ‘veteran’ samples (see the SEM analysis above), we cannot quantify TBP degradation in ‘veteran’ samples. This is because TBP degradation products [like O![[double bond, length as m-dash]](https://www.rsc.org/images/entities/char_e001.gif) P(OH)x(OBu)3−x] could potentially be removed by the mobile phase during CLEAR column operations.
P(OH)x(OBu)3−x] could potentially be removed by the mobile phase during CLEAR column operations.
Similar to m-CMPO, the DGA resins degraded from exposure to acid and 137Cs (130 kGy) radiation. Notable decomposition peaks included features at 4.5 min (m/z 142), 5.5 min (m/z 180), and 8 min (m/z 170) which were attributable to amine and amide biproduct formation. Peaks at 24 min (m/z 313) and 28 min (m/z 354) were attributable to amide hydrolysis decomposition products. These assignments were consistent with the NMR assays, which showed peaks at δ 8.5 and δ 9.9 ppm that likely resulted from the hydrolysis degradation pathways.47–50
Outlook
Herein the impact of radiolysis and chemical degradation pathways on three important 241Am(aq) processing variables were evaluated; (1) americium retention and release, (2) contaminant removal, and (3) resin degradation (in terms of morphologic and chemical). The results suggested chemical exposure to HCl(aq) only marginally impacted 241Am(aq) extraction chromatography for two DGA-based resins (TODGA and TEHDGA). For these TODGA and TEHDGA resins, exposure to HCl(aq) for 130 days had no effect on americium Kd values under column loading conditions [7 M HCl(aq)]. It also did not impact americium release under americium elution conditions [0.1 M HCl(aq)]. Contacting TODGA and TEHDGA with HCl(aq) did, however, facilitate 241Am(aq) breakthrough from the column during resin washing, as evident from the appreciable decrease in the free column volume to peak maximum (k′) measurements. Exposure to 137Cs radiation further decreased k′, thereby increasing the possibility for americium breakthrough during washing, due to radiolysis. The DGA resin's chemical integrity was maintained (compared to m-CMPOTBP) when subjected to 137Cs radiation, and consequently when exposed to HCl(aq). In terms of morphology, 137Cs radiation and HCl(aq) exposure did not cause appreciable amounts of swelling nor was there any evidence of extractant desorption detected. All these factors demonstrated robustness for the TODGA and TEHDGA resins in americium extraction chromatography. These features are particularly exciting when compared to the operationally deployed m-CMPOTBP resin currently used in large-scale CLEAR processing.Radiolytic and chemical decomposition was more prominent for the m-CMPOTBP resin currently used in CLEAR processing. Exposure to HCl(aq) decreased 241Am(aq) retention during column loading, facilitated 241Am(aq) breakthrough from the resin during column washing, and showed minimal impact on 241Am(aq) release during elution. Radiolysis chemistry decreased americium retention during loading, increased breakthrough during washing, and had an impact on the release of 241Am from the resin during elution. Contact with both HCl(aq) and radiation caused substantial swelling of the m-CMPOTBP resin and caused desorption of the extractant and phase transfer agents from the resin bead. Consequently, swelling is undesirable because it can lead to channeling within a column, can negatively impact flow rates, and can broaden analyte separation bands. In general, radiolytic and chemical degradation results from m-CMPOTBP were more pronounced than for the RE, TODGA, and TEHDGA resins.
In light of these results, we suggest changing the operationally deployed m-CMPOTBP resin to TODGA and/or TEHDGA would be beneficial for large-scale 241Am(aq) processing. This recommendation was bolstered by evaluating our results within the context of recent studies that highlighted other potential advantages of TODGA and TEHDGA over m-CMPOTBP.16,51 It seems likely that the proposed change would reduce 241Am(aq) loss during column loading and washing, increase 241Am(aq) recovery during column stripping, and make the extraction process more accommodating to diverse feedstocks. The data also suggested that similar larger quantities of 241Am(aq) (>20 g process batches) could be processed with TODGA and/or TEHDGA resin compared with what is currently used with m-CMPOTBP. This higher loading capacity from the DGA resins would enable use of smaller sized columns, increase flow rate, decrease processing time, and (perhaps most importantly) reduce exposure of workers to harmful radiation doses. We make these claims fully aware that like-for-like comparisons between ‘veteran’ m-CMPOTBP and TODGA/TEHDGA resins cannot be made at this time.
Overall, the results highlight the unfortunate reality associated with studying and processing any radioactive nuclide. Both chemical and radiolytic factors associated with the radioisotope should be considered and need to be controlled. Consequently, these two variables are difficult to deconvolute and often both contribute to the observed chemistry. Although we report here on how radiolysis and acid exposure impact the chemistry and extraction chromatography for large-scale processing of 241Am(aq) in HCl(aq), we acknowledge the need for more data because the generality of our conclusions has yet to be established. For example, switching the HCl(aq) mobile phase to a different acid or organic solvent may substantially impact the chemical and radiolytic stability of m-CMPOTBP, TODGA, and TEHDGA. It is also important to realize that each radioisotope is unique. Hence, it is difficult to extrapolate the 241Am(aq) results to other radionuclides with different nuclear properties. Within this perspective, our results have exemplified the need for additional in-depth studies that advance understanding of radiolysis chemistry and will hopefully motivate researchers to characterize transformations initiated by the radiolytic processes.
Methods
General considerations
Caution! americium-241 [241Am, t1/2 = 432.6(6) year], americium-243 [243Am, t1/2 = 7364(22) year], neptunium-239 [239Np, t1/2 = 2.356(3) day], and their daughters constitute serious health threats because of radioactive decay.3 Hence, all studies that involved manipulation of these radionuclides were conducted in a radiation laboratory equipped with HEPA filtered hoods, continuous air monitors, negative pressure gloveboxes, and monitoring equipment appropriate for α-, β-, and γ-particle detection. Entrance to the laboratory was controlled with a hand and foot monitoring instrument for α-, β-, and γ-emitting isotopes and a full-body personal contamination monitoring station.The 241Am(aq) tracer was obtained as a rigorously defined standard from Eckert and Ziegler. The 239Np(aq) tracer was generated from 243Am and isolated as previously described.16 Aqueous hydrochloric acid [HCl(aq), Fisher Scientific, Optima® grade], methanol (MeOH, HPLC-grade, Sigma Aldrich), ethyl acetate (ACS Certified >99.5%, Fischer Scientific), and deuterated dimethyl sulfoxide (DMSO-d6; 99.5%; Sigma Aldrich) were obtained commercially and used as received. Many of the extraction resins – N,N,N′,N′-tetraoctyl diglycolamide (TODGA, 50–100 μm), N,N,N′,N′-tetra(2-ethyl hexyl) diglycolamide (TEHDGA, 50–100 μm), and Rare Earth (RE, 50–100 μm) – were obtained from Eichrom Technologies and used as received. Pre-filter resin was obtained from Eichrom Technologies and conditioned, vida infra. The exception was di-(4-t-butylphenyl)-N,N-di-iso-butylcarbamoylmethylphosphine oxide (m-CMPO), which was prepared as previously described and co-adsorbed with either tetrabutyl phosphate (TBP, Fisher Scientific, >99%) to generate m-CMPOTBP.16,19 The TBP was not purified before use. Dibutylphosphate (DBP, TCI Chemicals, ≥97%) was purchased to analyze the degradation of TBP (see the ESI†). Water (H2O) was deionized and passed through a Barnstead water purification system to achieve a resistivity of 18 MΩ. All measurements were made in triplicate. Infrared spectroscopy (IR) was conducted using a Nicolet iS5 IR spectrometer. The nuclear magnetic resonant (NMR) spectroscopy measurements were taken using a Bruker 400 MHz Ascend spectrometer in DMSO-d6 and chemical shifts were referenced to DMSO-d6. All 241Am-exposed NMR samples that contained radiative material were doubly contained as described previously.52 The first layer of containment was a Teflon liner sealed with the Teflon plug. The second layer of containment was a Pyrex NMR tube sealed at the cap on the outside with Gorilla Glue.
Gamma spectroscopy
All γ-spectroscopy measurements were made using an EG&G Ortec model GMX-35200-S HPGe detector system in combination with a Canberra model 35-Plus multichannel analyzer. The GMX-35200-S HPGe detector's diameter was 50.0 mm and length was 53.5 mm. The Be window thickness was 0.5 mm and outer dead-layer thickness was 0.3 μm. The detector components included a p-type Al-windowed high-purity germanium (HPGe) detector with a measured FWHM at 1333 keV of approximately 2.2 keV and was relatively efficient (about 10%). Relative total source activity uncertainties ranged from 2.6% to 3.3%. All spectra were analyzed using the Gamma Vision software package. A detector response function was established and its accuracy monitored using a standard that contained a mixture of radionuclides (241Am, 109Cd, 57Co, 139Ce, 203Hg, 113Sn, 137Cs, 88Y, and 60Co). This standard was traceable to the National Institute of Standards and Technology (NIST) and supplied by Eckert & Ziegler (Atlanta, GA, USA).Stable element analyses
Stable element concentrations were determined by inductively coupled plasma-atomic emission spectroscopy (ICP-AES) using either a Shimadzu ICPE-9000 or a PerkinElmer Optima 8000 instrument. Standards were gravimetrically prepared using a multi-element standard prepared by Inorganic Ventures. A five-point calibration curve was created (ranging from 250 ppb to 5 ppm) for each element in HCl(aq) (0.1 M). This multi-element standard was verified for element concentrations against several Quality Control (QC) standards (Assurance® Multi-Element Standards QC-21, QC-7, Ga, and K, single-element standard cocktails). Quantitative analyses included the following analytes: Al, Be, Ca, Ce, Co, Cr, Cu, Fe, Ga, K, Mg, Mo, Mn, Ni, Pb, Ti, U, V, Y, and Zn.Limit of quantification
The limit of quantification (LOQ) for stable elements was determined using eqn (1).| LOQ = 10 × (sb/m) | (1) |
| LOQ = 10 × σb | (2) |
Irradiating resins with a 137Cs γ-source
Samples that were irradiated with a 137Cs source were prepared with two considerations in mind.21,22,28,32,38,47,50,55–60 First, it was important to simulate the chemical environment experienced by the resin during large-scale processing of 241Am(aq) as closely as possible. Second, it was important to irradiate the resin in a container and configuration that facilitated post-irradiation distribution coefficient (Kd) measurements. Hence, resins (∼25 mg) were loaded into dry Eppendorf tubes (1.5 mL Part #89501-414) that were equipped with a screw top lid that contained an O-ring without exclusion of air and moisture. The resin masses were recorded. Then, the resin containing Eppendorf tubes were separated into two families. We added HCl(aq) (100 μL, 0.1 M) to the first family to generate resins suspended in dilute HCl. We added HCl(aq) (100 μL, 7 M) to the second family to generate resins suspended in higher concentration HCl. The mass of each mixture [resin + HCl(aq)] was determined. Care was taken to ensure the Eppendorf tubes were tightly capped and the lid for each tube wrapped with parafilm to guard against evaporation. Samples were made in triplicate and double-bagged. All samples were shipped to the University of Utah and irradiated at doses of 0 kGy (control), 25.5 kGy, 52.5 kGy, 74.8 kGy, 102 kGy, and 130 kGy using a J. L. Shepherd and Associates model 30 with a 137Cs (ORIS/CBI Model CSL-15) with a dose rate of 1.04 kGy h−1 (with a given error of ±5%).Chemical characterization of 137Cs irradiated resins
Once samples returned from being irradiated, samples with larger amounts of resin (500 mg ± 50 mg) and/or solution (600 μL) were opened in a fume hood and dried without exclusion of air and moisture. Dryness was confirmed by gravimetric analyses. Once dry, the irradiated resins (and controls) were characterized using GCMS, IR, NMR, and SEM. The IR measurements were carried out directly on the dry resins. In contrast, NMR measurements were carried out on resin extractants that had been stripped from resin beads. This was achieved by adding DMSO-d6 (1 mL) to aliquots of the resin that had been carefully weighed (50 ± 5 mg). After >24 h, the mixtures were filtered through a filter stick, which consisted of a KimWipe that had been stuffed into a Pasteur pipette.The gas chromatography mass spectroscopy (GCMS) samples were also prepared on resin extractants that had been stripped from resin beads. This was achieved by adding ethyl acetate (1.5 mL) to resin aliquots that were weighed (50 ± 5 mg). After >24 h, the mixtures were filtered through filter sticks (KimWipes stuffed into a Pasteur pipettes) and the filtrates collected for subsequent GCMS analyses. A comprehensive GCMS method was developed to qualitatively identify post-irradiation degradation products from the DGA and CMPO based extractants using unirradiated resins. These data fingerprinted chromatographic peaks corresponded to each type of starting material and created a spectral reference to compare them with irradiated resins. Mass spectra were compared with the National Institute of Standard Technology (NIST) spectral databases, which aided in identifying degradation products. Measurements were carried out using an Agilent Technologies 6890 gas chromatograph equipped with a 5973 network mass selective detector and a split/splitless inlet (Santa Clara, CA). The capillary column was a mid-polarity phase RTx-200 (length = 30 m; internal diameter = 0.25 mm; film thickness = 0.25 μm; Restek Corporation, Bellefonte, PA). Samples (1 μL) were injected in split mode (inlet temperature = 300 °C). A split ratio of 100![[thin space (1/6-em)]](https://www.rsc.org/images/entities/char_2009.gif) :
:![[thin space (1/6-em)]](https://www.rsc.org/images/entities/char_2009.gif) 1 was used to dilute the samples in the inlet and prevent column overload during analyses. Ultra-high purity helium (Airgas, ≥99.999%) carrier gas was used (flow rate = 2.0 mL min−1). The mass spectrometer was operated at 70 eV; ion source temperature = 150 °C, transfer line temperature = 280 °C. To account for all expected mass fragments associated with the resin extractant we tuned the mass spectrometer for mass-to-charge ratios (m/z) that ranged 50 through 500. Optimal separation was achieved within 32.33 min using a GC runtime protocol with the following oven program: oven start at 100 °C (1 min hold), ramp to 200 °C (30.00 °C min−1), ramp to 330 °C (5.00 °C min−1), and hold at 330 °C (2 min).
1 was used to dilute the samples in the inlet and prevent column overload during analyses. Ultra-high purity helium (Airgas, ≥99.999%) carrier gas was used (flow rate = 2.0 mL min−1). The mass spectrometer was operated at 70 eV; ion source temperature = 150 °C, transfer line temperature = 280 °C. To account for all expected mass fragments associated with the resin extractant we tuned the mass spectrometer for mass-to-charge ratios (m/z) that ranged 50 through 500. Optimal separation was achieved within 32.33 min using a GC runtime protocol with the following oven program: oven start at 100 °C (1 min hold), ramp to 200 °C (30.00 °C min−1), ramp to 330 °C (5.00 °C min−1), and hold at 330 °C (2 min).
Distribution coefficient, Kd, measurements from 137Cs irradiated resins
Two stock solutions were made for the Kd measurements carried out on the 137Cs irradiated resins described above. One was in 7 M HCl(aq) and another in 0.1 M HCl(aq). This was achieved by obtaining a commercially available and certified elemental standard (Inorganic Ventures) that contained a series of elements (Al, Be, Ca, Ce, Co, Cr, Cu, Fe, Ga, K, Mg, Mo, Mn, Ni, Pb, Ti, U, V, Y, and Zn) dissolved in HCl(aq). The HCl(aq) concentration from this standard was reported by Inorganic Ventures to be 1.59 ± 0.02 M in their certificate of analysis, which we confirmed using an Metrohm Ti-Touch 916 autotitrator. An aliquot (2.78 mL) from this elemental stock solution was diluted with H2O (47.16 mL) and HCl(aq) (0.06 mL; 10.2 M) to generate a dilute HCl(aq) stock solution that was 0.1 M in HCl. The stable element and uranium concentrations were all 5.56 ppm in this dilute HCl(aq) stock solution and the total volume was 50 mL. A second aliquot (2.78 mL) from the elemental stock solution was combined with H2O (13.3 mL) and HCl(aq) (33.88 mL; 10.2 M) to create a higher concentration HCl(aq) stock solution that was 7 M in HCl(aq). Next, 241Am(aq) (0.05 mL, 20 μCi mL−1) in HCl(aq) (1 M) and 239Np(aq) (0.1 mL, 10 μCi mL−1) in HCl(aq) (1 M) were added to both the dilute elemental stock solution and the concentrated elemental stock solution. At this point, the dilute stock solution (total volume = 50 mL) contained HCl(aq) (0.1 M), stable elements and uranium (all at 5.56 ppm), 241Am (20 nCi mL−1), and 239Np (20 nCi mL−1). Similarly, the concentrated stock solution (total volume = 50 mL) contained HCl(aq) (7 M), stable elements and uranium (all at 5.56 ppm), 241Am (20 nCi mL−1), and 239Np (20 nCi mL−1).An additional point that is important to consider is associated with the 239Np activities. These values were reported at the time-point when 239Np(aq) had been separated from the 243Am parent on the 239Np(aq) generator. The short half-life [t1/2 = 2.356(3) day]3 associated with the 239Np radiotracer limited the shelf-life of these stock solutions. Hence, reuse of the stock solution required addition of fresh 239Np(aq) activity. While operating the generator, as described previously,16 care was also taken to avoid 243Am(aq) breakthrough while harvesting 239Np(aq) from the 241Am(aq). Any 243Am(aq) in the 239Np(aq) radiotracer will corrupt the Kd measurements. Finally, no 239Np valence adjustment was made prior to the Kd studies.
Aliquots (900 μL) from the dilute HCl(aq) stock solutions (described above) were added to the first family of Eppendorf tubes that contained dilute HCl(aq) and irradiated resins. Aliquots (900 μL) from the higher concentration HCl(aq) stock solutions (see above as well) were similarly added to the family of Eppendorf tubes that contained a higher concentration HCl(aq) (7 M) and irradiated resins. Then, the tubes were recapped tightly. Another important consequence associated with this procedure is that combining 900 μL of the stock solution with 100 μL of HCl(aq) associated with the resin mixture made the final stable element and uranium concentrations equal to 5 ppm for each Kd experiment. Consequently, the 241Am(aq) and 239Np(aq) concentrations were 18 nCi mL−1 and 18 nCi mL−1 in each tube, respectively.
The contents of each Eppendorf tube were agitated in a temperature-controlled and calibrated mixing block (25 °C, Eppendorf ThermoMixer F1.5). After >20 h, the mixtures were passed through syringe filters (4 mm, 0.45 μm diameter, Millex® FH, Hydrophobic Fluoropore). Caution! syringe filters can split and spay the acidic solution on the worker. Hence, a disposable paper towel (Kimwipe) was wrapped around the filter during the filtration as an engineering control that mitigated the hazard. After filtration, the metal abundances were quantified. For 241Am(aq) and 239Np(aq), an aliquot of the solution (700 μL) was diluted to 7 mL with 0.1 M HCl and assayed by γ-spectroscopy. The 239Np measurements were all decay corrected to the time point when 239Np(aq) was separated from 243Am(aq) on the 239Np(aq) generator. In contrast, stable element and uranium abundancies were determined using ICP-AES. The same dilutions and assays were performed for the ingoing solutions (prior to resin contact) in triplicate to verify that there was minimal error in pipetting and to gain confidence in our ability to reproduce γ-spectroscopy and ICP-AES analyses. We used eqn (3)
 | (3) |
 | (4) |
Resin loading capacity with large amounts of Nd and radiochemical quantities of 241Am
Similar to the Kd measurements, Eppendorf tubes (1.5 mL) were charged with irradiated resins (25 ± 5 mg). Several HCl(aq) (25 mL, 7 M) solutions were prepared that contained Nd3+(aq) (ranging 1 to 2.5 ppm) in the following way. A concentrated stock solution of Nd3+ (10 mg mL−1; 69.3 mM) was made by dissolving NdCl3·6H2O(s) (1.25 g, 4.64 mmol) in 50 mL of 7 M HCl. This solution was used to make 1 mg mL−1, 1.5 mg mL−1, 2 mg mL−1, and 2.5 mg mL−1 solutions by diluting aliquots of the Nd3+ stock solution (2.5 mL, 3.75 mL, 5 mL, and 6.25 mL) to 25 mL with HCl(aq) (7 M). We then added an aliquot of 241Am(aq) (25 μL, 19.67 μCi mL−1) that was in HCl(aq) (1 M) to each of these solutions. The resulting solutions contained 20 nCi mL−1 of 241Am(aq). They were then mixed by inverting the falcon tube 23 times and aliquots (1 mL) were added to each of the above-mentioned Eppendorf tubes. The resulting slurries were agitated (24 h) in a temperature-controlled and calibrated mixing block (25 °C, Eppendorf ThermoMixer F1.5). Then, the slurries were passed through syringe filters (4 mm, 0.45 μm diameter Millex® FR, Hydrophobic Fluoropore). Caution! syringe filters can split and spay the acidic solution on the worker. Hence, a disposable paper towel (Kimwipe) was wrapped around the filter during the filtration as an engineering control that mitigated the hazard. An aliquot (0.7 mL) of the filtrate was subsequently added to an HCl(aq) solution (6.3 mL, 0.1 M), which gave these final solutions a total volume of 7 mL. Metal abundancies were quantified by γ-spectroscopy [for 241Am(aq)] and ICP analysis (for Nd). Metal binding capacity was calculated using eqn (5), | (5) |
 | (6) |
Resin loading capacity with large amounts of americium
The ‘pristine’ resins were weighed out at 25 ± 5 mg in Eppendorf tubes and set aside. For comparison, resins that were irradiated (0 kGy (control, 25.5 kGy, 52.5 kGy, 74.8 kGy, 102 kGy, and 130 kGy) under high HCl(aq) conditions (7 M) were dried for a month under air. The drying process was confirmed by gravimetric analyses. These resins were then weighed (25 ± 5 mg) into twist-cap Eppendorf tubes and set aside. Meanwhile, an 243Am(aq) stock solution (1.59 mL, 21 mg mL−1, 1 M HCl) was evaporated to soft dryness using gentle heating on a hot plate and a stream of filtered air. Then 33.3 mg (0.138 mmol) of 243Am(aq) was dissolved in HCl(aq) (33.3 mL, 7 M) so that the resulting salmon-colored 243Am(aq) stock solution was 1 mg mL−1 in 243Am. This concentration was confirmed by γ-spectroscopy. Aliquots from this stock solution (1 mL) were added to the dry resins described above. The mixtures were shaken for 24 h. This slurry was then filtered, as described above (See Resin loading capacity with large amounts of Nd and radiochemical quantities of 241Am section), and aliquots (100 μL) of the filtrate were diluted with 0.1 M HCl(aq) (4.9 mL) to make the total volume of the solution 5 mL. The 241Am(aq) content was quantified using γ-spectroscopy and the 241Am(aq) binding capacity was calculated viaeqn (5). The resin capacity factor, k′, was calculated using a series of equations developed and described eloquently by Horwitz et al. that will be briefly described here.41 The Kd value, calculated using eqn (6), is converted to the volume distribution ratio, Kv using eqn (7). | (7) |
![[small script l]](https://www.rsc.org/images/entities/char_e146.gif) is the mass fraction of extractant. Lastly, Kv is converted to k′ using eqn (8)
is the mass fraction of extractant. Lastly, Kv is converted to k′ using eqn (8) | (8) |
Analysis of the ‘veteran’ resins used in CLEAR processing
The columns used in the CLEAR extraction chromatography (m-CMPOTBP) line were sampled by removing aliquots of resin from the second, third, and fourth columns in the processing line. The first column was not sampled because the estimated dose rate from the resin was too high to handle in open front hoods within a radiological facility. These resins were moved from the plutonium fabrication facility to a radiological laboratory where their chemical characteristics were characterized by IR, NMR, and SEM using the procedures described above for the 137Cs irradiated resins. Caution! handling 241Am(aq) solutions that contain organic solvents that permeate through gloves and skin (like the DMSO-d6 used for NMR) presents hazard for internal uptake of the 241Am radionuclide and its daughters. To mitigate the hazard, we implemented DMSO resistant gloves (Microflex neoprene and nitrile synthetic composite) and segregated trash that came into contact with DMSO.The 243Am(aq)Kd measurements made on ‘veteran’ resins were conducted as follows. Within a negative pressure glovebox, the ‘veteran’ resins were dried. Caution! manipulating dry resins that contain 241Am represents a substantial contamination hazard because of the ease at which dry resins can be dispersed. To mitigate this hazard, resins aliquots (30 ± 10 mg) were meticulously weighed in negative pressure gloveboxes and transferred in closed containers to a fume hood. Here, an HCl(aq) stock solution was added carefully (and slowly to avoid powder expulsion) to each ‘veteran’ resin. The stock solution contained 243Am(aq) (5 ng; 1 mCi) and the following elements that were 5 ppm (5 mg L−1) each (Al, Be, Ca, Ce, Co, Cr, Cu, Fe, Ga, K, Mg, Mo, Mn, Ni, Pb, Ti, U, V, Y, and Zn). The resulting slurries were agitated (24 h) in a temperature-controlled and calibrated mixing block (25 °C, Eppendorf ThermoMixer F1.5). Then, the mixtures were passed through syringe filters (4 mm, 0.45 μm diameter, Millex® FH, Hydrophobic Fluoropore). Caution! syringe filters can split and spay the acidic solution on the worker. Hence, a disposable paper towel (Kimwipe) was wrapped around the filter during the filtration as an engineering control that mitigated the hazard. After filtering, the samples were allowed to sit for 2 weeks to allow for ingrowth of the 243Am daughter (239Np). This pause in workflow was needed to account for the large amount of 241Am(aq) that was co-eluted with our 243Am(aq) analyte. The 241Am(aq) activity was so high that its γ-peak at 59 keV was not easily resolved from that associated with 243Am (at 74 keV). Hence, we quantified 243Am based on the γ-peak associated with its 239Np daughter (277 keV), which was well resolved and could be quantified with confidence. Note, after secular equilibrium between 243Am and 239Np is reached, the 243Am activity equals that from 239Np. Hence, after allowing 2 weeks for 239Np to reach secular equilibrium with 243Am, samples were filtered and Kd measurements made by γ-spectroscopy and ICP analyses, as described above for the 137Cs irradiated experiments.
SEM imaging
A small amount of sample was placed on carbon tape attached to an aluminum specimen mount (0.5 inch) for each sample. The mounts were placed within the Phenom XL sample holder and loaded into the SEM to measure baseline samples. Using Phenom software (version 5.4.5), the detector was set to BSD full under low to high vacuum depending on the nature of each sample. Images were captured using the high quality, 1024 resolution setting at 5 keV. Elemental analyses were performed using Phenom ProSuite Element Identification software (version 3.8.4.0). Size analyses were performed on pre-acquired images using Phenom ProSuite ParticleMetric software (version 1.2.1.0). As for Am-contaminated resin samples, these were analyzed with an FEI Quanta 250 SEM. Sample stubs were prepared by affixing a small amount of resin sample on carbon tape. The SEM chamber was evacuated to high vacuum conditions (∼10−2 Pa) and a high voltage of 2 keV was used to minimize degradation on resins during analysis. A secondary electron detector was solely used for this analysis (Table 2).| Parameter | Non-rad samples | ‘Veteran’ resins |
|---|---|---|
| Instrument | Phenom XL SEM | FEI Quanta 250 |
| Software | Phenom XL, v.5.4.5 | xT microscope server |
| Detector | BSD | SED |
| Vacuum | 1–60 Pa | 10−2 Pa |
| Voltage | 5 keV | 2 keV |
Conflicts of interest
There are no conflicts to declare.Acknowledgements
This research was supported by the U.S. Department of Energy Isotope Program, managed by the Office of Science for Isotope R&D and Production and the DE-SC0020189 for Colorado School of Mines. We also acknowledge the U.S. Department of Energy, Office of Science, Office of Basic Energy Sciences, Separation Science Program under contract number 2022LANLE3M1 for Los Alamos (Adelman) as well as the LANL LDRD-DR program (20220054DR; Arko). Los Alamos National Laboratory (LANL) is operated by Triad National Security, LLC, for the National Nuclear Security Administration of U.S. Department of Energy (Contract No. 89233218CNA000001).References
- R. J. Woods and A. K. Pikaev, Applied radiation chemistry: radiation processing, John Wiley & Sons, New York, NY, 1993 Search PubMed.
- M. Spotheim-Maurizot, M. Mostafavi, T. Douki and J. Belloni, Radiation Chemistry: From basics to applications in material and life sciences, EDP Sciences, Les Ulis, 2021 Search PubMed.
- National Nuclear Data Center, https://www.nndc.bnl.gov/nudat2/, (accessed 21 April 2021).
- K. Miyagawa, I. Mishima, T. Takeda and Y. Tanabiki, Trans. Iron Steel Inst. Jpn., 1969, 9, 285–296 CrossRef.
- M. L. Evett, S. R. Heng, L. K. Moutonnet and P. Nguyen, Field Estimation of Soil Water Content A Practical Guide to Methods, Instrumentation and Sensor Technology, International Atomic Energy Agency, VIENNA, Austria, 2008 Search PubMed.
- J. W. Nyhan, J. L. Martinez and G. J. Langhorst, Calibration of Neutron Moisture Guages and Their Ability to Spatially Determine Soil Water Content in Environmental Studies, Los Alamos, 1994 Search PubMed.
- J. F. Cameron and C. G. Clayton, Radioisot. Instrum., 1971, 55–248 CrossRef.
- E. Witkowska, K. Szczepaniak and M. Biziuk, J. Radioanal. Nucl. Chem., 2005, 265, 141–150 CrossRef CAS.
- E. R. Labelle and D. Jaeger, Croat. J. For. Eng., 2021, 42, 357–367 CrossRef.
- C. A. Mangeng and G. R. Thayer, Beneficial Uses of Am, Los Alamos, 1984.
- V. P. Guinn and C. D. Wagner, Anal. Chem., 1960, 32, 317–323 CrossRef CAS.
- B. Ozden, C. Brennan and S. Landsberger, Environ. Earth Sci., 2019, 78, 114, DOI:10.1007/s12665-019-8120-8.
- J. D. Bess, T. L. Maddock, A. T. Smolinski and M. A. Marshall, Nucl. Sci. Eng., 2014, 178, 550–561 CrossRef.
- K. S. Gardner, D. B. Kimball and B. E. Skidmore, Aqueous Chloride Operations Overview: Plutonium and Americium Purification/Recovery, Los Alamos, NM, LA-UR-16-27346, 2016.
- L. D. Schulte, Criteria Considered in Selecting Feed Items for Americium-241 Oxide Production Operations, Los Alamos, NM; LA-UR-15-20593, 2015.
- B. T. Arko, D. Dan, S. L. Adelman, D. L. Huber, D. B. Kimball, S. A. Kozimor, M. N. Lam, V. Mocko, J. C. Shafer, B. W. Stein and S. L. Thiemann, Ind. Eng. Chem. Res., 2021, 60, 14282–14296 CrossRef CAS.
- D. Christensen and P. Cunningham, Los Alamos National Laboratory for Lead Laboratory in Plutonium Pit Technology, Los Alamos, NM, LA-UR-92-1729, 1992.
- T. Feder, Phys. Today, 2015, 68, 22–24 Search PubMed.
- L. D. Schulte and S. D. Mckee, Application of extraction chromatography to actinide decontamination of hydrochloric acid effluent streams, Los Alamos, NM, LA-UR-961227, 1996.
- M. Barr, L. Schulte, G. Jarvinen, J. Espinoza, T. Ricketts, Y. Valdez, K. Abney and R. Bartsch, J. Radioanal. Nucl. Chem., 2001, 248, 457–465 CrossRef CAS.
- B. J. Mincher, S. P. Mezyk, G. Elias, G. S. Groenewold, A. Jay, M. Nilsson, J. Pearson, N. C. Schmitt, D. Richard and L. G. Olson, Solvent Extr. Ion Exch., 2014, 6299, 167–178 CrossRef.
- B. J. Mincher, S. P. Mezyk, G. Elias, G. S. Groenewold, C. L. Riddle and L. G. Olson, Solvent Extr. Ion Exch., 2013, 31, 715–730 CrossRef CAS.
- G. V. Buxton, C. L. Greenstock, W. P. Helman and A. B. Ross, J. Phys. Chem. Ref. Data, 1988, 17, 513–886 CrossRef CAS.
- H. A. Schwarz, J. Chem. Educ., 1981, 58, 101–105 CrossRef CAS.
- I. Draganic, The radiation chemistry of water, Elsevier, 2012, vol. 26 Search PubMed.
- S. Tachimori, J. Radioanal. Chem., 1979, 50, 133–142 CrossRef CAS.
- J. Mahaffey, Atomic accidents: A history of nuclear meltdowns and disasters: From the Ozark Mountains to Fukushima, Open Road Media, 2014 Search PubMed.
- B. J. Mincher, G. Modolo and S. P. Mezyk, Solvent Extr. Ion Exch., 2009, 27, 1–25 CrossRef CAS.
- B. J. Mincher, G. Modolo and S. P. Mezyk, Solvent Extr. Ion Exch., 2009, 27, 331–353 CrossRef CAS.
- D. Peterman, A. Geist, B. Mincher, G. Modolo, M. H. Galán, L. Olson and R. McDowell, Ind. Eng. Chem. Res., 2016, 55, 10427–10435 CrossRef CAS.
- D. Whittaker, A. Geist, G. Modolo, R. Taylor, M. Sarsfield and A. Wilden, Solvent Extr. Ion Exch., 2018, 36, 223–256 CrossRef CAS.
- C. Adam, N. Olga and L. Duane, Final Radiological Assessment of External Exposure for CLEAR-Line Americium Recovery Operations, Los Alamos, NM, LA-UR-13-28160, 2014.
- D. L. Clark, G. D. Jarvinen, C. Kowalczyk, J. Rubin and M. A. Stroud, Actinide Research Quarterly: Plutonium Processing at Los Alamos, https://www.lanl.gov/discover/publications/actinide-research-quarterly/pdfs/ARQ-2008-10.pdf.
- B. J. Mincher, L. R. Martin and N. C. Schmitt, Inorg. Chem., 2008, 47, 6984–6989 CrossRef CAS PubMed.
- M. S. Basunia, Nucl. Data Sheets, 2006, 107, 3323 Search PubMed.
- M. Yamaura and H. T. Matsuda, J. Radioanal. Nucl. Chem., 1999, 241, 277–280 CrossRef CAS.
- L. D. Schulte, J. R. FitzPatrick, R. R. Salazar, B. S. Schake and B. T. Martinez, Sep. Sci. Technol., 1995, 30, 1833–1847 CrossRef CAS.
- John G. Burr, Radiat. Res., 1958, 8, 214–221 CrossRef CAS PubMed.
- R. Flores, M. A. Momen, M. R. Healy, S. Jansone-Popova, K. L. Lyon, B. Reinhart, M. C. Cheshire, B. A. Moyer and V. S. Bryantsev, Solvent Extr. Ion Exch., 2022, 40, 6–27 CrossRef CAS.
- L. R. Morss, The Chemistry of the Actinide and Transactinide Elements, 2006 Search PubMed.
- E. P. Horwitz, D. R. McAlister and M. L. Dietz, Sep. Sci. Technol., 2006, 41, 2163–2182 CrossRef CAS.
- Eichrom Technologies Inc Our Products, eichrom.com/eichrom/products/, (accessed 7 July 2021).
- U. Mayer, V. Gutmann and W. Gerger, Monatshefte für Chemie/Chemical Mon., 1975, 106, 1235–1257 CrossRef CAS.
- M. A. Beckett, G. C. Strickland, J. R. Holland and K. Sukumar Varma, Polym. Int. J. Sci. Technol. Polym., 1996, 37, 4629–4631 CAS.
- J. J. Alexander, J. Chem. Educ., 1979, 56, 109 CrossRef.
- K. Troev, G. Grancharov, R. Tsevi and A. Tsekova, Polymer, 2000, 41, 7017–7022 CrossRef CAS.
- H. Galán, A. Núñez, A. G. Espartero, R. Sedano, A. Durana and J. de Mendoza, Proc. Chem., 2012, 7, 195–201 CrossRef.
- V. Mogilireddy, J. Huskens, W. Verboom, H. Gala, G. Modolo, A. Wilden, H. Schmidt, P. Guilbaud, N. Boubals, S. Michel, A. Leoncini, A. Nu and J. Cobos, New J. Chem., 2017, 41, 13700–13711 RSC.
- B. Y. Sugo, Y. Sasaki and S. Tachimori, Radiochim. Acta, 2002, 165, 161–165 CrossRef.
- B. J. Mincher and C. A. Zarzana, Hydrolysis and Radiation Chemistry of the DGAs, Idaho Falls, 2016 Search PubMed.
- S. A. Ansari, P. N. Pathak, V. K. Manchanda, M. Husain, A. K. Prasad and V. S. Parmar, Solvent Extr. Ion Exch., 2005, 23, 463–479 CrossRef CAS.
- B. W. Stein, S. A. Kozimor and V. Mocko, in Plutonium Handbook, ed. D. L. Clark, D. A. Geeson and R. J. Hanrahan Jr., Americal Nuclear Society, 2nd edn, 2019, vol. 6, pp. 2951–2956 Search PubMed.
- D. S. Hage and J. D. Carr, Analytical chemistry and quantitative analysis, Prentice Hall, Boston, 2011 Search PubMed.
- L. A. Currie, Anal. Chem., 1968, 40, 586–593 CrossRef CAS.
- K. M. Roscioli-Johnson, C. A. Zarzana, G. S. Groenewold, B. J. Mincher, A. Wilden, H. Schmidt, G. Modolo and B. Santiago-Schübel, Solvent Extr. Ion Exch., 2016, 34, 439–453 CrossRef CAS.
- R. B. Gujar, S. A. Ansari, A. Bhattacharyya, A. S. Kanekar, P. N. Pathak, P. K. Mohapatra and V. K. Manchanda, Solvent Extr. Ion Exch., 2012, 30, 278–290 CrossRef CAS.
- M. L. Dietz and E. P. Horwitz, Int. J. Radiat. Appl. Instrum., Part, 1992, 43, 1093–1101 CrossRef CAS.
- J. Ravi and B. R. Selvan, J. Radioanal. Nucl. Chem., 2014, 299, 879–885 CrossRef CAS.
- A. Wilden, B. J. Mincher, S. P. Mezyk, L. Twight, C. A. Zarzana, M. E. Case, M. Hupert, A. Stärk, G. Modolo, A. Wilden, B. J. Mincher, S. P. Mezyk, L. Twight, C. A. Zarzana, M. E. Case, M. Hupert and A. Stärk, Solvent Extr. Ion Exch., 2018, 36, 347–359 CrossRef CAS.
- C. A. Zarzana, G. S. Groenewold, B. J. Mincher, P. Stephen, A. Wilden, H. Schmidt, G. Modolo, J. F. Wishart and A. R. Cook, Solvent Extr. Ion Exch., 2015, 33, 431–447 CrossRef CAS.
- E. P. Horwitz, D. R. McAlister, A. H. Bond and J. E. Barrans, Solvent Extr. Ion Exch., 2005, 23, 319–344 CrossRef CAS.
- E. P. Horwitz, M. L. Dietz, D. M. Nelson, J. J. LaRosa and W. D. Fairman, Anal. Chim. Acta, 1990, 238, 263–271 CrossRef CAS.
Footnote |
| † Electronic supplementary information (ESI) available. See DOI: https://doi.org/10.1039/d2ma00859a |
| This journal is © The Royal Society of Chemistry 2023 |

