
 Open Access Article
 This Open Access Article is licensed under a
 Creative Commons Attribution 3.0 Unported Licence
Swimming against the current – sacrificing unit mass resolution in ICP-MS to improve figures of merit
David
Clases

Institute of Chemistry, University of Graz, 8010 Graz, Austria. E-mail: David.Clases@uni-graz.at
First published on 14th September 2023
Abstract
While quadrupoles provide unit mass resolution across the entire mass range, alternative analysers, (sector field and time-of-flight) were developed to increase mass resolution and to improve selectivity for interfered analytes. Increasing mass resolution is inherent with a loss in ion transmission and therefore, sensitivity is sacrificed in a trade-off for selectivity. In inductively coupled plasma-mass spectrometry (ICP-MS), the analysis of some elements may benefit from this increased selectivity, but many elements are not interfered, and their trace analysis would rather benefit from increased sensitivity. Performing low resolution ICP-MS can be achieved in the bandpass mode, in which scanning properties of the quadrupole are altered to boost ion transmission. The aim is to gain sensitivity at the expense of mass resolution and therefore selectivity. Here, unit mass resolution is deliberately given up to trigger two main effects: first, an increased bandwidth improves ion transmission for each isotope. Second, isotopic signals start to convolute and can be analysed at one point. This enables the simultaneous transmission and acquisition of isotopes from polyisotopic elements increasing sensitivity substantially. Both effects are cumulative and can enhance limits of analysis as long as potential interferences are considered and avoided. This perspective details technicalities, the potential, and pitfalls of the bandpass mode for ICP-MS. Applications and future potential are discussed for different hyphenated techniques and modes, namely LC-ICP-MS, LA-ICP-MS and SP ICP-MS. Distinct effects and strategies in the bandpass mode are detailed and provide options to develop dedicated methods tailored for certain elements, samples, and scientific questions. However, the loss of selectivity is inherent with a longer list of potential interferences, which is discussed for specific examples.
Introduction
Inductively coupled plasma-mass spectrometry (ICP-MS) was commercially introduced forty years ago and has undergone a remarkable transformation that was driven by new technologies and emerging topics. Different facets of ICP-MS have been developed and set new benchmarks for the detection of trace elements in various scientific disciplines as well as routine settings.1,2 Besides a large linear dynamic range paired with high detection power, one crucial advantage of ICP-MS is its compatibility with other technologies and the resulting versatility to tackle interdisciplinary questions. While in its stand-alone configuration it enables ultra-trace analysis of almost any element of the periodic table, ICP-MS provides the means to inquire individual species in conjunction with chromatographic techniques3 or the mapping of element distributions when hyphenated to laser ablation (LA).4 More recent facets are its so-called single particle (SP) mode and its application in the context of cytometry.2,5The limits of analysis for these techniques were gradually improved over the last four decades, which was driven by various technological innovations enhancing acquisition speed, ion focus and transport, suppression of interferences, vacuum, and mass analysers. Just like the improvement of figures of merit provided new opportunities to inquire questions which were originally beyond the scope of ICP-MS, further new scientific endeavours are now appearing at the horizon and are to be tackled next. This requires the pushing of limits of analysis beyond current benchmarks once again. One avenue to accomplish this is the improvement of ion transmission of currently employed mass analysers in ICP-MS. In a series of studies, we previously investigated the possibility to manipulate the quadrupole as the most frequently applied mass analyser in ICP-MS by increasing the mass bandpass above 1 amu. Altering the mass bandpass is inherent with changes in mass resolution and selectivity. When adapting both carefully, this “bandpass mode” can provide considerable improvements in the figures of merit.6–11
This perspective explains the concept and technicalities of the bandpass mode and demonstrates strategies and applications. The bandpass mode has a broad applicability in ICP-MS, but its utility is limited by interferences and the questions to be answered. Understanding it and predicting underlying effects requires a basic understanding of quadrupole theory, which will be reviewed qualitatively in the first part. Subsequently, two effects resulting from changed bandwidths will be showcased and discussed, while approaches to consider and tackle spectral interferences are highlighted. Finally, applications and the future potential of the bandpass mode are discussed.
The quadrupole basics
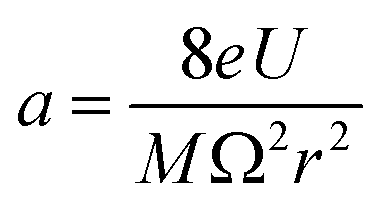
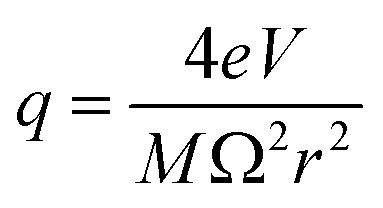
The quadrupole is the most frequently applied analyser in mass spectrometry which is often attributed to its affordability, small dimensions, and weight as well as its simple yet robust operation. It consists of four parallel metallic rods which are supplied with a combination of direct current (DC) voltage and a radio frequency (RF) voltage. An ion entering the quadrupole is influenced by the electric field generated at the rods and follows a specific trajectory which is depending on its mass (M) and charge. The trajectory can be described exactly by consideration of the Mathieu equations (eqn (1) and (2)) which are second order linear differential functions established in the 19th century and applied to numerous scientific questions. In quadrupole theory, these equations can be used to describe an ion's movement in x (eqn (1)) and y (eqn (2)) direction over time (ξ = Ωt/2). The terms a and q (eqn (3) and (4)) contain ion mass (M) electron charge e, DC and RF voltages (U, V), RF frequency Ω and the effective radius r between rods.12–14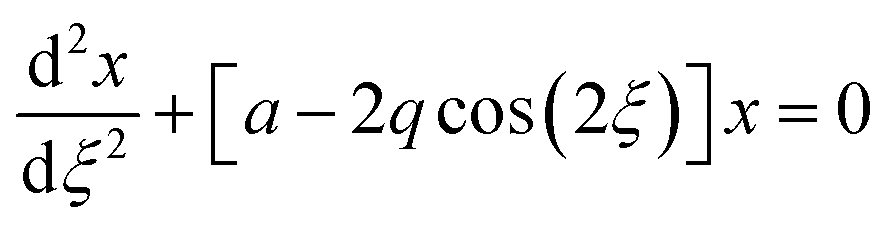 | (1) |
 | (2) |
 | (3) |
 | (4) |
The solution to these differential functions consists of an infinite number of sine and cosine functions and lead to the graphical solution, which is often preferred for educational purposes. To inquire settings for stable trajectories of an ion with a distinct mass-to-charge ratio (m/z) given in atomic mass units (amu) over the multiple integer (z) of e, the terms a and q can be substituted to plot a RF–DC voltage space for specific m/z known as Matthieu stability diagram shown qualitatively in Fig. 1A. Here, DC and RF voltages within red and blue boundaries indicate combinations resulting in a stable trajectory for a selected m/z in the y and x dimension, respectively. Given that an ion needs both a stable x and y trajectory, only zones where red and blue areas have a common overlap (yellow) lead to a transmission through the quadrupole. It is obvious that there are an infinite number of overlaps, which are called stability regions. Commonly, only the first stability region is used in mass spectrometry, which considers comparably small DC and RF voltages. The first stability region is symmetrical at the RF-axis and only the upper half is typically considered as shown qualitatively for three different m/z in Fig. 1B. Any combination of DC and RF voltages within this first stability region of a specific m/z leads to a stable trajectory through the quadrupole. However, when comparing three different ions with m/z a, b and c in Fig. 1B, it is evident that stability regions for different m/z have a common overlap. Therefore, depending on the choice of RF and DC voltage combinations, more than one m/z can be transmitted through the quadrupole. To maintain selectivity for conventional quadrupole applications, DC and RF voltages are carefully selected in the stability diagram of the targeted m/z to analyse only within areas where there is no overlap with stability regions from adjacent m/z. For classic quadrupole applications and specifically in ICP-MS, unit mass resolution is desired which means that mass peaks have approximately a width of 0.7–0.9 amu at 10% height. To achieve unit mass resolution across the entire mass range, DC and RF voltage combinations are located on one line, which is called scan line and truncates the tips of all stability regions (purple line in Fig. 1B). Here, a linear combination of RF and DC voltages is scanned across this line from low to high voltages to transmit sequentially low and high masses. In reality, a straight line does not achieve consistent unit mass resolution and commercial systems apply an error function which corrects deviations.
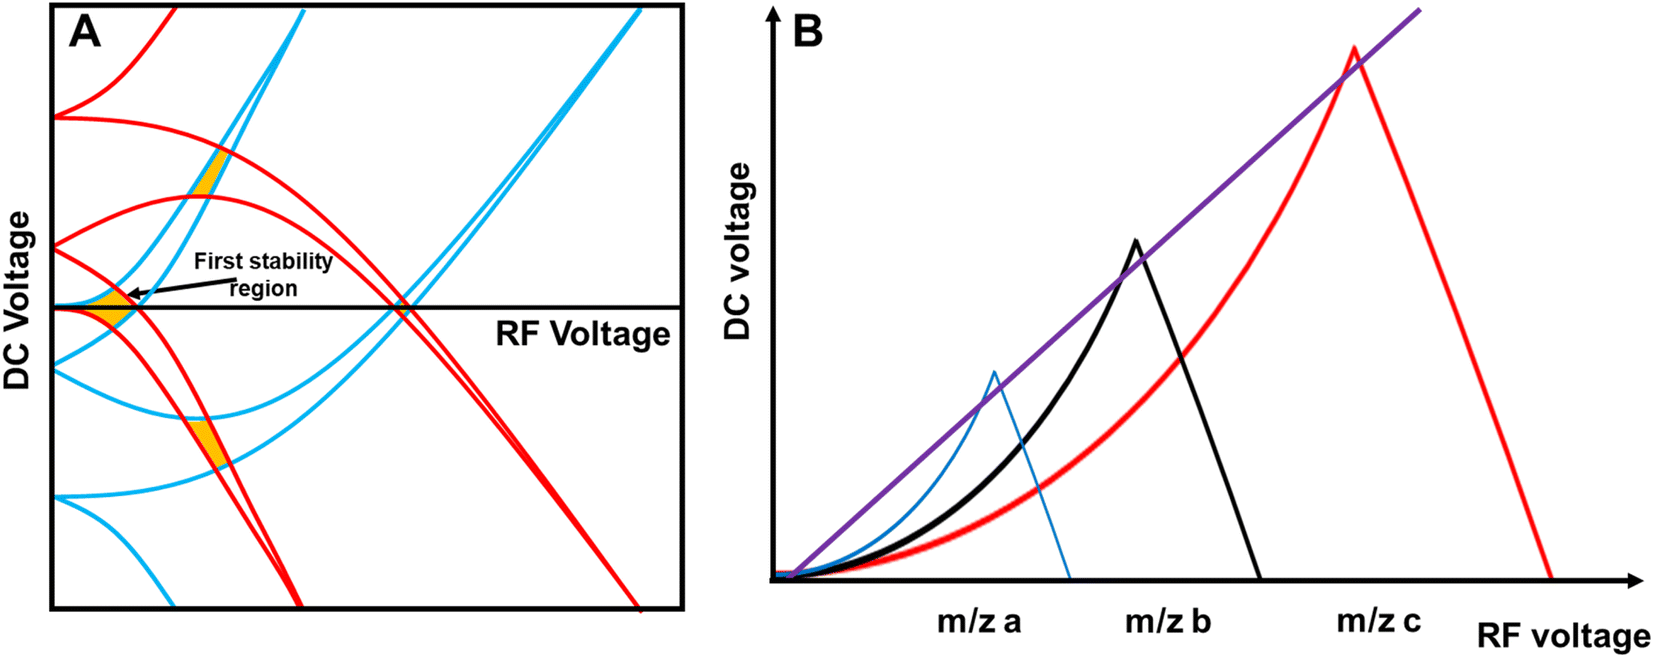 | ||
| Fig. 1 (A) Shows the Matthieu stability plot for one m/z. (B) Shows the first stability region for three different m/z. | ||
Theoretical and practical considerations for the bandpass mode
The position of the scan line is setting mass resolution and therefore the mass bandwidth. Lowering the scan line within a stability region is inherent with decreasing mass resolution but also with increasing the acceptance of the quadrupole and therefore ion transmission. As seen in Fig. 1B, stability regions are not symmetrical. This is consequently mirrored in the mass peaks, which is often not immediately visible when looking at rather sharp signals. However, increasing the bandpass for a m/z pronounces this feature and asymmetry becomes increasingly notable. Increasing ion transmission this way is exploitable in the so-called bandpass mode. Here, the scan line is deliberately altered to boost ion transmission (compare green scan line in Fig. 2A and E). Hence, the idea of the bandpass mode is a trade-off between selectivity and sensitivity or in other words, the sacrifice of (unit) mass resolution for ion transmission.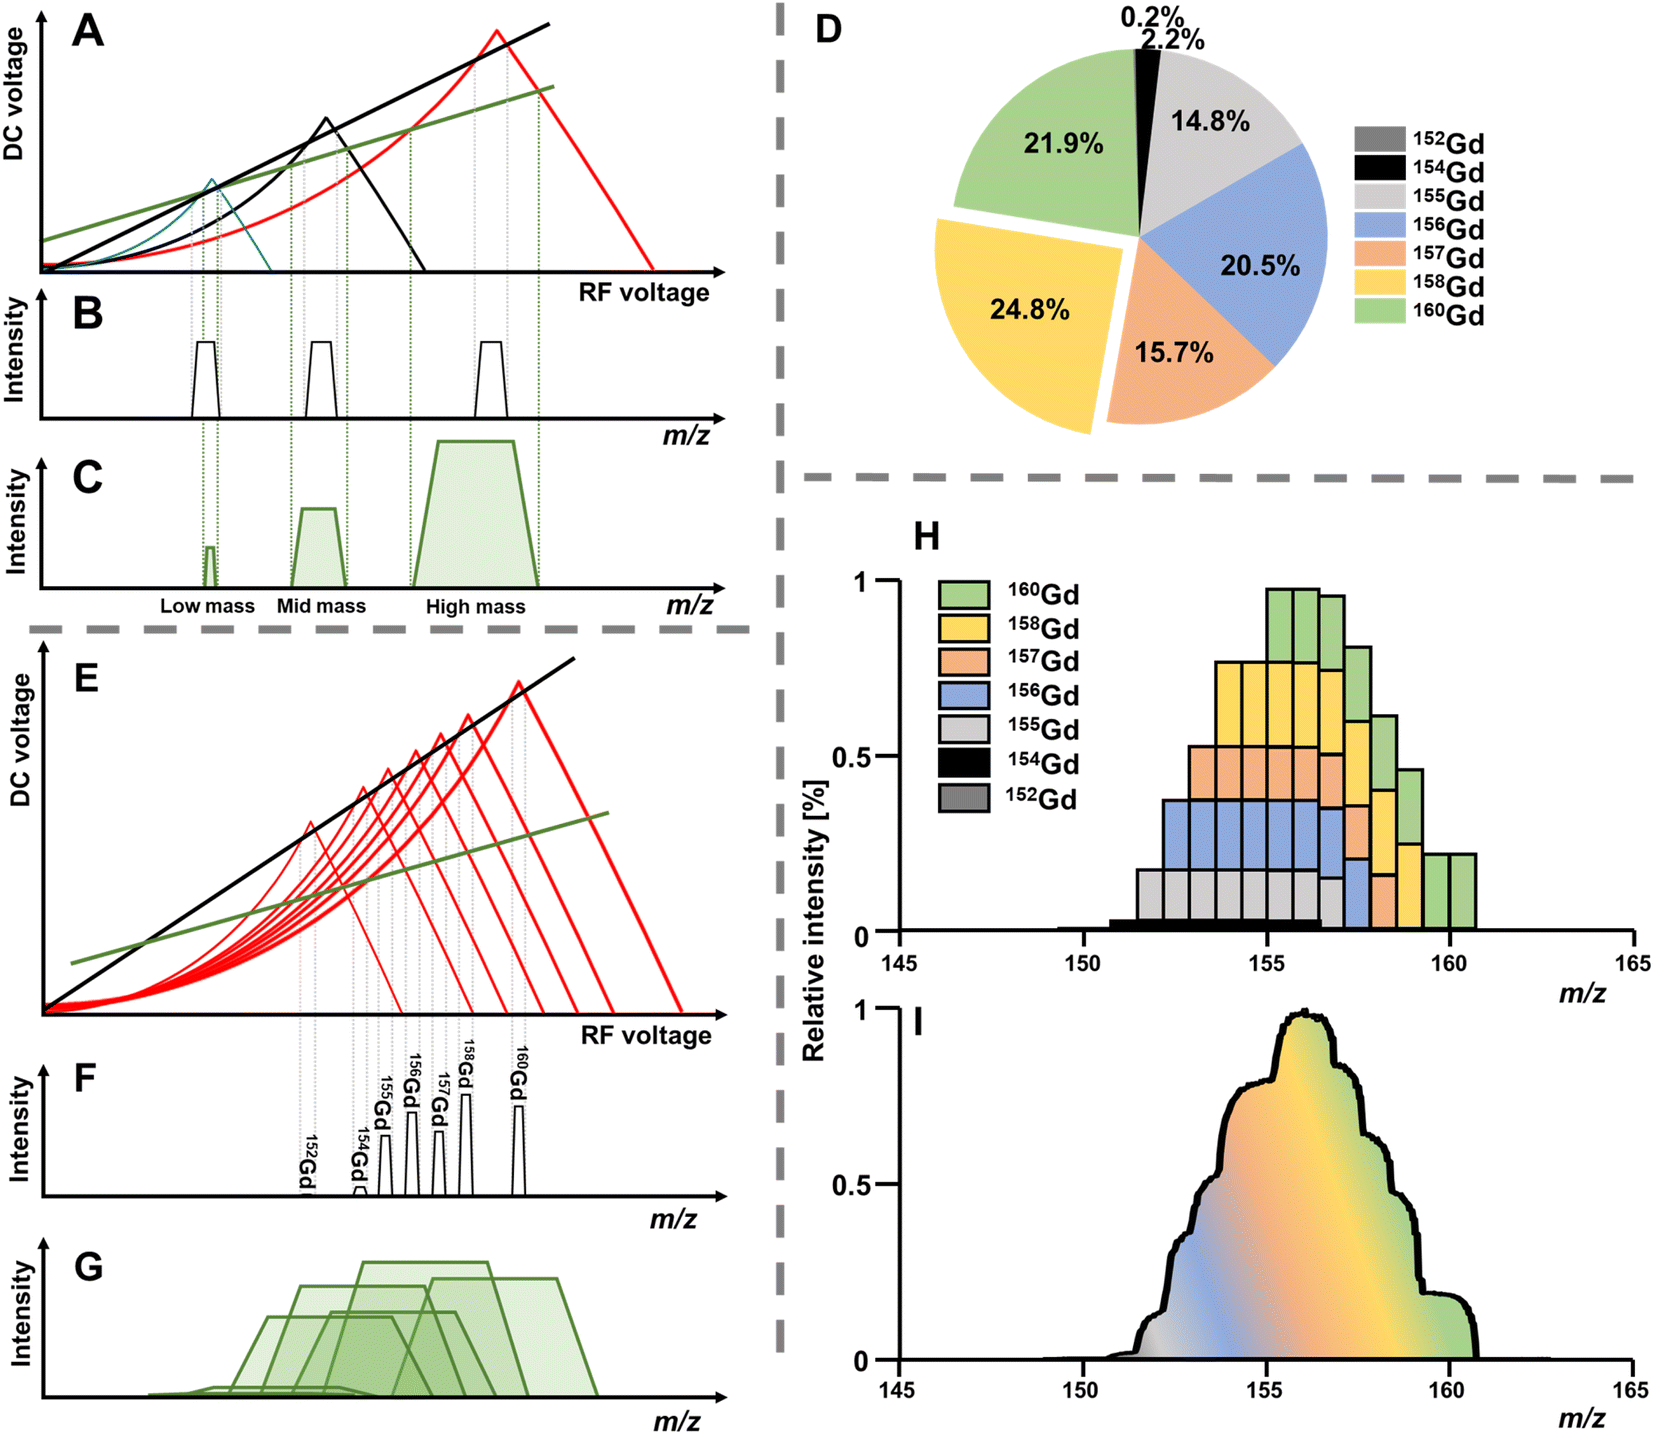 | ||
| Fig. 2 (A–C) Compare different scan lines and the resulting mass bandwidths and transmissions qualitatively for three different elements. The conventional method (unit mass resolution) is shown in black (B) and the bandpass mode in green (C). (D) Shows the isotopic abundance of Gd. (E–G) Compare the analysis of Gd via conventional ICP-MS and the bandpass mode qualitatively. While with normal resolution individual isotopes can be resolved (F), they convolute in the bandpass mode (G) and can be analysed simultaneously. (H) and (I) Show a simulated and experimental bandpass mode mass spectrum for Gd using a bandwidth of 8 amu, respectively. | ||
Practically, this can be done by identifying and altering instrumental parameters that set the resolution for the quadrupole, which will inevitably change the scan line function. The bandpass mode has been demonstrated on commercial platforms from three manufacturers so far and the amplification factor of ion transmission depends on the underlying instrumentation. For instruments from Agilent Technologies the “amu gain” and “amu offset” parameters were altered to increase mass bandwidths.6–8 For Thermo Fisher Scientific (iCAP Q)15 and PerkinElmer (NexION 300X)16 platforms, the scan line was altered by adapting the digital to analogue converter (“DAC”) value.
Effect 1: enhanced ion transmission of individual isotopes
The bandpass mode has two dominant effects which can result in enhanced sensitivity and limits of analysis. The first effect is apparent for any m/z: due to the enlarged mass bandwidth (and reduced mass resolution), a higher fraction of ions meets the criteria for a stable passage through the quadrupole which increases counting rates and therefore sensitivity. Fig. 3A shows the gradual increase of the mass bandwidth for the analysis of the monoisotopic Au from 1 amu (front) to approximately 10 amu (back) and demonstrates how sensitivity is increased, while resolution is decreased. The same effect is schematically shown in Fig. 2A–C. The relation between relative sensitivity and mass bandwidth is plotted in Fig. 3B and it is evident that transmission can be improved by more than 100% this way and that there is a non-linear relation between bandwidth and signal. The maximum signal enhancement is coupled to the properties of ion optics before and after the quadrupole and for this example, not much signal is gained after a bandwidth of 4 amu. | ||
| Fig. 3 (A) Shows that with decreasing mass resolution and increasing bandwidth, ion transmission and therefore sensitivity for the monoisotopic Au is enhanced. (B) Compares the relative signal increase when increasing peak width. (C) Compares the normalised intensities (on a log scale) when the bandwidth is increased. It can be seen that interferences start falling into the Au bandpass when resolution is progressively decreased. The resulting background may increase noise levels. | ||
For most applications, an increase in sensitivity is not as relevant as the enhancement of in signal to noise ratios, which ultimately define limits of analysis. This raises the question, whether the gain in transmission is translated into improved detection limits. Generally, increasing the mass bandpass is directly translated into improved signal to noise ratios for solutions containing only the targeted element. However, the assumption that samples are only containing one element is not practical and traces of other elements are ubiquitously abundant. Therefore, when opening the mass bandpass, adjacent elements need consideration and the question whether signal to noise ratios are improved depend on the mass bandwidth and the signal from adjacent elements/isotopes. Fig. 3C shows the analysis of a commercial Au standard for ICP-MS considering a mass range between 183 and 206 amu as well as different mass bandwidths. In this depiction, element signals project the shape of the Matthieu stability plots and the contours of 4 different isotopes are highlighted in blue. It is visible that next to a dominant Au signal, traces of Ir and Hg can be found. When increasing the bandwidth substantially, Ir and Hg can be considered spectral interferences and fall into the mass bandpass of Au increasing background and noise. For example, when analysing Au at 197 amu, the 202Hg signal starts interfering at a mass bandwidth of approximately 6–7 amu. Therefore, the answer to whether the bandpass mode increases signal to noise ratios is depending on the signal and noise generated by adjacent elements. Hence, the bandpass should be adapted carefully: if signals of adjacent elements fall within the bandwidth of the targeted element, it should be evaluated whether further gain in sensitivity compensates increasing noise levels.
Effect 2: isotope convolution
In molecular MS, a plethora of molecular species is often present across the mass range and may have non-integer m/z due to the accumulating mass defect in molecules. Here, technologies to increase mass resolution and therefore selectivity are in high demand. In elemental MS, the situation is somewhat different; mass defects are little pronounced and do not accumulate as solely elemental cations are monitored. Additionally, interferences are somewhat predictable or manageable as will be discussed later. Besides the increase in transmission for individual isotopes (effect 1), a second effect can contribute substantially to increased sensitivities and is apparent for elements with more than one isotope. Giving up unit mass resolution of a quadrupole leads to the possibility to sample two or more isotopes simultaneously although it is not possible anymore to differentiate between them. Therefore, convoluting isotopic signals and acquiring them simultaneously leads to a higher elemental fraction analysed and consequently to a higher elemental sensitivity. The more isotopes these elements have and the more evenly they are distributed, the more recognizable is this signal amplification. Fig. 2A–C qualitatively show the association between increasing bandwidths and sensitivity (effect 1) for elements from three different mass ranges. While elements with large mass differences can still be distinguished, the situation is different for elements with similar masses and especially for isotopes of the same element. This shall be further discussed for the element Gd, for which the isotopic abundance is shown in Fig. 2D. Operating a quadrupole with unit mass resolution (black scan line) leads to a mass spectrum as visible in Fig. 2F. While isotopes can be distinguished from each other, more than 75% of Gd isotopes are ejected from the quadrupole if only the most abundant isotope is monitored. When switching into the bandpass mode (green scan line), unit mass resolution is lost, and isotopic signals start to convolute (Fig. 2G) and are transmitted coincidentally. Consequently, more ions can be counted at the detector and signal is improved substantially. The simultaneous sampling of two or more isotopes is an additive effect and signal gain is depending on relative isotopic abundances. The resulting bandpass signal is simulated for Gd in Fig. 2H and the contribution from different isotopes to the overall Gd signal is indicated. Fig. 2I shows an experimental spectrum of Gd in the bandpass mode. In this case, a bandwidth of 8 amu enabled the analysis of all Gd isotopes simultaneously and increased sensitivity by approximately factor 4 relative to the most abundant 158Gd.This second effect is pronounced for elements with a broad and even isotopic distribution. However, it shall be emphasised that potential interferences must be considered very carefully, especially in the low- and mid-mass range. Fig. 4 predicts the effect of isotope convolution (effect 2) for ICP-MS-compatible elements using a mass bandpass of 9 amu (effect 1 is not considered for simplicity). Here, only elements which yield at least 25% signal enhancement through isotope convolution were considered and the maximum enhancement is expected to be approximately 400% for elements such as Sm, Gd and Mo. The factors of enhancement are illustrated in Fig. 4B.
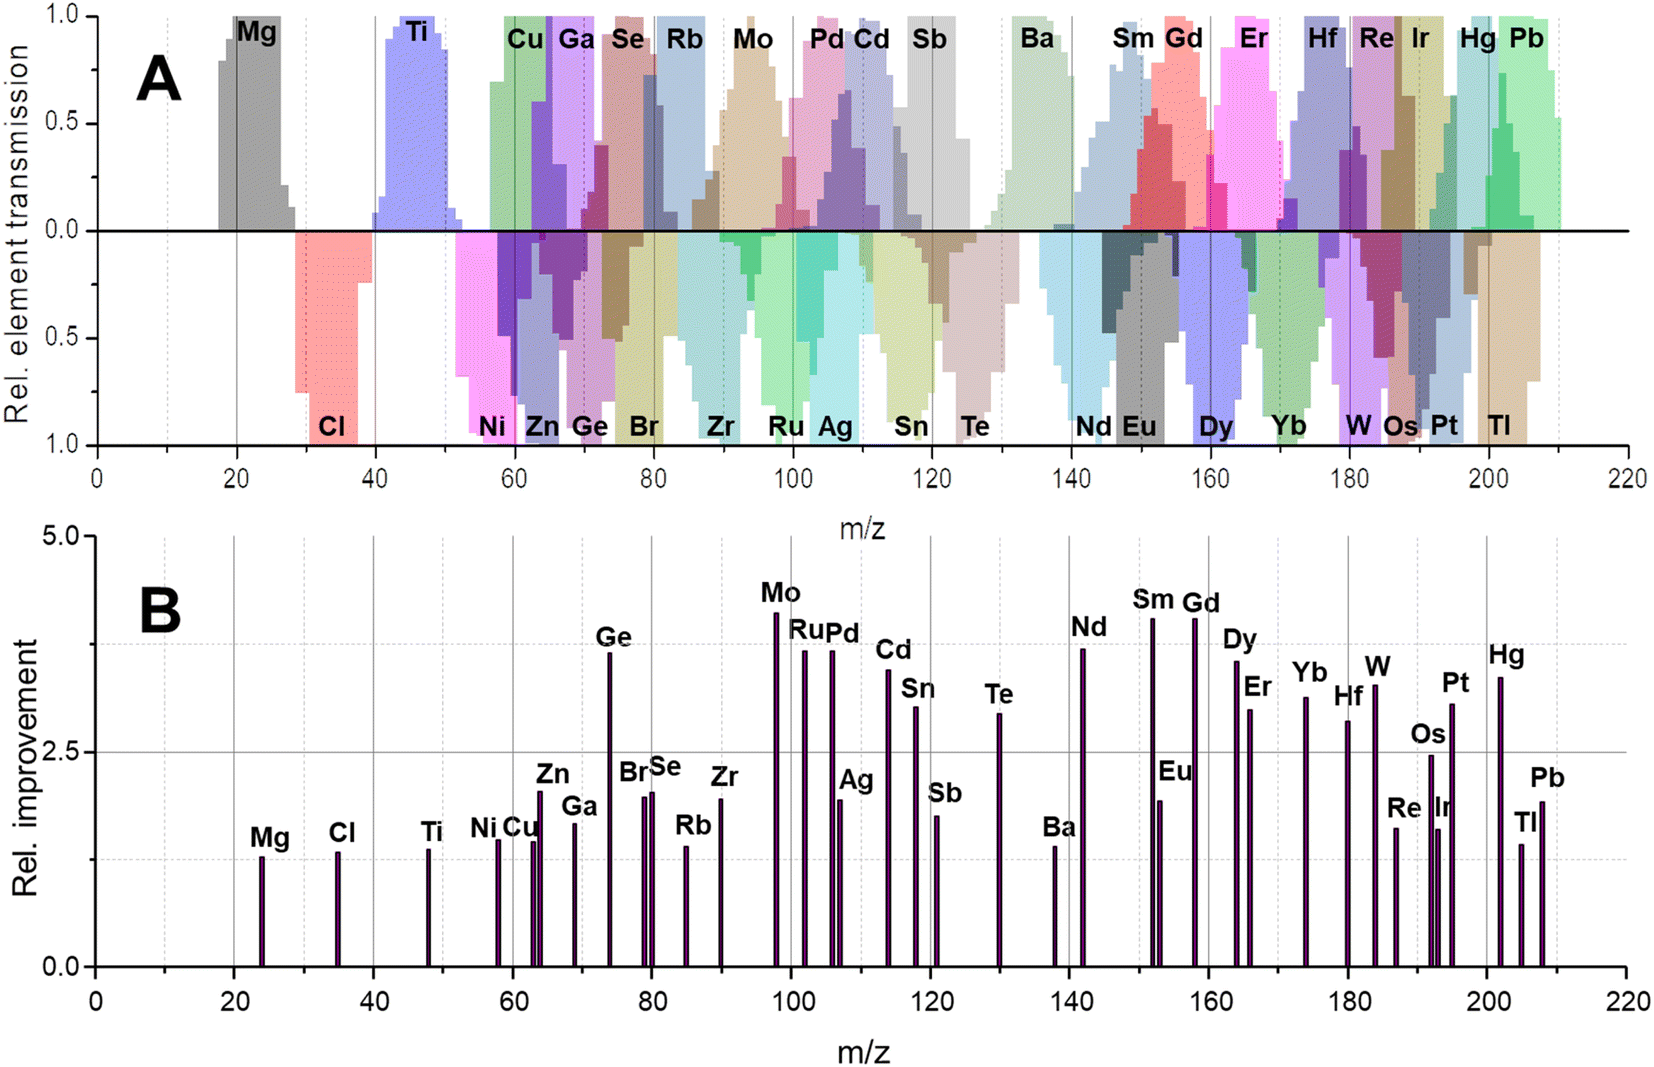 | ||
| Fig. 4 (A) Displays the bandpass signal for ICP-MS compatible elements, which yield at least 25% signal increase through isotope signal convolution (effect 2). The expected signal increase factors are given in (B). | ||
In conclusion, opening the mass bandwidth results in two distinguishable effects: first, the increasing bandwidth results in enhanced ion transmission for each individual isotope. Second, isotopic signals from polyisotopic elements convolute which enables the sampling of several isotopes with one quadrupole setting. These two effects are occurring simultaneously and can increase sensitivity by one order of magnitude depending on the chosen instrumentation, bandwidth and isotopic abundances of the targeted element. Ion transmission can further be improved via the choice and settings of ion optics as previously shown.7
Spectral interferences
In the presence of spectral interferences, the loss of unit mass resolution can be a pitfall for certain applications and elements. For example, using the bandpass mode to target elements with masses in the proximity of prominent polyatomic interferences (e.g., Ti and Se) may require very careful adjustment and should be avoided for less experienced users to ensure the absence of Ar-based interferences and to avoid damaging the detector. However, especially in the high mass region, polyatomic interferences are scarce and even the abundance of isobaric spectral interferences can be predicted, evaluated on-site and/or eliminated. One way to recognise interferences in bandpass mode is the concurrent analysis of signals adjacent to the bandpass signal as shown in Fig. 5 for Gd. If abundant at significant levels, it is possible to correct interferences by taking natural isotope abundances of adjacent elements into account and deconvoluting the signal contribution mathematically. For example, when analysing Gd in bandpass mode at 156 amu (red arrow), 161 amu can be monitored additionally (black arrow). Using a bandwidth of 9 amu would suggest a signal ratio of approx. 4.55 and lower values would indicate a signal contribution from either Er, Dy or Tb. Knowing the natural isotopic abundance and probing other masses (e.g., purple arrows) allow the estimation of respective signal contributions for a subsequent correction. As mentioned before, it should be kept in mind that mass signals are asymmetric, which means that elements slightly heavier than the targeted element may impact analysis more severely than lighter elements. Analysing Gd at 156 amu in bandpass mode (9 amu) requires considerations which elements and isotopes can potentially interfere. The 162Dy isotope will for example generate a signal spanning from 156 to 164 amu and is therefore a potential interference that needs to be taken into account. However, the isotope 153Eu creates a signal spanning from 147 to 155 amu and does not interfere (compare blue arrow in Fig. 5 for orientation).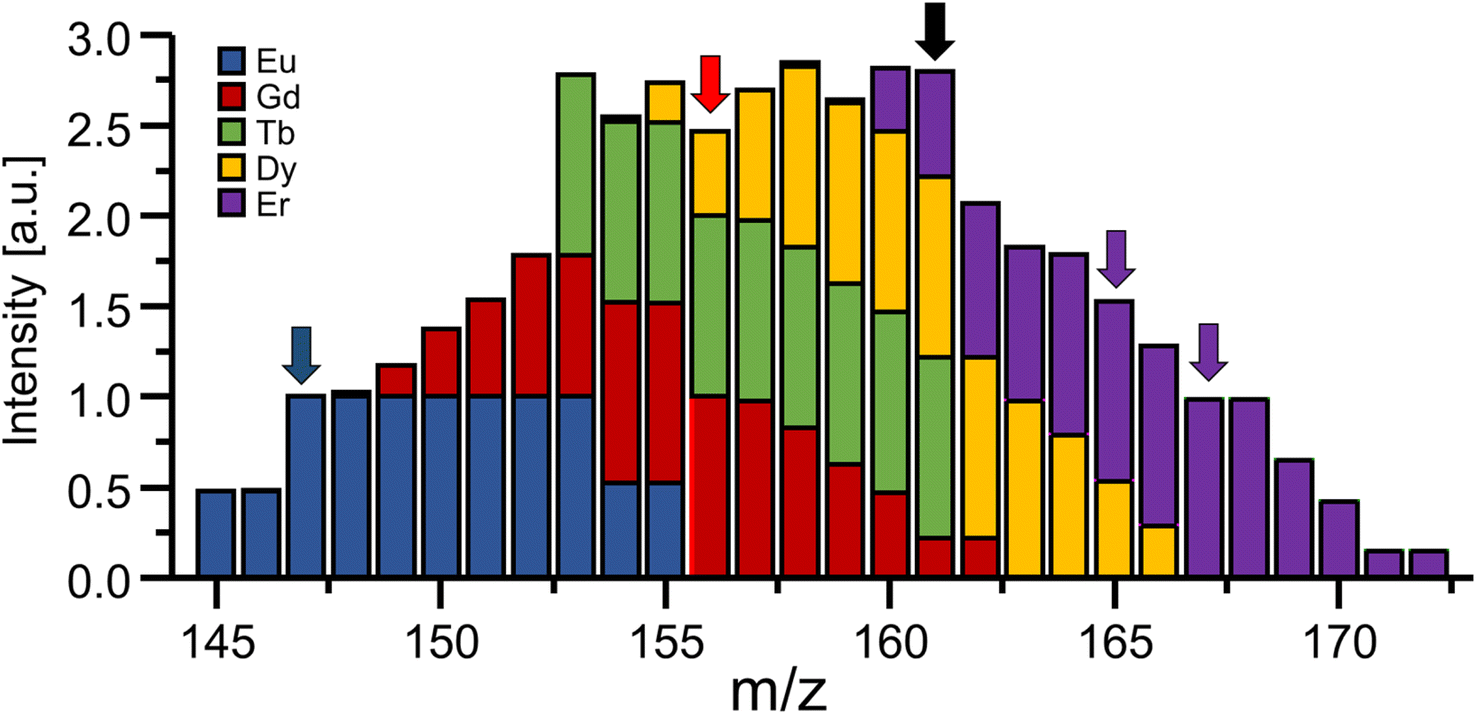 | ||
| Fig. 5 The large mass bandwidths may result in the accidental analysis of elements with overlapping bandpass signal. This needs to be considered to enable accurate analysis and can be done by monitoring adjacent mass signals. When analysing Gd at 156 amu (red arrow), other elements can be analysed (e.g., black arrow at 161 amu) and their signal proportion can be taken into account to consider and eliminate interferences. | ||
As shown in Fig. 3, traces of adjacent elements as well as noise levels in surrounding mass regions can potentially influence the analysis when increasing the bandpass. While sensitivity increases, noise levels can increase concomitantly and counteract efforts to enhance overall figures of merit. Therefore, the bandpass should be increased empirically and signal to noise ratios should be monitored closely. Largest improvements in figures of merits are expected in cases, where interferences are mostly absent due to natural or experimental circumstances. For example, Gd is often inquired in the context of the anthropogenic Gd anomaly or MRI applications.17 Here, Gd occurs at substantially elevated levels and other lanthanides are only expected at background levels. Especially in cases where a chromatographic method (e.g., liquid chromatography (LC)) is used prior to ICP-MS, interferences are separated and elute at distinguishable retention times. Alternatively, the presence of interreferences can be confirmed and compensated using previous screenings, suited sample preparation techniques (e.g., solid phase extraction)8 and methods for a collision/reaction cell.18
Besides Eu, Tb, Dy and Er, which may directly interfere with the analysis of Gd in the bandpass mode, lighter rare earth elements such as Ce or Nd may form polyatomic interferences (e.g., oxides) which fall into the acquired mass bandpass. Polyatomic interferences can best be controlled during method development (plasma parameters) as well as through the use of a collision/reaction cell. The latter offers distinct modes to harness either chemical or physical processes to eliminate interferences. As a RF-only multipole that is pressurised with specific gasses or gas mixtures, it is situated before a quadrupole to increase elemental selectivity by eliminating interference via strategies such as kinetic energy discrimination, molecular fragmentation, charge transfer or exploiting chemical affinities.14,19–21
Signal to noise ratios
The concurrent amplification of noise and signal is defining the detection limits. However, the amplification of both is not proportional and occurs at different rates. This shall be exemplified in single particle (SP) ICP-MS. In SP mode, particles are individually introduced into the plasma and detected as discrete pulses at the detector. Short SP signals are superimposed by a continuous ionic signal which in the bandpass mode is amplified at the same rate. This raises the question, whether an increase in sensitivity through the large bandpass results in overall improved figures of merit (SP mass- and size detection limits). Fig. 6 shows a scenario, in which SnO2 is analysed. Sn has a broad isotopic distribution comprising of 10 isotopes with abundances of up to 32.58% (120Sn). Consequently, when performing SP analysis using a quadrupole with unit mass resolution, more than two thirds of all Sn isotopes are readily eliminated by the quadrupole before a SP signal is detected. Convoluting isotopic signals through the bandpass mode provides the opportunity to harness this otherwise lost fraction. For simplicity, Fig. 6 only considered isotopic convolution (effect 2) for signal amplification. The ionic background for the Sn isotopes and their sum can be seen on the x-axis and it is clear that background levels correlate positively with both decision limits and relative sensitivity (left and right y-axis, respectively). The decision limit refers here to the signal threshold required to identify a SP event with a certainty of 1-α and is governed by Poisson statistics.22,23 Limits were calculated for different α values using an approach by Nicholson24,25 according to eqn (5).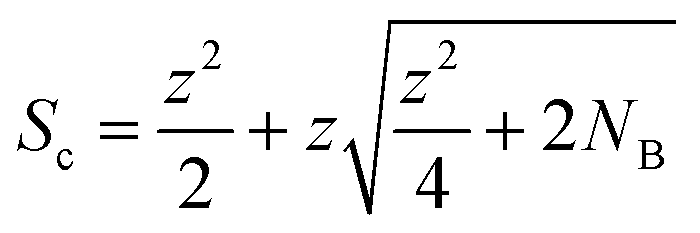 | (5) |
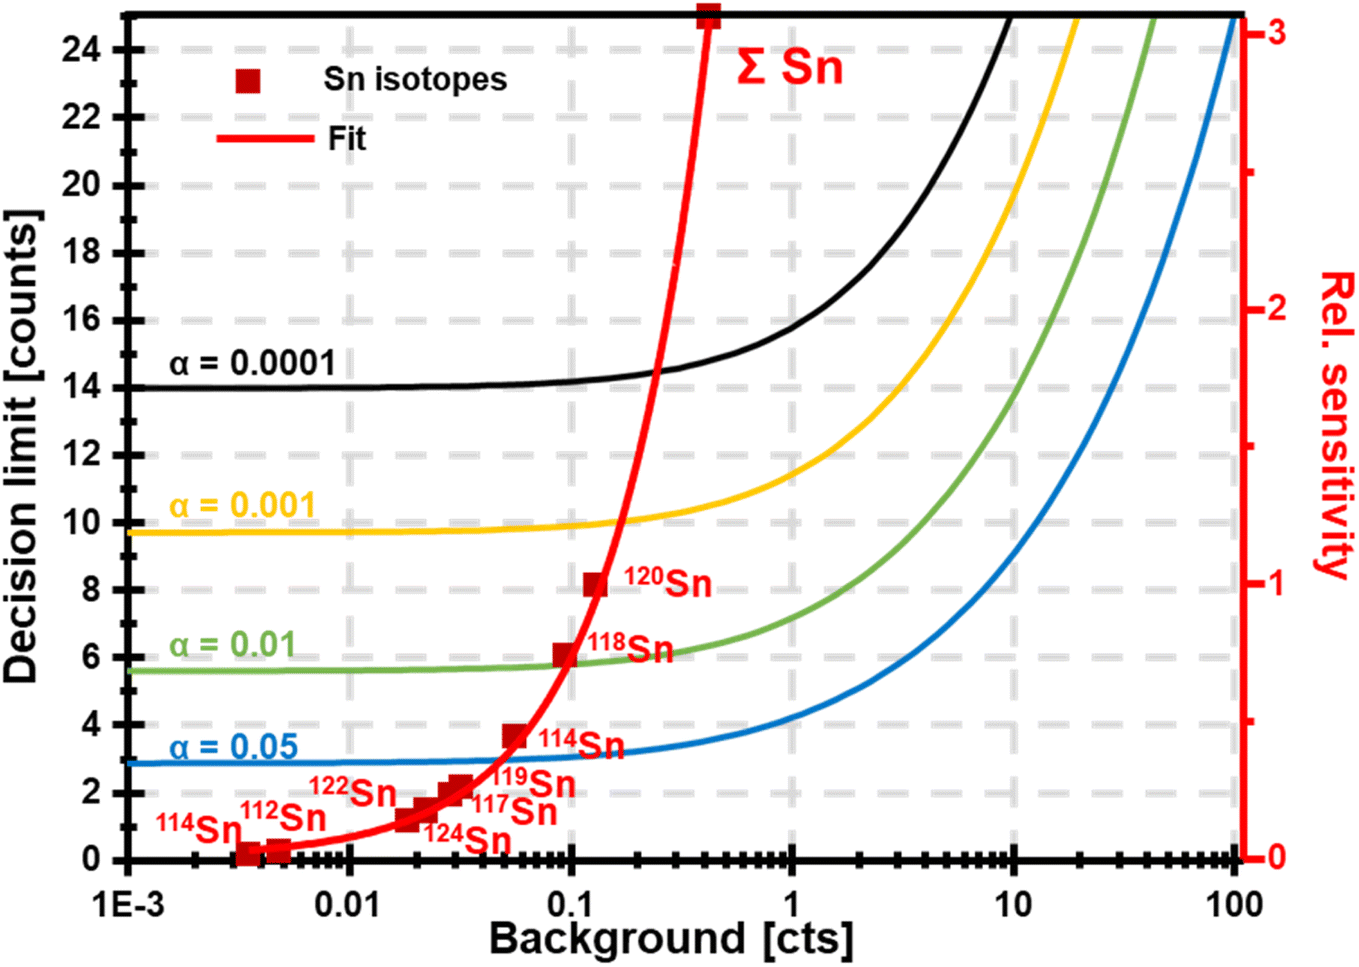 | ||
| Fig. 6 Sensitivity is dependent on the fraction of Sn analysed. Considering abundant Sn isotopes or the sum of Sn isotopes increases sensitivity. However, concomitantly, decision limits increase due to increasing background signals. It is visible that sensitivity grows more rapidly than decision limits, which provides the opportunity to enhance detection limits through the bandpass mode. | ||
Applications and potential
 | ||
| Fig. 7 (A) Shows the intensity measured for four Gd-based contrast agents separated via HILIC-ICP-MS and detected once in bandpass mode (blue) and with a conventional method (orange). Reproduced from Horstmann et al. with permission from the Royal Society of Chemistry.8 B shows the performance of the bandpass mode by targeting Yb contained in UCNPs via SP ICP-MS. Applying the bandpass mode enabled the resolution of particle signals from background and noise unlike a method with unit mass resolution. Adapted with permission from Meyer et al.7 Copyright 2020 American Chemical Society. | ||
Besides Gd, there is a range of elements which are frequently interrogated regarding their speciation and the bandpass mode may improve limits of analysis. This includes for example, Hg-, Pb-, Sn-, and Se-species. However, for the latter the Ar2+ interferences need to be considered carefully.
Besides improving the analysis of small and heterogenous particles, the bandpass mode can improve NP screenings with quadrupoles. Identifying particulate elements in quadrupole-based SP ICP-MS is challenging as each element needs to be acquired for a certain amount of time before scanning the next. This means that scanning through the mass range is time and sample consuming. We have previously used the bandpass mode to define larger mass windows, which can be moved about four times faster through the upper mass range to identify SP data structures. When detecting SP pulses, unit mass resolution was reestablished to identify the particulate element.9
In a recent application by Bazo et al.,16 the bandpass mode was employed for internal standardisation in SP ICP-MS. Here, the bandwidth was chosen large enough to detect Au and Pt isotopes at the same time. Previous investigations of the individual Au and Pt NP responses enabled a differentiation between Au and Pt when using the bandpass mode. Therefore, spiking an Au dispersion with a Pt NP standard (and vice versa) enables to monitor and compensate drift effects.
Previously, the bandpass mode has been demonstrated to map a lanthanide label conjugated to an antibody.6 In this immunohistochemistry-assisted LA-ICP-MS approach, the lanthanide was used as a proxy for the antibody's target and following the incubation on tissue, LA-ICP-MS was used to inquire the spatial distribution of the label.2,4 Both high sensitivity and high spatial resolution are often required to target specific biomarkers in highly compartmentalised structures. Provided that labels do not produce overlapping signals, the bandpass mode may improve contrasts. Fig. 8 shows an example where endogenous elements were targeted together with Yb which was used as antibody label to inquire the distribution of a specific protein (tyrosine hydroxylase) in murine brain.6 Alas, transition elements are not easy to target with a large bandpass due to highly abundant polyatomic and isobaric interferences. To enable the joint analysis of both endogenous elements and the high-mass labels used for antibody tagging, a bandpass drift was induced. Here, the y-intercept and slope of the scan line was adapted in a fashion that provided the bandpass effects in the high mass range, unit mass resolution in the mid mass range and higher mass resolution in the low mass range. Fig. 8A shows the stability regions for a low, mid and high m/z and the qualitative positioning of the scan line. Below is the resulting mass spectrum and mass signal widths were determined at 10% signal height to be approximately 0.3 amu for low mass elements like P, 0.6–0.9 amu for mid mass elements such as Mn, Fe, Cu and Zn, and 3.7 amu for high mass elements such as Yb. Interestingly in this case, the labelled Yb was isotopically enriched to 94% and employing Yb with a natural abundance would have resulted into larger peak widths (at 10% height) and into more dramatic improvements relative to a standard method. Fig. 8C and D compare a standard method with the bandpass mode and the latter improved sensitivity and contrast substantially. Fig. 8E and F show the joint analysis of Fe and Yb in murine brain for a correlative study by merging maps (E) and by forming the product of both elemental signals (F).
 | ||
| Fig. 8 (A) Shows a scan line that was set to induce a bandwidth drift across the mass range. High m/z were analysed in bandpass mode, mid m/z were analysed with unit mass resolution, and low m/z were analysed with increased mass resolution (B). (C) and (D) Compare the image contrast when using a standard method and the bandpass mode, respectively. (E) and (F) Demonstrate that bandpass signals can be analysed together with elements recorded with unit mass resolution. Here, Yb and Fe were analysed in murine brain sections. The red box indicated the substantia nigra. Reproduced from Clases et al. with permission from the Royal Society of Chemistry.6 | ||
Conclusions
While in some areas of application high resolution mass spectrometry is advantageous, considering low mass resolution analysis can be useful for ICP-MS and its associated techniques. The manipulation of the scanning properties of the quadrupole can be translated into higher sensitivities. Decreasing the mass resolution below unit mass resolution by adapting the quadrupole's scan line enables to harness two distinct effects. The first effect is visible for any elemental ion and is the consequence of a larger mass bandpass resulting in increased ion transmission. The second effect is recognisable when analysing polyisotopic elements and boosts transmission additionally. Here, low mass resolution causes a convolution of isotopic signals which consequently can be analysed simultaneously. The mass bandwidth can be adapted to analyse all isotopes of an element at the same time and together with effect 1, this results in significant signal improvements. However, besides sensitivity, noise can be amplified, and both have to be balanced to achieve improved figures of merit. When spectral interferences are carefully considered, increased sensitivities can provide advantages in various facets of ICP-MS including LC-, LA- and SP ICP-MS.Conflicts of interest
There is no conflict of interest.Acknowledgements
The financial support by the University of Graz is acknowledged.References
- D. Clases and R. Gonzalez de Vega, Facets of ICP-MS and their potential in the medical sciences—Part 1: fundamentals, stand-alone and hyphenated techniques, Anal. Bioanal. Chem., 2022, 414, 7337–7361 CrossRef CAS PubMed.
- D. Clases and R. Gonzalez de Vega, Facets of ICP-MS and their potential in the medical sciences—Part 2: nanomedicine, immunochemistry, mass cytometry, and bioassays, Anal. Bioanal. Chem., 2022, 414, 7363–7386 CrossRef CAS PubMed.
- D. P. Bishop, D. J. Hare, D. Clases and P. A. Doble, Applications of liquid chromatography-inductively coupled plasma-mass spectrometry in the biosciences: a tutorial review and recent developments, TrAC, Trends Anal. Chem., 2018, 104, 11–21 CrossRef CAS.
- P. A. Doble, R. Gonzalez de Vega, D. P. Bishop, D. J. Hare and D. Clases, Laser Ablation-Inductively Coupled Plasma-Mass Spectrometry Imaging in Biology, Chem. Rev., 2021, 121, 11769–11822 CrossRef CAS PubMed.
- B. Meermann and V. Nischwitz, ICP-MS for the analysis at the nanoscale – a tutorial review, J. Anal. At. Spectrom., 2018, 33(9), 1432–1468 RSC.
- D. Clases, R. Gonzalez de Vega, S. Funke, T. E. Lockwood, M. Westerhausen and R. V. Taudte, et al., Matching sensitivity to abundance: high resolution immuno-mass spectrometry imaging of lanthanide labels and endogenous elements in the murine brain, J. Anal. At. Spectrom., 2020, 35, 728–735 RSC.
- S. Meyer, R. Gonzalez de Vega, X. Xu, Z. Du, P. A. Doble and D. Clases, Characterization of Upconversion Nanoparticles by Single-Particle ICP-MS Employing a Quadrupole Mass Filter with Increased Bandpass, Anal. Chem., 2020, 92(22), 15007–15016 CrossRef CAS PubMed.
- M. Horstmann, R. Gonzalez de Vega, D. P. Bishop, U. Karst, P. Doble and D. Clases, Determination of Gadolinium MRI contrast agents in fresh and oceanic waters of Australia employing micro-solid phase extraction, HILIC-ICP-MS and bandpass mass filtering, J. Anal. At. Spectrom., 2021, 36, 767–775 RSC.
- R. Gonzalez de Vega, T. E. Lockwood, X. Xu, C. Gonzalez de Vega, J. Scholz and M. Horstmann, et al., Analysis of Ti- and Pb-based particles in the aqueous environment of Melbourne (Australia) via single particle ICP-MS, Anal. Bioanal. Chem., 2022, 414, 5671–5681 CrossRef CAS PubMed.
- D. P. Bishop, D. Clases, F. Fryer, E. Williams, S. Wilkins and D. J. Hare, et al., Elemental bio-imaging using laser ablation-triple quadrupole-ICP-MS, J. Anal. At. Spectrom., 2016, 31(1), 197–202 RSC.
- D. Clases, R. Gonzalez de Vega, J. Parnell and J. Feldmann, Fluorine Mapping via LA-ICP-MS/MS: A Proof of Concept for Biological and Geological Specimens, J. Anal. At. Spectrom., 2023, 38, 1661–1667 RSC.
- J. E. Campana, Elementary theory of the quadrupole mass filter, Int. J. Mass Spectrom. Ion Phys., 1980, 33(2), 101–117 CrossRef CAS . Available from: https://www.sciencedirect.com/science/article/pii/0020738180800428.
- P. E. Miller and M. B. Denton, The quadrupole mass filter: basic operating concepts, J. Chem. Educ., 1986, 63(7), 617 CrossRef CAS.
- P. H. Dawson, Quadrupole Mass Spectrometry and Its Applications, Elsevier, 2013 Search PubMed.
- A. Schardt, J. Schmitt, C. Engelhard, Single particle inductively coupled plasma mass spectrometry with nanosecond time resolution, Version 1, ChemRxiv, 2022, preprint, DOI:10.26434/chemrxiv-2022-rc0c2.
- A. Bazo, M. Aramendía, F. V. Nakadi and M. Resano, An Approach Based on an Increased Bandpass for Enabling the Use of Internal Standards in Single Particle ICP-MS: Application to AuNPs Characterization, Nanomaterials, 2023, 13(12), 1838 CrossRef CAS PubMed.
- D. Clases, M. Sperling and U. Karst, Analysis of metal-based contrast agents in medicine and the environment, Trends Anal. Chem., 2018, 104, 135–147 CrossRef CAS.
- S. D. Tanner, V. I. Baranov and D. R. Bandura, Reaction cells and collision cells for ICP-MS: a tutorial review, Spectrochim. Acta, Part B, 2002, 57(9), 1361–1452 CrossRef.
- N. Yamada, Kinetic energy discrimination in collision/reaction cell ICP-MS: theoretical review of principles and limitations, Spectrochim. Acta, Part B, 2015, 110, 31–44 CrossRef CAS.
- S. D'Ilio, N. Violante, C. Majorani and F. Petrucci, Dynamic reaction cell ICP-MS for determination of total As, Cr, Se and V in complex matrices: still a challenge? A review, Anal. Chim. Acta, 2011, 698(1), 6–13 CrossRef PubMed.
- S. D. Tanner and V. I. Baranov, Theory, design, and operation of a dynamic reaction cell for ICP-MS, At. Spectrosc., 1999, 20, 45–52 CAS.
- M. Tanner, Shorter signals for improved signal to noise ratio, the influence of Poisson distribution, J. Anal. At. Spectrom., 2010, 25(3), 405–407, 10.1039/B921077F.
- F. Laborda, J. Jiménez-Lamana, E. Bolea and J. R. Castillo, Critical considerations for the determination of nanoparticle number concentrations, size and number size distributions by single particle ICP-MS, J. Anal. At. Spectrom., 2013, 28(8), 1220–1232, 10.1039/C3JA50100K.
- W. L. Nicholson, Statistics of net-counting-rate estimation with dominant background corrections, Nucleonics, 1966, 24(8), 118 Search PubMed.
- MARLAP Manual Volume III, Chapter 20, Detection and Quantification Capabilities, 2004, https://www.epa.gov/sites/default/files/2015-05/documents/402-b-04-001c-20_final.pdf, accessed 08.09.2023, pp. 1–64 Search PubMed.
| This journal is © The Royal Society of Chemistry 2023 |