 Open Access Article
Creative Commons Attribution 3.0 Unported Licence
Speciation analysis of Tc radiopharmaceuticals by HPLC-ICP-MS and HPLC-ESI-HRMS
Maximilian
Horstmann
 a,
Melanie
Austrup
b,
Felix
Busch
b,
Andreas
Faust
b,
Michael
Sperling
 ac,
Uwe
Karst
 a and
David
Clases
 *d
*d
aUniversity of Münster, Institute of Inorganic and Analytical Chemistry, Corrensstraße 48, 48149 Münster, Germany
bEuropean Institute for Molecular Imaging (EIMI), Röntgenstraße 16, 48149 Münster, Germany
cEuropean Virtual Institute for Speciation Analysis (EVISA), Corrensstr. 48, 48149 Münster, Germany
dUniversity of Graz, Institute of Chemistry, Universitätsplatz 1, 8010 Graz, Austria. E-mail: david.clases@uni-graz.at
First published on 28th August 2023
Abstract
Its easy accessibility, ideal physical properties and the multifaceted redox chemistry made 99mTc the most important radionuclide for SPECT (single-photon emission computed tomography) in nuclear medicine. Unfortunately, small concentrations used in scintigraphy are also limiting analytical techniques to perform routine quality controls and to support the development of novel tracers. In this work, speciation analysis via liquid chromatography (LC) coupled with elemental and molecular mass spectrometry is developed for novel and established Tc radiopharmaceuticals to enable direct identification, characterization, and quantification. Here, an Orbitrap-based ESI-MS method was used to attain high mass resolutions and high mass accuracies for compound identification. RP-HPLC-ICP-MS was employed for the separation and sensitive detection of Tc species. Due to a lack of Tc standards, the previously introduced “isobaric dilution analysis” was modified and applied in an on-line post-column dilution approach. Besides the expected tracers, various Tc impurities were detected and calibrated in a non-target approach. The presented methods allow fast on-site quality controls of commercially available tracers, but further promote the characterization of novel experimental tracers in nuclear medicine without the need of “cold” reference compounds.
Introduction
Technetium tracer
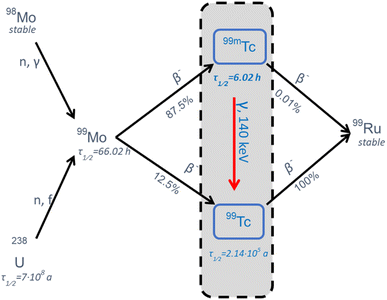
Tc is known as the lightest element without stable isotopes and occurs naturally only in traces. Since its first isolation by Perrier et al., 40 different isotopes from 83Tc to 122Tc have been discovered.1,2 The isotope 99mTc has become the preferred choice in nuclear medicine for the formulation of radiopharmaceuticals (tracers) and is applied annually in more than 30 million scintigraphy scans worldwide, which accounts for an estimated fraction of 85%.3,499mTc decays with a half-life of about 6 hours into its more stable nuclear isomer 99Tc while emitting a gamma quantum with 140.5 keV, which can be recorded for single-photon emission computed tomography (SPECT) using scintillation cameras.5 This has a high utility in diagnostic imaging and the broad redox chemistry of Tc can be exploited to synthesize complexes dedicated to target specific endogenous structures and organs.6,7 Using generators containing 99Mo as mother nuclide, 99mTc can be obtained as pertechnetate on-site via chromatography and is then processed in kit formulations to the desired tracer.3,8 The short half-life of 99mTc requires a rapid formulation and timely conduction of the scintigraphy, which can be a limiting factor for previous quality controls and the generation of high contrasts. The generation process of 99mTc and the decay scheme is shown in Fig. 1.While the multifaceted chemistry of Tc is on one hand relevant for the synthesis of various complexes with specificity for different targets, it can, on the other hand, promote various side products due to unselective synthesis pathways and tracer degradation.9,10 For routine applications, tracers are formulated in kits containing lyophilized ligands, reducing agents, antioxidants and stabilizers. Pertechnetate from generators is directly added to these kits and Tc is reduced to lower oxidation states (typically Tc(I), Tc(III), Tc(IV) or Tc(V)) to form the desired tracer.6,11,12 Nevertheless, it is suspected that the reactions are not entirely selective, and that tracers are sometimes not as stable and pure as desired. This is underpinned by the fact that the short half-life of 99mTc leaves little time for fine-adjustments of several synthesis parameters (e.g., the exact amount of 99mTc/99Tc eluting from the generator, pH, O2 partial pressure, etc.).9,13 Tc radiopharmaceuticals may contain species in various oxidation states, which can result in a loss of contrast in scintigraphy while exposing patients to unnecessary radiation.14 The amount and identity of impurities are often unknown and even slight effects and deviations during synthesis, storage and administration may lead to a significant quality loss in scintigraphy.13,15 It is therefore highly aspired to control and optimize reaction parameters with the aim to improve radiochemical purity, maximize tracer yield and enhance contrast in diagnostic applications.
In most cases, the quantitative determination of Tc in radiopharmaceuticals is conducted by means of scintillation methods counting the gamma emission of 99mTc. However, this approach is only able to detect 99mTc and not its respective ground state 99Tc. For the characterization of established and novel radiopharmaceuticals in nuclear medicine, more precise qualitative and quantitative information is required to determine pharmacokinetic properties, tracer impurities and activity parameters. Because of the selective quantum emission during the decay of 99mTc, tracer concentrations can be kept relatively low. This means that tracers are typically administered at concentrations, at which they do not influence biochemical pathways but exclusively enrich in the target tissue for subsequent imaging (tracer principle). These low concentrations challenge and sometimes prevent analytical strategies to determine important parameters and to perform on-site quality controls. While radioanalytical methods such as radio-thin layer chromatography or radio-high performance liquid chromatography (HPLC) can sensitively detect 99mTc,16–18 mass spectrometric methods are preferable to detect both 99mTc and 99Tc and to provide structural and quantitative information. Only a few studies aimed to perform speciation analysis of Tc in pharmaceuticals.9,19 Liu et al. reported a radio-LC-MS method, which required higher concentrations of 99Tc, which was collected as eluate within 24 h from the generator. The authors furthermore used this method to confirm the identity of hydrazinonicotinamide Tc complexes (HYNICtides).20,21 Verduyckt et al. examined three different commonly used tracers and for the first time and confirmed their identity using radio-LC-MS.22 Within an array of various other analytical techniques Ardestani et al. and Maurin et al. used LC-MS to characterize two novel Tc tracers and confirm their exact masses.23,24
For the development of novel Tc tracers, a non-radioactive (“cold”) reference compound containing Re instead of Tc is commonly synthesized in a parallel upscaled batch. Re possesses chemical characteristics similar to Tc and is analyzed as a proxy for the respective Tc complex in a parallel LC-UV/vis channel. A comparison of retention times of the Re complex in the UV/vis channel against the Tc complex measured via radio-LC is the basis for the subsequent identification of the tracer.18 However, in some cases, slight differences in the chemical properties cause that respective Re complexes cannot be synthesized and that the conduction of a non-radioactive reference is not feasible. This is for example the case when Tc shows the oxidation state +I as in complexes with HYNIC ligands.25,26 Concludingly, the direct quantification, the determination of the specific activity (99Tc/99mTc) as well as the direct identity confirmation of tracers and side products is not possible at the moment or is at least limited.
In this work, hyphenated techniques employing LC coupled to inductively coupled plasma – mass spectrometry (ICP-MS) and electrospray ionization mass spectrometry (ESI-MS) are introduced for the qualitative and quantitative evaluation of Tc radiopharmaceuticals. High resolution molecular mass spectrometry was employed to gather exact masses for tentative identification purposes. RP-HPLC-ICP-MS was used to perform highly sensitive analyses and to enable a non-target approach to detect Tc side products as previously discussed for other elements.27,28 As Tc standards are not easily accessible, the concept of isobaric dilution analysis (IBDA)29 was adapted to enable calibration of transient Tc signals. Here, a Ru post-column spike was continuously added after the chromatographic column generating a constant ratio of m/z 99 and 101. The disruption of this ratio due to the elution of 99Tc was used for quantification in an isotope dilution-like analysis. To correct for element-specific differences in sensitivity, the response of Tc was interpolated using sensitivities of its neighboring 4d elements.
Experimental
Chemicals and consumables
For online IBDA, a Ru single element standard for ICP-MS (10 mg L−1) was purchased from High-Purity Standards (Charleston, SC, USA) and diluted to a final concentration of 1 μg L−1 in an aqueous 2% nitric acid solution (w/v). Nitric acid (65%, Suprapur, (w/v)) was purchased from Merck KGaA (Darmstadt, Germany). Water was purified by an Aquatron water still purification system model A4000D (Barloworld Scientific, Nemours, France). Ammonium acetate (50 mM, pH adjusted to 4 by means of acetic acid) (Eluent A, from Fluka Chemie GmbH, Buchs, Switzerland) and acetonitrile (ACN) (Eluent B, from Merck KGaA, Darmstadt, Germany) were used as mobile phases. Samples and stock solutions were diluted and stored in vials and tubes made of polypropylene (PP) in order avoid adsorption effects.Sample preparation
Tc radiopharmaceuticals were provided by the European Institute for Molecular Imaging (EIMI) (University Hospital Münster, Germany). For the synthesis of commercial tracers, [99mTc]pertechnetate was eluted from a generator and added to the respective kits. After the radiotracer formulation, all radiotracers were frozen and stored for at least 60 hours at −20 °C until no increased gamma radiation could be detected. For speciation analysis, the commercial tracers were thawed and 200 μL were directly transferred and stored in N2 flushed PP vials during analysis without further dilution. Experimental Tc radiotracers were synthesized at the EIMI and immediately frozen in −20 °C N2 flushed PP vials. Prior to analysis, tracers were thawed, diluted 1![[thin space (1/6-em)]](https://www.rsc.org/images/entities/char_2009.gif) :
:![[thin space (1/6-em)]](https://www.rsc.org/images/entities/char_2009.gif) 5 in acetonitrile and transferred into N2-flushed vials for analysis.
5 in acetonitrile and transferred into N2-flushed vials for analysis.
Instrumentation and experimental parameters
The chromatographic separation was carried out with a HPLC system consisting of two LC-10ADVP pumps, a DGU-13A degasser, a SIL-10A autosampler, a SCL-10AVP system controller and a CTO-10ASVP column oven (all from Shimadzu, Duisburg, Germany). The system was operated with LCSolution software version 1.2.2 (Shimadzu). A gradient based separation method was developed and optimized using an Accucore C18 column (particle size 2.6 μm, length 150 mm, carbon load 7%) (Thermo Scientific, Bremen, Germany). To separate a broad range of potential species with different polarities present in the tracer solution, a broad binary gradient was applied. The initial composition of the eluent was 90% A (aqueous eluent) and 10% B (organic eluent), which was subsequently proportionally changed to 10% A and 90% B over a time range of 10 minutes. After holding 10% A for 25 minutes, the mobile phase composition was changed back to initial conditions in 5 minutes and hold for 5 minutes prior to the next injection. The injection volume was optimized to be 10 μL and the flow rate was adjusted to 150 μL min−1. To investigate a potential solvent-depending element specific response in ICP-MS, a standard containing 1 ng g−1 Ru and approximately 1 ng g−1 Tc was prepared.All ICP-MS experiments were carried out with a 7500ce quadrupole ICP-MS system using a platinum sampler and skimmer (Agilent Technologies, CA, USA). The system was operated with Chemstation software (Agilent Technologies). A quartz injector pipe with an inner diameter of 1.0 mm was used for sample introduction. The measurements were conducted using the following conditions: RF power, 1600 W; cool gas flow, 14 L min−1; auxiliary gas flow, 0.9 L min−1; nebulizer gas flow, 0.6 L min−1; optional gas (O2), 0.05 L min−1; dwell time of m/z 99 and m/z 101, 20 ms each; peak measurement protocol, peak hopping mode. For all experiments, a cooled (−5 °C) cyclonic spray chamber (Glass Expansion, Melbourne, Australia) with a PFA MicroFlow nebulizer (Elemental Scientific, Omaha, NE, USA) was used for aerosol generation. Data evaluation was carried out using OriginPro (OriginLab Corporation, Northampton, MA, USA). Signals were smoothed with the Savitzky–Golay filter using a second order polynomial regression over 50 data points. For online IBDA, the spike was introduced via an external peristaltic pump whereas the exact mass flow of the spike was continuously recorded using a digital analytical balance (Mettler Toledo AB 204, Am Greifensee, Switzerland). The acquisition of transient data signals was received via RS-232 and transformed into keystrokes with the software 232 key (Born, Luxembourg).
Instrumental mass bias effects were avoided by recording isotopic abundances with the same instrument and using determined values for the calculations of the mass flow as specified later. The detector dead time was calibrated analyzing a diluted Er standard and compensated by the ICP-MS software (ChemStation, Agilent Technologies).
All ESI-MS experiments were carried out with an Orbitrap-based mass spectrometer (Exactive, Thermo Fisher Scientific) using the following conditions: scan range, m/z 98.0–1500.0; resolution, ultra high (100![[thin space (1/6-em)]](https://www.rsc.org/images/entities/char_2009.gif) 000 @ 1 Hz), AGC target, balanced (106), maximum inject time, 1000 ms. Data were acquired and evaluated with Xcalibur 2.1 software (Thermo Fisher Scientific).
000 @ 1 Hz), AGC target, balanced (106), maximum inject time, 1000 ms. Data were acquired and evaluated with Xcalibur 2.1 software (Thermo Fisher Scientific).
On-line isobaric dilution analysis
On-line calibration of transient Tc signals was achieved via an isobaric dilution analysis (IBDA) approach adapted from Clases et al.29 Here, the Tc mass flow was calculated according to eqn (1), where MFS,Sp was the mass flow and MS,Sp the corresponding atomic weights in the sample and spike, respectively. cSp was the concentration of the spike and Rm was the measured isotope ratio. RS and RSp were defined as ASb/ASa (isotope ratio b/a in the sample) and ASpa/ASpb (isotope ratio a/b in the spike), respectively. | (1) |
To address differences in element response, a correction factor Fr was defined (eqn (2)) as ratios of the element-specific response factors.
 | (2) |
This factor was subsequently used to determine a response-corrected  as shown in eqn (3). I99Tc and I99Ru were the individual intensities from 99Tc and 99Ru. Im99 and Im101 were absolute intensities determined for m/z 99 and m/z 101.
 | (3) |
Due to the lack of adequate Tc standards, r99Tc was interpolated using determined responses of adjacent 4d elements according to a previous report.29 The response could be estimated with an expected uncertainty of 6%.
Mass-based limits of detection (LOD) were calculated according to eqn (4) and translated into molar-based LODs. Here, only the spike containing Ru was analysed and the standard deviation at m/z 99 was considered. The limit of quantification was determined as 3.3LOD.
 | (4) |
The LOD was 0.05 ng Tc g−1 which corresponded to 0.5 nmol L−1. The LOQ was 0.17 ng Tc g−1 corresponding to 1.7 nmol L−1.
Results and discussion
On-line calibration of transient Tc signals
To investigate Tc species in tracer formulations quantitatively as well as to interrogate molecular compositions, speciation analysis by means of RP-HPLC-ICP-MS and RP-HPLC-ESI-MS was conducted. As subjects of this study, four commercially available as well as two experimental tracers were characterized. A reversed C18 phase was applicable to separate most species in all investigated tracer solutions. A previously reported IBDA approach for the determination of Tc29 was adapted to calibrate transient signals derived from chromatography. IBDA is a calibration technique that derived from isotope dilution analysis (IDA). While in IDA, the sample is mixed with a spike solution containing the same elements with an altered isotopic abundance, IBDA uses a spike containing a chemically similar element with an isobaric isotope. However, slight differences in the element response had to be considered to enable accurate calibration of the mass flow. Eqn (1) is commonly used for on-line species-unspecific IDA and was used for IBDA by implementing a correction factor that compensated element-specific differences as shown in eqn (2) and (3). Given that the response of Tc cannot be measured due to the lack of suitable and traceable standards, an interpolation approach was used. Here, adjacent 4d transition metals were recorded as analogues of Tc with similar ionization potential and instrumental responses. Subsequently, the 99Tc response was fitted with an expected uncertainty of 6%. Additionally, the standard deviation for isotope ratios was 2%. Other potential sources for uncertainty (e.g., scale) were significantly smaller and were therefore not further considered.Following the calculation of the MFs, integration of chromatographic signals enabled the calculation of the Tc mass. It is worth mentioning that element specific responses were also depending on plasma conditions, which varied using a solvent gradient. A solution containing both Tc and Ru was continuously spiked post-column during the performance of the gradient to investigate potential elemental discrimination. However, the ratio of m/z 99 to m/z 101 appeared to be constant at all times indicating that the relative response factors of Tc and Ru did not need to be adjusted for different gradient solvent compositions.
Speciation analysis of experimental Tc tracer
Two experimental tracers developed for the scintigraphy of tumors (Fig. 2) were investigated using RP-HPLC-ICP-MS and ESI-HRMS. For the development of novel tracers, a non-radioactive (“cold”) Re reference compound is usually synthesized to confirm the identity of a target tracer in a parallel analysis. Unfortunately, Re proxies are not adequate as reference for Tc complexes with an oxidation state of +I (e.g., HYNIC complexes) due to slight differences in their chemical and physical properties. [99Tc]MEA223 (ref. 30) (Fig. 2) is such a Tc-HYNIC complex which cannot be modelled with a cold Re reference compound. [99mTc]FEB105 (ref. 31) (Fig. 2) is a novel tracer for which a synthesis of a non-radioactive reference is at least challenging. The combined use of RP-HPLC-ICP-MS and RP-HPLC-ESI-HRMS provided some critical advantages for the analysis of these radiotracers. First, RP-HPLC-ICP-MS enabled a highly sensitive non-target analysis of Tc compounds and species-unspecific quantification of all compounds via on-line IBDA. As such, simple elemental standards could be used to determine the concentration of even unknown Tc species. Species selectivity could be achieved in RP-HPLC-ESI-HRMS. While here the limits of analyses depended on the chemical species, sensitivity was sufficient to analyze dominant Tc compounds. For a tentative compound identification, exact masses were acquired for mass defect analysis and sum formula annotation.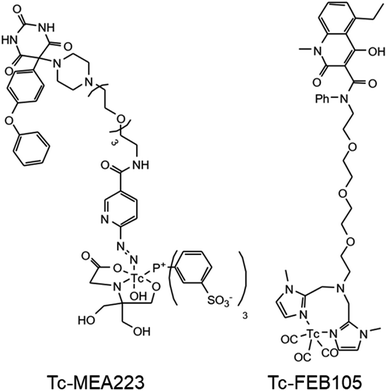 | ||
| Fig. 2 Structural formula of the two experimental radiotracers ([Tc]MEA223, left) and ([Tc]FEB105, right) investigated by means of RP-HPLC-ICP-MS and RP-HPLC-ESI-HRMS. | ||
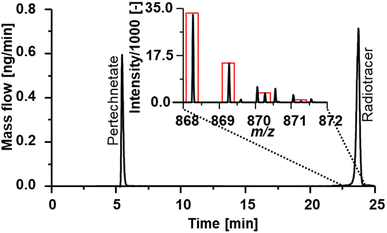
Fig. 3 shows the 99Tc mass flow of experimental radiotracer [Tc]MEA223 obtained via RP-HPLC-ICP-MS with post-column IBDA. Two major signals were detected at tr = 5 min and tr = 14 min. Signal A at tr = 5 min had a concentration of 0.7 μmol L−1, whereas signal B at tr = 14 min was calibrated to be 14.8 μmol L−1 Tc.
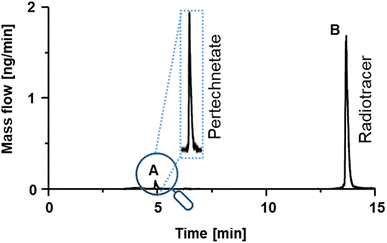 | ||
| Fig. 3 99Tc mass flow chromatogram of experimental radiotracer Tc-MEA223. Two different signals could be detected and calibrated. | ||
To identify the compounds corresponding to the detected Tc signals, the RP-HPLC separation method was subsequently used in conjunction with ESI-HRMS. Summing up mass spectra at the elution time of species A (Fig. 3) enabled the detection of the exact mass m/z 162.8866 in negative mode. With a mass deviation of +1.0 ppm the mass corresponded to the [99Tc]pertechnetate anion. Pertechnetate is the most thermodynamically stable Tc species under aerobic conditions and is used as precursor for all Tc-labelled radiotracers. Therefore, the present pertechnetate was most likely either not converted into the target radiotracer or was a degradation product. Mass spectra summed over species B at tr = 14 min enabled identification of the radiotracer in both positive and negative ionization mode. Experimental and theoretical spectra (red) are depicted in Fig. 4. In negative ionization mode, the deprotonated form of Tc-MEA223 (99TcC58H64O22N9S3P−) was detected with a mass deviation of −0.4 ppm, and the protonated species (99TcC58H66O22N9S3P+) was observed in positive ionization mode with a mass deviation of +1.5 ppm. In both cases, the experimental and theoretical masses and the isotopic patterns were in good accordance.
The experimental radiotracer Tc-FEB105 (Fig. 2) was investigated accordingly. The results are depicted in Fig. 5. Again, respective concentrations were calculated via integration of the Tc mass flow. The exact mass allowed the identification of the first signal as pertechnetate anion with a mass deviation of 0.0 ppm in negative ionization mode. The second signal was assigned to the desired radiotracer (99TcC40H47O9N7+) by means of its isotopic pattern as well as the high mass accuracy of +0.6 ppm in the positive ionization mode. The radiotracer was not observed in negative ionization mode.
Speciation analysis of commercial Tc tracer
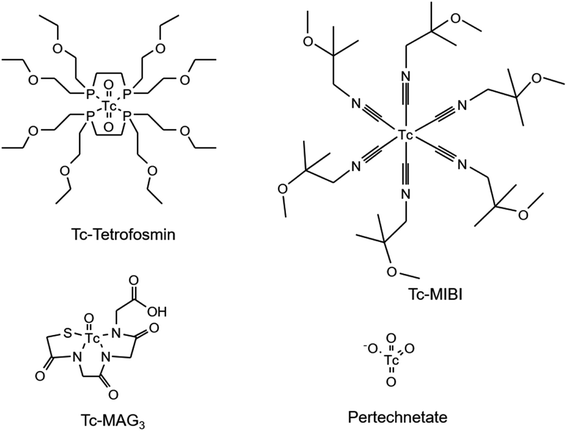
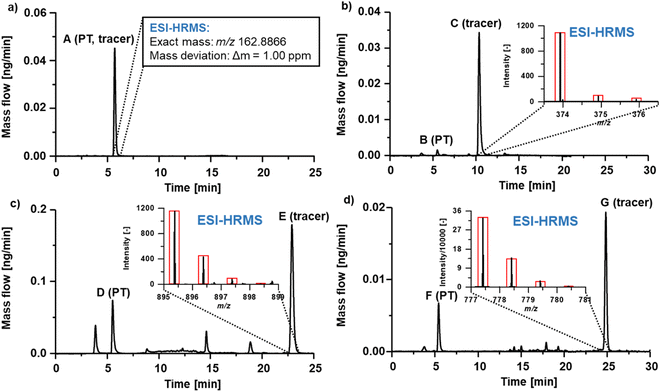
Commercial Tc tracers are prepared directly prior to their administration and the conduction of the scintigraphy to obtain a high specific activity. 99mTc is routinely generated in a chromatographic 99Mo/99mTc generator and eluted using an isotonic saline solution into a sealed flask containing the necessary educts for the synthesis of the target tracer (kit formulation). The gamma radiation is measured to control the amount of 99mTc. However, the total Tc mass comprising of both 99mTc and 99Tc eluting from the generator (and therefore the specific activity) is unknown and is therefore complicating control of reaction selectivity and yield. To study the abundance of impurities, four different commercial Tc tracers have been investigated (Fig. 6).Speciation analysis was conducted as described for the experimental tracers to reveal the presence of Tc-based species. The mass flow chromatograms of the respective tracer are shown in Fig. 7. Pertechnetate is frequently used for the scintigraphy of thyroids and was observed in negative ionization mode. Tc-MAG3 is widely used for the scintigraphy of kidneys and was monitored in negative ionization mode. Tc-Tetrofosmin and Tc-MIBI are radiotracers commonly administered for myocardial scintigraphy and were both monitored in positive ionization mode.
Chromatogram (a) shows the mass flow of the commercial [99Tc]pertechnetate. In case of this tracer, Tc is already obtained as pertechnetate from the generator and was not further modified. By running the same RP-HPLC method in a combination with an Orbitrap-based mass spectrometer in negative ionization mode, the exact mass of pertechnetate was confirmed with a high mass accuracy (+1.1 ppm). In chromatograms (b)–(d), the signals B, D and F had the same retention time as found for pertechnetate in chromatogram (a). The retention time as species-specific parameter as well as exact masses with accuracies between −3.2 ppm and 0.4 ppm confirmed the presence of pertechnetate. The abundant pertechnetate may have been the result of incomplete conversion to the desired tracer. This hypothesis is endorsed by the fact that the Tc concentration during the formulation can easily be underestimated, when only gamma counting is performed. Chromatogram (b) shows the analyte mass flow of the commercial tracer [99Tc]MAG3. The desired tracer was identified by its isotopic pattern in as 99TcC8H9O6N3S1 at a retention time of 11 min with a mass deviation of +0.7 ppm. Accordingly, [99Tc]Tetrofosmin ((c): tr = 23 min, Δm = −0.8 ppm) and [99Tc]MIBI ((d): tr = 25 min, Δm = −3.2 ppm) were investigated as 99TcC36H80O10P4 and 99TcC36H66N6O6, respectively, in positive ionization mode. In particular for [99Tc]Tetrofosmin and [99Tc]MIBI, several different unknown species could be detected indicating the presence of side products originating from an unselective synthesis or tracer degradation. In case of [99Tc]Tetrofosmin it was furthermore observed that the abundance of respective species was highly time dependent. Depending on the conditions, the abundant species degraded within hours to the thermodynamically more stable pertechnetate. The results are summarized in Table 1 showing also the calculated purity, annotated sum formulae and the column recovery determined via flow injection (FI)-ICP-MS. Purities deviated between 47.6–96.9% and column recoveries were between 69–108%.
| Fig. 7 | Signal | Compound/sum formula | Concentration [nmol L−1] | Tracer purity | Column recovery |
|---|---|---|---|---|---|
| (a) | A | Pertechnetate/(TcO4−) | 480 ± 40 | 97% | 108% |
| (b) | B | Pertechnetate/(TcO4−) | 16 ± 1.2 | 93% | 69% |
| C | [99Tc]MAG3/99TcC8H9O6N3S1 | 530 ± 40 | |||
| (c) | D | Pertechnetate/(TcO4−) | 930 ± 80 | 48% | 90% |
| E | [99Tc]Tetrofosmin/99TcC36H80O10P4 | 3300 ± 300 | |||
| (d) | F | Pertechnetate (TcO4−) | 87 ± 7 | 67% | 79% |
| G | [99Tc]MIBI/99TcC36H66N6O6 | 300 ± 20 |
Conclusion
In this work, a RP-HPLC method was used to separate Tc species present in four different commercially available tracers and two experimental tracers. Quantification of each separated species was carried out with a new online IBDA method set up in a post-column approach. Differences in sensitivity of Tc and Ru were corrected by approximating the elemental sensitivity of Tc in ICP-MS using the responses of adjacent 4d-elements. The separation method was coupled to an ESI-Orbitrap mass spectrometer for the tentative identification of the desired tracer via exact masses with high mass accuracies and respective isotopic patterns. In both experimental tracers, the tracer compound could be separated from pertechnetate. The quantification by means of post-column IBDA allowed determination of the respective concentrations and therefore enabled evaluating the tracer purities. Since the activity (gamma radiation) is routinely measured during the radiopharmaceutical formulation, further important parameters such as the specific activity are now accessible. Four different commercially available tracers have been studied accordingly. The desired tracers could be separated from Tc-based impurities in the radiopharmaceuticals and their identity was confirmed. Pertechnetate was found to be present as impurity in all formulations and was identified with high mass accuracies as well as by comparison of retention times. Further unknown impurities were detected for some tracers.The presented methods enable a fast and on-side quality control and provide access to important parameters relevant for quality controls and tracer development. The developed methods pose an adjuvant tool to determine important activity parameters and for the identification and quantitation of experimental tracers without the need of cold reference compounds.
Conflicts of interest
There are no conflicts to declare.Acknowledgements
The authors acknowledge the financial support by the University of Graz.References
- C. Perrier and E. Segrè, Some chemical properties of element 43, J. Chem. Phys., 1937, 5, 712–716 CrossRef CAS.
- M. Wang, W. J. Huang, F. G. Kondev, G. Audi and S. Naimi, The AME 2020 atomic mass evaluation (II). Tables, graphs and references*, Chin. Phys. C, 2021, 45(3), 30003 CrossRef CAS.
- J. R. Dilworth and S. J. Parrott, The biomedical chemistry of technetium and rhenium, Chem. Soc. Rev., 1998, 27(1), 43–55 RSC.
- OECD, Agency NE, The Supply of Medical Isotopes, 2019, p. 130 Search PubMed.
- D. Clases, M. Sperling and U. Karst, Analysis of metal-based contrast agents in medicine and the environment, Trends Anal. Chem., 2018, 104, 135–147 CrossRef CAS.
- U. Abram and R. Alberto, Technetium and rhenium – Coordination chemistry and nuclear medical applications, J. Braz. Chem. Soc., 2006, 17(8), 1486–1500 CrossRef CAS.
- M. U. Akbar, M. R. Ahmad, A. Shaheen and S. Mushtaq, A review on evaluation of technetium-99m labeled radiopharmaceuticals, J. Radioanal. Nucl. Chem., 2016, 310(2), 477–493 CrossRef CAS.
- A. Dash, F. F. Knapp and M. R. A. Pillai, 99Mo/99mTc separation: an assessment of technology options, Nucl. Med. Biol., 2013, 40, 167–176 CrossRef CAS PubMed.
- T. C. Pinkerton, W. R. Heineman and E. Deutsch, Separation of technetium hydroxyethylidene diphosphonate complexes by anion-exchange high performance liquid chromatography, Anal. Chem., 1980, 52(7), 1106–1110 CrossRef CAS.
- J. A. Ponto, Technetium-99m radiopharmaceutical preparation problems: 12 years of experience, J. Nucl. Med. Technol., 1998, 26(4), 262–264 CAS.
- C. L. Rulfs, R. A. Pacer and R. F. Hirsch, Technetium chemistry, oxidation states and species, J. Inorg. Nucl. Chem., 1967, 29(3), 681–691 CrossRef CAS.
- Technetium-99m Pharmaceuticals, Preparation and Quality Control in Nuclear Medicine, ed. I. Zolle, Springer, Berlin Heidelberg, 2007, pp. 59–66 Search PubMed.
- F. E. Buroni, L. Lodola, M. G. Persico and C. Aprile, Deficiencies in product labelling instructions and quality control directions for 99mTc radiopharmaceuticals, Nucl. Med. Commun., 2014, 35(2), 197–204 CrossRef PubMed.
- S. C. Srivastava, G. Meinken, T. D. Smith and P. Richards, Problems associated with stannous 99mTc-radiopharmaceuticals, Int. J. Appl. Radiat. Isot., 1977, 28(1–2), 83–95 CrossRef CAS PubMed.
- M. Bauwens, I. Pooters, J. van der Pol, F. M. Mottaghy and M. van Kroonenburgh, Retention of 99mTc-DMSA (III) and 99mTc-nanocolloid in different syringes affects imaging quality, Nucl. Med. Commun., 2014, 35(4), 433–437 CrossRef CAS PubMed.
- S. P. Fletcher, A. Noor, J. L. Hickey, C. A. McLean, J. M. White and P. S. Donnelly, Rhenium and technetium complexes of thioamide derivatives of pyridylhydrazine that bind to amyloid-β plaques, J. Biol. Inorg. Chem., 2018, 23(7), 1139–1151 CrossRef CAS PubMed.
- J. D. C. Gomez, A. Hagenbach, U. I. M. Gerling-Driessen, B. Koksch, N. Beindorff and W. Brenner, et al., Thiourea derivatives as chelating agents for bioconjugation of rhenium and technetium, Dalton Trans., 2017, 46(42), 14602–14611 RSC.
- C. A. A. Kelderman, P. R. W. J. Davey, M. T. Ma, M. de Veer, E. Salimova and P. S. Donnelly, et al., Hexadentate technetium-99m bis(thiosemicarbazonato) complexes: synthesis, characterisation and biodistribution, Dalton Trans., 2022, 51(37), 14064–14078 RSC.
- M. C. Ziegler, S. Liu, D. S. Edwards, A. R. Harris, J. A. Barrett and S. J. Hemingway, 99mTc-Labeling of a Hydrazinonicotinamide-Conjugated Vitronectin Receptor Antagonist Useful for Imaging Tumors, Bioconjugate Chem., 2001, 12(4), 624 CrossRef PubMed.
- S. Liu, M. C. Ziegler and D. S. Edwards, Radio-LC-MS for the Characterization of Bioconjugates, Bioconjugate Chem., 2000, 11, 113–117 CrossRef CAS PubMed.
- S. Liu, D. S. Edwards, A. R. Harris, S. J. Heminway and J. A. Barrett, Technetium Complexes of a Hydrazinonicotinamide-Conjugated Cyclic Peptide and 2-Hydrazinopyridine: Synthesis and Characterization, Inorg. Chem., 1999, 38(6), 1326–1335 CrossRef CAS PubMed.
- T. Verduyckt, D. Kieffer, D. Huyghe, B. Cleynhens, K. Verbeke and A. Verbruggen, et al., Identity confirmation of 99mTc-MAG3, 99mTc-Sestamibi and 99mTc-ECD using radio-LC-MS, J. Pharm. Biomed. Anal., 2003, 32(4–5), 669–678 CrossRef CAS PubMed.
- M. S. Ardestani, A. Bitarafan-Rajabi, P. Mohammadzadeh, S. Mortazavi-Derazkola, O. Sabzevari and A. D. Azar, et al., Synthesis and characterization of novel 99mTc-DGC nano-complexes for improvement of heart diagnostic, Bioorg. Chem., 2020, 96(December 2019), 103572 CrossRef CAS PubMed.
- M. Maurin, M. Wyczółkowska, A. Sawicka, A. E. Sikora, U. Karczmarczyk and B. Janota, et al., [99mTc]Tc-PSMA-T4—Novel SPECT Tracer for Metastatic PCa: From Bench to Clinic, Molecules, 2022, 27, 7216 CrossRef CAS PubMed.
- S. Liu, Bifunctional Coupling Agents for Radiolabeling of Biomolecules and Target-Specific Delivery of Metallic Radionuclides, Adv. Drug Delivery Rev., 2008, 60(12), 1347–1370 CrossRef CAS PubMed.
- K. Libson and E. Deutsch, Strucutral Characterization of a 99Tc-Diphosphonate Complex. Implications for the Chemistry of 99mTc Skeletal Imaging Agents, J. Am. Chem. Soc., 1980, 102(7), 2476–2478 CrossRef CAS.
- D. Clases and R. Gonzalez de Vega, Facets of ICP-MS and their potential in the medical sciences—Part 1: fundamentals, stand-alone and hyphenated techniques, Anal. Bioanal. Chem., 2022, 414, 7337–7361 CrossRef CAS PubMed.
- D. P. Bishop, D. J. Hare, D. Clases and P. A. Doble, Applications of liquid chromatography-inductively coupled plasma-mass spectrometry in the biosciences: a tutorial review and recent developments, TrAC, Trends Anal. Chem., 2018, 104, 11–21 CrossRef CAS.
- D. Clases, M. Birka, M. Sperling, A. Faust and U. Karst, Isobaric dilution analysis as a calibration tool for long lived radionuclides in ICP-MS, J. Trace Elem. Med. Biol., 2017, 40, 97–103 CrossRef CAS PubMed.
- L. Honold, M. Austrup, A. Faust, C. P. Konken, K. Schwegmann and B. Zinnhardt, et al., Towards Optimized Bioavailability of 99mTc-Labeled Barbiturates for Non-invasive Imaging of Matrix Metalloproteinase Activity, Mol. Imaging Biol., 2022, 24(3), 434–443 CrossRef CAS PubMed.
- A. Faust, S. Hermann, J. Roth, M. Schaefers, and T. Vogl, Quinoline-3-Carboxamide Compounds and Their Use in Diagnosis, WO2016067238A1, PCT/IB2015/058348, publication date: 06/05/2016, 2016.
| This journal is © The Royal Society of Chemistry 2023 |

