
A high-temperature sintered cassiterite reference material for in situ determination of Sn isotope ratios†
Duo
Zhang
a,
Zhian
Bao
 *a,
Peng
Liu
*a,
Gerhard
Brügmann
b,
Wenqiang
Yang
a,
Kaiyun
Chen
a,
Peng
Liang
a and
Honglin
Yuan
a
*a,
Peng
Liu
*a,
Gerhard
Brügmann
b,
Wenqiang
Yang
a,
Kaiyun
Chen
a,
Peng
Liang
a and
Honglin
Yuan
a
aState Key Laboratory of Continental Dynamics, Department of Geology, Northwest University, Xi'an 710069, China. E-mail: geobza@126.com; pengliu@nwu.edu.cn
bCurt-Engelhorn-Zentrum Archäometrie gGmbH, Mannheim, 68159, Germany
First published on 6th December 2022
Abstract
Microanalysis of tin isotopes in cassiterite by laser ablation multi-collector inductively coupled plasma mass spectrometry (LA-MC-ICP-MS) has been an important tool to reconstruct the fluid evolution or discriminate petrological sources and processes. However, it is a major challenge to prepare the absolutely essential cassiterite reference material that has a homogeneous Sn isotope composition on a micron scale. In this study, we report a novel method to synthesize a homogeneous cassiterite reference material via sintering a micrometer powder. Under the optimized conditions (600 °C, 1 GPa), the synthesized cassiterite has a smooth surface and dense structure that is suitable for laser ablation analysis. The Sn signal for the synthesized cassiterite was consistent with that of natural cassiterite and lower than that of the pressed powder pellets by LA-ICP-MS, indicating that the sintered cassiterite approximated the theoretical maximal density. LA-MC-ICP-MS measurements suggest that the homogeneity (2SD) for δ124Sn/120Sn was improved from 0.64‰ (original cassiterite crystal) to 0.10‰ (synthesized cassiterite). The reproducibility of δ124Sn/120Sn was 0.07‰ (2SD) for the synthesized cassiterite. These data have demonstrated that the synthesized cassiterite has a homogeneous distribution of Sn isotopes. Therefore, we recommend combining ultra-fine powders with the high-temperature sintering technique to synthesize other minerals for microanalysis.
1. Introduction
The stable isotope composition of Sn in terrestrial and meteoritic samples has been used to understand the early history of the Solar System and trace fundamental geological processes.1–7 In particular, cassiterite, the main carrier of tin in tin ore deposits, has been the subject of numerous isotopic studies. These deposits are associated with granitic batholiths and were formed by magmatic–hydrothermal processes.8 Recent studies have revealed the heterogeneity of Sn isotopes in a single cassiterite crystal, suggesting that the Sn isotope ratios in cassiterite could be a key to monitoring the complex evolution history of tin-bearing magmatic–hydrothermal systems.9 Moreover, the Sn isotope ratios of cassiterite might also be used as a proxy in discriminating petrological sources and processes.10A measuring technique with high accuracy and precision is essential to detect variations of Sn isotope ratios in cassiterite. The pioneering study on the determination of Sn isotope ratios by De Laeter and Jeffery (1965, 1967)1,11 applied thermal ionisation mass spectrometry (TIMS). However, because of the relatively high ionization potential of tin (7.3 eV), high-precision Sn isotopes were difficult to obtain. With the development of the ICP ion source with high ionisation efficiency, multi-collector inductively coupled plasma-mass spectrometry (MC-ICP-MS) has been widely used for precise and accurate determination of Sn isotope ratios with analytical precision (2SD) better than 0.3‰.12–19 For instance, Clayton et al. (2002)12 determined the Sn isotope ratios in solutions of tin metal and cassiterite by a Micromass IsoProbe MC-ICP-MS. By using Sb as an internal standard for mass bias correction, the reproducibility was 0.32‰ for δ124Sn (2SD). Cassiterite is essentially insoluble in mineral acids and complex dissolution procedures using HI18 or the conversion of cassiterite to acid dissolvable tin metal by reducing it at high temperatures are necessary to succeed in dissolving cassiterite.13,15,19 Recently, Mathur et al. (2017)15 compared the effectiveness of reduction to tin metal with potassium cyanide at high temperatures and with hydriodic acid at low temperatures. Reduction to tin metal with potassium cyanide at high temperature was successfully used to determine the Sn isotope ratios in cassiterite, while the hydriodic acid method produced unreliable results due to Sn isotope fractionation during the reduction process.15
Although the solution nebulizer (SN)-MC-ICP-MS technique has a precision better than 0.15‰ (2SD), this bulk isotope analysis is inappropriate for cassiterite, which has a multi-stage growth history or significant Sn isotopic variations within a single grain. Moreover, the sample preparation procedure is complicated, time-consuming, and involves extremely toxic potassium cyanide. Thus, given the Sn isotope heterogeneity and the complex growth history of cassiterite, an in situ microbeam technique, notably the femtosecond laser ablation (fsLA)-MC-ICP-MS with high spatial resolution, could be a superior choice.9,20 Schulze et al. (2017)20 directly determined the Sn isotope ratios in cassiterite by fsLA-MC-ICP-MS, which avoided the risk of isotope fractionation during the reduction of cassiterite. However, the fsLA-MC-ICP-MS analysis of Sn isotope ratios in cassiterite requires calibration against the equivalent analysis of a matrix-matched reference material to correct the instrument-induced mass discrimination. A high-quality cassiterite reference material with homogeneous Sn isotope composition is essential to obtain accurate and precise Sn isotope ratios.
In this study, a new synthesis method of cassiterite was established for in situ Sn isotope analysis. The natural cassiterite ore with heterogeneous Sn isotope compositions was milled to cassiterite powders using a planetary ball mill. Then synthesized cassiterite was synthesized via sintering ultrafine cassiterite powder at high temperature using a Quickpress Piston-Cylinder. The morphology, laser ablation behavior, elemental contents, and homogeneity of Sn isotope ratios in the synthesized cassiterite were investigated. The homogeneity of Sn isotopes was checked by repeated measurements. Our results suggest that the synthesized cassiterite is chemically homogeneous and can be used as a reference material for in situ Sn isotope analysis. A mean δ124Sn/120Sn ratio of 0.60 ± 0.03‰ (2SD, n = 5) determined by SN-MC-ICP-MS is suggested as a recommended δ124Sn/120Sn value for the synthesized cassiterite.
2. Experiments
2.1 Instrumentation
Deionized water with a resistivity of 18.0 MΩ cm−1 was obtained from a Milli-Q water purification system (Millipore, Bedford, MA, USA). The international Sn isotope reference material NIST SRM 3161a was purchased from the National Institute of Standards and Technologies in 5% HNO3 and 1% HF. Two commercially available single-element solutions, Spex CertiPrep Sn and SnCl4 solution provided by She et al. (2020)21 were used to check the stability of the MC-ICP-MS. Repeated measurements for the in-house Spex CertiPrep Sn solution standard (Lot# CL11-154SNY) were performed for interlaboratory comparison and to monitor the stability of the instrument.2.2 Preparation of synthesized cassiterite
A natural cassiterite crystal was collected from the Gejiu tin polymetallic deposit in the west of the southeastern Yunnan tin ore belt, SW China. Cassiterite powder, mostly ∼75 μm in size, was obtained by using an agate mortar at SKLCD. Based on the laser ablation microanalysis, the initial cassiterite powder was further milled using a planetary ball mill (PM100, Retsch, Germany) with a 50 mL agate jar and agate balls. Wet milling was adopted because it can effectively reduce the particle size, ensuring the homogeneity of the synthetic sample. Deionized water was used as an auxiliary agent for ball-milling in suspension. The total milling time for one sample was 12 h, consisting of 3 min of milling and a 1 min interval to cool down and allow the large and heavy particles to subside. The suspension containing ultrafine powder and deionized water was dried at 80 °C on a hotplate overnight. The dry powder was manually milled for 30 min using an agate mortar the next morning before grain analysis. After the ultrafine milling process, the final grain size was reduced to d50 = 1.3 μm, and most particles at d90 were less than 6.6 μm, which was small enough for laser ablation.Approximately 0.5 g of cassiterite powder was loaded into a 2 mm-diameter Pt tube which was pre-cleaned with alcohol. After compacting, the Pt-tube loaded with cassiterite powder was sealed by welding. The sealed sample was then loaded into a Quickpress Piston-Cylinder at the School of Resources and Civil Engineering, Suzhou University. Taking into account the high melting point of cassiterite, the synthetic experiments were carried out at 300 °C, 600 °C, 800 °C, 900 °C and 1000 °C. The sample was heated for 3 h and then cooled down to room temperature while retaining the high pressure. The synthesized sample was first cut into two halves using an STX-202A diamond wire saw (Shenyang Kejing Auto-Instrument Co., Ltd) and cast into two epoxy mounts. The two epoxy mounts were directly polished three times with gradually finer diamond paste (from 9 to 1 μm). The mounts were washed first in deionized water and then placed in an electric plate and heated at 50 °C for 30 min. Two microdrilled samples were drilled from one cassiterite mount using microdrill sampling (RELION INDUSTRIES, USA) to determine Sn isotope ratios using bulk solution analysis. The other cassiterite mount was then carbon-coated before the electron probe microanalysis (EPMA).
2.3 Analytical methods
For in situ Sn isotope analysis, L4, L2, L1, C, H1, H2, H3, and H4 cups were used to collect 116Sn, 119Sn, 120Sn, 121Sb, 122Sn, 123Sb, 124Sn, and 125Te, respectively. The 125Te signal was measured to subtract the potential isobaric interference of 120Te on 120Sn, 122Te on 122Sn, and 124Te on 124Sn. In such a case the interference of Te on Sn could be calculated using the natural abundance ratios of Te![[thin space (1/6-em)]](https://www.rsc.org/images/entities/char_2009.gif) :120Te/125Te = 0.01400, 122Te/125Te = 0.36415, 124Te/125Te = 0.67507. The SSB method was selected to correct the instrumental mass bias. All measurements were performed in medium mass resolution (∼4000). Each in situ Sn isotope measurement was performed in the time-resolved mode, acquiring 100 cycles of each 0.524 s. The washout time between two Sn isotope measurements was 60 s. The backgrounds obtained on 116Sn, 119Sn, 120Sn, 121Sb, 122Sn, 123Sb, 124Sn, and 125Te were less than 0.1 mV, 0.5 mV, 3 mV, 2 mV, 1 mV, 2 mV, 1 mV, and 2 mV, respectively. During in situ analysis of cassiterite, the signal intensity of 125Te was less than 3 mV, and the calculated signal intensities of 120Te, 122Te, and 124Te were always less than 1 mV. Therefore, we believe that the interferences of Te do not influence the Sn isotope measurement in our method. Finally, Sn isotope ratios were firstly expressed as a per mil deviation relative to the bracketing standard and then converted into values relative to the reference material NIST SRM 3161a. Detailed instrumental parameters of NWRFemtoUC Dualwave femtosecond laser ablation are summarized in Table 1.
:120Te/125Te = 0.01400, 122Te/125Te = 0.36415, 124Te/125Te = 0.67507. The SSB method was selected to correct the instrumental mass bias. All measurements were performed in medium mass resolution (∼4000). Each in situ Sn isotope measurement was performed in the time-resolved mode, acquiring 100 cycles of each 0.524 s. The washout time between two Sn isotope measurements was 60 s. The backgrounds obtained on 116Sn, 119Sn, 120Sn, 121Sb, 122Sn, 123Sb, 124Sn, and 125Te were less than 0.1 mV, 0.5 mV, 3 mV, 2 mV, 1 mV, 2 mV, 1 mV, and 2 mV, respectively. During in situ analysis of cassiterite, the signal intensity of 125Te was less than 3 mV, and the calculated signal intensities of 120Te, 122Te, and 124Te were always less than 1 mV. Therefore, we believe that the interferences of Te do not influence the Sn isotope measurement in our method. Finally, Sn isotope ratios were firstly expressed as a per mil deviation relative to the bracketing standard and then converted into values relative to the reference material NIST SRM 3161a. Detailed instrumental parameters of NWRFemtoUC Dualwave femtosecond laser ablation are summarized in Table 1.
| Mass spectrometry | Neptune Plus™ |
|---|---|
| RF forward power | 1200 W |
| Interface cones | Nickel standard sampler cones and ‘H’ skimmer cones |
| Cooling gas | 15 L min−1 |
| Auxiliary gas | 0.8 L min−1 |
| Sample gas | 1.05 L min−1 |
| Resolution mode | Medium resolution |
| Sensitivity | ∼15 V for 120Sn |
| Integration times | 4.194 s for SN-MC-ICP-MS analysis; 0.524 s for LA-MC-ICP-MS analysis |
| Laser ablation system | |
| Laser type | Light conversions, Pharos HE |
| Output wavelength | 206 nm |
| Fluence | 0.6 J cm−2 |
| Laser beam | 20 μm |
| Pulse repetition rate | 6 Hz |
| Pulses | 348 |
| Carrier gas | 450 mL min−1 |
| Ablation mode and ablation duration | Line scan, 58 s |
3. Results and discussion
3.1 Morphology and electron probe microanalysis results
The synthetic product was cassiterite, recrystallized crystals and melt cassiterite glass, as confirmed with a laser micro-Raman spectrometer (Fig. 1f). The Raman spectrum of the synthetic cassiterite is identical to that of natural cassiterite from the RRUFF database (https://rruff.info/cassiterite/display=default/R040017). A systematic investigation of sintering temperatures of cassiterite powders was conducted at 300 °C, 600 °C, 800 °C, 900 °C, and 1000 °C. The surface morphology of the sintered cassiterite and pressed powder pellet is shown in Fig. 1a–e. There are no cracks and scratches but some micrometer grains on the pellet surface (Fig. 1c). At a low sintering temperature (300 °C), the cassiterite sample was not cemented and cannot be polished. When the sintering temperature was raised to 600 °C and 900 °C, the surface became smooth and dense (Fig. 1a and b). The synthesized cassiterite consisted mainly of melt cassiterite glass and some recrystallized cassiterites (Fig. 1d). When the sintering temperature was raised to 900 °C and 1000 °C, the amount of recrystallized cassiterite crystals increased significantly. The energy spectrum data also demonstrate that the recrystallized crystals are cassiterite in all samples. EDS analysis showed the homogeneity of the synthetic cassiterite and detected a little Si and Al, which might be introduced during the grinding and polishing process. Elemental distribution mapping was performed on whole synthesized cassiterite. The elemental maps did not display sector zoning of Sn from the edge to the core zone of the mount (Fig. 1g and h). Finally, a total of 17 EPMA measurements were conducted on the synthesized cassiterite including recrystallized crystals and melt cassiterite glass (Table 2). Quantitative compositional analyses show that the Sn contents are homogeneous.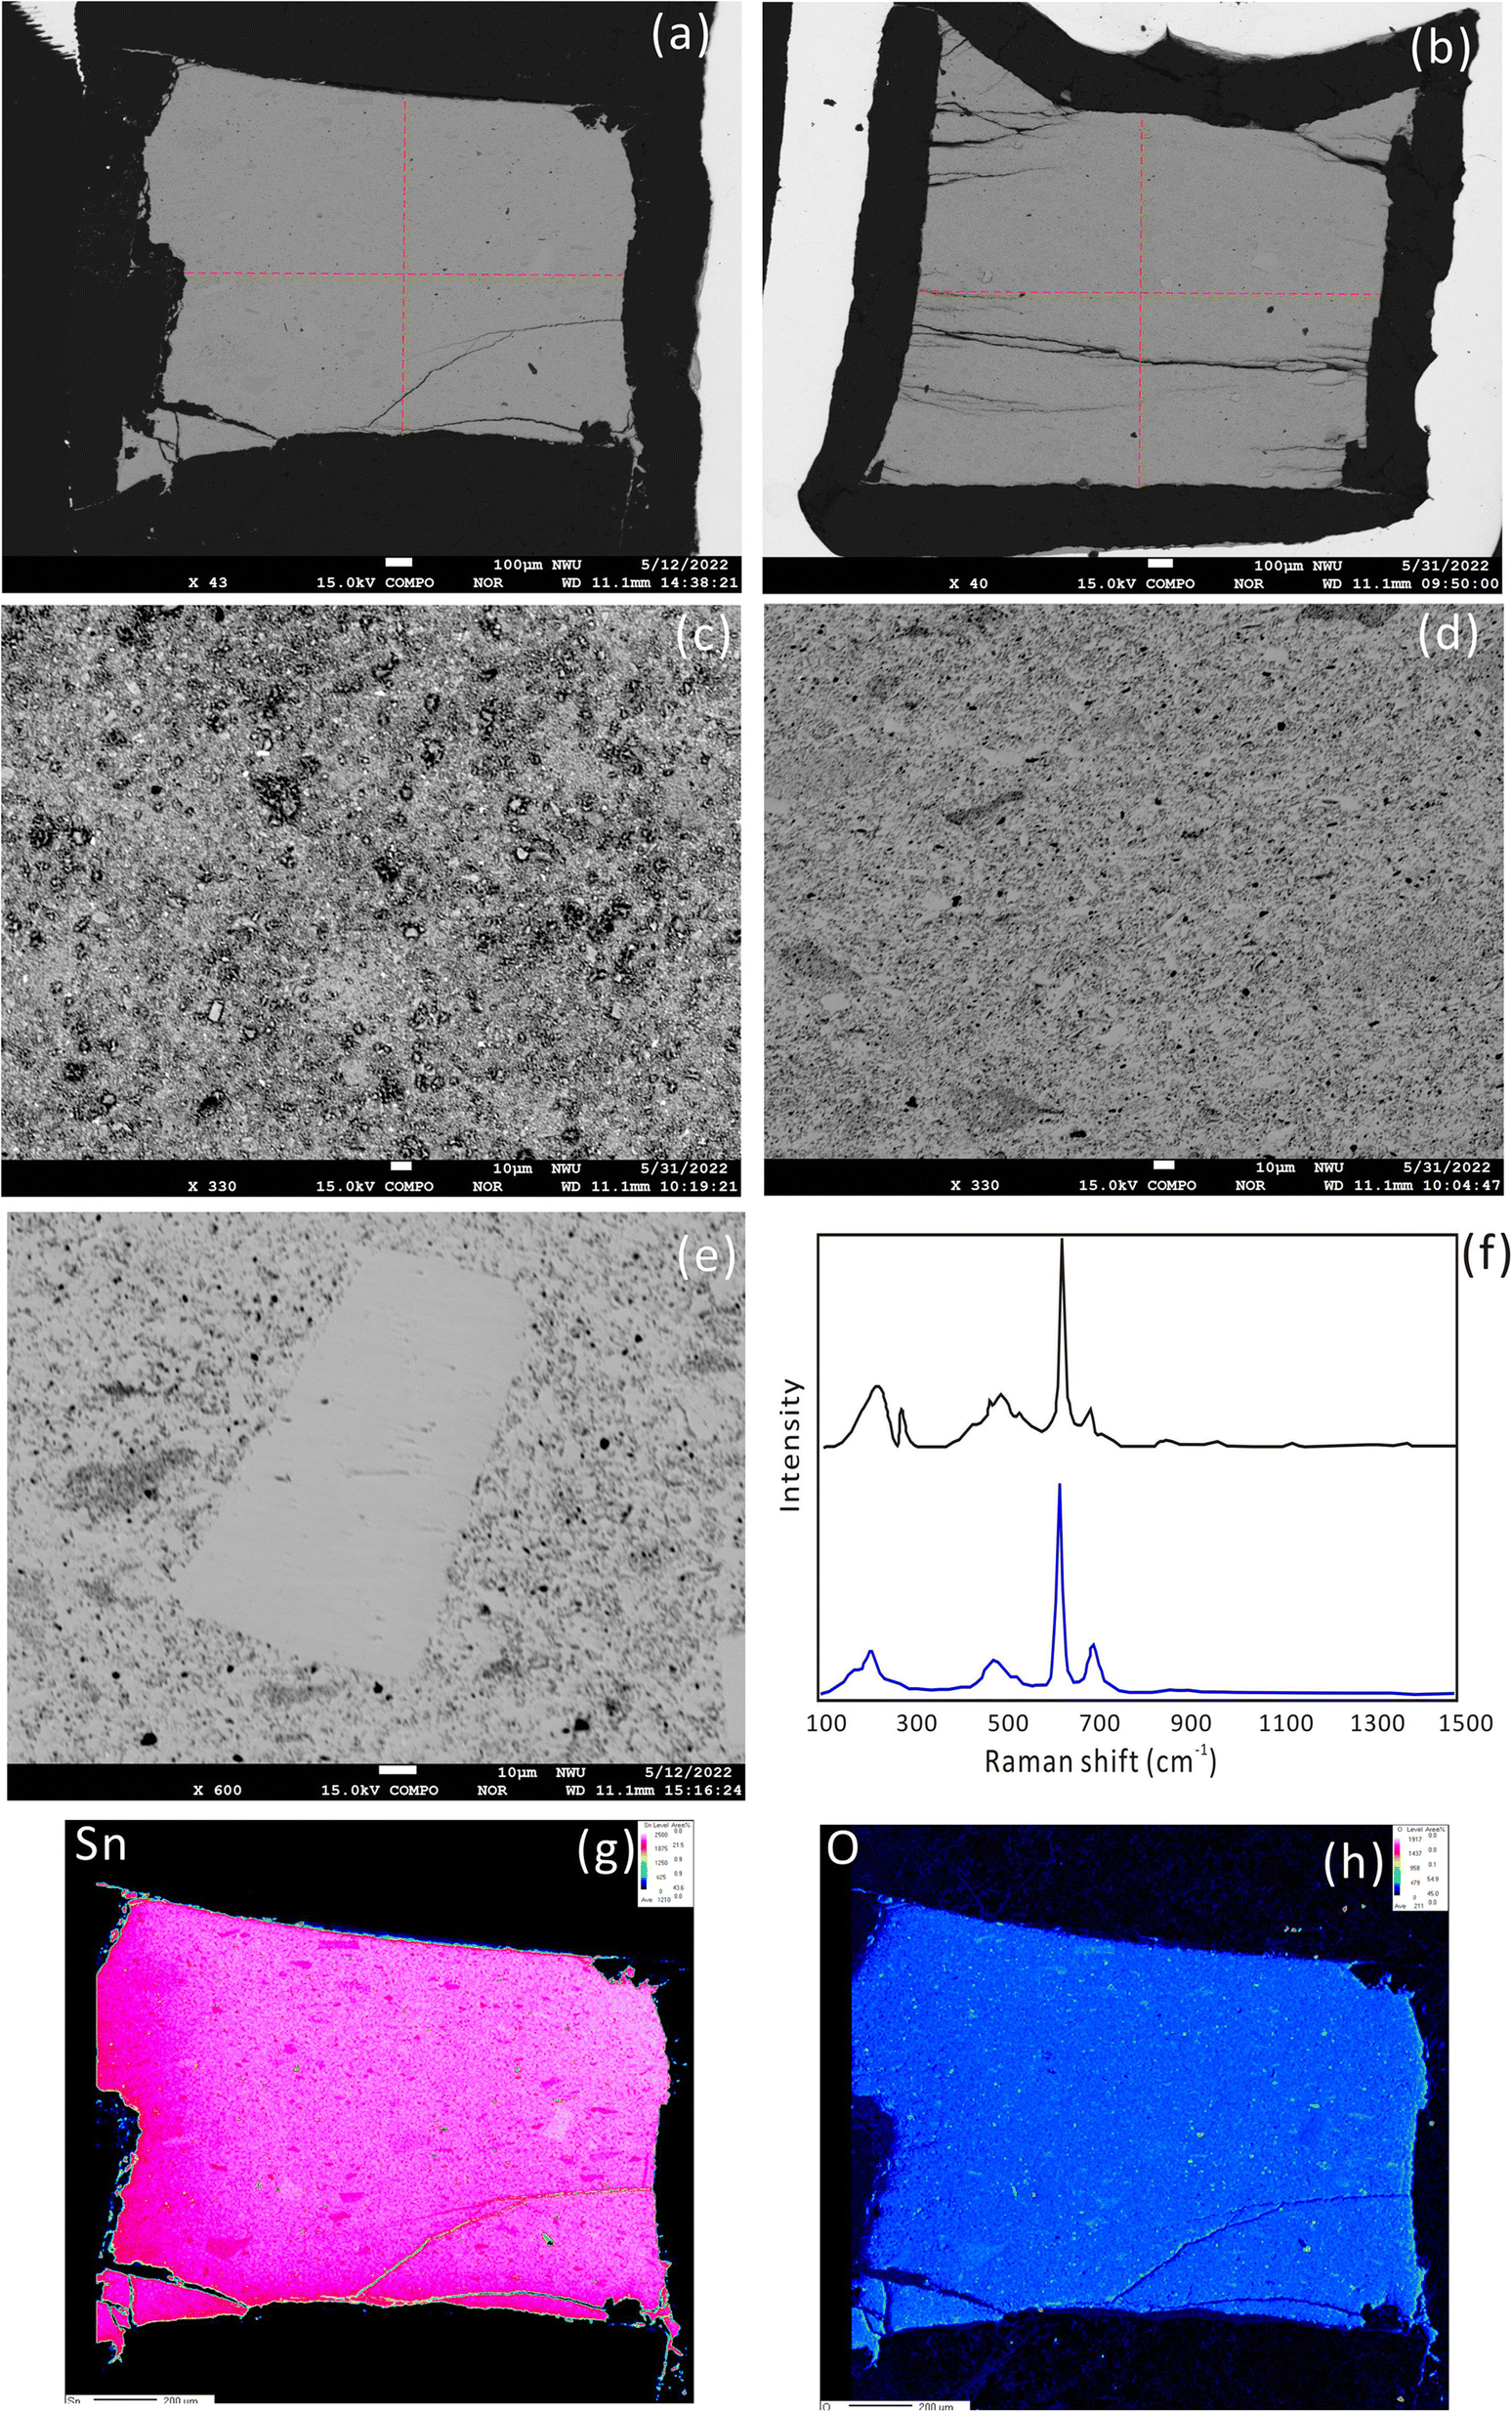 | ||
| Fig. 1 SEM images of cassiterite sintered at 600 °C (a and d) and 900 °C (b), pressed powder pellet (c) and a recrystallized cassiterite crystal (e). The Raman spectrum of the sintered cassiterite is identical to that of natural cassiterite from the RRUFF database (f). Elemental maps generated by EPMA showing the distribution of Sn and O elements in sintered cassiterite at 600 °C (g and h). | ||
| Sample ID | Al2O3 (%) | SiO2 (%) | SnO2 (%) |
|---|---|---|---|
| Recrystallized crystal 01 | 0.02 | 0.10 | 99.88 |
| Recrystallized crystal 02 | 0.00 | 0.08 | 99.92 |
| Recrystallized crystal 03 | 0.01 | 0.09 | 99.90 |
| Recrystallized crystal 04 | 0.00 | 0.03 | 99.96 |
| Recrystallized crystal 05 | 0.01 | 0.07 | 99.92 |
| Recrystallized crystal 06 | 0.00 | 0.10 | 99.90 |
| Glass 01 | 0.01 | 0.04 | 99.94 |
| Glass 02 | 0.06 | 0.08 | 99.87 |
| Glass 03 | 0.10 | 0.28 | 99.62 |
| Glass 04 | 0.00 | 0.36 | 99.63 |
| Glass 05 | 0.11 | 0.36 | 99.53 |
| Glass 06 | 0.02 | 0.20 | 99.78 |
| Glass 07 | 0.12 | 0.30 | 99.58 |
| Glass 08 | 0.01 | 0.20 | 99.79 |
| Glass 09 | 0.00 | 0.07 | 99.93 |
| Glass 10 | 0.00 | 0.15 | 99.85 |
| Glass 11 | 0.14 | 0.30 | 99.57 |
After the EPMA analyses, a nanosecond laser ablation investigation was conducted for the natural cassiterite and the synthesized samples. The spot ablation mode was used with a spot size of 43 μm, a frequency of 4 Hz and a laser fluence of 6 J cm−2. Fig. 2 shows that the signal profile of the pressed pellet was similar to that of the natural and synthesized cassiterites. However, the pressed cassiterite pellets showed the highest signal intensities, which were ∼1.3 times higher than that of the natural cassiterite. It has been confirmed by Feng et al. (2020)22 that a relatively lower mechanical resistance of the pellet would result in a higher ablation rate and higher signal intensity. However, the synthesized cassiterite at 300 °C showed the lowest signal intensity, which was ∼0.8 times lower than that of natural cassiterite. As the sintering temperature rose, the signal intensities and signal profiles of the synthesized cassiterite at 600 °C, 800 °C, 900 °C, and 1000 °C were consistent with those of natural cassiterite. The consistent signal intensities and signal profiles of cassiterite sintered at 600–1000 °C imply that the materials were approaching the theoretical maximal density.
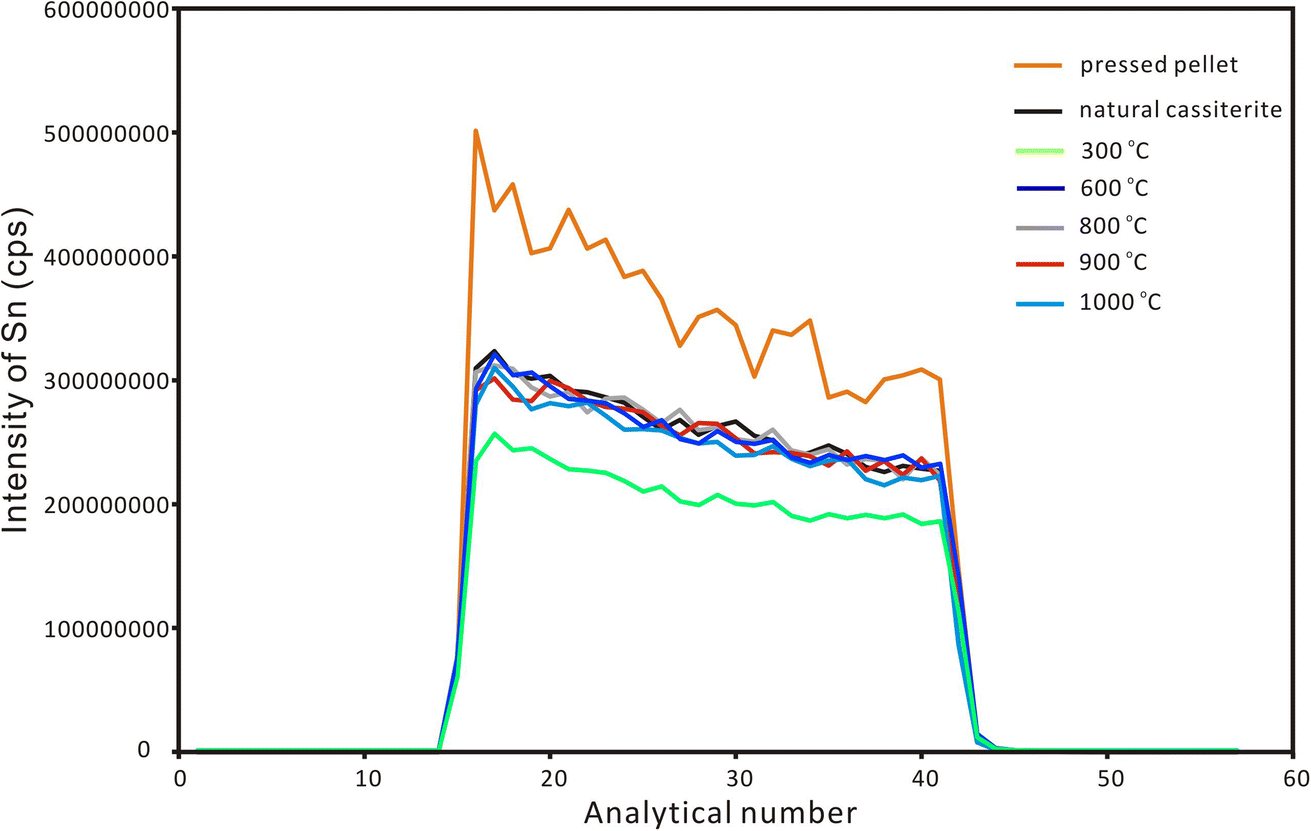 | ||
| Fig. 2 The ablation signal profiles of Sn for natural cassiterite, pressed powder pellet and synthesized cassiterites using LA-ICP-MS with single-spot mode. | ||
3.2 SN-MC-CIP-MS measurement results
Two microdrilled fractions of high-temperature sintered cassiterite and one original cassiterite powder sample were analyzed for Sn isotope ratios, and the results of bulk Sn isotope measurements are listed in Table 3. The δ124Sn/120Sn ratios of the two microdrilled fractions were 0.62 ± 0.03‰ (2SD, n = 2) and 0.59 ± 0.03‰ (2SD, n = 2), respectively, which agree well with that of the original powder sample (0.61 ± 0.01‰). The good consistency indicates no measurable Sn isotopic fractionation during the high-temperature sintering process. Therefore, the mean δ124Sn/120Sn ratio of 0.60 ± 0.03‰ (2SD, n = 5) determined by bulk SN-MC-ICP-MS measurement is suggested as a recommended δ124Sn/120Sn value for the synthesized cassiterite.| Sample ID | δ 116Sn/120Sn | 2SD | δ 117Sn/120Sn | 2SD | δ 118Sn/120Sn | 2SD | δ 119Sn/120Sn | 2SD | δ 122Sn/120Sn | 2SD | δ 124Sn/120Sn | 2SD | δ 124Sn/116Sn | 2SD | δ 122Sn/116Sn | 2SD |
|---|---|---|---|---|---|---|---|---|---|---|---|---|---|---|---|---|
| Microdrilled cassiterite | −0.61 | 0.02 | −0.48 | 0.01 | −0.30 | 0.01 | −0.16 | 0.01 | 0.28 | 0.02 | 0.58 | 0.01 | 1.19 | 0.01 | 0.89 | 0.02 |
| Microdrilled cassiterite | −0.64 | 0.02 | −0.48 | 0.01 | −0.31 | 0.00 | −0.17 | 0.01 | 0.30 | 0.01 | 0.60 | 0.02 | 1.23 | 0.03 | 0.94 | 0.02 |
| Microdrilled cassiterite | −0.67 | 0.01 | −0.51 | 0.01 | −0.32 | 0.01 | −0.17 | 0.01 | 0.32 | 0.02 | 0.61 | 0.01 | 1.27 | 0.00 | 0.99 | 0.02 |
| Microdrilled cassiterite | −0.68 | 0.01 | −0.52 | 0.01 | −0.33 | 0.02 | −0.18 | 0.01 | 0.33 | 0.00 | 0.63 | 0.02 | 1.30 | 0.01 | 1.01 | 0.01 |
| Original cassiterite powder | −0.65 | 0.03 | −0.49 | 0.02 | −0.31 | 0.01 | −0.17 | 0.02 | 0.32 | 0.01 | 0.61 | 0.01 | 1.25 | 0.03 | 0.97 | 0.04 |
| Mean | −0.65 | 0.05 | −0.50 | 0.03 | −0.32 | 0.02 | −0.17 | 0.02 | 0.31 | 0.04 | 0.60 | 0.03 | 1.25 | 0.09 | 0.96 | 0.09 |
3.3 Homogeneity of the synthetic cassiterite
Repeated measurements were conducted on multiple Sn solution standards to check the instrumental stability before fsLA-MC-ICP-MS analysis. For the purpose of interlaboratory comparison, the mean δ122Sn/116Sn isotope compositions of Spex CertiPrep Sn and SnCl4 solution are 0.43 ± 0.04‰ (2SD, n = 45) and 0.14 ± 0.07‰ (2SD, n = 46), respectively, which are consistent with the published values.21 The mean δ124Sn/120Sn values of Spex CertiPrep Sn solution standard (Lot# CL11-154SNY) in five sessions are −0.14 ± 0.05‰ (2SD, n = 30), −0.13 ± 0.03‰ (2SD, n = 20), −0.14 ± 0.04‰ (2SD, n = 31), −0.14 ± 0.05‰ (2SD, n = 18), and −0.12 ± 0.05‰ (2SD, n = 44), respectively. The good precision and accuracy confirm that the instrument stability is suitable for in situ Sn isotope analysis by fsLA-MC-ICP-MS.Based on the aforementioned morphology and laser ablation results, the synthetic cassiterite at 600 °C and 900 °C was tested for the homogeneity of Sn isotope composition. Due to the lack of a cassiterite reference material, one half of the synthetic cassiterite sintered at 600 °C served as a bracketing standard, and the Sn isotope ratios were determined along the red line on the cross-section (Fig. 1a and b). All Sn isotope ratios measured on cassiterite glass are plotted in Fig. 3. Section 1 consisted of 13 Sn isotopic measurements on sintered cassiterite at 600 °C, yielding δ124Sn/120Sn values from −0.08‰ to 0.10‰, with a mean value of 0.03 ± 0.10‰ (2SD, n = 13). Likewise, in situ Sn isotope measurements in Section 2 yielded δ124Sn/120Sn values from −0.04‰ to 0.09‰, with a mean value of 0.04 ± 0.08‰ (2SD, n = 12). A total of 28 fsLA-MC-ICP-MS measurements were performed on cassiterite sintered at 900 °C to investigate the homogeneity. In situ Sn isotope measurements in Sections 3 and 4 yielded δ124Sn/120Sn values from −0.08‰ to 0.07‰, with a mean value of −0.01 ± 0.07‰ (2SD, n = 14) and −0.00 ± 0.07‰ (2SD, n = 14), respectively. The δ124Sn/120Sn precision expressed as 2s standard deviation in all four sections determined using fsLA-MC-ICP-MS was better than 0.10‰ without systematic variation, indicating good tin isotopic homogeneity of the synthesized cassiterite. Moreover, the Sn isotope ratios of recrystallized crystals were determined separately by using cassiterite glass as a bracketing standard. The δ124Sn/120Sn values of twelve recrystallized crystal grains range from −0.02‰ to 0.06‰, with a mean value of 0.02 ± 0.06‰ (2SD, n = 12), suggesting no measurable Sn isotopic fractionation between recrystallized crystal and cassiterite glass.
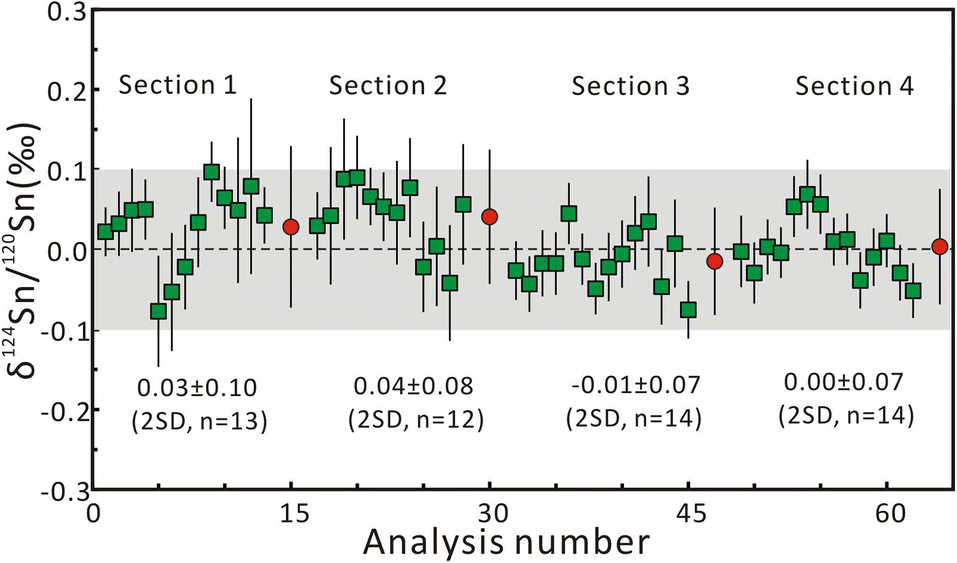 | ||
| Fig. 3 The results of δ124Sn/120Sn measurements on sintered cassiterite along the red line on the cross-section in Fig. 1. The red circle represents the mean δ124Sn/120Sn value of each section. The error bars represent 2 standard errors. | ||
The δ124Sn/120Sn values of the original cassiterite crystal were analyzed to investigate the effect of particle size. Fig. 4 shows that the 2SD for δ124Sn/120Sn was improved from 0.64‰ (original cassiterite crystal) to 0.10‰ (synthesized cassiterite). The precision was greatly improved compared to that for the original cassiterite crystal, although analyses on both samples gave coinciding results. Finally, the mean δ124Sn/120Sn values of the synthesized cassiterite (600 °C) measured on five different days were 0.00 ± 0.10‰ (2SD, n = 16), 0.00 ± 0.08‰ (2SD, n = 21), 0.01 ± 0.08‰ (2SD, n = 48), 0.00 ± 0.06‰ (2SD, n = 46), and 0.00 ± 0.07‰ (2s, n = 37) (Fig. 5a). As shown in Fig. 5b, all 168 measured δ124Sn/120Sn ratios in five days follow the Gaussian distribution and give a grand mean of 0.00 ± 0.07‰ (2SD, n = 168). Therefore, repeated analyses of the cassiterite sintered at 600 °C yielded a good external reproducibility of 0.07‰, demonstrating that the homogeneous distribution of Sn isotopes meets the requirement of in situ Sn isotope analysis by fsLA-MC-ICP-MS. For individual fsLA-MC-ICP-MS analysis for the synthesized cassiterite, see Appendix S1.†
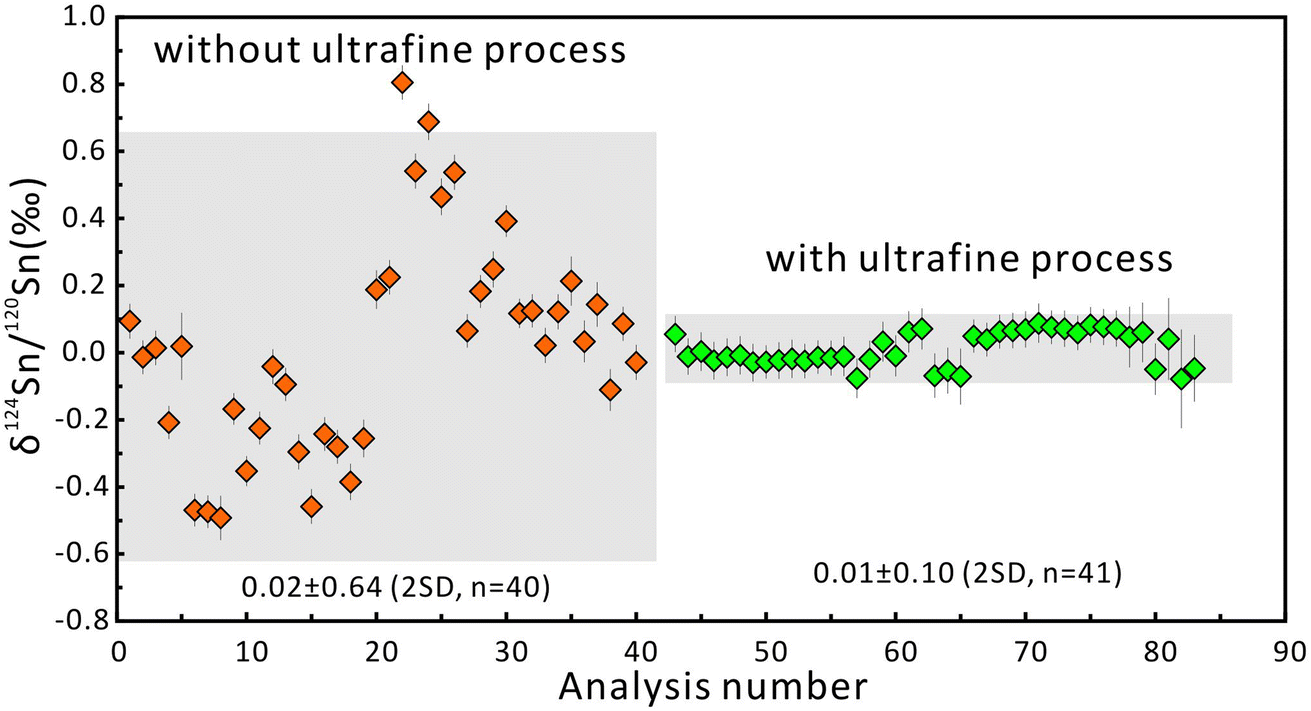 | ||
| Fig. 4 The δ124Sn/120Sn values of the original crystal and the synthesized cassiterite. The error bars represent 2 standard errors. The error bars for the average values represent 2SD. | ||
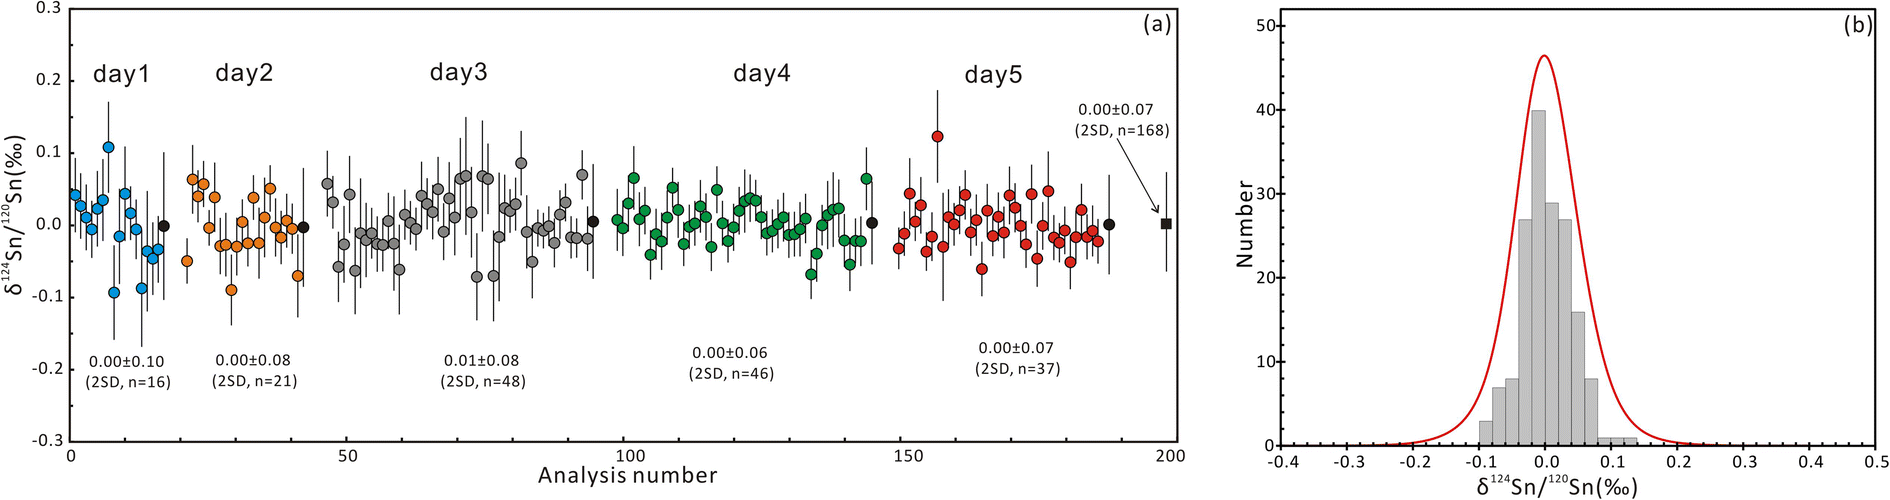 | ||
| Fig. 5 (a) δ124Sn/120Sn values of cassiterite sintered at 600 °C measured on five different days using fsLA-MC-ICP-MS analyses and (b) frequency histograms and probability density curves. The black circles represent the mean values obtained each day and the black square represents the mean value obtained in five days. | ||
4. Conclusion
Synthetic cassiterite (500 μm) has been produced from micrometer powders of natural cassiterite under conditions of 600 °C and 1 GPa for 3 h. The signal intensity and signal profile of the synthesized cassiterite were consistent with those of natural cassiterite, indicating that the sintered cassiterite approximates the theoretical maximal density. Tin isotope ratios of the synthetic cassiterite determined by fsLA-MC-ICP-MS confirm the homogeneity within the analytical uncertainties of 0.10‰ for δ124Sn/120Sn (2SD). Compared with the original cassiterite crystal, the analytical reproducibility of the synthesized cassiterite was improved from 0.64‰ to 0.10‰ (2SD, δ124Sn/120Sn). The mean δ124Sn/120Sn ratio of 0.60 ± 0.03‰ (2SD, n = 5) determined by bulk SN-MC-ICP-MS measurement is suggested as a recommended δ124Sn/120Sn value for the synthesized cassiterite. Here, the combination of ultra-fine powders and the high-temperature sintering technique is recommended as an ideal synthesis scheme. The high-temperature sintering technique provides a rapid solidification of ultra-fine cassiterite powders and the development of matrix-matched reference materials.Conflicts of interest
The authors declare that they have no conflict of interest.Author contributions
Duo Zhang and Zhian Bao designed and performed the main experiments. Peng Liu led the project, conceived the study, and interpreted the data. Wenqiang Yang performed the EPMA analyses. Gerhard Brügmann performed the Sn isotope analysis of the SN-MC-ICP-MS. All co-authors contributed to the paper writing.Acknowledgements
We thank Dr Mingliang Wang for his help with the synthesis experiment. This work was financially supported by the National Natural Science Foundation of China (Grant No. 42173033, 42130102, 41825007, 41902072) and the MOST Research Foundation from the State Key Laboratory of Continental Dynamics.References
- J. R. De Laeter and P. M. Jeffery, J. Geophys. Res., 1965, 70, 2895–2903, DOI:10.1029/JZ070i012p02895.
- R. D. Loss, K. J. R. Rosman and J. R. de Laeter, Geochim. Cosmochim. Acta, 1990, 54, 3525–3536, DOI:10.1016/0016-7037(90)90302-2.
- X. Wang, Q. Amet, C. Fitoussi and B. Bourdon, Geochim. Cosmochim. Acta, 2018, 228, 320–335, DOI:10.1016/j.gca.2018.02.014.
- X. Wang, C. Fitoussi, B. Bourdon, B. Fegley and S. Charnoz, Nat. Geosci., 2019, 12, 707–711, DOI:10.1038/s41561-019-0433-4.
- X. Wang, C. Fitoussi, B. Bourdon, K. Righter and Q. Amet, Geochim. Cosmochim. Acta, 2021, 312, 139–157, DOI:10.1016/j.gca.2021.08.011.
- N. Badullovich, F. Moynier, J. Creech, F. Z. Teng and P. A. Sossi, Geochemical Perspectives Letters, 2017, 5, 24–28, DOI:10.7185/geochemlet.1741.
- J. B. Creech and F. Moynier, Chem. Geol., 2019, 511, 81–90, DOI:10.1016/j.chemgeo.2019.02.028.
- P. Černý, P. L. Blevin, M. Cuney and D. London, Economic Geology 100th Anniversary Volume, Society of Economic Geologists, 2005, pp. 337–370 Search PubMed.
- P. Liu, J. Mao, B. Lehmann, S. Weyer, I. Horn, R. Mathur, F. Wang and Z. Zhou, Am. Mineral., 2021, 106, 1980–1986, DOI:10.2138/am-2021-7558.
- J. Yao, R. Mathur, W. Powell, B. Lehmann, F. Tornos, M. Wilson and J. Ruiz, Am. Mineral., 2018, 103, 1591–1598, DOI:10.2138/am-2018-6524.
- J. R. de Laeter and P. M. Jeffery, Geochim. Cosmochim. Acta, 1967, 31, 969–985, DOI:10.1016/0016-7037(67)90074-9.
- R. Clayton, P. Andersson, N. H. Gale, C. Gillis and M. J. Whitehouse, J. Anal. At. Spectrom., 2002, 17, 1248–1256, 10.1039/B205835A.
- M. Haustein, C. Gillis and E. Pernicka, Archaeometry, 2010, 52, 816–832, DOI:10.1111/j.1475-4754.2010.00515.x.
- F. Moynier, T. Fujii and P. Telouk, Anal. Chim. Acta, 2009, 632, 234–239, DOI:10.1016/j.aca.2008.11.015.
- R. Mathur, W. Powell, A. Mason, L. Godfrey, J. Yao and M. E. Baker, Geostand. Geoanal. Res., 2017, 41, 701–707, DOI:10.1111/ggr.12174.
- X. Wang, C. Fitoussi, B. Bourdon and Q. Amet, J. Anal. At. Spectrom., 2017, 32, 1009–1019, 10.1039/C7JA00031F.
- L. Zhang, J. Li, Y.-G. Xu and Z.-Y. Ren, J. Anal. At. Spectrom., 2018, 33, 555–562, 10.1039/C8JA00016F.
- E. Yamazaki, S. Nakai, T. Yokoyama, S. Ishihara and H. Tang, Geochem. J., 2013, 47, 21–35, DOI:10.2343/geochemj.2.0237.
- G. Brügmann, D. Berger and E. Pernicka, Geostand. Geoanal. Res., 2017, 41, 437–448, DOI:10.1111/ggr.12166.
- M. Schulze, M. Ziegerick, I. Horn, S. Weyer and C. Vogt, Spectrochim. Acta, Part B, 2017, 130, 26–34, DOI:10.1016/j.sab.2017.02.002.
- J.-X. She, T. Wang, H. Liang, M. N. Muhtar, W. Li and X. Liu, Geochim. Cosmochim. Acta, 2020, 269, 184–202, DOI:10.1016/j.gca.2019.10.033.
- Y. Feng, W. Zhang, Z. Hu, T. Luo, M. Li, Y. Liu, H. Liu and Q. Li, J. Anal. At. Spectrom., 2022, 37, 551–562, 10.1039/D1JA00392E.
Footnote |
| † Electronic supplementary information (ESI) available. See DOI: https://doi.org/10.1039/d2ja00362g |
| This journal is © The Royal Society of Chemistry 2023 |