
Influence of ambient pressure on spatial–temporal evolution of local thermodynamic equilibrium for laser-induced plasma
Wei
Ke
,
Xiaohua
Wang
,
Minyuan
Chen
,
Huan
Yuan
 *,
Aijun
Yang
*,
Jifeng
Chu
,
Dingxin
Liu
and
Mingzhe
Rong
*,
Aijun
Yang
*,
Jifeng
Chu
,
Dingxin
Liu
and
Mingzhe
Rong
School of Electrical Engineering, Xi'an Jiaotong University, Xi'an 710049, PR China. E-mail: huanyuan@xjtu.edu.cn; yangaijun@mail.xjtu.edu.cn
First published on 1st December 2022
Abstract
Laser-induced breakdown spectroscopy (LIBS) is used for quantitative detection based on the fact that the laser-induced plasma (LIP) is in local thermodynamic equilibrium (LTE). However, the radiation lifetime of the LIP is of the order of microseconds or less, resulting in the rapid change of physical properties inside the LIP, and the duration of LIP in LTE is very short. Numerous studies have shown that ambient pressure has significant influence on the LIP, but the influence of ambient pressure on the spatial–temporal evolution of LTE for LIP is still not clear, and the mechanism of the influence of ambient pressure on the LIP is obscure. In the present study, the spatially–temporally resolved spectra of the LIP were analyzed from the laser incident direction, and the influence of ambient pressure on the spatial–temporal evolution of LTE for LIP was studied. The experimental results showed that the LIP deviates from LTE when it is farther away from the plasma core and there is a longer delay time. Moreover, the results indicated that ambient pressure has a significant influence on the spatial–temporal evolution of LTE. In a higher ambient pressure environment, the ion energy level population of LIP is much closer to Boltzmann distribution and the LIP deviates from LTE faster with the increase of distance from the LIP core and slower with the increase of delay time. Finally, the moment at which the LIP core begins to depart from LTE decreases rapidly with the ambient pressure. This work is helpful for understanding the influence of ambient pressure on LIP, optimizing the experimental parameters of LIBS, and providing references for LIBS applications.
1 Introduction
Laser-induced breakdown spectroscopy (LIBS) has been widely used for its advantages of fast detection, less sample damage, and online detection ability.1–5 In practical applications, it is often assumed that the laser-induced plasma (LIP) is in local thermodynamic equilibrium (LTE). When the LIP is in LTE, its electron energy distribution can be described by the Maxwell distribution function,6 and the excitation temperature, ionization temperature, and electron temperature of the LIP are equal.7,8 Therefore, one can diagnose the LIP by some typical approaches such as the Boltzmann plot9 and Saha–Boltzmann equation.10 In the calibration quantitative analysis based on LIBS, LTE assumption is the precondition of the relationship between spectral intensity and substance concentration.9 When the LIP is in LTE, a quantitative analysis is beneficial. Usually, the radiation lifetime of the LIP is very short, a few micro-seconds to more than 10 microseconds at atmospheric pressure, but only hundreds of nanoseconds in a vacuum.11 As a result, the physical properties of the LIP change very fast, and the duration of LIP in LTE is very short. Therefore, it is necessary to evaluate LTE of LIP and provide references for LIBS applications.Researchers have made numerous studies on the LTE of LIP. Zelin Liu et al. studied the spatially and temporally resolved spectra of Si at 10−5 mbar and proposed a new analytical method “coefficient v” to validate LTE in laser-induced plasmas,6 and it was found that the LIP departs from LTE with the increase of distance from the target. Giacomo et al. ablated titanium dioxide and monoxide targets in a low-pressure environment and found that 5–10 ns after the pulsed laser,12 the LIP at 0.6 mm away from the target surface was in LTE by the state-to-state collisional radiative model. Mendys et al. studied laser-induced Al plasma at atmospheric pressure and obtained the electron temperature and electron density of the LIP core with a delay time Td from 600 ns to 3 μs by Thomson scattering technology.13 The existence of LTE for the LIP was verified by comparing the rates of equilibrium collisional to radiative processes (the McWhirter criterion). Skoćić et al. simulated plasma expansion by Monte Carlo simulation and compared the simulation results with the spectra of Cu plasma measured at 200 Pa.14 It was found that for a large enough initial plasma whose expansion is slow, the duration of LIP in the LTE state depends on the electron temperature of LIP.
The physical process of laser-induced plasma is very complex with many influencing factors, among which ambient pressure is one of the key factors. The influence of ambient pressure on laser-induced plasma has been studied extensively.15–19 Researchers found that ambient pressure can significantly affect the plasma morphology,15,16 spectra,18,19 electron temperature, electron density,20etc., but there are few studies on the influence of ambient pressure on the LTE of LIP. When the LIP is in LTE, the Boltzmann plot, the Saha–Boltzmann equation and other relatively typical methods can be used to diagnose the LIP,9,10 which is helpful for understanding the influence of ambient pressure on the LIP. Therefore, the influence of ambient pressure on the LTE evolution of LIP needs to be further studied.
In the present study, the spectra of LIP were collected from the laser incident direction, and mapped to the coordinate space of laboratory. The spatially–temporally resolved spectra of the LIP were analysed in a high-pressure environment (at 103 Pa, 104 Pa, and 105 Pa) and low-pressure environment (at 10−3 Pa, 10−1 Pa, and 10 Pa). The influence of ambient pressure on the spatially–temporally resolved evolution of LTE for LIP was studied. The present study is helpful to understand the influence of ambient pressure on the evolution of LIP, optimize the experimental parameters of LIBS, and provide references for LIBS application.
2 Theoretical method
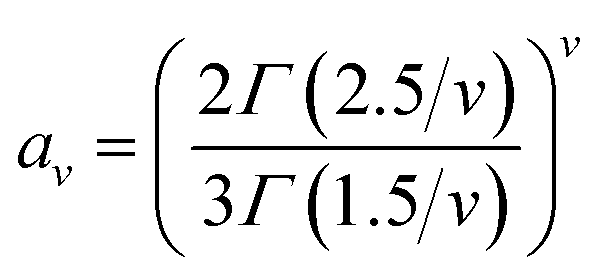
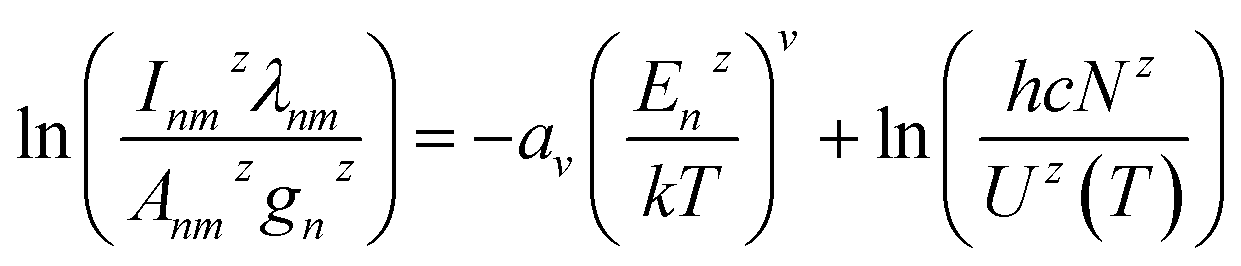
The electromagnetic radiation of LIP comes from the process of transition between the high energy excited state and low energy ground state or metastable state. For the LIP, after the pulsed laser, the population of high-energy excited particles in the LIP mainly comes from the collision of electrons, and a small part comes from the collision of heavy particles.21 Therefore, electron energy distribution functions (EEDF) can describe the LIP well, regardless of the LIP in LTE or non-LTE.According to the EEDF, Zelin Liu et al. proposed a new approach to estimate the LTE of LIP, which is different from the McWhirter criterion.6 This criterion does not need to calculate the plasma electron density and temperature under the assumption of LIP in LTE. The intensity I of the spectral line can be expressed as6
 | (1) |
 | (2) |
 | (3) |
When the coefficient v = 1, and eqn (3) is simplified into the Boltzmann distribution,9 it means that the ion energy level population of LIP is in Boltzmann distribution; therefore, the plasma excitation temperature can be calculated by the Boltzmann plot. When the coefficient v > 1, it means that the ion energy level population of LIP is not in Boltzmann distribution; it indicates that the LIP has deviated from LTE, and the left term ln(Inmzλnm/Anmzgnz) of eqn (3) has a power function relationship with the energy Enz. The larger the power v is, the more the plasma deviates from LTE.
3 Experimental setup
Fig. 1 is the experimental LIBS system of this study. The pulsed laser is generated by a Nd:YAG laser (Quantel Q-Smart 850, Franch) with 1064 nm wavelength, 6 ns pulse width, 1 Hz repetition rate, and 50 mJ energy. It is focused on a T2 copper target by a 2 inch dichromatic mirror (reflection: 420–900 nm, transmission: 990–1600 nm) and a 2-inch quartz plane convex focus lens 1 with focal length f = 175 mm. After adjusting the light path, the laser spot paper (thickness of 0.25 mm measured using a vernier caliper) is placed on the surface of the target, the size of the pulsed laser ablation pit is measured using an optical microscope, and the size of the ablation pit is about 0.02 cm−2. The T2 copper target contains 99.95% Cu and 0.05% impurities (including Zn, Mn, P, Ni, Sb, Al, Sn, Fe, etc.) and is fixed on the translation stage in the vacuum chamber. The translation stage can step in the X and Y directions with 1 mm accuracy to control the ablation position of the pulsed laser on the target. The vacuum chamber observation window is made of quartz glass with light transmittance greater than 95% (wavelength: 300–1500 nm). The vacuum chamber is pumped to the desired pressure using a mechanical pump and molecular pump. The pressure of the vacuum chamber is measured using a Pirani gauge and hot-cathode ionization vacuum gauge, the measurement range of which is from 5 × 10⁻⁵ Pa to 1.33 × 10⁵ Pa.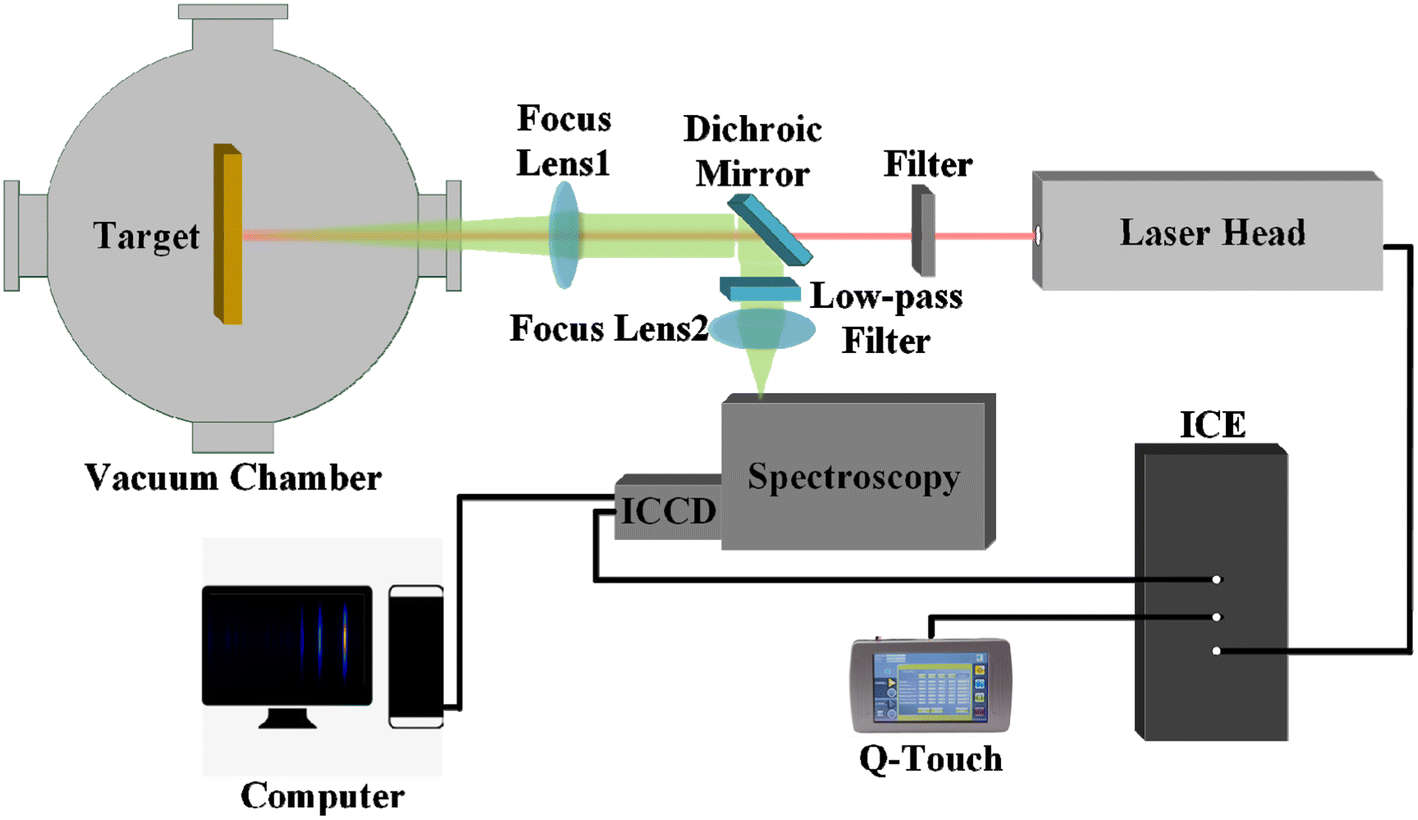 | ||
| Fig. 1 Schematic of the LIBS experimental system. | ||
The LIP beam returns through the focus lens 1 and focuses on the slit of the spectrometer (ZOLIX Omni-λ5008i, China) through the dichromatic mirror and a 2 inch quartz plane convex focus lens 2 with focal length f = 125 mm. The width of the slit is 100 μm. A low-pass filter is placed between the focus lens 2 and the dichromatic mirror (light transmittance greater than 90% at 280–1000 nm and less than 5% at 1000–2000 nm) to block possible pulsed laser to protect the spectrometer. An intensified charge coupled device (ICCD, Andor Istar-SCMOS-18U-04, UK) is installed on the output port of the spectrometer to receive the LIP spectra. The trigger-in port of the ICCD is connected to the Q-switch signal of the pulsed laser. Gate width and gain of the ICCD are set at 50 ns and 2500, respectively. In this experiment, the delay time Td represents the time difference between the internal exposure time of the ICCD and the time of the laser energy peak. For example, Td = 100 ns means that 100 ns after the laser energy peak time, the ICCD began to collect LIP's spectra.
Fig. 2(a) is the LIP image taken by placing the ICCD at the slit of the spectrometer. As the plasma is imaged along the direction of the pulsed laser incidence, plasma expansion along the normal direction of the target cannot be observed; therefore, it can only be seen from the LIP image that the plasma expands along the direction of the target surface. The black circle in Fig. 2(a) is the pulsed laser ablation point. In Fig. 2(a), r represents the distance from the plasma core, and r = 0 is the plasma core. Therefore, it can be assumed that the LIP is centrally symmetric and radially distributed along the radius r. Fig. 2(b) is the spectral image taken by the ICCD in the LIBS system in Fig. 1. According to the test results of the spectrometer in direct mode, the length of 100 pixels in Fig. 2(b) is 1 mm; that is, the length of 1 pixel corresponds to 0.01 mm in the coordinate system of laboratory. In Fig. 2(a), the solid black box region of the LIP is dispersed by the spectrometer, corresponding to the spectra in the red rectangular box of Fig. 2(b). Fig. 2(c) shows the spectra of the image in the red box in Fig. 2(b). The target used in the present study is T2 copper. The main Cu I spectra collected are shown in Fig. 2(c); since the radiation lifetime of each spectrum is not consistent, five copper atomic spectra with long radiation lifetimes are selected, including Cu I 427.51 nm, Cu I 465.11 nm, Cu I 510.55 nm, Cu I 515.32 nm, and Cu I 521.81 nm. The spectra in Fig. 2(c) had subtracted background noise on the basis of the original data of the spectra. The data of the above Cu element spectra are shown in Table 1, which comes from the NIST database.22 What is worth noting is that by consulting the NIST database, the ratio of the spectral intensity of 522.007 nm and 521.82 nm is 1![[thin space (1/6-em)]](https://www.rsc.org/images/entities/char_2009.gif) :5, and the spectral intensity of 521.82 nm used in this paper has been corrected according to the ratio of 1:5.
:5, and the spectral intensity of 521.82 nm used in this paper has been corrected according to the ratio of 1:5.
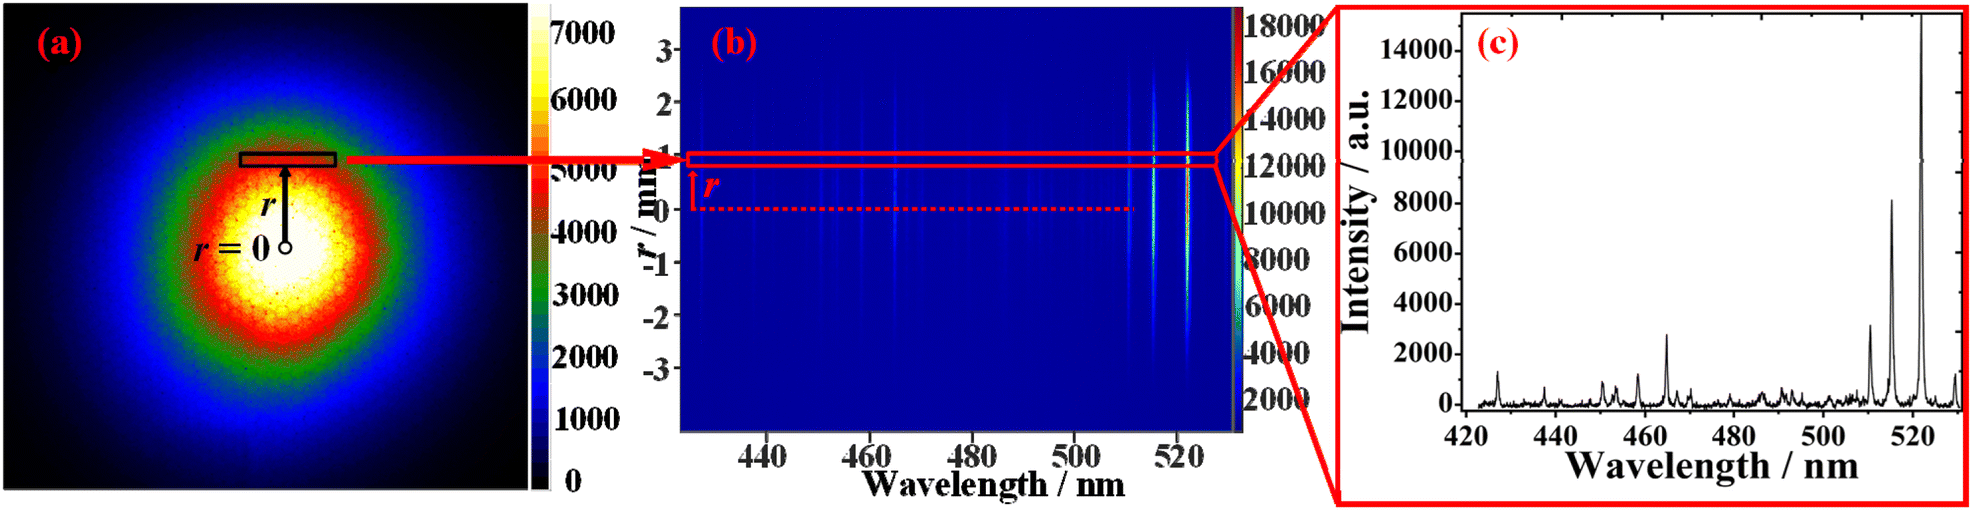 | ||
| Fig. 2 (a) Image of LIP taken by placing the ICCD at the slit of the spectrometer, the delay time Td = 500 ns, gate width is 50 ns, ambient pressure is 103 Pa, 10 laser pulses were accumulated; (b) the spectra taken by the ICCD, the spectral range is 421.00–528.61 nm, the delay time Td = 500 ns, gate width is 50 ns, ambient pressure is 103 Pa, 10 laser pulses were accumulated; (c) spectra of (b) in the red box. | ||
| λ (nm) | E m (eV)–En (eV) | Lower level, term, J – upper level, term, J | A nm (s−1) | Upper energy level Enz (eV) |
|---|---|---|---|---|
| 427.51 | 4.8383–7.7380 | 3d9(2D)4s4p(3P°), 4P°, 5/2 – 3d94s(3D)5s, 4D, 7/2 | 3.45 × 10⁷ | 7.7380 |
| 465.11 | 5.0727–7.7380 | 3d9(2D)4s4p(3P°), 4F°, 9/2 – 3d94s(3D)5s, 4D, 7/2 | 3.80 × 10⁷ | 7.7380 |
| 510.55 | 1.3891–3.8171 | 3d94s2, 2D, 5/2 – 3d104p, 2P°, 3/2 | 2.0 × 10⁶ | 3.8171 |
| 515.32 | 3.7864–6.1919 | 3d104p, 2P°, 1/2 – 3d104d, 2D, 3/2 | 6.0 × 10⁷ | 6.1919 |
| 521.82 | 3.8172–6.1928 | 3d104p, 2P°, 3/2 – 3d104d, 2D, 5/2 | 7.5 × 10⁷ | 6.1928 |
In the present study, the laser energy decreases to about 39 mJ after passing through the dichromatic mirror, focusing lens and observation window of the vacuum chamber; that is, the laser energy is 39 mJ at the target surface, and the energy density is about 1.95 J cm−2. Researchers have found that the self-absorption effect of the Cu I 521.82 nm spectrum can be ignored when the laser energy density is 4.5 J cm−2 in the atmospheric environment;23 what's more, the self-absorption is weaker in a lower pressure environment; so, the self-absorption of Cu I 521.8 nm in the present study can be ignored. In addition, the researchers have found that the spectra of Cu I 515.32 nm, Cu I 510.55 nm, Cu I 465.11 nm, and Cu I 427.51 nm have smaller self-absorption than Cu I 521.81 nm at the same conditions. Therefore, the self-absorption effect of atomic spectral lines used in this experiment can be ignored.
4 Results and discussion
Fig. 3 shows the spectra of the LIP core (r = 0) at a specific pressure and moment. The spectra in Fig. 3 are raw data without removing ICCD background noise. Fig. 3(a)–(d) shows the spectra of the LIP core at 10−3 Pa, 10 Pa, 103 Pa, and 105 Pa, respectively. It can be seen from Fig. 3 that the LIP in a higher pressure environment (103 Pa and 105 Pa) has stronger radiation and longer radiation lifetime; in a lower pressure environment (10−3 Pa and 10 Pa), the spectral radiation of LIP is very weak and is very difficult to detect when the delay time Td > 600 ns. | ||
| Fig. 3 Typical spectra of the LIP core (r = 0); (a) pressure is 10−3 Pa, delay time Td = 0, 50, 100, 200, 400, and 600 ns; (b) pressure is 10 Pa, delay time Td = 0, 50, 100, 200, 300, and 400 ns; (c) pressure is 103 Pa, delay time Td = 0, 50, 100, 500, 2000, and 3500 ns; (d) pressure is 105 Pa, delay time Td = 0, 50, 100, 500, 2000, and 5000 ns. | ||
4.1 Spatially resolved evolution of LTE
Fig. 4(a) shows the LIP spectra when the ambient pressure is 103 Pa, delay time Td = 400 ns, and radius r = 0, 0.4, 0.8, 1.2, and 1.6 mm. It can be seen from Fig. 4(a) that the spectral intensity decreases against the radius r. Considering the different quantum efficiency of ICCD photosensitive devices and diffraction efficiency of the grating in the spectrometer for different wavelengths of light, the intensity of the selected spectral line in this study has been corrected according to the quantum efficiency of ICCD photosensitive devices and diffraction efficiency of the grating to ensure that the LIP spectra will not be distorted.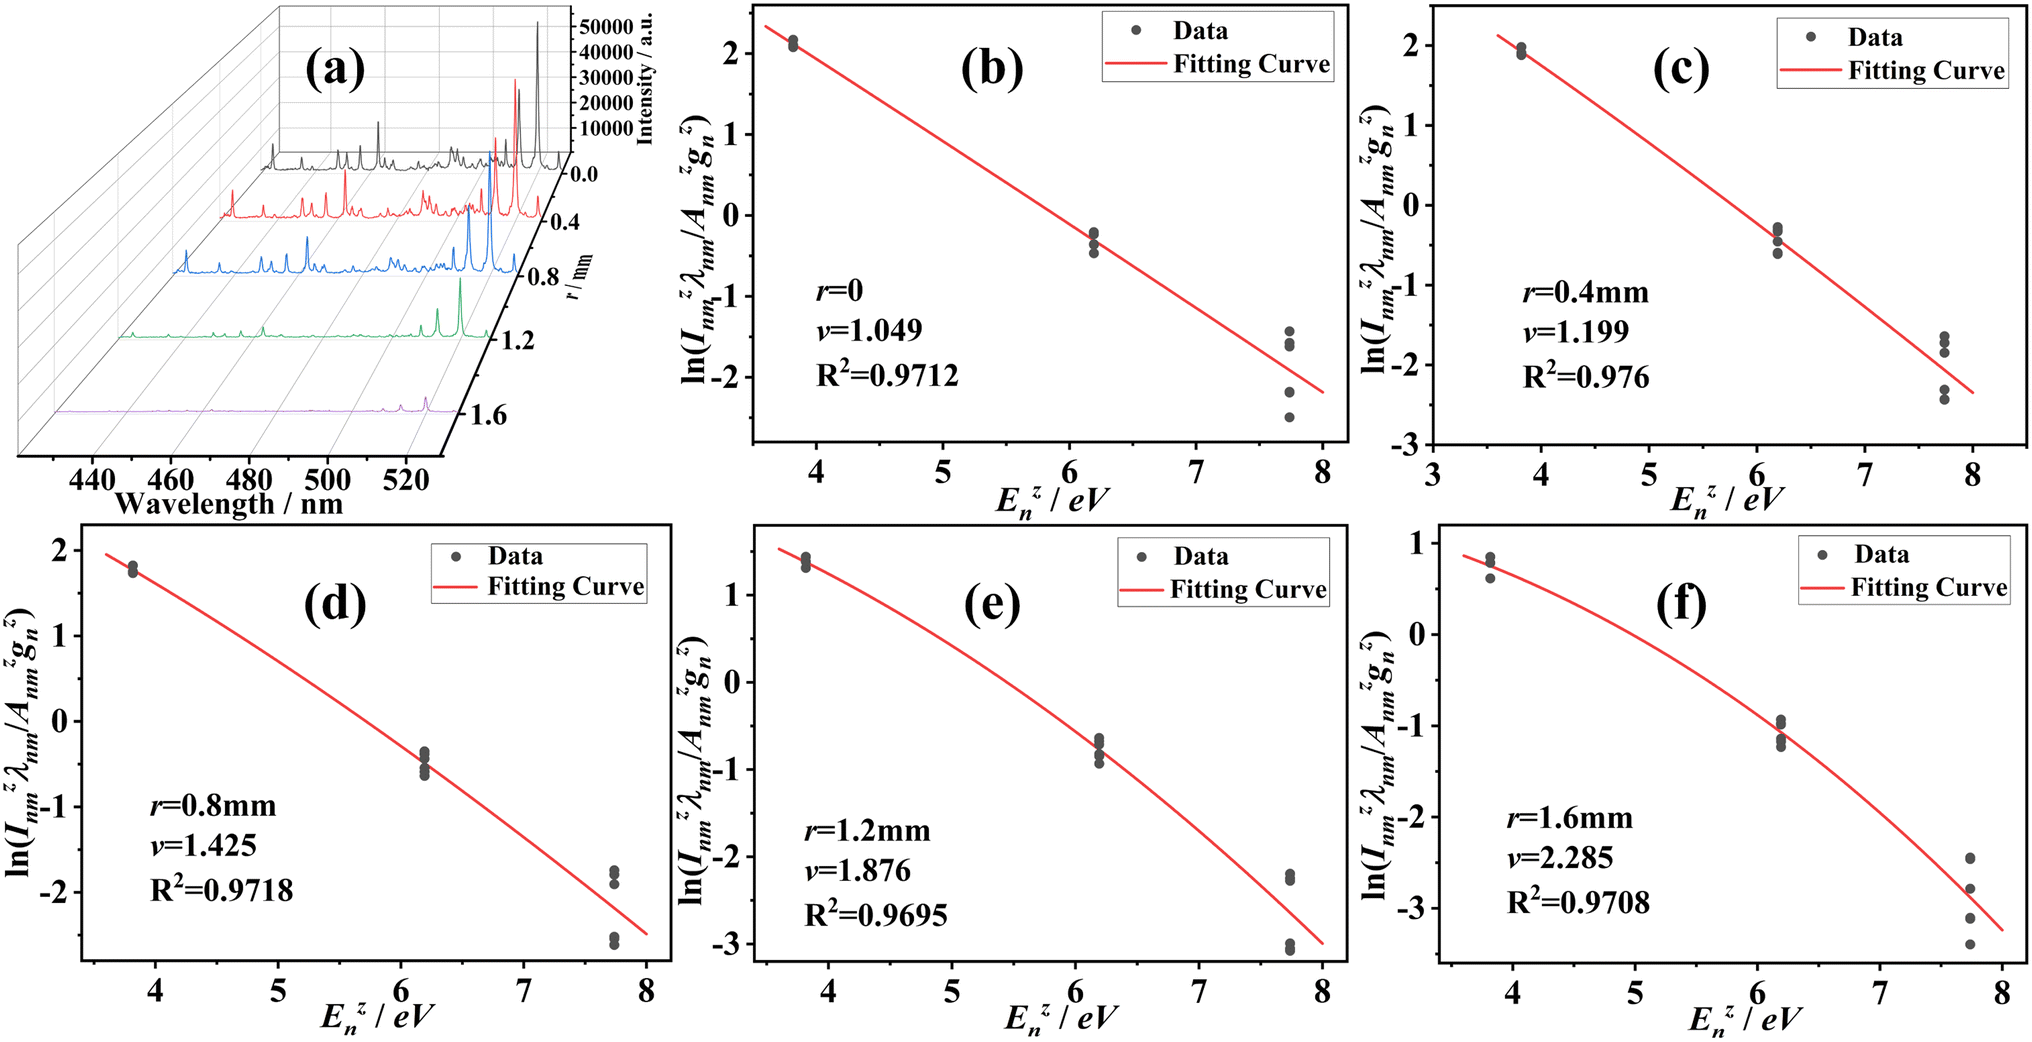 | ||
| Fig. 4 (a) Spectra at r = 0, 0.4, 0.8, 1.2, and 1.6 mm when the ambient pressure is 103 Pa and delay time is Td = 400 ns; (b)–(f) are fitting curves of r = 0, 0.4, 0.8, 1.2, and 1.6 mm, the abscissa is the upper level energy Enz of transition, and the ordinate is ln(Inmzλnm/Anmzgnz). | ||
According to the corrected spectra, the left term ln(Inmzλnm/Anmzgnz) and the right term Enz of eqn (3) are fitted. Fig. 4(b)–(f) show the fitting curves at a pressure of 103 Pa, delay time Td = 400 ns, radius r = 0, 0.4, 0.8, 1.2, and 1.6 mm, respectively. In Fig. 4(b)–(f), the abscissa is the upper level's energy Enz of transition, and the ordinate is ln(Inmzλnm/Anmzgnz). One sees that the correlation coefficient R2 of all fitting curves between ln(Inmzλnm/Anmzgnz) and Enz is greater than 0.96, which shows high correlation. What's more, the coefficient v obtained by the fitting curve increases from 1.049 at r = 0 mm to 2.285 at r = 1.6 mm with the radius r, which means that the LIP departs from LTE with the increase of the radius r.
Fig. 5(a) shows the spatial evolution of coefficient v of LIP in the high-pressure environment (i.e., ambient pressure is 103 Pa, 104 Pa, and 105 Pa), with delay time Td = 1000 ns, the curve is the coefficient v, and the shaded area is the error band. The correlation coefficients R2 of all fitting curves are greater than 0.93. The blue curve is 105 Pa, only the coefficient v at 0.65 mm < r < 1.08 mm is given because of the strong confinement effect of ambient gases, the continuous background radiation of LIP at radius r < 0.65 mm is strong, and the LIP at radius r > 1.08 mm belongs to the external edge of the LIP, and the radiation intensity is weak. It is clear that the coefficient v at 105 Pa is the smallest in the same conditions. It means that the LIP deviates more from LTE in a lower pressure environment. What's more, it can be seen from Fig. 5(a) that with the increase of radius r, coefficient v increases rapidly, which means that LIP deviates further from LTE when farther away from the plasma core. The black and red curves are the spatial evolution of coefficient v at 103 Pa and 104 Pa, and the coefficient v at 0 < r < 1.75 mm is given. It is same as that at 105 Pa, the coefficient v also increases with radius r at 103 Pa and 104 Pa, but the velocity of changing with the radius r is inconsistent.
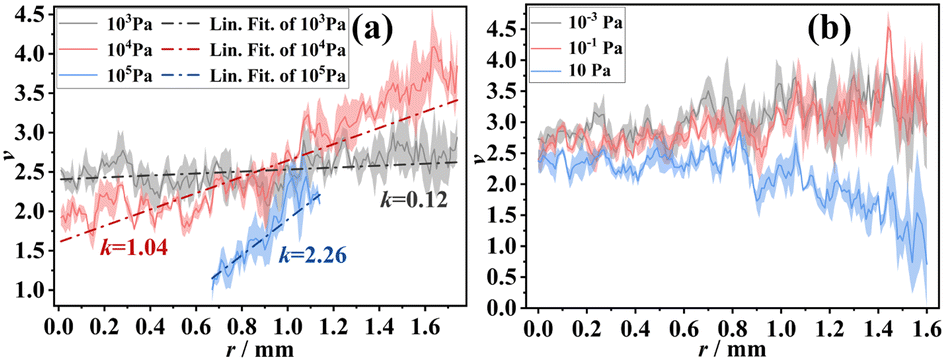 | ||
| Fig. 5 The spatially resolved distribution of coefficient v; (a) at 103 Pa, 104 Pa, and 105 Pa, delay time Td = 1000 ns; (b) at 10−3 Pa, 10−1 Pa, and 10 Pa, delay time Td = 50 ns. | ||
A simple linear fitting is made between coefficient v and radius r, and the slope of the linear fitting line is used to represent the variation speed of coefficient v. In Fig. 5(a), the blue dash-dot-line is the linear fitting line of coefficient v at 105 Pa, with slope k = 2.26; the black and red dash-dot-lines are the linear fitting lines at 103 Pa and 104 Pa, with slope k = 0.12 and 1.04, respectively. Obviously, the slope k of 105 Pa is much greater than that of 103 Pa and 104 Pa, indicating that the LIP departs from LTE faster with the increase of the radius r at 105 Pa. It means that the spatial distribution of physical properties inside the LIP is significantly affected by ambient pressure, and the LIP departs from the LTE faster with the increase of radius r in a higher ambient pressure environment.
Fig. 5(b) shows the spatial evolution of coefficient v of LIP in the low-pressure environment (i.e., ambient pressure is 10−3 Pa, 10−1 Pa, and 10 Pa), with delay time Td = 50 ns, the curve is the coefficient v, and the shaded area is the error band. Due to the weak restriction of ambient gas on LIP and the rapid expansion of plasma in the high vacuum environment of 10−3 to 10 Pa, the radiation intensity of LIP is much lower than that in the atmospheric environment. Therefore, only the LIP in 0 < r < 1.6 mm is studied in the present study. As seen from the figure, the distribution of coefficient v at 10−3 Pa and 10−1 Pa is above that at 10 Pa, which means that the coefficient v is bigger and the LIP deviates more from LTE at 10−3 Pa and 10−1 Pa than 10 Pa. As a whole, the coefficient v at 10−3 Pa is slightly larger than that at 10−1 Pa. The reason is that, at 10−3 Pa and 10−1 Pa, the density of ambient gas is very low, and the restrictions of ambient gas on LIP are weak, resulting in little difference in the restrictions of ambient gas on LIP at different pressures. Therefore, in the low-pressure environment of 10−3 to 10 Pa, the LIP deviates more from LTE in a lower pressure environment; it's the same as the results of Fig. 5(a) in a high-pressure environment.
In addition, the coefficient v increases with radius r when the LIP is at 10−3 Pa and 10−1 Pa; it is the same as the results of Fig. 5(a). It is worth noting that the coefficient v at 1 Pa decreases with the increase of radius r when r > 0.8 mm, which means that the ion energy level population of LIP gets closer to the Boltzmann distribution as radius r increases. The same phenomenon was also found in the works of Zelin Liu;6 the reason of this phenomenon is that if the collisional frequency is adequate, the ion energy level population of LIP can be in the Boltzmann distribution again. Due to the stronger confinement of ambient gas on LIP and the smaller expansion volume of LIP in the environment of 10 Pa than that in the environment of 10−3 Pa and 10−1 Pa, the edge of the LIP can be detected, resulting in the phenomenon that the ion energy level population of LIP gets closer to the Boltzmann distribution with the increase of radius r at 10 Pa, Td = 50 ns.
4.2 Temporally resolved evolution of LTE
Fig. 6(a) shows the spectra of the LIP core (where radius r = 0) when the ambient pressure is 103 Pa, and the delay time is Td = 0–3500 ns. With the increase of delay time Td, the spectral intensity of the LIP core decreases rapidly, which is consistent with the results of other studies.10 | ||
| Fig. 6 (a) Spectra of r = 0, ambient pressure is 103 Pa, delay time Td = 100, 200, 300, 400, 500, 1000, 1500, 2000, 2500, 3000, and 3500 ns; (b) the temporal evolution of coefficient v of the LIP core (r = 0), ambient pressures at 103 Pa, 104 Pa, and 105 Pa; (c) the temporal evolution of coefficient v of the LIP core (r = 0), ambient pressures at 10−3 Pa, 10−1 Pa, and 10 Pa. | ||
Fig. 6(b) shows the variation of coefficient v of the LIP core with delay time Td in the high-pressure environment. The black, red, and blue broken lines are the variations of coefficient v at 103 Pa, 104 Pa, and 105 Pa, and the shaded area is the error band. It can be seen that at the same delay time Td, the coefficient v is the largest at 103 Pa, and smallest at 105 Pa. It means that the LIP deviates more from LTE in a lower pressure environment. The dash-dot-lines are the results of fitting the coefficient v with the delay time Td to
| y = αe−x/β + C | (4) |
It can be found from the fitting results in Fig. 6(b) that the coefficient β at 103 Pa is the smallest, only 356, while at 104 Pa, the coefficient β is 886, and at 105 Pa, the coefficient β is 1470, which is much bigger than the values at 103 Pa and 104 Pa. It indicates that the coefficient v of the LIP core (r = 0) varies fastest with the delay time Td at 103 Pa, and the coefficient v varies slowest with the delay time Td at 105 Pa. It means that in a higher pressure environment, the LIP core (r = 0) deviates more slowly from LTE with the delay time Td increasing, and the LTE of the LIP core can exist longer. It is not difficult to understand that at higher pressure, the confinement effect is more pronounced, and the LIP is compressed into a smaller volume.15,16 The expansion speed is very slow, and it is difficult to expand into a larger volume, resulting in higher plasma electron density and temperature,10 and longer radiation life,11 and the electron density varies more slowly with delay time Td.10 Therefore, the LIP core deviates from LTE more slowly with the increase of delay time Td at higher pressure.
Fig. 6(c) shows the variation of coefficient v of the LIP core with delay time Td in the low-pressure environment. It can be seen that the coefficient v is the largest at 10−3 Pa, and smallest at 10 Pa. The coefficient v increases with the delay time Td. In addition, the error of coefficient v increases with the delay time Td; this is because the radiation intensity of LIP decreases rapidly with the delay time Td, which amplifies the instability of LIP. What's more, the coefficient v increases linearly with the delay time Td at 10−3 Pa and 10−1 Pa, but the coefficient v at 10 Pa increases nonlinearly with delay time Td, increasing rapidly before delay time Td = 100 ns and slowly after 100 ns. The reason is that in the environment of 10−3 Pa and 10−1 Pa, the confinement of ambient air on the LIP is very weak, resulting in almost free expansion of the LIP; therefore, the coefficient v increases linearly with the delay time; as for LIP at 10 Pa, due to the confinement of air, the coefficient v increases nonlinearly with delay time.
The top row of Fig. 7 shows the spatially–temporally resolved evolution of coefficient v in the high-pressure environment (i.e., 103 Pa, 104 Pa, and 105 Pa), and the bottom row shows that in the low-pressure environment (i.e., 10−3 Pa, 10−1 Pa, and 10 Pa). In the high-pressure environment, the measured radius r is from 0 to 1.75 mm, interval 0.01 mm. At 105 Pa, when the delay time Td is 1500 ns, the measured radius r is from 0 to 1.4 mm, interval 0.01 mm. At the pressure of 10 Pa, the background radiation of LIP is strong when the delay time is Td = 0 ns, so there are no data of coefficient v for spatial evolution. What one can see directly from the picture is that coefficient v increases with the increase of delay time Td, the same results as Fig. 5.
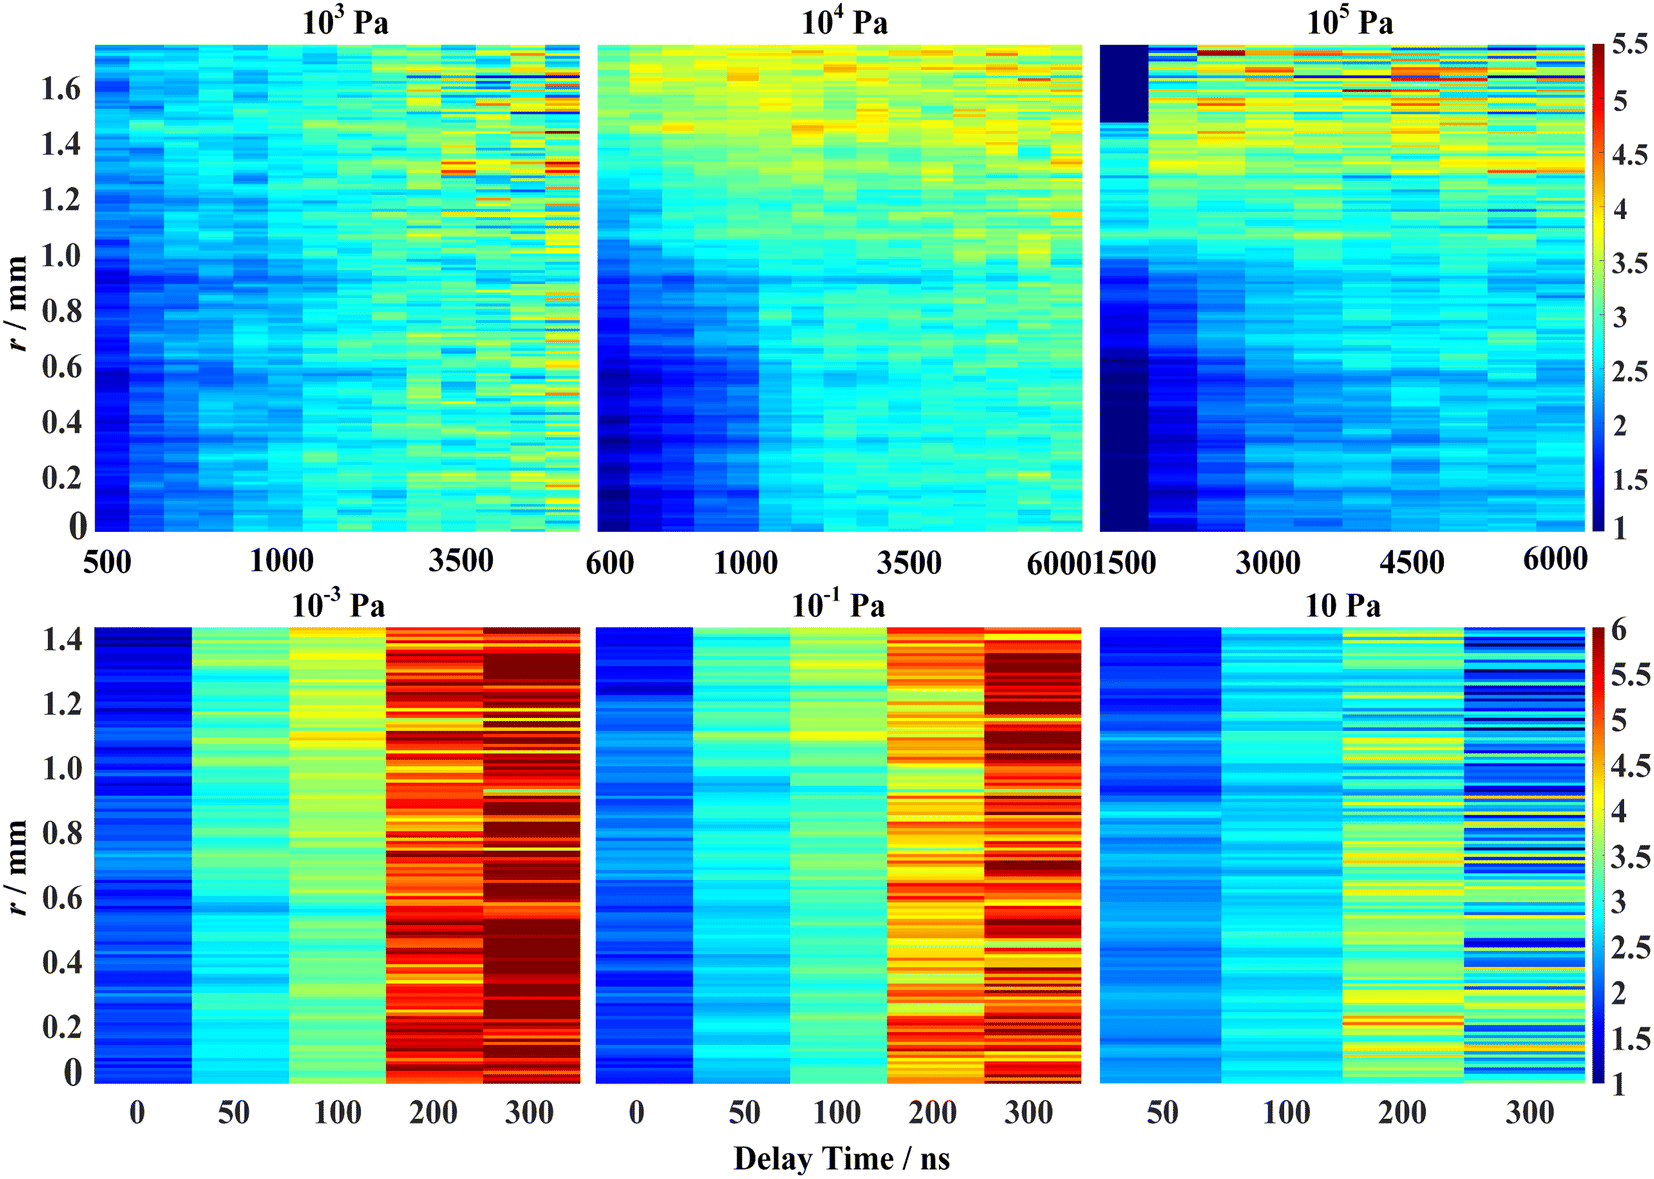 | ||
| Fig. 7 Spatial and temporal evolution of coefficient v in the high-pressure environment (i.e., 103 Pa, 104 Pa, and 105 Pa), and low-pressure environment (i.e., 10−3 Pa, 10−1 Pa, and 10 Pa); the horizontal axis is the delay time Td, and the vertical axis is the radius r. At 103 Pa, the delay time Td = 500, 600, 700, 800, 900, 1000, 1500, 2000, 2500, 3000, 3500, 4000, 4500, and 5000 ns; at 104 Pa, the delay time Td = 600, 700, 800, 900, 1000, 1500, 2000, 2500, 3000, 3500, 4000, 4500, 5000, 5500, and 6000 ns; at 105 Pa, the delay time Td = 1500, 2000, 2500, 3000, 3500, 4000, 4500, 5000, 5500, and 6000 ns. At 10−3 Pa and 10−1 Pa, the delay time Td = 0, 50, 100, 200, and 300 ns. Because the background radiation is strong when the delay time Td = 0 ns at 10 Pa, only the data were given when the delay time Td = 50, 100, 200, and 300 ns at 10 Pa. | ||
It is interesting that at 10−3 Pa and 10−1 Pa, the color blocks at 0 mm and 1.4 mm are bluer than those at 0.7 mm when the delay time is Td = 0 ns; it means that the coefficient v increases first and then decreases, indicating that the ion energy level population of LIP deviates from the Boltzmann distribution and then gets closer to it with the increase of radius r; when Td is 50 and 100 ns, the coefficient v increases with radius r, the same as the results of LIP in a high pressure environment. It is not hard to understand that, when the delay time is Td = 0 ns, the LIP is in the early stage of expansion, and the edges of LIP can be detected; when the delay time is Td = 50 and 100 ns the expansion volume is large enough, and the edges of LIP cannot be detected. It's worth noting that the collisional frequency of LIP at the border is adequate when delay time is Td = 0 ns, and the ion energy level population of LIP gets closer to the Boltzmann distribution again;6 therefore, the trend of coefficient v changing with radius r at 10−3 Pa and 10−1 Pa when the delay time Td = 0 ns is different from that in the high-pressure environment with the delay time Td = 50 and 100 ns. At 10 Pa, the color blocks at 1.4 mm are bluer than that at 0 mm.
Fig. 8(a) shows the radius rv=1 where the LIP begins to depart from LTE at different delay times Td and ambient pressures. The black broken line is the radius rv=1 of 103 Pa. The radius rv=1 is 1.98 mm when Td is 100 ns, which means that the LIP begins to depart from LTE only at 1.98 mm away from the LIP core; when the delay time Td increases to 400 ns, the radius rv=1 decreases rapidly to 0.34 mm; when Td increases to 500 ns, the LIP core has departed from LTE, so there are no data of radius rv=1. The red broken line is the radius rv=1 at 104 Pa. The radius is rv=1 = 1.05 mm and 0.29 mm when Td is 200 ns and 500 ns, respectively. When Td increases to 600 ns, the LIP core has departed from LTE. The blue broken line is the radius rv=1 at 105 Pa. In general, the radius rv=1 decreases with the increase of delay time Td. However, the radius rv=1 has no obvious decrease with delay time Td when delay time is Td = 400–900 ns. The radius rv=1 begins to decrease when Td is 900 ns, and at this time the radius rv=1 is 0.78 mm; when Td is 1500 ns, the rv=1 = 0.52 mm; at 2000 ns, the LIP core has departed from LTE.
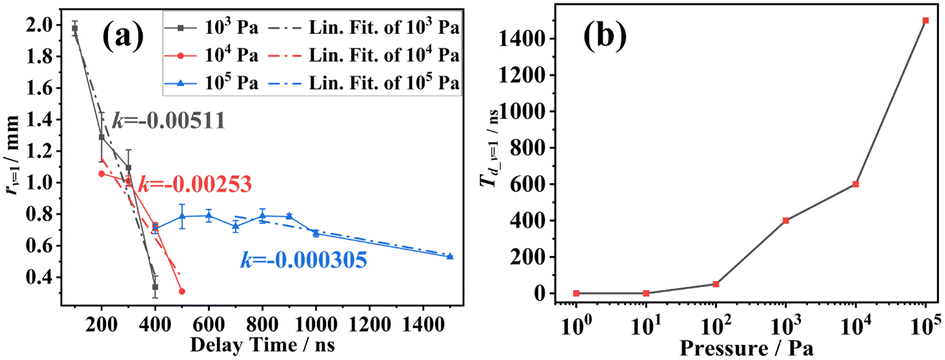 | ||
| Fig. 8 (a) The radius rv=1 of LIP begins to depart from LTE at 103 Pa, 104 Pa, and 105 Pa, which means that the LIP begins to depart from LTE only at rv=1 away from the LIP core; (b) the moment Td_v=1 at which the LIP core (r = 0) begins to depart from LTE at different ambient pressures; Td_v=1 = 0 in (b) does not mean that the LIP is not in LTE during the whole radiation lifetime; instead, it means that the LIP departs from LTE at sometime within 0–50 ns after pulsed laser. | ||
In Fig. 8(a), the black dash-dot-line is the linear fitting of delay time Td with the radius rv=1 at 103 Pa, and its slope k = −0.00511. The red dash-dot-line is that at 104 Pa with slope k = −0.00253, and the blue dash-dot-line is that at 105 Pa, with the slope k = −0.000305. In order to more accurately reflect the decreasing speed of radius rv=1 with delay time Td, only the last five points are selected to fit, that is, point of delay time Td = 700, 800, 900, 1000, and 1500 ns at 105 Pa. It can be seen that the slope k = −0.00511 is the smallest at 103 Pa, and it indicates that the radius rv=1 decreases fastest with the increase of delay time Td. The slope k = −0.000305 is the largest at 105 Pa, and it means that the radius rv=1 decreases slowest. The reason is that the ambient gasses have a strong confinement on the LIP at 105 Pa, and the LIP is confined to a very small volume.15,16 The results of Fig. 4 and 5 show that the coefficient v changes faster with the radius r, and slower with the delay time Td in a higher pressure environment. As a result, when the pressure is at 105 Pa, the radius rv=1 of LIP varies slowly with delay time Td, and even does not vary significantly during the delay time Td = 400–900 ns. Therefore, the radius rv=1 of LIP decreases rapidly with the increase of delay time Td.
Fig. 8(b) shows the moment Td_v=1 at which the LIP core (r = 0) begins to depart from LTE at different ambient pressures. At 105 Pa, the LIP core begins to depart from LTE when the moment Td_v=1 = 1500 ns, i.e., in the present study the delay time Td_v=1 = 1500 ns at 105 Pa. The moment Td_v=1 at which the LIP core begins to depart from LTE rapidly decreases to 600 ns when the ambient pressure drops to 104 Pa, and when the pressure is below 10 Pa, the moment is Td_v=1 ≈ 0 ns. As the gate width of the ICCD is 50 ns in this experiment, the spectra actually collected by the ICCD are within 0–50 ns after the energy peak time of pulsed laser when the moment Td_v=1 = 0. Therefore, Td_v=1 = 0 in Fig. 8(b) does not mean that the LIP is not in LTE during the whole radiation lifetime. Instead, it means that the LIP core begins to depart from LTE at sometime within 0–50 ns after pulsed laser. In summary, the moment Td_v=1 at which the LIP begins to depart from LTE decreases with ambient pressure; it means that the time point at which the LIP deviates from LTE gets closer to pulsed-laser peak time and the life of LIP in LTE is getting shorter.
As mentioned above, coefficient v = 1 only means that the ion energy level population of LIP is in Boltzmann distribution, and the coefficient v > 1 means that the LIP has deviated from the LTE. In the present study, the electron number density of the data point of Fig. 8(b) was obtained by analysing the Stark broadening of the Cu I 510.55 nm emission line. The results are as follows: 3.2061 × 1016 cm−3 ± 4.3556 × 1015 cm−3 at 105 Pa and Td_v=1 = 1500 ns; 3.2395 × 1016 cm−3 ± 3.7021 × 1015 cm−3 at 104 Pa and Td_v=1 = 600 ns; 6.7184 × 1016 cm−3 ± 1.5716 × 1016 cm−3 at 103 Pa and Td_v=1 = 400 ns; 3.6397 × 1016 cm−3 ± 4.1568 × 1015 cm−3 at 102 Pa and Td_v=1 = 50 ns. The minimum electron number density of the LIP core when the LIP is in LTE can be calculated according to McWhirter's criterion;24 in this study, the minimum electron number density is 1.15 × 1016 cm−3 at 105 Pa and Td_v=1 = 1500 ns, 1.148 × 1016 cm−3 at 104 Pa and Td_v=1 = 600 ns, 2.0534 × 1016 cm−3 at 103 Pa and Td_v=1 = 400 ns, and 1.0538 × 1016 cm−3 at 102 Pa and Td_v=1 = 50 ns. And it can be seen from the above results that the electron number density of the LIP in the present study is bigger than the minimum electron number density calculated by McWhirter's criterion; it means that the LIP core at Td_v=1 satisfies McWhirter's criterion.
5 Conclusions
In the present study, the spatial–temporal spectra of LIP were measured from the direction of laser incidence, and the influence of ambient pressure on the spatially–temporally resolved evolution of LTE for the LIP was studied by coefficient v in the high-pressure environment (i.e., 103 Pa, 104 Pa, and 105 Pa) and the low-pressure environment (i.e., 10−3 Pa, 10−1 Pa, and 10 Pa). In the high-pressure environment, the experimental results showed that the coefficient v decreases with the ambient pressure, and increases with radius r (the distance from the LIP core in the study) and delay time Td, which means that the plasma deviates from LTE with radius r and delay time Td. But the coefficient v increases faster with radius r and slower with delay time Td at higher pressure. The reason is that in a higher pressure environment, the air has a strong confinement on the LIP, resulting in the LIP with minor volume, leading to the gradient of plasma electron density in LIP along the radius r being greater. Therefore, compared with the LIP in the lower pressure environment, the LIP deviates from LTE faster with the increase of radius r and slower with the increase of delay time Td in a higher pressure environment, which indicates that the LIP stays in LTE longer in a higher pressure environment. In a low-pressure environment, the variation of the coefficient v increases with the delay time Td, the same as that in a high-pressure environment; what is different is that when the delay time is Td = 0 ns, the coefficient v in the region of r > 1 mm decreases with radius r; it means that the ion energy level population of LIP is much closer to the Boltzmann distribution; at 10 Pa, when the delay time is Td = 50 ns, this phenomenon also appears. The reason is that the collisional frequency is adequate, and the ion energy level population is in Boltzmann distribution again. In addition, the moment Td_v=1 at which the LIP core (r = 0) begins to depart from LTE decreases rapidly with the decrease of ambient pressure; at 105 Pa, the LIP in the middle stage departs from LTE; at 102 Pa, the LIP departs from LTE in the initial-stage. It means that the time point of LIP begins to deviate from the LTE gradually forward to pulsed-laser peak time and the life of LIP in LTE is getting shorter. What's more, it is proved that the LIP core at Td_v=1 satisfies McWhirter's criterion in the present study. This work is helpful for understanding the influence of ambient pressure on the LIP evolution, optimizing the parameters of LIBS, and providing references for LIBS application.Conflicts of interest
There are no conflicts to declare.Acknowledgements
This work was supported by the National Natural Science Foundation of China (51777145) and Shaanxi province “Sanqin scholars” innovation team project (demonstration innovation team of Xi'an Jiaotong University for the key technology of advanced DC power equipment and its industrialization).References
- M. M. Keszycka, X. C. Moncunill, M. P. Casado-Gavalda, Y. Dixit, R. C. Moncunill, P. J. Cullen and C. Sullivan, Trends Food Sci. Technol., 2017, 65, 80–93 CrossRef.
- G. S. Senesi, R. S. Harmon and R. R. Hark, Spectrochim. Acta, Part B, 2021, 175, 106013 CrossRef CAS.
- A. Limbeck, L. Brunnbauer, H. Lohninger, P. Pořízka, P. Modlitbová, J. Kaiser, P. Janovszky, A. Kéri and G. Galbács, Anal. Chim. Acta, 2021, 1147, 72–98 CrossRef CAS PubMed.
- G. S. Maurya, A. M. Roldán, P. Veis, A. K. Pathak and P. Sen, J. Nucl. Mater., 2020, 541, 152417 CrossRef CAS.
- J. Moros and J. Laserna, Appl. Spectrosc., 2019, 73, 963–1011 CrossRef CAS.
- Z. L. Liu, G. M. Zhao, C. Guo, L. Chen, M. S. Chen, H. Liu and K. Han, J. Anal. At. Spectrom., 2021, 36, 2362 RSC.
- J. Hermann, D. Grojo, E. Axente and V. Craciun, Spectrochim. Acta, Part B, 2018, 144, 82–86 CrossRef CAS.
- O. Barthelemy, J. Margot, S. Laville, F. Vidal, M. Chaker, B. L. Drogoff, T. W. Johnston and M. Sabsabi, Spectrochim. Acta, Part B, 2005, 59, 529–536 CAS.
- A. Ciucci, M. Corsi, V. Palleschi, S. Rastelli, A. Salvetti and E. Tognoni, Appl. Spectrosc., 1999, 53, 960–964 CrossRef CAS.
- D. Wu, L. Y. Sun, J. M. Liu, Y. Lyu, H. C. Wu, S. Yuan, R. Hai, C. Li, C. L. Feng, D. Y. Zhao and H. B. Ding, J. Anal. At. Spectrom., 2021, 36, 1159 RSC.
- S. J. Choi and J. J. Yoh, Opt. Express, 2011, 19, 23097 CrossRef CAS PubMed.
- A. De Giacomo, V. A. Shakhatov and O. De Pascale, Spectrochim. Acta, Part B, 2001, 56, 753–776 CrossRef.
- A. Mendys, M. Kański, A. F. Sougueh, S. Pellerin, B. Pokrzywka and K. Dzierżęga, Spectrochim. Acta, Part B, 2014, 96, 61–68 CrossRef CAS.
- M. Skoćić and S. Bukvić, Spectrochim. Acta, Part B, 2016, 125, 103–110 CrossRef.
- N. Farid, S. S. Harilal, H. Ding and A. Hassanein, Appl. Phys. Lett., 2013, 103, 191112 CrossRef.
- H. Yuan, A. B. Gojanib, I. B. Gornushkin and X. H Wang, Spectrochim. Acta, Part B, 2018, 150, 33–37 CrossRef CAS.
- H. Yuan, A. B. Gojani, I. B. Gornushkin, X. H. Wang, D. X. Liu and M. Z. Rong, Opt. Lasers Eng., 2020, 124, 105832 CrossRef.
- X. H. Wang, H. Yuan, D. X. Liu, A. J. Yang, P. Liu, L. Gao, H. B. Ding, W. T. Wang and M. Z. Rong, J. Phys. D: Appl. Phys., 2016, 49, 44LT01 CrossRef.
- S. W. Yoon, H. W. Choi and J. H. Kim, Appl. Sci., 2021, 11, 9046 CrossRef CAS.
- E. J. Kautz, J. Yeak, B. E. Bernacki, M. C. Phillips and S. S. Harilal, J. Anal. At. Spectrom., 2020, 35, 1574 RSC.
- S. S. Harilal, B. O'Shay and M. S. Tillack, J. Appl. Phys., 2005, 98, 013306 CrossRef.
- National Institute of Standards and Technology, Atomic Spectra Database, http://physics.nist.gov/, 2022, accessed 23 March 2022 Search PubMed.
- S. N. Xu, W. Z. Duan, R. B. Ning, Q. Li, Z. Ai and R. Jiang, Spectrosc. Spectral Anal., 2016, 36, 1175–1179 CAS.
- L. J. Martino and C. A. D'Angelo, J. Anal. At. Spectrom., 2020, 35, 1003 RSC.
| This journal is © The Royal Society of Chemistry 2023 |