 Open Access Article
Utilising bio-based plasticiser castor oil and recycled PLA for the production of conductive additive manufacturing feedstock and detection of bisphenol A†
Robert D.
Crapnell
 a,
Iana V. S.
Arantes
ab,
Matthew J.
Whittingham
 a,
Evelyn
Sigley
a,
Cristiane
Kalinke
a,
Evelyn
Sigley
a,
Cristiane
Kalinke
 ac,
Bruno C.
Janegitz
d,
Juliano A.
Bonacin
c,
Thiago R. L. C.
Paixão
 b and
Craig E.
Banks
 *a
*a
aFaculty of Science and Engineering, Manchester Metropolitan University, Chester Street, M1 5GD, UK. E-mail: c.banks@mmu.ac.uk; Tel: +44(0)1612471196
bDepartmento de Química Fundamental, Instituto de Química, Universidade de São Paulo, São Paulo, SP 05508-000, Brazil
cInstitute of Chemistry, University of Campinas (Unicamp), 13083-859, São Paulo, Brazil
dLaboratory of Sensors, Nanomedicine and Nanostructured Materials, Federal University of São Carlos, Araras, 13600-970, Brazil
First published on 22nd June 2023
Abstract
The production of electrically conductive additive manufacturing feedstocks from recycled poly(lactic acid) (rPLA), carbon black (CB), and bio-based plasticiser castor oil is reported herein. The filament was used to print additively manufactured electrodes (AMEs), which were electrochemically benchmarked against geometrically identical AMEs printed from a commercially available conductive filament. The castor oil/rPLA AMEs produced an enhanced heterogeneous electrochemical rate constant of (1.71 ± 0.22) × 10−3 cm s−1 compared to (0.30 ± 0.03) × 10−3 cm s−1 for the commercial AME, highlighting the improved performance of this filament for the production of working electrodes. A bespoke electroanalytical cell was designed and utilised to detect bisphenol A (BPA). The AMEs made from the castor oil/rPLA gave an enhanced electroanalytical performance compared to the commercial filament, producing a sensitivity of 0.59 μA μM−1, a LOD of 0.10 μM and LOQ of 0.34 μM. This system was then successfully applied to detect BPA in spiked bottled and tap water samples, producing recoveries between 89–104%. This work shows how the production of conductive filaments may be done more sustainably while improving performance.
1. Introduction
Sustainable development is an increasingly important topic on the global agenda, with the United Nations (UN) having outlined 17 goals to achieve this.1 The 12th goal of this initiative is to “Ensure sustainable consumption and production patterns”, which includes many targets for reducing waste generation through prevention, reduction, recycling, and reuse; along with the sound management of chemicals.2 Globally, the human race produces 400 million tonnes of plastic waste yearly and has recycled less than 10% of the 7 billion tonnes of plastic in history.1 This level of global plastic waste production has called for significant policy and strategy changes from world governing bodies, such as: “Plastics in a circular economy” by the European Union,3 “The UK Plastics Pact”,4 and the UN's “Treaty on plastic pollution”.1 This last work through the UN considers the entire lifecycle of plastics, including production, product design, and waste management, to create a thriving “circular economy”. Although still without an exact definition, the idea of a circular economy generally refers to an economic system in which raw materials are extracted, used, reused/recycled repeatedly with zero waste over the life cycle.5 This perfect circular economy remains hypothetical for the time being, but research around the concept is gaining traction, with more work transitioning from a reliance on virgin materials, particularly non-renewable sources.6,7Recently, the idea of circular economy in electrochemistry was introduced,8 focussing on using additive manufacturing within electrochemistry to produce electroanalytical sensing platforms. The use of additive manufacturing within electrochemistry has seen a sharp increase in the last decade due to its many benefits, such as low cost of equipment and consumables, rapid prototyping capabilities, the ability to explore complex electrode geometries without high manufacturing costs,9,10 and low waste production, amongst other benefits. Due to the additive, layer-by-layer manufacturing methodology, there is a low (often zero) amount of waste produced per product compared to more established subtractive manufacturing technologies. However, most electrodes produced through additive manufacturing remain a single-use item due to the ingress of solution11 and the lack of simple electrode cleaning processes. To introduce improved sustainability practices into the field, Sigley et al.8 produced bespoke filament from recycled poly(lactic acid) (rPLA), previously utilised as coffee machine pods. Using the rPLA they created a recycled filament for the electroanalytical cell production. Then, along with carbon black (CB) as a conductive filler, they created an electrically conductive filament for the electrodes. The authors then utilised this cell to detect caffeine within real coffee and tea samples.
A plasticizer is commonly used to produce electrically conductive additive manufacturing filaments alongside the base polymer and high loadings of conductive fillers.12 The role of the plasticiser is to increase the low-temperature flexibility of the feedstock, ensuring the rapid movement of the print head or force exerted by the extruder doesn't snap the filament, causing print failure. In the above work, poly(ethylene succinate) (PES) was used as a polymeric plasticiser, which is synthesized through a polycondensation reaction of succinic acid and ethylene glycol or ethylene oxide, utilising an organometallic catalyst.13,14 To this effect, we look to replace this plasticiser to remove any requirements for catalysts by using castor oil as a plasticiser to produce electrically conductive AM filament from rPLA. Castor oil is an inedible oil that can be extracted through mechanical pressing or solvent extraction from the plant Ricinus communis, belonging to the Euphorbiaceous family.15 This plant is cultivated on industrial scales in multiple countries globally due to its many industrial uses, including India, China, Brazil, Thailand, Ethiopia, and the Philippines.16 Additionally, castor oil waste has been utilised previously to produce biochar as a modifier for developing electrochemical sensors.17–19 Due to its abundance, the cost of castor oil is significantly less than PES, and transitioning to a bio-based plasticiser can further improve the sustainability of filament production.
To highlight how additive manufacturing and electrochemistry can be more sustainable, produce higher performance products, and help address environmental issues; the filament using castor oil was benchmarked against a commercially available filament to detect bisphenol A (BPA). This molecule is not naturally occurring, but has become ubiquitous in the environment due to its global demand in the production of plastics and its subsequent effluent discharge.20 BPA is an endocrine disruptor that mimics the role of estrogen once it enters living systems, and can cause damage to reproductive organs, the thyroid gland, and brain tissues at developmental stages in humans.21 Due to its presence in surface waters across the globe, a portable, fast, and simple detection methodology is required. Combining AM and electrochemistry offers all these advantages, allowing for the production and use of sensing platforms in situ.
This work shows the first production and characterisation of electrically conductive additive manufacturing filament from recycled sources, utilising castor oil as a bio-based plasticiser. We electrochemically benchmark this against a commercially available conductive filament using common outer and inner sphere redox probes before highlighting its use for detecting environmental contaminant BPA.
2. Experimental section
2.1 Chemicals
All chemicals used were of analytical grade and used as received without any further purification. All solutions were prepared with deionised water of resistivity not less than 18.2 MΩ cm from a Milli-Q Integral 3 system from Millipore UK (Watford, UK). Hexaamineruthenium(III) chloride (98%), castor oil, potassium ferricyanide (99%), potassium ferrocyanide (98.5–102.0%), sodium hydroxide (>98%), and potassium chloride (99.0–100.5%) were purchased from Merck (Gillingham, UK). Potassium phosphate monobasic (≥99%), potassium phosphate dibasic (≥99%), and bisphenol A (≥99%) were acquired from Sigma-Aldrich (Gillingham, UK). Carbon black (Super P®, >99+%) was purchased from Fisher Scientific (Loughborough, UK). Recycled poly(lactic acid) (rPLA) was purchased from Gianeco (Turin, Italy). Commercial conductive PLA/carbon black filament (1.75 mm, ProtoPasta, Vancouver, Canada) was purchased from Farnell (Leeds, UK). Recycled non-conductive PLA filament was produced in-house, as shown previously.8 Water samples were collected from the tap in John Dalton Tower Laboratory and a local convenience store.2.2 Recycled filament production
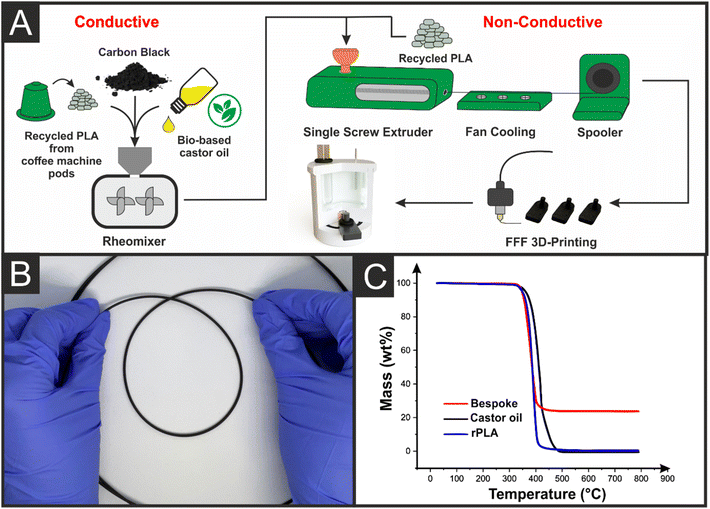
Before mixing or filament production, all rPLA was dried in an oven at 60 °C for a minimum of 2.5 h, removing any residual water in the polymer. The polymer composition was prepared using 65 wt% rPLA, 10 wt% castor oil, and 25 wt% CB in a chamber of 63 cm3 and were mixed at 190 °C with Banbury rotors at 70 rpm for 5 min using a Thermo Haake Poydrive dynameter fitted with a Thermo Haake Rheomix 600 (Thermo-Haake, Germany). The resulting polymer composite was allowed to cool to room temperature before being granulated to create a finer granule size using a Rapid Granulator 1528 (Rapid, Sweden). The granulated sample was collected and processed through the hopper of the EX6 extrusion line (Filabot, VA, United States). The EX6 was set up with a single screw with four set heat zones of 60, 190, 195, and 195 °C respectively. The molten polymer was extruded from a 1.75 mm die head, pulled along an Airpath cooling line (Filabot, VA, United States, through an inline measure (Mitutoyo, Japan), and collected on a Filabot spooler (Filabot, VA, United States). The filament was then ready to use for Additive Manufacturing (AM).2.3 Additive manufacturing
All computer designs, and .3MF files seen throughout this manuscript were produced using Fusion 360® (Autodesk®, CA, United States). These files were sliced and converted to .GCODE files ready for printing by the printer-specific software, PrusaSlicer (Prusa Research, Prague, Czech Republic). The AMEs were 3D-printed using fused filament fabrication (FFF) technology on a Prusa i3 MK3S+ (Prusa Research, Prague, Czech Republic). All AMEs were printed using a 0.6 mm nozzle with a nozzle temperature of 225 °C, extrusion ratio of 1.6 (160%), 100% rectilinear infill, 0.2 mm layer height, and print speed of 40 mm s−1. The increase in extrusion ratio was necessary due to the produced filament's diameter of ∼1.6 mm, slightly below the de-facto 1.75 mm standard, the value PrusaSlicer uses to calculate extruder steps based on volumetric requirements for extrusion moves. The cells were printed using rPETG, using default 0.2 mm “quality” settings inside PrusaSlicer for a Prusa Mk3s+, with a 0.4 mm nozzle installed. The only change made was to increase the number of perimeters to 4, in order to allow for the heat-set insert to be installed successfully.2.4 Physiochemical characterisation
Thermogravimetric analysis (TGA) was performed using a Discovery Series SDT 650 controlled by Trios Software (TA Instruments, DA, USA). Samples were mounted in alumina pans (90 μL) and tested using a ramp profile (10 °C min−1) from 0–800 °C under N2 (100 mL min−1).X-ray Photoelectron Spectroscopy (XPS) data were acquired using an AXIS Supra (Kratos, UK), equipped with a monochromated Al X-ray source (1486.6 eV) operating at 225 W and a hemispherical sector analyser. It was operated in fixed transmission mode with a pass energy of 160 eV for survey scans and 20 eV for region scans with the collimator operating in slot mode for an analysis area of approximately 700 × 300 μm, the FWHM of the Ag 3d5/2 peak using a pass energy of 20 eV was 0.613 eV. Before analysis, each sample was ultrasonicated for 15 min in propan-2-ol and then dried for 2.5 hours at 65 °C as this has been shown in our unpublished data to remove excess contamination and therefore minimise the risk of misleading data. The binding energy scale was calibrated by setting the graphitic sp2 C 1s peak to 284.5 eV; this calibration is acknowledged to be flawed,22 but was nonetheless used in the absence of reasonable alternatives, and because only limited information was to be inferred from absolute peak positions.
Scanning Electron Microscopy (SEM) measurements were recorded on a Supra 40VP Field Emission (Carl Zeiss Ltd, Cambridge, UK) with an average chamber and gun vacuum of 1.3 × 10⁻⁵ and 1 × 10⁻⁹ mbar respectively. Samples were mounted on the aluminium SEM pin stubs (12 mm diameter, Agar Scientific, Essex, UK). To enhance the contrast of these images, a thin layer of Au/Pd (8 V, 30 s) was sputtered onto the electrodes with the SCP7640 from Polaron (Hertfordshire, UK) before being placed in the chamber.
Raman spectroscopy was performed on a Renishaw PLC in Via Raman Microscope controlled by WiRE 2 software at a laser wavelength of 514 nm.
2.5 Electrochemical experiments
All electrochemical measurements were performed on an Autolab 100N potentiostat controlled by NOVA 2.1.6 (Utrecht, the Netherlands). The electrochemical characterisation of the bespoke filament and comparison to the benchmarks were performed using a lollipop design (∅ 5 mm disc with 18 mm connection length and 2 × 1 mm stem thickness) electrodes alongside an external commercial Ag|AgCl (3 M KCl) reference electrode and a nichrome wire counter electrode. All solutions of RuHex were prepared using deionised water of resistivity not less than 18.2 MΩ cm from a Milli-Q system (Merck, Gillingham, UK) and were purged of O2 thoroughly using N2 prior to any electrochemical experiments.Activation of the AMEs was performed before all electrochemical experiments. This was achieved electrochemically in NaOH as described in the literature.23 Briefly, the AMEs were connected as the working electrode (WE) in conjunction with a nichrome wire coil counter (CE) and Ag|AgCl (3 M KCl) reference electrode (RE), and placed in a solution of NaOH (0.5 M). Chronoamperometry was used to activate the AMEs by applying a set voltage of +1.4 V for 200 s, followed by applying – 1.0 V for 200 s. The AMEs were then thoroughly rinsed with deionised water and dried under nitrogen before further use.
2.7 Real sample analysis
All stock solutions and BPA samples were prepared by diluting the BPA in the lowest possible ethanol aliquot and then completing the volume with the supporting electrolyte (0.1 M phosphate buffer solution (PBS) pH 7.4). The electrochemical determination of BPA was performed by differential pulse voltammetry (DPV), carried out from +0.2 to +1.0 V (vs. Ag|AgCl) with a pulse amplitude of 50 mV and a step potential of 10 mV. The bespoke AM cell described above was used for the real sample analysis with the bespoke castor oil/rPLA electrodes. For this purpose, 250 mL of water samples were spiked with ∼1 mg (20 μM) of BPA and diluted (20-fold) in the supporting electrolyte. The standard addition method was then used to construct the calibration curves. All measurements were performed after a preconcentration step by 5 min stirring of the BPA solution, with no potential applied.24 The electrodes had to be polished in sandpaper (3 M Wetordry P400) between each measurement to circumvent the adsorptive effects of BPA.3. Results and discussion
With the number of publications utilising additive manufacturing and electrochemistry increasing annually, the sustainability of the systems must be considered alongside their performance and many advantages. Current systems relying on the use of virgin plastic feedstock and man-made additives to produce single-shot, “disposable” systems can only cause to increase in the levels of plastic waste produced globally. To this end, we look to utilise recycled plastic feedstock – alongside castor oil as a bio-based plasticiser – to produce conductive filament. This filament is electrochemically characterised and applied to the detection of BPA.3.1 Production and characterisation of recycled filament
A scheme highlighting the production of the electrically conductive filament used throughout this work is presented in Fig. 1A. All rPLA used throughout this work was dried in a convection oven prior to use, removing any residual water ingressed into polymer pellets. Photographs of the materials used in filament production and throughout each stage of production are presented in Fig. S1.† The rPLA (65 wt%) was added to the chamber of a rheomixer along with CB (25 wt%) and castor oil (10 wt%) and mixed at 190 °C for 5 min using Banbury rotors. The resultant mix was allowed to cool, pelletised, and passed through an extruder to produce an electrically conductive filament with excellent flexibility, Fig. 1B. The low-temperature flexibility of the rPLA filament with 25 wt% loading of conductive carbon filler indicated that castor oil was successfully acting as a plasticiser. The resistance across a 10 cm length of filament was observed to be (864 ± 54) Ω compared to a quoted value of 2–3 kΩ for the commercially purchased filament.25 This was expected due to increased conductive filler content for the bespoke filament.Thermogravimetric analysis of the bespoke filament and its constituent parts was performed and is shown in Fig. 1C. It is important to analyse the original feedstocks to understand whether historical processing or the subsequent thermal treatments from producing the bespoke filament affect the stability of the polymer. It can additionally provide information on the effect that the plasticiser and conductive filler have on thermal stability and offer accurate information about the mass of conductive filler within the final filament. The onset temperature of thermal degradation and filler content for all constituent parts, alongside the final filament, are presented in Table S1.† It can be seen that the rPLA had an average onset temperature of (305 ± 5) °C compared to the pure castor oil at (250 ± 3) °C. The conductive filament combining these materials with 25 wt% CB provided an onset temperature of (283 ± 3) °C, indicating that the CB provided some stabilising effect by acting as a physical barrier for gas diffusion out of the polymer, serving to slow the rate of decomposition.26 Through the stabilisation of the TGA curve after the degradation of rPLA and castor oil, the conductive filler content of the filament was calculated to be (23 ± 4) wt%.
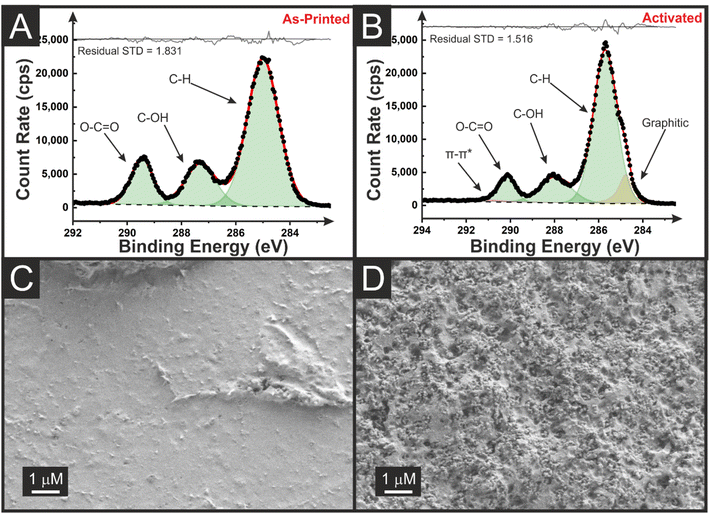
The chemical composition of the additively manufactured electrodes (AMEs) was investigated through XPS and SEM, before and after electrochemical activation of lollipop electrodes. The design of these electrodes is presented in Fig. S2.† Electrochemical activation in NaOH (0.5 M) of AMEs is common in the literature and ensures the electrode surface is available for electrochemical processes requiring access to the conductive filler.27 The non-activated and activated C 1s spectrum for the castor oil AMEs are presented in Fig. 2A and B, respectively. The non-activated C 1s environment shows a spectrum with three peaks, corresponding to the three carbon environments seen within rPLA and castor oil. The structures of these molecules can be seen in Fig. S3.† In rPLA, there are equal amounts of the three carbon environments, leading to an XPS C 1s fitting of three peaks with similar intensities.8 In castor oil, there is significantly more C–C/C–H bonding than C–OH and O–C![[double bond, length as m-dash]](https://www.rsc.org/images/entities/char_e001.gif) O bonding, leading to a peak of much higher intensity, significantly more than that seen in Fig. 2A. The C 1s spectrum fitting suggests that the C–C/C–H peak at 285.0 eV has an atomic concentration of 67%, compared to 18% and 15% for the C–OH and O–C
O bonding, leading to a peak of much higher intensity, significantly more than that seen in Fig. 2A. The C 1s spectrum fitting suggests that the C–C/C–H peak at 285.0 eV has an atomic concentration of 67%, compared to 18% and 15% for the C–OH and O–C![[double bond, length as m-dash]](https://www.rsc.org/images/entities/char_e001.gif) O peaks. This would suggest that the surface of the non-activated AME consists of a mixture of castor oil and rPLA. The absence of any graphitic peak at 284.5 eV suggests that the CB particles are embedded within the electrode below the depths probed by XPS (i.e. a few nm).11 In contrast, once activated the XPS C 1s spectrum exhibited a peak at 284.5 eV, consistent with the X-ray photoelectron emission by graphitic carbon.28,29 This provides evidence of the stripping of non-conductive material from the surface of the electrode, making the CB available to the range of the XPS and exposing the edge plane sites/defects at the triple-phase boundary giving improved electrochemical responses This is supported by the SEM images seen in Fig. 2C and D, where before activation, there is a smooth surface seen across the AME, compared to significant amounts of CB visible after activation. After the bespoke castor oil filament had been physiochemically characterised and shown to be successfully activated, electrochemical characterisation was required.
O peaks. This would suggest that the surface of the non-activated AME consists of a mixture of castor oil and rPLA. The absence of any graphitic peak at 284.5 eV suggests that the CB particles are embedded within the electrode below the depths probed by XPS (i.e. a few nm).11 In contrast, once activated the XPS C 1s spectrum exhibited a peak at 284.5 eV, consistent with the X-ray photoelectron emission by graphitic carbon.28,29 This provides evidence of the stripping of non-conductive material from the surface of the electrode, making the CB available to the range of the XPS and exposing the edge plane sites/defects at the triple-phase boundary giving improved electrochemical responses This is supported by the SEM images seen in Fig. 2C and D, where before activation, there is a smooth surface seen across the AME, compared to significant amounts of CB visible after activation. After the bespoke castor oil filament had been physiochemically characterised and shown to be successfully activated, electrochemical characterisation was required.
3.2 Electrochemical characterisation of AMEs
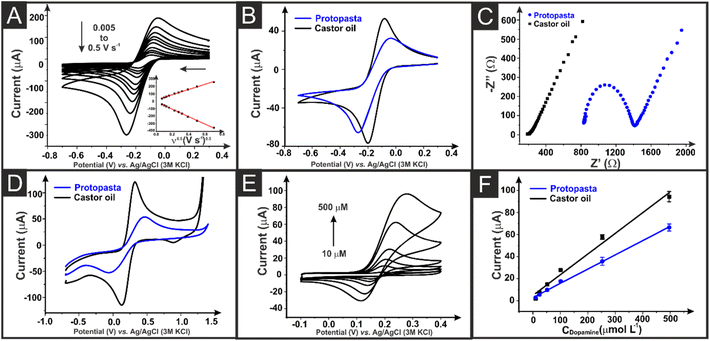
Electrochemical characterisation of the AMEs printed from the bespoke castor oil/rPLA filament is performed against common outer- and inner-sphere probes hexaamineruthenium(III) chloride [Ru(NH3)6]3+ and [Fe(CN)6]4−/3− and benchmarked versus AMEs printed with commercially available conductive filament from Protopasta. A summary of key benchmarking data can be found in Table 1. Fig. 3A presents an example scan rate study for the castor oil/rPLA AME against the near-ideal outer sphere probe [Ru(NH3)6]3+ (1 mM, 0.1 M KCl). Fig. 3B compares this filament and the commercial benchmark at 25 mV s−1. At 25 mV s−1, the castor oil/rPLA AME produces a higher cathodic peak current at (81.8 ± 4.3) μA compared to (65.8 ± 3.5) μA for the commercial sample. Additionally, the peak-to-peak separation (ΔEp) is significantly smaller for the castor oil/rPLA AME at (110 ± 9) mV compared to (238 ± 5) mV for the commercial AME. The data from scan rate studies against [Ru(NH3)6]3+ for both the castor oil/rPLA and commercial AMEs were used to determine the heterogeneous electrochemical rate constant (k°) and the real electrochemical surface area (Ae).30,31 The k° of the castor oil/rPLA was calculated to be (1.71 ± 0.22) × 10−3 cm s−1, compared to (0.30 ± 0.03) × 10−3 cm s−1 for the commercial AME, highlighting the improved performance of this filament for the production of working electrodes. The AME was also tested by CV over 100 cycles in [Ru(NH3)6]3+ producing a relative standard deviation of 5.63%, demonstrating its electrochemical stability as an electrode. ), electrochemically active area (Ae), EIS charge transfer resistance (Rct) and solution resistance (Rs), and dopamine sensitivity, LOD, and LOQ for the commercial and the bespoke filaments. The uncertainties are the standard deviations across three different AME measurements
| Parameter | Protopasta | Castor oil |
|---|---|---|
| a Extracted from 25 mV s−1 CVs. b Calculated using cyclic voltammetry scan rate study (5–500 mV s−1). c Extracted from Nyquist plots of EIS experiments in a solution of [Ru(NH3)6]3+ (1 mM in 0.1 M KCl), with a nichrome wire CE and Ag|AgCl (3 M KCl) RE. d Extracted from calibration plots of dopamine CVs in different concentrations (10–500 mmol L−1 in 0.1 M PBS pH 7.4), with a nichrome wire CE and Ag|AgCl RE. | ||
−Ipc![[thin space (1/6-em)]](https://www.rsc.org/images/entities/char_2009.gif) a (μA) a (μA) |
65.8 ± 3.5 | 81.8 ± 4.3 |
ΔEp![[thin space (1/6-em)]](https://www.rsc.org/images/entities/char_2009.gif) a (mV) a (mV) |
238 ± 5 | 110 ± 9 |

|
(0.30 ± 0.03) × 10−3 | (1.71 ± 0.22) × 10−3 |
A
e![[thin space (1/6-em)]](https://www.rsc.org/images/entities/char_2009.gif) b (cm2) b (cm2) |
0.47 ± 0.02 | 0.63 ± 0.04 |
R
ct![[thin space (1/6-em)]](https://www.rsc.org/images/entities/char_2009.gif) c (Ω) c (Ω) |
623 ± 187 | 41 ± 8 |
R
s![[thin space (1/6-em)]](https://www.rsc.org/images/entities/char_2009.gif) c (Ω) c (Ω) |
765 ± 36 | 159 ± 18 |
| Sensitivityd (μA μmol−1 L) | 0.13 ± 0.01 | 0.22 ± 0.01 |
Electrochemical impedance spectroscopy (EIS) can be utilised to establish the solution resistance (Rs) and the charge transfer resistance (Rct) when the Nyquist plot is fitted with the appropriate circuit. The castor oil/rPLA and commercial AMEs were tested against RuHex and fitted with a Randles circuit, Fig. 3C. When the solutions and electrochemical equipment are identical, except for the working electrode, the Rs value can give insight into the resistance introduced to the system by the working electrode. In this case, the castor oil/rPLA AME produced an Rs value of (159 ± 18) Ω in comparison to (765 ± 36) Ω for the commercial electrode, indicating the castor oil AME produced much lower resistance. The Rct values indicate the resistance formed through a single kinetically-controlled electrochemical reaction. In this case, the castor oil/rPLA AME produced an Rct of (41 ± 8) Ω compared to (623 ± 187) Ω for the commercial electrode, again indicating the improved performance of the recycled filament.
To further test the activated AMEs made from castor oil/rPLA and commercial filament, they were tested against the commonly used inner sphere redox probe [Fe(CN)6]4−/3− and for the detection of dopamine. Cyclic voltammograms obtained at 25 mV s−1 for both AMEs are presented in Fig. 3D. These show a clear improvement in ΔEp for the castor oil/rPLA filament. They were both then applied to detecting dopamine using cyclic voltammetry (CV). An example plot for detecting dopamine (10–500 μm) using the castor oil/rPLA AME is shown in Fig. 3E, with calibration plots for both and the benchmark presented in Fig. 3F. The castor oil/rPLA AME produced a sensitivity of 0.22 ± 0.01 μA μM−1 compared to 0.13 ± 0.01 μA μM−1 for the AME printed from the commercial filament.
This characterisation highlights the improved performance of the castor oil/rPLA filament compared to the commercial benchmark. To utilise this in an appropriate electroanalytical sensor for detecting BPA within water samples, a cell with specific electrodes was then designed.
3.3 Cell design
To adequately design a full electroanalytical cell for the detection of BPA some key considerations had to be met, including: simple print files with minimal chance of print failure; adequate volume size for different applications such as collecting water from a tap, bottle or environmental source; simple construction of the water tight cell; use of a defined removable AME working electrode to easily replenish the surface between measurements; incorporation of standard non-carbon commercial reference and counter electrodes to avoid contamination through the adsorption of BPA onto their surfaces.24Fig. 4A shows the cut-through view and Fig. 4B the top view of the bespoke electroanalytical cell designed to detect BPA. The printed AME can be seen in Fig. S2A,† where a flat tab is printed with a ∅ 2 mm cylinder protruding vertically, which, when the cell was fully assembled, produced a disc electrode flush with the electrochemical cell base. The tab allowed for the simple attachment of a crocodile clip to form a connection to the potentiostat. This kept the connection length as short as possible at 16 mm, as the connection length of AMEs is known to affect the electrochemical performance.32 The cell was sealed using a rubber O-ring around this electrode cylinder, with adequate pressure supplied by a screw threaded into a heat-set insert mounted within the cell body, as seen in Fig. 4A. The cell was designed with a detachable lid, with cavities specific for adding an Ag|AgCl (3 M KCl) reference electrode, and coiled wire counter electrode. This allowed the lid to easily be removed to add sample to the cell and to clean the electrodes between measurements, reducing the amount of plastic waste. Additionally, the lid served to keep the electrode spacing identical no matter the device's user.
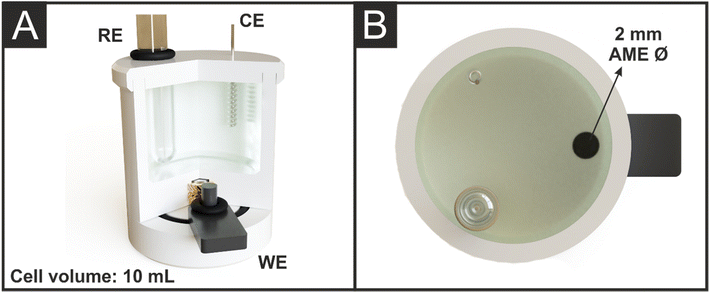 | ||
| Fig. 4 (A) Cross-section view and (B) top view of the cell body in operation with castor oil/rPLA WE, external nichrome wire CE, and Ag|AgCl RE assembled. | ||
This cell and its lid were printed using rPETG due to the increased robustness and longevity compared to PLA/rPLA, to reduce the need for re-printing – and therefore plastic waste – due to solution ingress or breakages; though the cells could feasibly be produced from any waterproof polymer. In total, the cell and lid required 14 g of rPETG to produce.
The rPLA/Castor oil working electrode required printing with an increased extrusion ratio of 1.6/160%, to volumetrically compensate for the slightly smaller diameter of the bespoke filament compared to the 1.75 mm commercial filament. Nozzle temperature was also increased to 225 °C to compensate for the lower viscosity at standard 205 °C (virgin PLA) printing temperatures. Each electrode required 0.8 g of feedstock to produce, corresponding to a material cost of £0.60. Following the production of a suitable electroanalytical sensing platform, the bespoke castor oil/rPLA AMEs were tested for the determination of BPA.
3.4 Electroanalytical determination of BPA
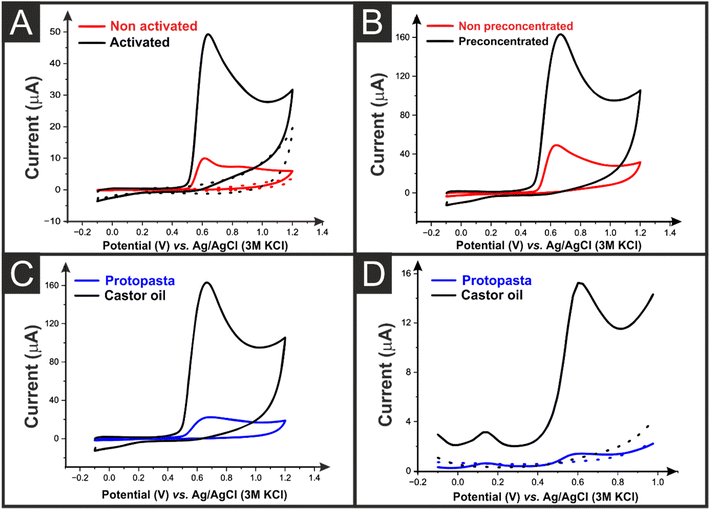
Utilising the cell outlined, the castor oil/rPLA AMEs were tested for the determination of BPA. Fig. 5A shows the CV response for both a non-activated and activated AME produced from castor oil/rPLA which shows a pronounced oxidation peak at ∼+0.65 V where the activitation exposes the edge plane sites/defects upon the CB, giving rise to improved electrochemical responses. Thus it is clear that activation of the AMEs gives significantly enhanced signals for determining BPA, and hence all AMEs were activated for this work. As shown within Fig. S4A,† a plot of the peak potential (Ep) against the natural logarithm of the scan rate (In![[thin space (1/6-em)]](https://www.rsc.org/images/entities/char_2009.gif) v) gives rise to a linear plot of Ep = 0.0233ln(ν) + 0.7143 and using the Laviron approach,33 this suggests that the number of electrons are 2.15. Furthmore, a pH study is shown within Fig. S4(B and C)† which shows that a plot of the Epversus pH gives rise to a gradient of 66 V per pH which compares to the theoretical prediction and suggests that the number of electrons and protons are the same. This corresponds with the Laviron approach confirming that the electrochemical oxidation of BPA involves 2 protons and 2 electrons.
v) gives rise to a linear plot of Ep = 0.0233ln(ν) + 0.7143 and using the Laviron approach,33 this suggests that the number of electrons are 2.15. Furthmore, a pH study is shown within Fig. S4(B and C)† which shows that a plot of the Epversus pH gives rise to a gradient of 66 V per pH which compares to the theoretical prediction and suggests that the number of electrons and protons are the same. This corresponds with the Laviron approach confirming that the electrochemical oxidation of BPA involves 2 protons and 2 electrons.
Fig. 5B shows the improvement seen when a preconcentration step is applied for the AMEs printed from castor oil/rPLA filament, where the peak current increases from 41.6 μA to 128.5 μA. It has been seen in previous work that a preconcentration step, where the solution was stirred for 5 min can improve the performance of AMEs toward the detection of BPA. This adsorption can be facilitated when the BPA is below its pKa value of 9.73.24 Using activated AMEs and a preconcentration step, the castor oil/rPLA and commercial benchmarks were compared using both CV, Fig. 5C, and differential pulse voltammetry (DPV), Fig. 5D. It can be seen that the peak currents using both electrochemical techniques are greatly increased through the use of the castor oil/rPLA filament, with the CV peak currents increasing ∼8-fold and the DPV peak currents increasing ∼17-fold.
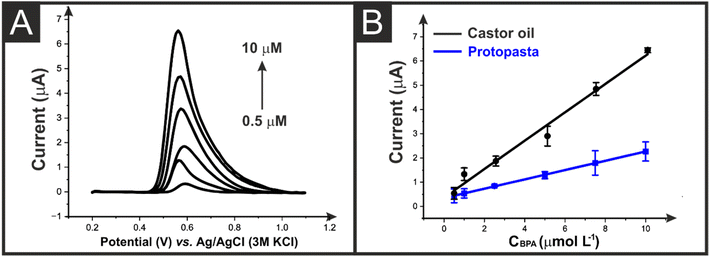
The castor oil/rPLA AMEs were then compared to the commercial benchmark for detecting BPA (0.5–10 μM) using DPV. An example of the DPV response obtained using the castor oil/rPLA filament can be seen in Fig. 6A. Linear calibration plots were obtained for both filaments, which are presented in Fig. 6B. The AMEs made from the castor oil/rPLA produced an improved electroanalytical performance, giving a sensitivity of 0.59 μA μM−1, a LOD of 0.1 μM and LOQ of 0.34 μM. This is compared to a sensitivity of 0.19 μA μM−1, a LOD of 4.5 μM and LOQ of 15.1 μM for the AMEs printed from the commercial electrode. Additionally, this electrode performs excellently compared to other literature reports, Table S2.† The castor oil/rPLA AMEs were then tested for their repeatability and reproducibility, Fig. S5.† The AMEs produced an RSD of 8% for repeatability after polishing the same electrode 3 times and an RSD of 5% for three separate electrodes when measuring 5 μM BPA, highlighting the excellent performance of the filament.
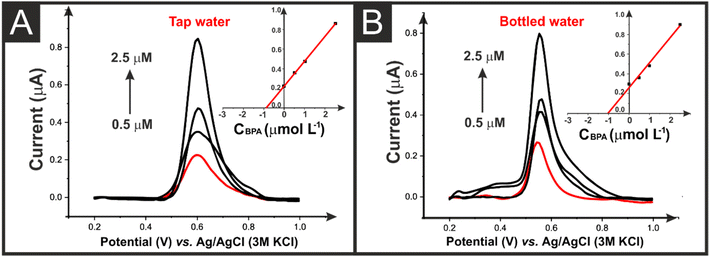
The castor oil/rPLA AMEs were then applied to detect 1.0 μM BPA in spiked bottled and tap water samples. Fig. 7A and B show the DPV curves for these analyses with the respective calibration curve found inset. Using these curves it was possible to recover 104 ± 2% and 89 ± 11% in the bottled and tap water, respectively.
4. Conclusions
This work has presented the production of electrically conductive additive manufacturing filament from recycled PLA and a bio-based plasticiser, castor oil. The filament was physiochemically characterised through TGA, XPS, and SEM to provide evidence for the successful production of AMEs. The bespoke filament has been shown to exceed the performance of a commercial benchmark in both the electrochemical characterisation, electroanalytical determination of dopamine, and electroanalytical determination of BPA. The k° of the castor oil/rPLA was calculated to be (1.71 ± 0.22) × 10−3 cm s−1 compared to (0.30 ± 0.03) × 10−3 cm s−1 for the commercial AME, highlighting the improved performance of this filament for the production of working electrodes. A bespoke cell was designed for the use of the bespoke filament toward the detection of BPA. The AMEs made from the castor oil/rPLA produced an improved electroanalytical performance, giving a sensitivity of 0.59 μA μM−1, a LOD of 0.1 μM and LOQ of 0.34 μM. This is compared to a sensitivity of 0.19 μA μM−1, a LOD of 4.5 μM and LOQ of 15.1 μM for the AMEs printed from the commercial electrode. The castor oil/rPLA AMEs were then used to detect BPA in spiked bottled and tap water, achieving recoveries of 104 ± 2% and 89 ± 11%, respectively. This shows how the production of conductive filament may be done in more sustainable ways whilst still improving on performance.Conflicts of interest
There are no conflicts of interest to declare.Acknowledgements
This paper was developed as part of the TRANSFORM-CE project, a transnational cooperation project supported by the Interreg North-West Europe Programme as part of the European Regional Development Fund (ERDF). The authors would like to thank Dr Hayley Andrews and Dr Gary Miller for collecting SEM and XPS data, respectively. IA and TP would like to acknowledge São Paulo Research Foundation (FAPESP. grants# 2018/08782-1, 2019/15065-7, and 2022/07552-8). CK, BCJ, and JAB would like to acknowledge Coordenação de Aperfeiçoamento de Pessoal de Nível Superior (CAPES. Financial code 001, and Pandemias 88887.504861/202000), São Paulo Research Foundation (FAPESP. grants# 2021/07989-4, 2019/00473-2, 2017/21097-3, and 2013/22127-2), and Conselho Nacional de Desenvolvimento Científico e Tecnológico (CNPq. 302839/2020-8, 303338/2019-9 and 308203/2021-6).References
- United Nations, End plastic pollution: towards an international legally binding instrument, https://www.unep.org/news-and-stories/press-release/historic-day-campaign-beat-plastic-pollution-nations-commit-develop, (accessed 06/04/2023).
- United Nations, Goal 12 - Ensure sustainable consumption and production patterns, https://sdgs.un.org/goals/goal12, (accessed 06/04/2023).
- EU Commision, Plastics in a circular economy https://research-and-innovation.ec.europa.eu/research-area/environment/circular-economy/plastics-circular-economy_en, (accessed 19/05/2023).
- WRAP, The UK Plastics Pact, https://wrap.org.uk/taking-action/plastic-packaging/initiatives/the-uk-plastics-pact, (accessed 06/04/2023).
- P. Schroeder, K. Anggraeni and U. Weber, J. Ind. Ecol., 2019, 23, 77–95 CrossRef.
- F. Grosse, SAPI EN. S. Surveys and Perspectives Integrating Environment and Society, 2010 Search PubMed.
- G. C. Nobre and E. Tavares, J. Cleaner Prod., 2021, 314, 127973 CrossRef.
- E. Sigley, C. Kalinke, R. D. Crapnell, M. J. Whittingham, R. J. Williams, E. M. Keefe, B. C. Janegitz, J. A. Bonacin and C. E. Banks, ACS Sustainable Chem. Eng., 2023, 11, 2978–2988 CrossRef CAS PubMed.
- A. G.-M. Ferrari, N. J. Hurst, E. Bernalte, R. D. Crapnell, M. J. Whittingham, D. A. Brownson and C. E. Banks, Analyst, 2022, 147, 5121–5129 RSC.
- P. Wuamprakhon, R. D. Crapnell, E. Sigley, N. J. Hurst, R. J. Williams, M. Sawangphruk, E. M. Keefe and C. E. Banks, Adv. Sustainable Syst., 2023, 7, 2200407 CrossRef CAS.
- R. J. Williams, T. Brine, R. D. Crapnell, A. G.-M. Ferrari and C. E. Banks, Mater. Adv., 2022, 3, 7632–7639 RSC.
- M. J. Whittingham, R. D. Crapnell, E. J. Rothwell, N. J. Hurst and C. E. Banks, Talanta Open, 2021, 4, 100051 CrossRef.
- D. Bikiaris and D. Achilias, Polymer, 2008, 49, 3677–3685 CrossRef CAS.
- D. N. Bikiaris, G. Z. Papageorgiou and D. S. Achilias, Polym. Degrad. Stab., 2006, 91, 31–43 CrossRef CAS.
- S. Singh, S. Sharma, S. J. Sarma and S. K. Brar, Environ. Prog. Sustainable Energy, 2023, 42, e14008 CAS.
- K. Anjani, Ind. Crops Prod., 2012, 35, 1–14 CrossRef.
- C. Kalinke, P. R. de Oliveira, J. A. Bonacin, B. C. Janegitz, A. S. Mangrich, L. H. Marcolino-Junior and M. F. Bergamini, Green Chem., 2021, 23, 5272–5301 RSC.
- C. Kalinke, P. R. D. Oliveira, A. S. Mangrich, L. H. Marcolino-Junior and M. F. Bergamini, J. Braz. Chem. Soc., 2020, 31, 941–952 CAS.
- C. Kalinke, A. P. Zanicoski-Moscardi, P. R. de Oliveira, A. S. Mangrich, L. H. Marcolino-Junior and M. F. Bergamini, Microchem. J., 2020, 159, 105380 CrossRef CAS.
- J. Corrales, L. A. Kristofco, W. B. Steele, B. S. Yates, C. S. Breed, E. S. Williams and B. W. Brooks, Dose-Response, 2015, 13, 1559325815598308 CrossRef PubMed.
- S. Chouhan, S. K. Yadav, J. Prakash and S. P. Singh, Ann. Microbiol., 2014, 64, 13–21 CrossRef CAS.
- G. Greczynski and L. Hultman, Sci. Rep., 2021, 11, 1–5 CrossRef PubMed.
- E. M. Richter, D. P. Rocha, R. M. Cardoso, E. M. Keefe, C. W. Foster, R. A. Munoz and C. E. Banks, Anal. Chem., 2019, 91, 12844–12851 CrossRef CAS PubMed.
- C. Kalinke, P. R. de Oliveira, N. V. Neumsteir, B. F. Henriques, G. de Oliveira Aparecido, H. C. Loureiro, B. C. Janegitz and J. A. Bonacin, Anal. Chim. Acta, 2022, 1191, 339228 CrossRef CAS PubMed.
- . Proto-pasta, Conductive PLA Technical Data Sheet, https://cdn.shopify.com/s/files/1/0717/9095/files/TDS__Conductive_PLA_1.0.1.pdf?1771, (accessed 05/01/2023, 2023).
- J. Guo, C.-H. Tsou, Y. Yu, C.-S. Wu, X. Zhang, Z. Chen, T. Yang, F. Ge, P. Liu and M. R. D. Guzman, Iran. Polym. J., 2021, 30, 1251–1262 CrossRef CAS.
- R. D. Crapnell, E. Bernalte, A. G.-M. Ferrari, M. J. Whittingham, R. J. Williams, N. J. Hurst and C. E. Banks, ACS Meas. Sci. Au, 2021, 2, 167–176 CrossRef PubMed.
- R. Blume, D. Rosenthal, J. P. Tessonnier, H. Li, A. Knop-Gericke and R. Schlögl, ChemCatChem, 2015, 7, 2871–2881 CrossRef CAS.
- T. R. Gengenbach, G. H. Major, M. R. Linford and C. D. Easton, J. Vac. Sci. Technol., A, 2021, 39, 013204 CrossRef CAS.
- R. D. Crapnell and C. E. Banks, Talanta Open, 2021, 4, 100065 CrossRef.
- A. García-Miranda Ferrari, C. W. Foster, P. J. Kelly, D. A. Brownson and C. E. Banks, Biosensors, 2018, 8, 53 CrossRef PubMed.
- R. D. Crapnell, A. Garcia-Miranda Ferrari, M. J. Whittingham, E. Sigley, N. J. Hurst, E. M. Keefe and C. E. Banks, Sensors, 2022, 22, 9521 CrossRef CAS PubMed.
- E. Laviron, J. Electroanal. Chem., 1979, 101, 19 CrossRef CAS.
Footnote |
| † Electronic supplementary information (ESI) available. See DOI: https://doi.org/10.1039/d3gc01700a |
| This journal is © The Royal Society of Chemistry 2023 |

