 Open Access Article
From shrimp balls to hydrogen bubbles: borohydride hydrolysis catalysed by flexible cobalt chitosan spheres†
Frances
Pope
 a,
Jeffrey
Jonk
 a,
Millie
Fowler
 a,
Petrus C. M.
Laan
 a,
Norbert J.
Geels
 a,
Larissa
Drangai
 b,
Vitaly
Gitis
 c and
Gadi
Rothenberg
 *a
*a
aVan ‘t Hoff Institute for Molecular Sciences, University of Amsterdam, Science Park 904, Amsterdam 1098 XH, The Netherlands. E-mail: g.rothenberg@uva.nl
bAustrian Centre of Competence for Tribology, AC2T Research GmbH, Viktor-Kaplan-Straße 2, Wiener Neustadt, 2700, Austria
cFaculty of Engineering Sciences, Ben-Gurion University of the Negev, PO Box 653, Beer-Sheva 8410501, Israel
First published on 5th July 2023
Abstract
The transition to a hydrogen economy is a must in any carbon-emissions-free future scenario. One practical challenge of this transition is the safety concern when using large amounts of compressed or liquid hydrogen. This can be averted by using solid salts, such as potassium borohydride (KBH4), as hydrogen carriers for industrial applications. Many metals and oxides catalyse this reaction, but the challenge lies in the catalysts’ stability. The combination of high pH and fast hydrogen generation causes mechanical degradation. Here we show that chitosan, an abundant biobased polymer, is a practical and effective catalyst support for KBH hydrolysis. We form chitosan spheres that encapsulate the active cobalt catalyst species, all done under ambient conditions. They remain stable at the high reaction pH, and swell and shrink with the formation of hydrogen. The catalyst can be reused several times in both batch and continuous modes. A continuous test using a 5 w/w% stabilised fuel solution and only 250 mg catalyst generated hydrogen at an average rate of 32 mL min−1 over 48 h. Studying the reaction kinetics using high-precision measurements, we observe a kink in the Arrhenius plot, reflecting a physical change in the system (the swelling of the spheres) rather than a change in mechanism. Comparison studies show that the flexible biopolymer support outperforms classic porous oxide supports such as alumina, magnesia, and alumina-magnesia. Our research shows a clear green advance, based on multi-factor comparison: First, our system enables safe hydrogen transportation and on-demand release (low hazard and enables clean energy). Second, it uses a renewable and abundant bio-based source and no noble metals (no resource depletion). Finally, it requires only simple preparation under ambient conditions and at a low cost (practical application). All these make the encapsulation in flexible chitosan spheres an attractive approach to sustainable catalysts for carbon-free fuels.
Introduction
Fossil fuel consumption is at an all-time high, and with it CO2 emissions that contribute to climate change.1,2 Reducing these emissions requires a shift to renewable energy, as well as switching to carbon-free energy carriers. Hydrogen is such a carrier, with the potential for driving the world economy into a new carbon-free era with water as the only emission. Yet it comes with its own set of practical problems. Molecular H2 stored as a compressed gas or in liquid form is highly energy intensive.3 This is an advantage in some applications, but a safety concern in others.4 For medium-scale storage and release on mobile installations, such as cranes, ships and generators, other modes of storing hydrogen are preferable.There are various hydrogen carriers. Ammonia and methanol are popular candidates, yet each also has its limitations. Methanol dehydrogenation requires high temperatures, and can also release CO2. Ammonia can contaminate the H2 streams generated, and is toxic itself under ambient conditions. An alternative is using alkali borohydrides. These solid salts can be stored safely in air under ambient conditions. When reacted with water, they spontaneously release four moles of H2 gas with the corresponding metaborate salt by-product (eqn (1)).5,6 However, controlling this spontaneous release (and thus preventing runaway reactions) is difficult. Instead, one can stabilise the solution with a base, and control the hydrogen release by using a catalyst.7
| MBK4 + (2 + x)H2O → 4H2 + MBO2·xH2O | (1) |
Sodium borohydride (NaBH4) is commonly used in academic studies due to its high energy density.8 However, its metaborate product has a low solubility, rendering it problematic for industrial applications (the hydrogen content of LiBH4 is even higher, but it is a flammable salt, and lithium is expensive due to competition from the batteries sector).9 We chose potassium borohydride (KBH4) as a viable alternative. Although its hydrogen energy density is lower than that of NaBH4, its metaborate product has a higher solubility.10,11 Therefore, KBH4 can be a practical solid hydrogen carrier for real-life applications (Table 1).
| Hydrogen density (wt%) | Solubility (g mL−1) | Solubility MBO2 product (g mL−1) | |
|---|---|---|---|
| LiBH4 | 18.3 | Reacts | 0.03 |
| NaBH4 | 10.6 | 0.55 | 0.21 |
| KBH4 | 7.4 | 0.19 | 1.51 |
The catalytic dehydrogenation of borohydrides is relatively simple. Many metals can catalyse this reaction.12–20 The primary practical limitation is catalyst durability, due to the highly basic environment and the large volumes of H2 generated. Few conventional catalysts can withstand long-term exposure to borohydride solutions, as both mechanical and chemical stability are needed.
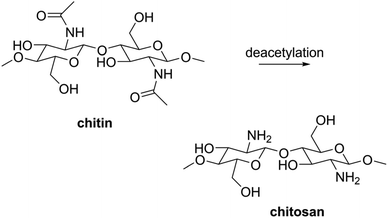
Searching for the combination of mechanical flexibility and high pH stability, we turned to biopolymers, and specifically to chitosan. This natural polymer is made by deacetylation of chitin, the main component of insect exoskeletons and crustacean shells (Scheme 1).21–23 It is a biodegradable, biocompatible material that is widely available on multi-ton scale (mostly from shrimp and crab shell waste).24 The chemical extraction of chitin and its conversion to chitosan are well-documented, energy-efficient processes.23,25 All this makes chitosan a particularly attractive sustainable resource.
The recurring amine groups on the chitosan backbone make it highly soluble in aqueous acidic solutions, but sparingly soluble in basic ones.26 This allows for colloidal synthesis, giving so-called “chitosan spheres”. To date, interest in chitosan has focused mainly on medical applications.27,28 But since chitosan can also stabilise metal nanoparticles, its spheres can also be used both as supports and catalytic “macroreactors”.29–31 For the active metal, cobalt is the most active alternative that is also available at scale, and is a thousand times cheaper than platinum or palladium.
Borohydride hydrolysis is not a new technology. It has been researched for decades as an alternative hydrogen storage medium for industrial application, even reaching prototype level in the early 2000s.32,33 However, the catalysed reaction has yet to be paired with a green catalyst. In this paper, we study the hydrolytic dehydrogenation of KBH4 using chitosan-encapsulated cobalt catalysts and compare these with cobalt-based catalysts on traditional oxide supports. The synthesis is done at ambient temperature and pressure, with only water as the solvent. It is a simple and scalable method for making this chitosan-encapsulated catalyst. The catalyst is cheap, active and stable and only uses highly available materials. Its high pH stability and mechanical flexibility allow for high hydrogen production rates, both in batch and in continuous setups.
Results and discussion
For the catalytic hydrolysis of KBH4, we chose cobalt (oxide) particles, well known as active catalytic species for this reaction.34 The challenge lies in ensuring long-term catalyst stability under the conditions needed for real-life applications.35We began by supporting the cobalt species on oxide supports: alumina, magnesia-alumina, and magnesia (see Experimental section for detailed procedures). Alumina has a with well-defined pore size and its phase structure is easily controlled via calcination and sintering.36,37 However, γ-alumina was unstable under the highly basic reaction conditions. Calcination at 1050 °C to the θ phase improved the stability, but only for a few hours. We then moved to magnesia-alumina and magnesia – supports with a higher basic stability. These catalysts were active, but degraded into powder after a few hours of hydrogen generation. In the case of the magnesia-containing catalysts, control experiments confirmed that the degradation was not due to the basic environment, but rather to a cracking of the pellets caused by the copious formation of hydrogen bubbles.
At this point, we realised that the ideal support would be one that can tolerate a highly basic environment, and is either very tough or highly flexible. In this way, it could cope both with the high pH of the system and with the vigorous formation of hydrogen. Additionally, we focused on materials that were readily available and could form a low-energy and low-waste synthesis with the aim of developing a truly sustainable catalyst. The synthesis of traditional supports, such as alumina, titania or silica, typically require high temperatures, and a calcination step is necessary to bind the metal to the support. Instead, we turned to chitosan, a stable biopolymer that can “trap” metal particles by stabilising them and can also be prepared as macrospheres when dropped into an alkaline solution.38 Our hypothesis was that encapsulating cobalt particles in such porous chitosan spheres would create millimetre-sized “reactors” where borohydride and water could enter, transforming into hydrogen and metaborate. The latter would diffuse outside, and the flexibility of the chitosan particles would prevent the cracking and destruction caused by the hydrogen bubbles.
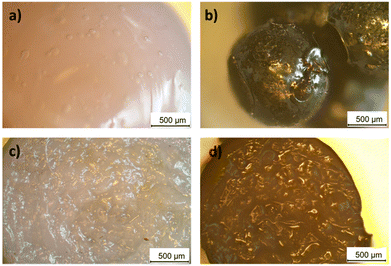
The cobalt-containing chitosan spheres were prepared by modifying the procedure of Yang et al. with the removal of a freeze-drying step.39 In a typical synthesis, cobalt chloride, chitosan and hydrochloric acid were mixed to form a pink gel. This was extruded through a syringe and needle and dropped into a highly basic solution, forming the cobalt chitosan spheres. The needle diameter determines the size of the gel sphere (once dropped into the base solution, the sphere size is set; typical spheres were ca. 1 mm in diameter and weighed 2.5 mg). In solution, the gelatinous spheres were firm and smooth. Once dried, they shrank and turned brown, yet retained their flexibility (see Experimental section for detailed procedures). Unlike with classic porous supports, our method requires no high-temperature calcination step.
Optical microscopy analysis of the surface and cross-section of the spheres showed the changes in smoothness and uniformity before and after drying (Fig. 1). The cross-section of the gel sphere showed a disordered, brain-like structure, which was retained after drying.
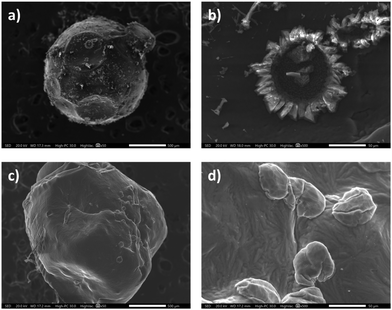
We than ran scanning electron microscopy (SEM) analysis in conjunction with Energy Dispersive Spectroscopy (EDS/EDX) to look more closely at the spheres’ surface (Fig. 2). The spheres as a whole were uniform. Higher magnification of the cobalt-containing ones showed the formation of crystals on the surface. EDX analysis confirmed the presence of cobalt throughout the surface, both in the smooth and crystalline areas. Conversely, the surface of the pristine chitosan spheres (no metal) was smooth. This supports our hypothesis that the crystallisation on the surface is caused by the presence of cobalt, rather than by the alkaline bath during the sphere formation process.
The EDX results were cross-checked using X-ray photoelectron spectroscopy (XPS). This showed that both the chloride and oxide forms of cobalt were present, confirming that the Co(II) species were not fully reduced during the synthesis (see Fig. 3). Both analyses confirmed the cobalt content to be 7 at% (20 wt%) throughout the surface of the spheres.
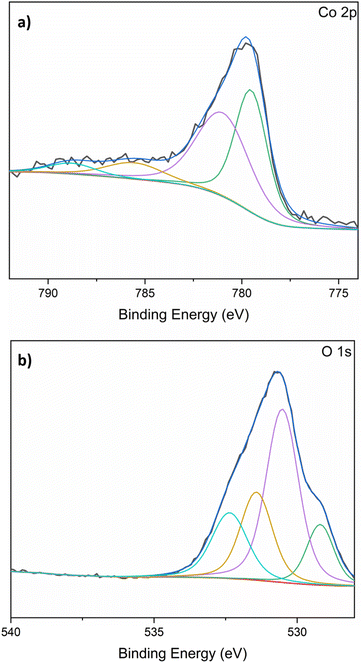 | ||
| Fig. 3 X-ray photoelectron spectra and fittings measured for the cobalt-chitosan spheres: (a) cobalt 2p; (b) oxygen 1s. | ||
The spheres’ flexibility, a critical parameter for their stability during the hydrogen bubble formation, was visible to the naked eye. During hydrolysis, the spheres swelled and floated to the top of the solution, where the generation of hydrogen bubbles was observed. We thus hoped that characterisation by nitrogen adsorption would also show these features. Unfortunately, the swelling of the active spheres requires the presence of the KBH4 solution. They did not swell during N2 adsorption, nor did they swell in water. For comparison, we also measured the metal-free chitosan spheres (without cobalt). As these spheres are clear, the physical changes are easier to see. The empty spheres changed significantly during analysis. Pre-treatment at 200 °C caused them to shrink and turn brown. Even when the pre-treatment temperature was dropped to 70 °C, the initial vacuum caused an aggressive shrinkage, and the spheres turned yellow. We believe that the vacuum required for measuring the N2 adsorption resulted in the collapsing of the pores by shrinkage. This was observed for both the empty and the cobalt-containing spheres. The downside of this is that the isotherm and pore size results were inconclusive (see ESI† for more details).
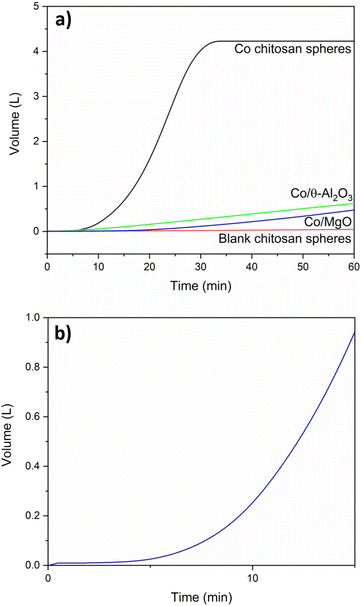
We then tested the spheres’ catalytic performance in hydrogen generation by comparing the hydrolysis activity of metal-free samples with the cobalt-containing ones. Reactions were run in a batch reactor using stabilised KBH4 solutions containing 5 w/w% KBH4 and 5 w/w% KOH in water (henceforth referred to as fuel). Fig. 4 shows the results. The cobalt-containing spheres gave full conversion (4.2 L hydrogen gas starting from a 50 mL fuel mixture) after 35 min. The hydrogen yield when using the metal-free (blank) chitosan spheres was only 0.045 L after 60 min, or <1% (red curve in Fig. 4a). Control experiments confirmed that this corresponds to the self-hydrolysis background reaction of the fuel mixture at 65 °C.35Fig. 4 also shows, for comparison, the reaction profile in the presence of equivalent amounts of cobalt supported on θ-alumina and magnesia. These catalysts were less active and unstable, degrading with the generation of hydrogen. Even with higher activity, and therefore faster H2 generation, the spheres maintained their structure, which was not seen by the traditional supports. We attribute this to the mechanical flexibility of the spheres. Yet comparing the results of traditional supports with those of the Co-chitosan catalysts shows an interesting feature: the Co/Al2O3 and Co/MgO are immediately active, but the cobalt chitosan catalyst has an activation period of about 10 min. These same features were seen when using NaBH4 (equivalent moles): an induction period, a slope and a plateau, all within the same 35–40 min time frame (Fig. S9†). The slopes of Na and K are 0.19 and 0.20 respectively.
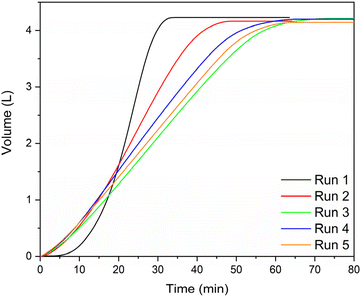
We can explain this activation period by considering the XPS results for the chitosan catalyst (see above), which showed that both cobalt chloride and cobalt oxide were present. The CoCl2 is inactive but is transformed to cobalt oxide during the first few minutes of the reaction, giving an active phase. Additionally, the swelling of the spheres as hydrogen is produced can give better access to the sites, opening escape routes for the hydrogen bubbles. To confirm this hypothesis, we ran multiple experiments re-using the same catalyst batch with fresh fuel, without drying the spheres between runs or treating them in any way (Fig. 5). After the first run, the activation period disappeared. The re-used catalyst reached full conversion over five runs, despite a small weight loss from transferring the catalyst between runs.
After multiple runs, XPS analysis showed a significant shift. Particularly for O, which is attributed to the formation of KBO2 by-product within the catalyst. This is confirmed by the presence of K and B also measured by XPS. We also see a decrease in the Co content after five runs (see ESI†). UV-vis analysis was done on the reaction solution to confirm the lack of leaching of any soluble cobalt species. Indeed, no cobalt was seen (see Fig. S10†). Furthermore, when the solid catalyst was removed, the reaction stopped completely. This reaffirms that no soluble species from the catalyst leached into the solution.
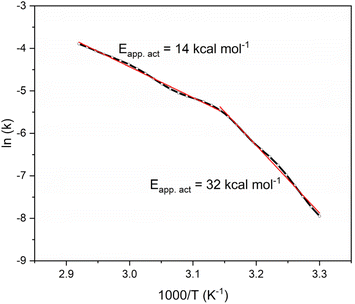
To gain further insight into this catalytic system, we determined the reaction rate at different temperatures and calculated from these the corresponding Arrhenius plot (Fig. 6). This was done with a “used” catalyst, to avoid the chemical activation period. We determined the hydrogen evolution rate over 20–80 °C from a single experiment by applying a temperature ramp of 2 °C min−1 using our high-precision bubble counter setup.40 This setup enables continuous automated measurements of gas evolution throughout the experiment with volume steps of ca. 10 μL. The advantage of using this setup is that the Arrhenius plot is calculated based on many observations (in this case, ca. 6000 measurements were used for constructing an Arrhenius plot with over 300 points). This enables the observation of features that are often hidden in plots with fewer points. Specifically, we see two regions: at lower temperatures, the calculated apparent activation energy is 32 kcal mol−1. Then, we see a kink in the plot at ca. 50 °C, and above this temperature the apparent activation energy reduces to 14 kcal mol−1 (values are averages of triplicate experiments, see ESI† for details).
The general view is that such a change in the Arrhenius plot corresponds to a change in the reaction mechanism. However, in this case we maintain that the change in the plot reflects the physical change in the system as the spheres swell with the production of hydrogen. However, the translation of the conversion data to an Arrhenius plot “hides” some of the system's complexity. The actual reaction rate between 20–50 °C, the low temperature regime, is relatively low. Thus, what we see is a combination of this low conversion and the time that it takes for the spheres to swell and allow more hydrogen to form and escape in the high-temperature regime. To support this hypothesis, we ran another control experiment in the low temperature regime (40 °C, see details in ESI†). The reaction proceeded to completion with the same type of reaction profile, only at a lower rate. This shows that the kink in the Arrhenius plot reflects a physical change in the overall system, rather than a different chemical mechanism.
Based on these results, we decided to test the Co-chitosan catalyst in a continuous reactor, that would give more insight to the possibilities for scale-up and practical application. We built a simple single-pass tube reactor, where the fuel solution was pumped over the catalyst bed (see photo inset in Fig. 7 and additional details in ESI†). The reactor was charged with 250 mg of catalyst, and the reaction was run continuously for 48 h at 65 °C, using the same fuel composition as in the batch experiments. In the first 10–12 h, the system showed large fluctuations, as the flow of fuel and gaseous products equilibrated. Thereafter, the catalyst generated a consistent stream of hydrogen and the spheres kept their shape throughout the reaction. The average hydrogen generation decreased slowly over time from 37 mL min−1 to 27 mL min−1 (Fig. 8). However, the small amount of catalyst and the fact that no recycling stream was used in this non-optimized setup, shows that this catalyst has serious potential for upscaling. Even at this stage, the cobalt chitosan catalyst is highly stable, outperforming many other metal/support combinations (see comparison in ESI, Table S1†).
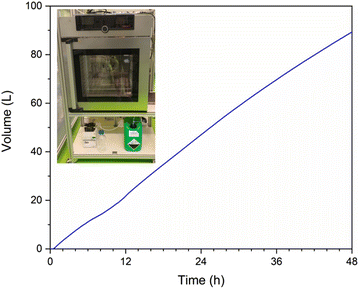 | ||
| Fig. 7 Cumulative H2 volume generated in continuous reactor by cobalt chitosan spheres over a 48 h period. Measurements taken once per second using mass flow meters. The inset shows a photo of the system with the fuel vat, pump, reactor oven and waste vat. A detailed description of the reactor system is included in the ESI.† | ||
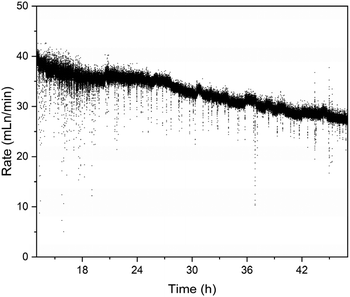 | ||
| Fig. 8 Rate of H2 generation measured by mass flow meters in a continuous reactor (measurements taken once per second). | ||
Note that this work focuses on finding a catalyst that can endure the conditions created by the hydrolysis reaction to make the hydrogen generation step viable. Even without efficient recycling of KBO2 there are “niche” applications where pressurised hydrogen cannot be used due to safety issues. However, these cannot be disclosed for confidentiality reasons. Study of metaborate recycling is, therefore, outside the scope of this paper.
Conclusions
The catalytic hydrolysis of KBH4 creates a harsh environment, with high pH and large hydrogen volume generation. Although many catalysts are available for this reaction, few can survive these conditions. Here we developed a flexible, easily synthesised and cheap catalyst. The chitosan is a readily available waste material which is upcycled to a high-value catalyst suitable for industrial application. Its bio-based nature in addition to its lack of energy intensive calcination steps contrasts highly with traditional porous oxide supports, and its mechanical flexibility makes it durable in stabilised KBH4 solutions for long periods of time. The cobalt chitosan spheres were characterised and tested in both continuous reactors and over multiple runs in a batch system. The catalyst underwent a chemical activation during the first reaction and was subsequently active, as confirmed by XPS. We believe this catalyst paves the way for alternative, green catalysts suitable for industrial hydrolysis of KBH4 for practical hydrogen release.Experimental
Unless noted otherwise, all chemicals were purchased from commercial sources (>98% pure) and used as received. Optical microscope images were taken on a Delphi-X Observer using a sCMEX-20 camera ImageFocusAlpha software. Scanning electron microscopy (SEM) images were taken on a Joel JSM IT500 LV microscopy paired with energy-dispersive spectroscopy (EDX) by a Bruker X flash 6|30 device. X-ray photoelectron spectroscopy (XPS) was taken with a ThermoFischer Scientific Thetaprobe instrument using a monochromatic Al Kα X-ray source (1486.6 eV) and with a 0.2 eV energy step size. Peak fittings were done using ThermoFischer Scientific Avantage Data System software with Gaussian/Lorentzian curve fittings. The binding reference used was C 1s for adventitious carbon at 284.4 eV. H2 reactions were done using in-house built batch and continuous reactors (see ESI† for details). H2 flow was recorded using two Bronkhorst EL-Flow Prestige mass flow meters in series: maximum 200 mLn min−1 and maximum 2 Ln min−1. Measurements were taken every 1s and collected using Bronkhorst Flowsuite software. All data was processed in Origin 2018.Synthesis of cobalt chitosan spheres
A 2 M HCl solution was prepared. CoCl2·6H2O (0.66 g, 2.77 mmol) was dissolved in 10 mL of the HCl solution. An acetic acid solution (1 v/v%). 1 g chitosan was dissolved in 20 mL of acetic acid solution, forming a gel. The CoCl2 solution was added to the chitosan gel and mixed until homogeneous. The gel was added dropwise via a syringe and needle into a KOH solution (4 M), forming pink, gelatinous spheres. The spheres were rinsed with H2O and left to dry in air overnight. This yielded 2.34 g of catalyst with ca. 7 wt% Co.H2 generation measurements
50 mL KOH solution (2.5 g, 45.6 mmol, 0.9 M) was made and heated to 65 °C. Solid KBH4 (2.5 g, 46.3 mmol, 0.9 M) and the catalyst (0.25 g, 7 wt% Co) were placed in a round bottom flask with a stir bar. The RBF was placed in an oil bath at 65 °C with a stir rate of 250 rpm. A dropping funnel was attached to the RBF containing the KOH solution. The setup was closed and flushed with air. Then, the KOH solution was dropped into the RBF and left to react. The gas passed through a cold trap before being measured by two mass flow meters in series (one max. rate 200 mL min−1, one max. rate 2 L min−1). Once the reaction was complete, the data was collected from the mass flow meters. The rate was measured once per second.Continuous reactions were conducted in setup built in-house (further details and schematics in ESI†). KOH (50 g, 0.9 mol, 0.9 M) was dissolved in 1 L H2O at RT, followed by the addition of KBH4 (50 g, 0.9 mol, 0.9 M). The solution was added in 1 L increments to the fuel stock. The solution was fed by liquid pump at RT to the reactor at a rate of 0.8 mL min−1. The solution passed through lines in the oven at 65 °C before reaching the reactor containing 0.25 g of Co chitosan catalyst. H2 was removed via a separator and passed through a bubbler before passing through two mass flow meters in series. The rate was measured once per second.
All data was copied into Origin and translated to mL min−1 rates. Then, an if statement was issued. If the rate was greater than 190 mL min−1, the high mass flow meter rate was used. If it was lower, the low mass flow meter rate was used. From here, the rate was integrated to determine the total H2 volume vs. time.
Procedure for Arrhenius measurements of KBH4 hydrolysis
Reaction kinetics of KBH4 hydrolysis were studied using a homebuilt bubble counter of which the design40 and data processing41 is described in detail elsewhere. Briefly, any hydrogen gas evolution caused by KBH4 hydrolysis in the reaction vessel gas was detected by analysing bubble formation from a hexadecane medium in the detection cell. Bubbles were detected with the aid of a laser and translated into an evolved volume of gas. Corrections for gas expansion of the head space of the reactor, increased vapor pressure of the used solvent at elevated temperature and thermal hydrolysis of KBH4 were made and corrected for in all experiments.A screwcap vial (10.0 mL) was charged with a stirring bean (8.0 × 3.0 mm) and KBH4 solution (8.0 mL, 0.4 g KBH4, 0.4 g KOH) and cooled to 5 °C by an external ice bath. Then, used catalyst (2.0 mg) was added, and the screwcap vial was mounted on the reactor head. Thereafter, the reactor was placed in the heating mantle under stirring (1400 rpm) and a ramp of 2.0 °C min−1 was initiated up until 80 °C.
Conflicts of interest
There are no conflicts to declare.Acknowledgements
This work was funded by the “Austrian COMET-Program” (project InTribology1, no. 872176) via the Austrian Research Promotion Agency (FFG) and the federal states of Niederösterreich and Vorarlberg and has been carried out within the “Excellence Centre of Tribology” (AC2T research GmbH). Specifically, we thank Dr C. Tomastik for his help and advice for this work, and Electriq∼Global for support and discussions.References
- IPCC, R. K. Pachauri, L. Meyer and Core Writing Team, Climate Change 2014: Synthesis Report. Contribution of working groups I, II and III to the Fifth Assessment Report of the Intergovernmental Panel on Climate Change,Geneva, Switzerland, 2014.
- G. Rothenberg, Sustain. Chem. Clim. Action, 2023, 2, 100012 CrossRef.
- B. Sundén, in Hydrogen, Batteries and Fuel Cells, ed. B. Sundén, Academic Press, 2019, pp. 37–55 Search PubMed.
- H. J. Pasman and W. J. Rogers, Int. J. Hydrogen Energy, 2012, 37, 17415–17425 CrossRef CAS.
- V. Minkina, S. Shabunya, V. Kalinin, V. Martynenko and A. Smirnova, Int. J. Hydrogen Energy, 2008, 33, 5629–5635 CrossRef CAS.
- G. Y. Moon, S. S. Lee, K. Y. Lee, S. H. Kim and K. H. Song, J. Ind. Eng. Chem., 2008, 14, 94–99 CrossRef CAS.
- V. G. Minkina, S. I. Shabunya, V. I. Kalinin, V. V. Martynenko and A. L. Smirnova, Int. J. Hydrogen Energy, 2012, 37, 3313–3318 CrossRef CAS.
- L. Laversenne, C. Goutaudier, R. Chiriac, C. Sigala and B. Bonnetot, J. Therm. Anal. Calorim., 2008, 94, 785–790 CrossRef CAS.
- N. P. Nies and R. W. Hulbert, J. Chem. Eng. Data, 1967, 12, 303–313 CrossRef CAS.
- O. Krol, J. Andrieux, J. J. Counioux, R. Tenu and C. Goutaudier, in XXXV JEEP – 35th Conference on Phase Equilibria, EDP Sciences, Annecy, France, 2009, p. 00023.
- P. Toledano, CR Acad. Sci., 1962, 254, 2348–2350 CAS.
- Q. Zhang, Y. Wu, X. Sun and J. Ortega, Ind. Eng. Chem. Res., 2007, 46, 1120–1124 CrossRef CAS.
- W. Ye, H. Zhang, D. Xu, L. Ma and B. Yi, J. Power Sources, 2007, 164, 544–548 CrossRef CAS.
- Y. Han, P. Li, Z. Tian, C. Zhang, Y. Ye, X. Zhu and C. Liang, ACS Appl. Energy Mater., 2019, 2, 6302–6310 CrossRef CAS.
- V. I. Simagina, P. A. Storozhenko, O. V. Netskina, O. V. Komova, G. V. Odegova, Y. V. Larichev, A. V. Ishchenko and A. M. Ozerova, Catal. Today, 2008, 138, 253–259 CrossRef CAS.
- D. Xu, H. Zhang and W. Ye, Catal. Commun., 2007, 8, 1767–1771 CrossRef CAS.
- Ö. Şahin, D. Kılınç and C. Saka, J. Energy Inst., 2016, 89, 182–189 CrossRef.
- Y. Kojima, K. Suzuki, K. Fukumoto, M. Sasaki, T. Yamamoto, Y. Kawai and H. Hayashi, Int. J. Hydrogen Energy, 2002, 27, 1029–1034 CrossRef CAS.
- J.-H. Park, P. Shakkthivel, H.-J. Kim, M.-K. Han, J.-H. Jang, Y.-R. Kim, H.-S. Kim and Y.-G. Shul, Int. J. Hydrogen Energy, 2008, 33, 1845–1852 CrossRef CAS.
- J. C. Walter, A. Zurawski, D. Montgomery, M. Thornburg and S. Revankar, J. Power Sources, 2008, 179, 335–339 CrossRef CAS.
- S. Kou, L. M. Peters and M. R. Mucalo, Int. J. Biol. Macromol., 2021, 169, 85–94 CrossRef CAS PubMed.
- M. S. Hossain and A. Iqbal, J. Bangladesh Agric. Univ., 2014, 12, 153–160 CrossRef.
- S. Kadouche, M. Farhat, H. Lounici, M. Fiallo, P. Sharrock, M. Mecherri and M. Hadioui, Waste Biomass Valorization, 2017, 8, 401–406 CrossRef CAS.
- I. Muñoz, C. Rodríguez, D. Gillet and B. M. Moerschbacher, Int. J. Life Cycle Assess., 2018, 23, 1151–1160 CrossRef.
- A. Pellis, G. M. Guebitz and G. S. Nyanhongo, Gels, 2022, 8, 393 CrossRef CAS PubMed.
- M. Rinaudo, Prog. Polym. Sci., 2006, 31, 603–632 CrossRef CAS.
- M. Dash, F. Chiellini, R. M. Ottenbrite and E. Chiellini, Prog. Polym. Sci., 2011, 36, 981–1014 CrossRef CAS.
- F. Ahmadi, Z. Oveisi, S. M. Samani and Z. Amoozgar, Res. Pharm. Sci., 2015, 10, 1–16 CAS.
- K. Tokarek, J. L. Hueso, P. Kuśtrowski, G. Stochel and A. Kyzioł, Eur. J. Inorg. Chem., 2013, 2013, 4940–4947 CrossRef CAS.
- H. Huang and X. Yang, Biomacromolecules, 2004, 5, 2340–2346 CrossRef CAS PubMed.
- M. Adlim, M. Abu Bakar, K. Y. Liew and J. Ismail, J. Mol. Catal. A: Chem., 2004, 212, 141–149 CrossRef CAS.
- S. C. Amendola, S. L. Sharp-Goldman, M. S. Janjua, M. T. Kelly, P. J. Petillo and M. Binder, J. Power Sources, 2000, 85, 186–189 CrossRef CAS.
- S. Amendola, Int. J. Hydrogen Energy, 2000, 25, 969–975 CrossRef CAS.
- U. B. Demirci and P. Miele, Phys. Chem. Chem. Phys., 2010, 12, 14651 RSC.
- F. Pope, N. I. Watson, A. Deblais and G. Rothenberg, ChemPhysChem, 2022, 23, e202200428 CAS.
- H. Schaper, E. B. M. Doesburg, P. H. M. De Korte and L. L. Van Reijen, Solid State Ionics, 1985, 16, 261–265 CrossRef CAS.
- S.-H. Cai, S. N. Rashkeev, S. T. Pantelides and K. Sohlberg, Phys. Rev. B: Condens. Matter Mater. Phys., 2003, 67, 224104 CrossRef.
- S. B. Khan, F. Ali, T. Kamal, Y. Anwar, A. M. Asiri and J. Seo, Int. J. Biol. Macromol., 2016, 88, 113–119 CrossRef CAS PubMed.
- C.-H. Yang, C.-Y. Wang, K.-S. Huang, C.-S. Yeh, A. H.-J. Wang, W.-T. Wang and M.-Y. Lin, PLoS One, 2012, 7, e49329 CrossRef CAS PubMed.
- T. K. Slot, N. R. Shiju and G. Rothenberg, Angew. Chem., Int. Ed., 2019, 58, 17273–17276 CrossRef CAS PubMed.
- T. K. Slot, N. Riley, N. R. Shiju, J. W. Medlin and G. Rothenberg, Chem. Sci., 2020, 11, 11024–11029 RSC.
Footnote |
| † Electronic supplementary information (ESI) available: Full XPS surveys of cobalt chitosan spheres before and after use in fuel, cobalt 2p and oxygen 1s XPS of cobalt chitosan spheres after use and full XPS survey of blank chitosan spheres. Also included are N2 isotherms of cobalt chitosan spheres, all Arrhenius plots collected to confirm ‘kink’ in measurements, and catalyst in fuel at 40 °C. Detailed experimental methods for Al2O3, Al2O3-MgO and MgO impregnated catalysts, blank chitosan sphere synthesis, low temperature reactions and cobalt impregnated catalyst testing described. Additionally, full details of both batch and continuous reactor setups and synthesis methods using these are given. See DOI: https://doi.org/10.1039/d3gc00821e |
| This journal is © The Royal Society of Chemistry 2023 |

