Original end-to-end smart diagnosis framework of systematic critical quality attributes meets FDA standards of phytomedicine by biosensor and multi-information fusion coupled with AI algorithm†
Chaofu
Ma‡
a,
Lijuan
Ma‡
a,
Zijian
Wang
b,
Nan
Li
a,
Mingshuang
Li
a,
Jing
Wang
a,
Xiaomeng
Wang
a,
Xiao
Song
c,
Hao
Yan
c,
Yanyu
Han
a,
Yongxia
Guan
d,
Jingchun
Yao
d,
Guimin
Zhang
*d and
Zhisheng
Wu
 *ae
*ae
aBeijing University of Chinese Medicine, School of Chinese materia medica, Beijing 100029, China. E-mail: wzs@bucm.edu.cn; Tel: +86-010-84738621
bBeijing Tongrentang Group Co., Ltd, Beijing 100062, China
cShaanxi University of Chinese Medicine, Coll Pharm, Xianyang 712046, China
dLunan Pharmaceutical Group Co., Ltd, State Key Laboratory of generic technology of traditional Chinese Medicine, Linyi 276005, China. E-mail: lunanzhangguimin@163.com
eEngineering Research Center for Pharmaceutics of Chinese Materia Medica and New Drug Development, Ministry of Education, Beijing 100029, China
First published on 24th November 2022
Abstract
Great progress has been made in phytomedicine manufacturing based on the development of green chemistry. However, identifying critical variation sources and exploring interactive coupling mechanisms to ultimately feedback to manufacturing remain rigorous challenges. Thus, an end-to-end smart diagnosis framework (ETE-SDF) of systematic critical quality attributes (CQAs) was proposed and applied to the phytomedicine product Xiaoer Xiaoji Zhike oral liquid. Firstly, a strategy integrating high electron mobility transistor biosensors and ultra-high performance liquid chromatography-mass spectroscopy was developed. A total of 92 chemical constituents were discovered, and then 10 biological CQAs were successfully identified. Secondly, this framework implemented an overall variation source data basis containing 18![[thin space (1/6-em)]](https://www.rsc.org/images/entities/char_2009.gif) 000 biological data points, 318
000 biological data points, 318![[thin space (1/6-em)]](https://www.rsc.org/images/entities/char_2009.gif) 400 chemical data points, and 900 physical data points. Subsequently, a voting decision-fusion strategy was developed and verified so that the aforementioned big data could be mapped to six artificial intelligence diagnosis strategies. Then, they formed systematic CQAs. The diagnostic accuracy of abnormal samples increased from 61% to 93.3%. Finally, a novel end-to-end mass transfer traceability pathway was developed. It demonstrated that the quality standard grade of Xiaoer Xiaoji Zhike oral liquid was grade III and at the level of 2–3 Sigma. Remarkably, inspissation was diagnosed as the low smart process that called for the most improvement. The temperature of inspissation was the first parameter that needed to be optimized to improve product quality. These results formed a higher reliability pharmaceutical management paradigm that had a positive impact on cost, safety, and sustainability as required by FDA standards.
400 chemical data points, and 900 physical data points. Subsequently, a voting decision-fusion strategy was developed and verified so that the aforementioned big data could be mapped to six artificial intelligence diagnosis strategies. Then, they formed systematic CQAs. The diagnostic accuracy of abnormal samples increased from 61% to 93.3%. Finally, a novel end-to-end mass transfer traceability pathway was developed. It demonstrated that the quality standard grade of Xiaoer Xiaoji Zhike oral liquid was grade III and at the level of 2–3 Sigma. Remarkably, inspissation was diagnosed as the low smart process that called for the most improvement. The temperature of inspissation was the first parameter that needed to be optimized to improve product quality. These results formed a higher reliability pharmaceutical management paradigm that had a positive impact on cost, safety, and sustainability as required by FDA standards.
Introduction
For the past decade, due to the high research and development (R & D) barriers in the pharmaceutical industry,1,2 more and more pharmaceutical companies have begun aggressively diverting investments away from R & D in favor of green manufacturing.3 Notably, The 21st-century pharmaceutical cGMP and process analysis technology industry guide issued by the U.S. Food and Drug Administration (FDA) encouraged pharmaceutical enterprises to use scientific and engineering principles to achieve lower costs, higher reliability, and better sustainability requirements.4 However, there is still a challenge for complex phytomedicine manufacturing to meet FDA standards.5,6 It is how to identify critical variation sources and explore interactive coupling mechanisms to ultimately feedback to manufacturing.7–9To overcome this challenge, an end-to-end smart diagnosis framework (ETE-SDF) was developed. Herein, the identification of CQAs was the first step of ETE-SDF to determine the critical variation sources. The CQAs are critical variation sources in quality control proposed by FDA, which include physical, chemical, biological, or microbial properties. In response, in order to identify the variation sources in ETE-SDF, the physical, chemical, and biological quality attributes of complex phytomedicine manufacturing need to be simultaneously considered.10
Generally, physical and chemical CQAs are specified in the national pharmacopeia. However, the identification of biological CQAs still has challenges. In this case, the biosensor provides a vital opportunity with its high sensitivity and specificity.11,12 Chen et al.13 performed the identification of biological CQAs by the integration of a biosensor and ultra-high performance liquid chromatography-mass spectroscopy (UPLC-MS/MS). In addition, previous studies discovered that high electron mobility transistor (HEMT) biosensors could successfully achieve the identification of biological CQAs of phytomedicine.14 All the above demonstrated that the HEMT biosensor was a strong choice for finding biological CQAs. This provided a reasonable basis for the identification of critical variation sources by ETE-SDF.
As we all know, the extensive exploration of CQAs in phytomedicine manufacturing has led to the explosive growth of data.15 However, due to the lack of effective means to distinguish the useful information and interactive coupling mechanisms, the efficiency, accuracy, and transparency of the pharmaceutical platform are low.16,17 In this sense, the next step for ETE-SDF was how to explore the information intersection and interaction coupling mechanism among CQAs in the complex processes of phytomedicine. This was critical to the effective utilization of isolated, dispersed, and stagnant data in the life cycle.18 For this, multi-information fusion coupled with artificial intelligence (AI) technology provided a novel solution. Multi-information fusion is a way to combine information from several sources in order to form a unified picture.19 AI technology is an effective tool for smart diagnosis, which is often applied to process diagnosis and medical diagnosis, etc.20,21 Their integration can enable the smart diagnosis of quality in the complex production processes of phytomedicine. This integration is of great significance for ETE-SDF to explore the interactive coupling mechanism of multivariate critical variation sources in end-to-end complex processes.22,23
The above relates more to the impact of CQAs on product quality, which is a downstream corrective model. The ultimate purpose of CQAs is the continuous improvement of the manufacturing process, shifting to an upstream proactive model. In particular, process characterization activities are very tightly linked to CQAs, which determine the scope and strategy in process control.24 This means that the focus of ETE-SDF should further be on how to put forward a strategy for process improvement.25,26
For this, process capability evaluation provided a final step in ETE-SDF. The process capability can realize systematic statistical process capability control so as to determine the direction of process improvement by a decision-making method.27 Besides, process capability was applied to evaluate process performance and the effectiveness of improvement measures.28,29
Therefore, this study proposed a novel ETE-SDF to identify the critical variation sources of quality, solved the cross management of information, and finally achieved the continuous improvement of the production process. Furthermore, this ETE-SDF was applied to the Xiaoer Xiaoji Zhike oral liquid, which is a pediatric antitussive phytomedicine.30 Outstandingly, this ETE-SDF contributed to the development of control strategies for complex phytomedicine manufacturing to meet FDA standards.
2. Materials and methods
2.1 Instruments and materials
Biological CQAs were realized by a Chi660E electrochemical workstation (Chenhua Instrument Corporation, China). Physical CQAs of chromaticity were characterized by a CM-5 spectrophotometer (Konica Minolta Corporation, Japan). Physical CQAs of taste were characterized by an electronic tongue (Shanghai Baosheng Industrial Development Effective Company, China). Furthermore, a DS2500 near-infrared spectrometer (NIR) (Metrohm Corporation, China) was used for chemical CQA semi-quantification. Ultra-high performance liquid chromatography (UPLC) and an autosampler, column oven, vacuum degasser, and HP chromatography workstation (Shimadzu Corporation, Japan) were adopted to quantify chemical CQAs.Macrophage Migration Inhibitory Factor (MIF) was purchased from Zhongnong Boxin (Beijing) Technology Co., Ltd. The 30 batches of alcohol-precipitated intermediates, corresponding to the 30 batches of water-precipitated intermediates, the corresponding 30 batches of products, and the 30 batches of products for verification of Xiaoer Xiaoji Zhike oral liquid were provided by Lunan Pharmaceutical Group Co., Ltd. All of the samples were real-world materials and had been analyzed using QA/QC standards before delivery. Other materials and methods are specifically summarized in the ESI.†
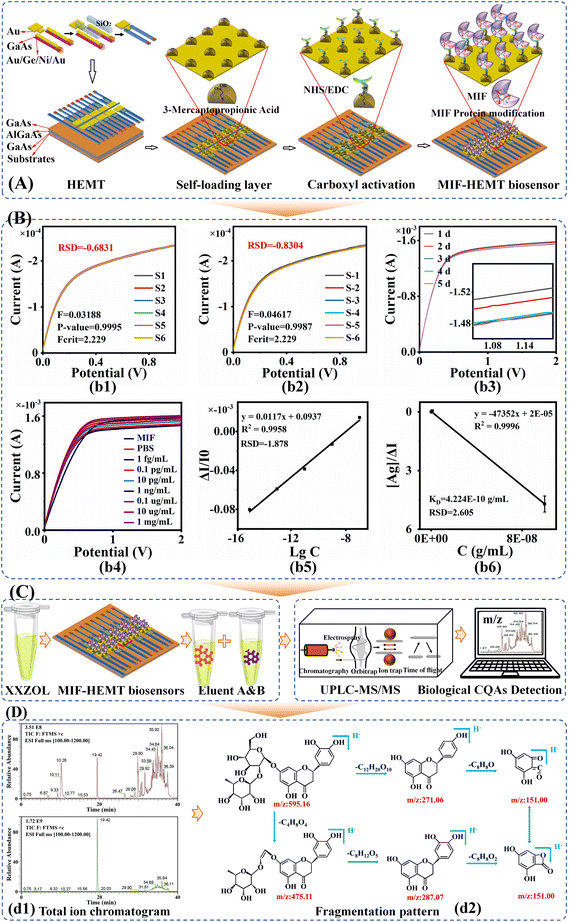
2.2 Biological CQA digitization and smart diagnosis using 30 batches of Xiaoer Xiaoji Zhike oral liquid by MIF-HEMT biosensor integrated UPLC-MS/MS
It is worth mentioning that MIF is a macrophage migration inhibitory factor protein. In previous studies, the biological CQAs obtained using a MIF-HEMT biosensor showed strong anti-inflammatory activity on zebrafish inflammation models.14 In addition, we also verified the reliability of MIF-HEMT using ISO-1, an agonist of MIF. We found a perfect linear fit between ISO-1 and MIF in the range from 1.0 fmol L−1 to 0.1 μmol L−1.
| [Ab] + [Ag] ↔ [Ab − Ag] | (1) |
 | (2) |
 | (3) |
Furthermore, the biological CQAs of Xiaoer Xiaoji Zhike oral liquid interacting with MIF were eluted with PBS as a non-specific eluent, and 5-O-methylvisamicin and amygdalin as a specific eluent. The former was used to wash out unconjugated components, and the latter was used to wash out components that bind to MIF targets. Solid phase extraction was used to remove the salt. Moreover, the components of Xiaoer Xiaoji Zhike oral liquid and the biological CQAs eluted by 5-O-methylvisamicin and amygdalin were analyzed using UPLC/MS-MS with a UPLC HSS T3 column (2.1 mm × 100 mm, 1.8 μm). The chromatographic and mass spectrometric conditions are summarized in Table S1.†
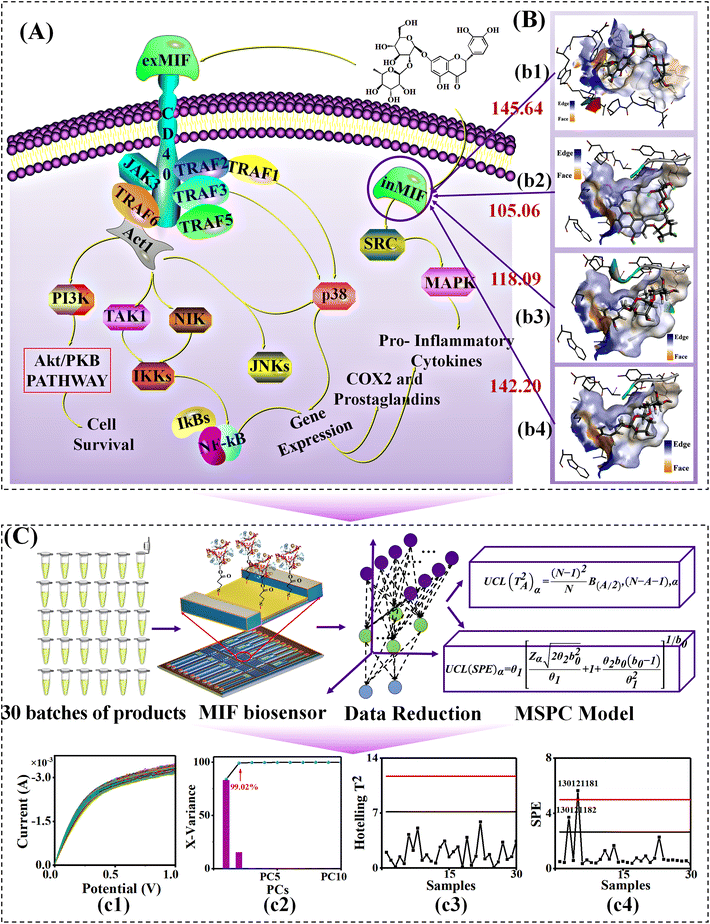
Multivariate statistical process control (MSPC) was introduced to diagnose the biological CQAs. Principal component analysis (PCA) was used for dimensionality reduction, and the first and second principal components, whose total interpretation rate reached 95%, were selected to establish the MSPC model. The specific information is in the ESI.†
2.3 Chemical CQA digitization and smart diagnosis using 30 batches of Xiaoer Xiaoji Zhike oral liquid from three pharmaceutical units
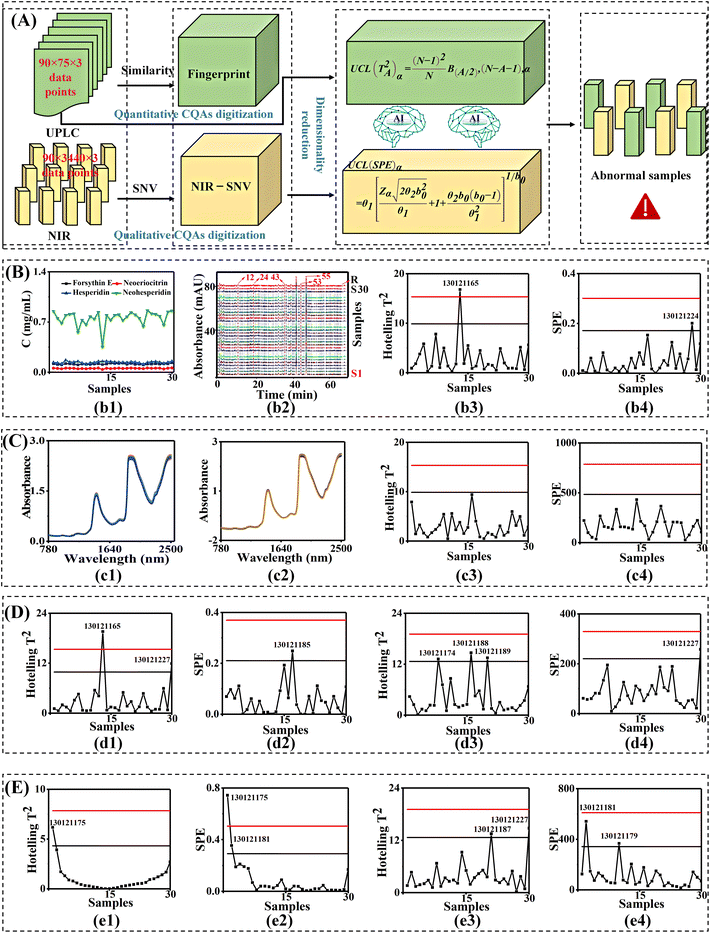
Finally, the fingerprints of 30 batches of Xiaoer Xiaoji Zhike oral liquid were established by the software Similarity Evaluation System for Chromatographic Fingerprint of Traditional Chinese Medicine. Taking the chromatogram of S1 as the reference, the average value was used to generate the reference fingerprint of 30 batches of Xiaoer Xiaoji Zhike oral liquid with 5-point calibration and full-spectrum peak matching. The 5-point calibration was performed using the no. 12 (10.7 min), no. 24 (18.3 min), no. 43 (33.2 min), no. 53 (42.3 min), and no. 55 (44.5 min) peaks. The specific information on method validation is provided in the ESI.†
2.4 Physical CQA digitization and smart diagnosis of 30 batches of Xiaoer Xiaoji Zhike oral liquid from three pharmaceutical units
2.5 Smart diagnosis of systematic CQAs of 30 batches of Xiaoer Xiaoji Zhike oral liquid by information fusion
Multi-information fusion covering biological, chemical, and physical CQAs can extract more complete information obtained by multiple sensors. Fusion weight was introduced according to the characteristics of inter-group samples and intra-group samples.22,31,32 The ratio of inter-group variance and intra-group variance of Xiaoer Xiaoji Zhike oral liquid was used as a distinguishing index. The MSPC model of each method was established, respectively. The quality consistency was discriminated according to the Hotelling T2 and squared prediction error (SPE) parameters. According to the 50% loose voting standard parameter, the result of Xiaoer Xiaoji Zhike oral liquid was obtained. The specific information and experimental procedures are provided in the ESI.†2.6 Mass transfer traceability of systematic CQAs of 30 batches of Xiaoer Xiaoji Zhike oral liquid by multivariate process capability integrated with fuzzy mathematics
Based on the above, the CRITIC method assigns multiple evaluation indicators under the aforementioned four categories as the weight of the control layer. The correlation coefficient matrix between various parameters was constructed by correlation analysis. Then, the contrast strength and conflict were used to calculate the weight coefficient, in which the contrast strength was represented by the standard deviation. Moreover, the index weight obtained by the AHP method was multiplied by the index weight value to calculate the comprehensive weight of each index. The specific information on comprehensive weight assignment is provided in the ESI.†
Finally, based on the results of fuzzy specification and comprehensive weight assignment, the fuzzy point estimation of three units in the production process of Xiaoer Xiaoji Zhike oral liquid was constructed.
2.7 Statistical analysis
SPSS (version 25.0, IBM, USA) software was used for statistical descriptive analysis; Origin Pro (version 2017, OriginLab, USA) software was used for correlation analysis of quality parameters of physical attributes; MATLAB R2019a software (Math Works, USA) was used to complete identification calculation and AHP-CRITIC. The unscrambler X 10.4 (Camo, Norway) was used to complete the software for PCA. The fingerprints were analyzed in the “Chinese Medicine Chromatographic Fingerprint Similarity Evaluation System (version 2012.130723)” provided by the Chinese Pharmacopoeia Commission.3. Results and discussion
3.1 Biological CQA digitization and smart diagnosis of 30 batches of Xiaoer Xiaoji Zhike oral liquid by MIF-HEMT biosensor integrated UPLC-MS/MS
Furthermore, Fig. 1C shows the identification of the biological CQAs in Xiaoer Xiaoji Zhike oral liquid achieved by integrating the MIF-HEMT biosensor and UPLC-MS/MS. Specifically, non-specific eluent (PBS) and specific eluent (5-O-methylvisamicin and amygdalin) were used to elute the biological CQAs of Xiaoer Xiaoji Zhike oral liquid, respectively. The total ion flow diagram of the original solution of Xiaoer Xiaoji Zhike oral liquid and two specific eluents in the positive and negative modes is shown in Fig. 1D(d1).
Finally, a total of 92 chemical components were discovered (Table S4†). 10 biological CQAs were identified and are summarized in Fig. 1D(d2) and Table S4,† including rutin, forsythin E, neoeriocitrin, eriocitrin, hesperidin, neohesperidin, Lycium glycoside, vitexin glucoside, honeysuckle glycoside, and kaempferol-3-O-rutoside. Simultaneously, all of them were identified by the comparison method of standard products to assure the method's robustness. The specific cracking principle is summarized in the ESI.† This meant that the MIF-HEMT biosensor achieved the discovery of 10 biological CQAs from 92 variation sources. 10 biological CQAs played a major role in affecting the effectiveness and safety of Xiaoer Xiaoji Zhike oral liquid. Besides, it also greatly improved the detection efficiency in complex quality attributes. It is worth noting that biological CQAs related to anti-inflammatory and antitussive efficacy were identified in the complex system.
To sum up, the MIF was a critical potential target related to anti-inflammatory treatment and cough relief. The successful construction of the MIF-HEMT biosensor laid an excellent foundation for identifying biological CQAs in ETE-SDF associated with anti-inflammatory treatment and cough relief because of its high sensitivity and strong specificity.
In the first step of ETE-SDF, biosensor technology and information technology were innovatively introduced to evaluate the consistency of biological CQAs in 30 batches of samples. The HEMT biosensor was applied to the manufacturing process so that an efficacy-oriented quality control system was developed.
3.2 Chemical CQA digitization and smart diagnosis of 30 batches of Xiaoer Xiaoji Zhike oral liquid from three pharmaceutical units
Fig. 3 shows the results of MSPC in three manufacturing units. Obviously, there were two batches of products, no. 130121224 and no. 130121165, that exceeded the 95% risk control limit (Fig. 3(b3) and (b4)). Note, no. 130121165 also exceeded the 95% risk control limit in the alcohol-precipitation unit (Fig. 3(d1) and (d2)). In contrast, only one batch exceeded the 99% risk control limit in the water-deposition unit (Fig. 3(e1) and (e2)). This implied that the consistency of quantitative chemical CQAs should be improved from intermediate to finished product.
To sum up, from the identification of 10 biological CQAs to the analysis of four chemical CQAs, the connection between biological and chemical CQAs was achieved. Simultaneously, the quality consistency correlation with the efficacy of Xiaoer Xiaoji Zhike oral liquid was completed. The MSPC results of the three manufacturing units showed that the number of differential samples gradually decreased.
Especially, batch no. 130121227 exceeded the risk control limit of 99% in both alcohol precipitation and water precipitation units, while there was no difference in the final products. This suggested that fluctuations from chemical CQAs by NIR spectroscopy were eliminated by the next manufacturing process. In addition, some differential batches in the alcohol-precipitation unit showed no differences in the next water-precipitation unit. Simultaneously, new differential batches emerged again, indicating that there were still existing critical parameters that need to be optimized by information fusion in both units.
In this part of ETE-SDF, as illustrated in Fig. 3A, the 318![[thin space (1/6-em)]](https://www.rsc.org/images/entities/char_2009.gif) 400 data points of chemical CQAs were analyzed by MSPC. These results provided important data support for the following information fusion and quality traceability to achieve continuous improvement.
400 data points of chemical CQAs were analyzed by MSPC. These results provided important data support for the following information fusion and quality traceability to achieve continuous improvement.
3.3 Physical CQA digitization and smart diagnosis of 30 batches of Xiaoer Xiaoji Zhike oral liquid from three pharmaceutical units
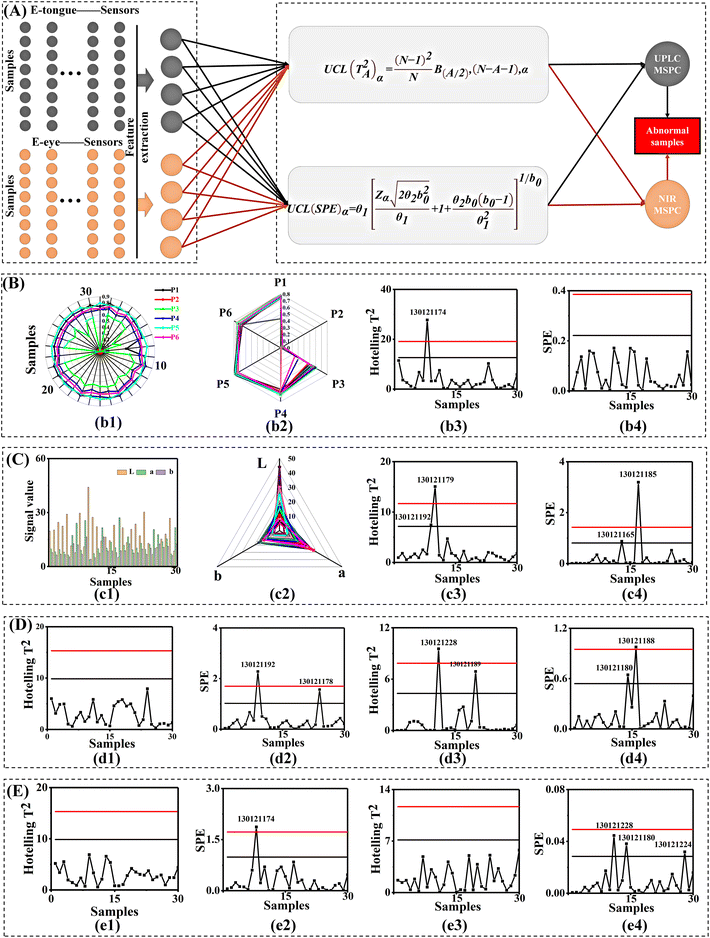
In summary, the electronic tongue was introduced for taste characterization of 30 batches of Xiaoer Xiaoji Zhike oral liquid. A physical data basis in ETE-SDF based on taste quality attributes was constructed.
To sum up, the biological, physical, and chemical CQAs of Xiaoer Xiaoji Zhike oral liquid were digitized and diagnosed by an AI diagnosis strategy. The first step of ETE-SDF was completed. The critical variation sources were successfully identified in the numerous quality elements. Ultimately, 18![[thin space (1/6-em)]](https://www.rsc.org/images/entities/char_2009.gif) 000 data points of biological CQAs, 318
000 data points of biological CQAs, 318![[thin space (1/6-em)]](https://www.rsc.org/images/entities/char_2009.gif) 400 data points of chemical CQAs, and 900 data points of physical CQAs formed the data basis in ETE-SDF. As different fluctuation sources, each CQA affected the consistency of products. However, the results showed that the responses obtained by various sensors were inconsistent. This suggested that a single sensor had limitations in illuminating the quality consistency of batches. The above results called for a smart fusion to ensemble multi-information in ETE-SDF.
400 data points of chemical CQAs, and 900 data points of physical CQAs formed the data basis in ETE-SDF. As different fluctuation sources, each CQA affected the consistency of products. However, the results showed that the responses obtained by various sensors were inconsistent. This suggested that a single sensor had limitations in illuminating the quality consistency of batches. The above results called for a smart fusion to ensemble multi-information in ETE-SDF.
3.4 Smart diagnosis of systematic CQAs covering biological, chemical, and physical CQAs for 30 batches of Xiaoer Xiaoji Zhike oral liquid by information fusion
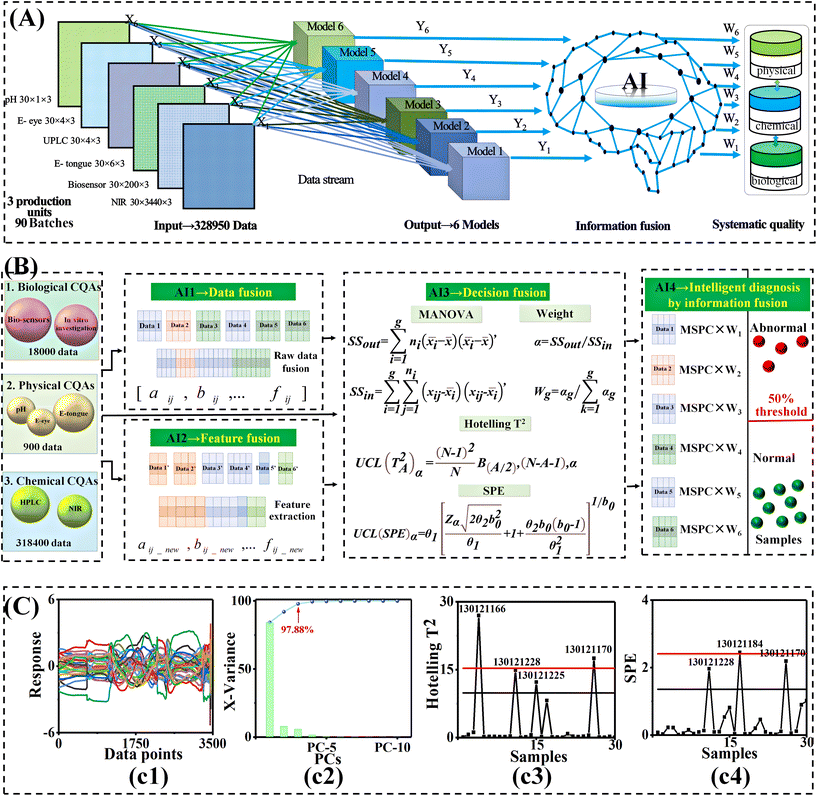
It can be seen from Fig. 5A that for 30 batches of Xiaoer Xiaoji Zhike oral liquid, the biological CQAs identified by the biosensor consisted of a 30 × 200 matrix of 200 variables. CQA quantification by UPLC led to a 30 × 4 matrix of four variables. CQA semi-quantification by NIR led to a 30 × 3440 matrix of 3440 variables. The taste was characterized by an electronic tongue consisted of a 30 × 6 matrix of six variables. The chromaticity was measured by an electronic eye led to a 30 × 4 matrix of four variables. The pH was measured by a pH meter formed a 30 × 1 matrix of variables. First, a feature-level fusion strategy was implemented and this provided a 30 × 20 matrix via feature extraction of 328![[thin space (1/6-em)]](https://www.rsc.org/images/entities/char_2009.gif) 950 data points from six sensor data points (Fig. 5(c1)).
950 data points from six sensor data points (Fig. 5(c1)).
Then, MSPC smart diagnosis was performed. When MSPC had a 97.88% cumulative principal component contribution rate (Fig. 5(c2)), it was obvious that there were five differential batches in the finished product (Fig. 5(c3) and (c4)), and there were six differential batches in the alcohol-precipitation unit and four differential batches in the water-precipitation unit, respectively (Table S8†).
Subsequently, given the various weights of multiple sensors, a voting decision fusion was developed (Fig. 5B). Finally, there was no sample exceeding the 50% threshold in the products. This implied that there was no abnormal batch in the products. Besides, two batches in the alcohol-precipitation intermediates, no. 130121188 and no. 130121189, were identified as abnormal samples. Similarly, one batch of water-sedimentation intermediate, no. 130121188, was identified as an abnormal sample (Table S8†). Based on the number of abnormal batches, the diagnostic accuracy of abnormal samples was significantly improved from 61% to 93.3%.
Furthermore, Fig. S1 and Table S9† present the results of an additional 30 batches of products used to validate the reliability of the voting decision fusion. It was found that the results of each sensor diagnosis were also inconsistent. Finally, the 30 batches of samples identified by the voting decision information fusion had good consistency. There was no abnormal batch based on more than 50% weight voting in the 30 batches of samples. The results were consistent with the pharmaceutical QA and QC results. In this part, the voting decision fusion strategy with appropriate weights improved the diagnostic accuracy of abnormal samples. It overcame the aforementioned obstruction of the blind area of a single sensor.
On the whole, ETE-SDF implemented overall variation sources containing 328![[thin space (1/6-em)]](https://www.rsc.org/images/entities/char_2009.gif) 950 data points. Furthermore, an original voting decision-fusion strategy was developed so that the aforementioned big data flow could be mapped by six AI diagnosis models. Then, the data flow was amalgamated into systematic CQAs for smart diagnosis.
950 data points. Furthermore, an original voting decision-fusion strategy was developed so that the aforementioned big data flow could be mapped by six AI diagnosis models. Then, the data flow was amalgamated into systematic CQAs for smart diagnosis.
This demonstrated the fusion of biosensor data and that of other signal sensors. Besides, it solved the problem of different quality evaluation results caused by heterogeneous data. It could not only expand the recognition range of multiple sensors and enhance the credibility of data but also enhance the resolution of the system. The information fusion of three production process units solved the problem of information cross management in the production process. Moreover, it realized the exploration of the interactive coupling mechanism of multivariable critical variation sources in end-to-end complex processes.
3.5 End-to-end systematic CQA traceability of 30 batches by multivariate process capability integrated with fuzzy mathematics
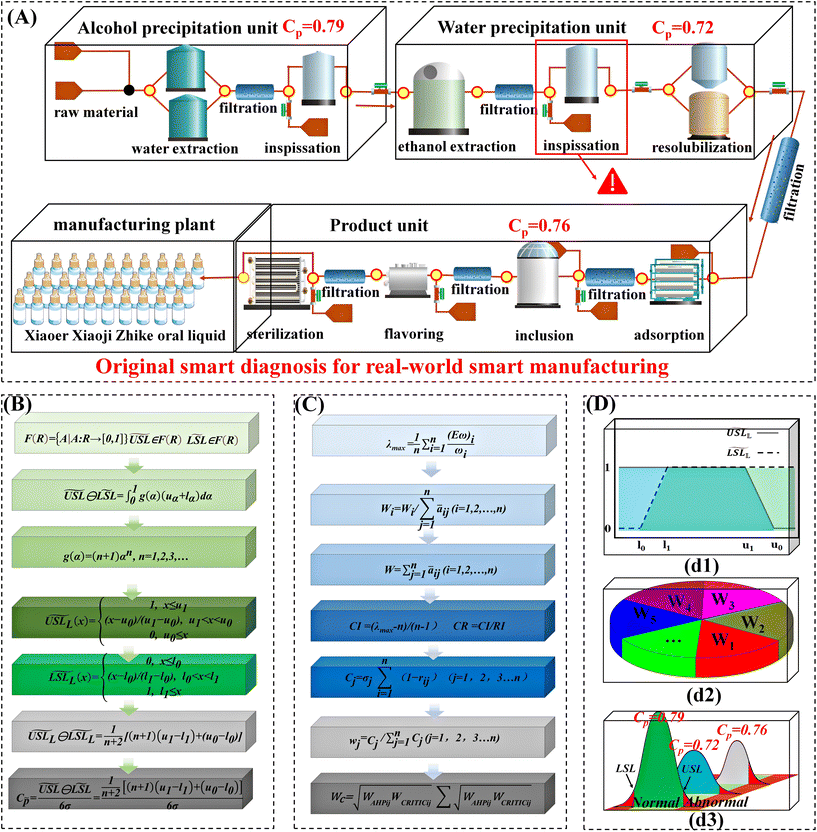
The smart diagnosis results of the above three manufacturing units showed that the number of differential samples gradually decreased. Therefore, one could speculate that the systematic CQAs had certain rules in the transmission from intermediate to product. Herein, an end-to-end quality traceability strategy was investigated. A multivariate Cp was developed based on AHP-CRITIC and fuzzy mathematics integration (Fig. 6B, C, (d1), and (d2)). The weights of each index are shown in Tables S10 and S11.† The Cp of the three manufacturing units was calculated, as shown in Fig. 6A and (d3). According to the fuzzy point estimate, the Cp of the alcohol-precipitation intermediate was 0.79, that of the water-precipitation intermediate was 0.72, and that of the product was 0.76.This demonstrated that the quality standard grade of Xiaoer Xiaoji Zhike oral liquid was grade III and at the level of 2–3 Sigma. It is worth noting that the Cp decreased from 0.79 to 0.72 from the alcohol precipitation unit to the water precipitation unit, indicating that the consistency of the samples was changed after the inspissation (Fig. 6A). Simultaneously, there existed a certain leveling effect from water precipitation to product. Here, the process capacity increased from 0.72 to 0.76. The above results proved that the inspissation process was the critical process affecting the quality of Xiaoer Xiaoji Zhike oral liquid, which needs more attention in future manufacturing.
As for the inspissation process, the double effect thickener with a volume of 4000 liters was used, which adopted the double heating mode. The only parameter used to control the inspissation process was temperature, and it was varied to match the steam pressure and vacuum pressure. As a result, inspissation temperature was the first process parameter that needed to be optimized to improve overall product quality.
Finally, an end-to-end multivariate Cp for the quality level was evaluated. It successfully provided feedback on the critical variation source and put forward improvement measures. Triumphantly, it completed the final ETE-SDF.
4. Conclusion
In this study, a novel ETE-SDF was developed and applied to the phytomedicine Xiaoer Xiaoji Zhike oral liquid. Firstly, the MIF-HEMT biosensor was developed and applied in production process control. Then, this framework implemented overall variation sources containing 328![[thin space (1/6-em)]](https://www.rsc.org/images/entities/char_2009.gif) 950 data points. The critical variation sources were successfully identified in the numerous quality elements. Secondly, systematic CQAs were identified by a multi-information fusion coupled with AI diagnosis strategy. The interactive coupling mechanism of multivariate critical variation sources in end-to-end complex processes was explored. It is worth mentioning that the diagnostic accuracy of abnormal samples increased from 61% to 93.3%. Finally, an original end-to-end quality traceability pathway was developed based on Cp evaluation in ETE-SDF. The result showed that inspissation was a critical process and called for more focus. The inspissation temperature emerged as one of the most critical parameters, whose optimization could result in improving overall product quality. What's more, the pathway solved the problems of unclear specifications of CQAs and multivariate CQA weight assignment and achieved the vertical, horizontal, and end-to-end digital integration of the production process.
950 data points. The critical variation sources were successfully identified in the numerous quality elements. Secondly, systematic CQAs were identified by a multi-information fusion coupled with AI diagnosis strategy. The interactive coupling mechanism of multivariate critical variation sources in end-to-end complex processes was explored. It is worth mentioning that the diagnostic accuracy of abnormal samples increased from 61% to 93.3%. Finally, an original end-to-end quality traceability pathway was developed based on Cp evaluation in ETE-SDF. The result showed that inspissation was a critical process and called for more focus. The inspissation temperature emerged as one of the most critical parameters, whose optimization could result in improving overall product quality. What's more, the pathway solved the problems of unclear specifications of CQAs and multivariate CQA weight assignment and achieved the vertical, horizontal, and end-to-end digital integration of the production process.
Outstandingly, a management model was formed by this ETE-SDF for phytomedicine manufacturing with efficacy as the guidance, manufacturing method as the main axis, and process control as the focus. This provided a superior quality management paradigm combining a downstream corrective mode and upstream active mode for quality control. Compared with the current supervision phenomenon that took post-inspection as the main means, the accuracy of the control strategy was significantly improved by ETE-SDF.
In addition, due to the correlation with efficacy and the continuous in-depth feedback improvement of process understanding, the process was continuously improved to high-quality products, and the production of waste could also be continuously reduced. This highlighted the positive impact of such a paradigm developed by us on cost, reliability, safety, and sustainability required by the pharmaceutical manufacturing industry.
All of these results show that ETE-SDF has paved the way for phytomedicine manufacturing to meet FDA standards. Simultaneously, this framework could be extended to other pharmaceutical systems, such as exosomes isolated from stem cells, because they also contain different constituents and are not well evaluated regarding FDA standards.37,38 It can also be extended to the manufacturing mode management of tablets, capsules, and other dosage forms because they all have many CQAs and multiple units.
Abbreviations
| ETE-SDF | End-to-end smart diagnosis framework |
| CQAs | Critical quality attributes |
| HEMT | High electron mobility transistor |
| FDA | The U.S. Food and Drug Administration |
| R & D | Research and development |
| UPLC-MS/MS | Ultra-performance liquid chromatography with electrospray tandem mass spectrometry |
| AI | Artificial intelligence |
| MIF | Macrophage Migration Inhibitory Factor |
| PBS | Polarization beam splitter |
| EDC | 1-(3-Dimethylaminopropyl)-3-ethylcarbodiimide hydrochloride |
| NHS | N-Hydroxysuccinimide |
| I DS − VDS | Drain–source current |
| 3-MPA | 3-Mercaptopropionic acid |
| K D | Dissociation constant |
| ESI | Electrospray ion source |
| PDB | Protein data bank |
| RMSD | Root mean square deviation |
| MSPC | Multivariate statistical process control |
| PCA | Principal component analysis |
| NIR | Near-infrared |
| SPE | Squared prediction error |
| C p | Process capability index |
| AHP | Analytic hierarchy process |
| CRITIC | Criteria Importance Through Intercriteria Correlation |
| RSD | Relative standard deviation |
| NF-κB | Nuclear factor kappa-B |
| MAPK | Mitogen-activated protein kinase |
| SNV | Standard normal variate |
Author contributions
Chaofu Ma: experiment, data curation, formal analysis, software, writing-original draft, writing-review & editing, AI diagnosis strategy. Lijuan Ma: experiment, data curation, software, writing-review & editing, validation. Zijian Wang: experiment. Nan Li: writing revised draft. Mingshuang Li: experiment. Jing Wang: writing-original draft. Xiaomeng Wang: writing-original draft. Xiao Song: experiment. Hao Yan: experiment. Yanyu Han: validation. Yongxia Guan: experiment guidance. Jingchun Yao: formal analysis. Guimin Zhang: supervision. Zhisheng Wu: conceptualization, funding acquisition, project administration, supervision.Conflicts of interest
The authors declare no competing interests.Acknowledgements
This work was co-supported by the National Key Research and Development Program of China (No. 2022YFC3501902, China), the National Outstanding Youth Science Fund Project of National Natural Science Foundation of China (Grant No. 82022073, China), the Special Project for Research and Development in Key areas of Guangdong Province (Grant No. 2020B1111120002), the National Natural Science Foundation of China (No. 82274110, China), and the Fundamental Research Funds for the Central Universities (No. 2022-JYB-JBZR-019, China).References
- D. C. Swinney and J. Anthony, Nat. Rev. Drug Discovery, 2011, 10, 507–519 CrossRef CAS PubMed.
- C. Harrison, Nat. Rev. Drug Discovery, 2011, 10, 12–13 CrossRef CAS PubMed.
- L. DeFrancesco, Nat. Biotechnol., 2022, 40, 149–150 CrossRef CAS PubMed.
- T. Y. Zhang, Chem. Rev., 2006, 106, 2583–2595 CrossRef CAS PubMed.
- B. Nagy, B. Szilagyi, A. Domokos, B. Veszi, K. Tacsi, Z. Rapi, H. Pataki, G. Marosi, Z. K. Nagy and Z. K. Nagy, Chem. Eng. J., 2021, 419 DOI:10.1016/j.cej.2021.129947.
- H. J. Federsel, Acc. Chem. Res., 2009, 42, 671–680 CrossRef CAS PubMed.
- A. Adamo, R. L. Beingessner, M. Behnam, J. Chen, T. F. Jamison, K. F. Jensen, J. C. M. Monbaliu, A. S. Myerson, E. M. Revalor, D. R. Snead, T. Stelzer, N. Weeranoppanant, S. Y. Wong and P. Zhang, Science, 2016, 352, 61–67 CrossRef CAS PubMed.
- S. Mascia, P. L. Heider, H. T. Zhang, R. Lakerveld, B. Benyahia, P. I. Barton, R. D. Braatz, C. L. Cooney, J. M. B. Evans, T. F. Jamison, K. F. Jensen, A. S. Myerson and B. L. Trout, Angew. Chem., Int. Ed., 2013, 52, 12359–12363 CrossRef CAS PubMed.
- S. Ekins, A. C. Puhl, K. M. Zorn, T. R. Lane, D. P. Russo, J. J. Klein, A. J. Hickey and A. M. Clark, Nat. Mater., 2019, 18, 435–441 CrossRef CAS PubMed.
- L. X. Yu, G. Amidon, M. A. Khan, S. W. Hoag, J. Polli, G. K. Raju and J. Woodcock, AAPS J., 2014, 16, 771–783 CrossRef CAS PubMed.
- B. S. Miller, L. Bezinge, H. D. Gliddon, D. Huang, G. Dold, E. R. Gray, J. Heaney, P. J. Dobson, E. Nastouli, J. J. L. Morton and R. A. McKendry, Nature, 2020, 587 DOI:10.1038/s41586-020-2917-1.
- I. Sarangadharan, A. Regmi, Y. W. Chen, C. P. Hsu, P. C. Chen, W. H. Chang, G. Y. Lee, J. I. Chyi, S. C. Shiesh, G. B. Lee and Y. L. Wang, Biosens. Bioelectron., 2018, 100, 282–289 CrossRef CAS PubMed.
- L. D. Chen, D. Y. Lv, X. F. Chen, M. D. Liu, D. Y. Wang, Y. Liu, Z. Y. Hong, Z. Y. Zhu, X. X. Hu, Y. Cao, J. M. Yang and Y. F. Chai, Anal. Chem., 2018, 90, 8936–8945 CrossRef CAS PubMed.
- L. J. Ma, Y. F. Zheng, J. Wang, Q. Q. Li, J. Q. Zeng, Z. J. Wang, T. J. Hou, Y. Zhang, M. S. Li, R. M. Shen, X. M. Chen, J. B. Qin, L. T. Lei, Q. Xia, Q. Wang, Y. J. Qiao and Z. S. Wu, Biosens. Bioelectron., 2021, 194 DOI:10.1016/j.bios.2021.113608.
- S. Yin and O. Kaynak, Proc. IEEE, 2015, 103, 143–146 Search PubMed.
- F. Tao and M. Zhang, IEEE Access, 2017, 5, 20418–20427 Search PubMed.
- A. Kusiak, Nature, 2017, 544, 23–25 CrossRef CAS PubMed.
- F. Tao, J. F. Cheng, Q. L. Qi, M. Zhang, H. Zhang and F. Y. Sui, Int. J. Adv. Des. Manuf. Technol., 2018, 94, 3563–3576 CrossRef.
- B. Khaleghi, A. Khamis, F. O. Karray and S. N. Razavi, Inf. Fusion, 2013, 14, 562–562 CrossRef.
- G. J. Odom, K. B. Newhart, T. Y. Cath and A. S. Hering, Appl. Stoch. Model Bus., 2018, 34, 880–892 CrossRef.
- S. Momtazmanesh, A. Nowroozi and N. Rezaei, Rheumatol. Ther., 2022, 1–56 Search PubMed.
- R. Rios-Reina, S. M. Azcarate, J. M. Camina and H. C. Goicoechea, Anal. Chim. Acta, 2020, 1126, 52–62 CrossRef CAS PubMed.
- R. R. de Oliveira, C. Avila, R. Bourne, F. Muller and A. de Juan, Anal. Bioanal. Chem., 2020, 412, 2151–2163 CrossRef CAS PubMed.
- S. Demmon, S. Bhargava, D. Ciolek, J. Halley, N. Jaya, M. K. Joubert, E. Koepf, P. Smith, M. Trexler-Schmidt and P. Tsai, Biologicals, 2020, 67, 9–20 CrossRef PubMed.
- K. Meyer, S. Kern, N. Zientek, G. Guthausen and M. Maiwald, TrAC, Trends Anal. Chem., 2016, 83, 39–52 CrossRef CAS.
- M. Movsisyan, E. I. P. Delbeke, J. K. E. T. Berton, C. Battilocchio, S. V. Ley and C. V. Stevens, Chem. Soc. Rev., 2016, 45, 4892–4928 RSC.
- Y. H. Choi, G. Y. Na and J. Yang, Comput. Ind., 2020, 123 DOI:10.1016/j.compind.2020.103296.
- K. S. Chen, Y. L. Lai, M. C. Huang and T. C. Chang, Int. J. Prod. Res., 2022, 1–15 Search PubMed.
- K. S. R. Warner and M. Wager, Long Range Plann., 2019, 52, 326–349 CrossRef.
- G. M. Zhang, Z. Y. Huang, R. Sun, S. L. Ye and Q. Feng, Evid. Based Complement. Alternat. Med., 2020, 2020 DOI:10.1155/2020/9740841.
- S. G. He, Z. He and G. A. Wang, J. Intell. Manuf., 2013, 24, 25–34 CrossRef.
- J. M. Gutierrez, Z. Haddi, A. Amari, B. Bouchikhi, A. Mimendia, X. Ceto and M. del Valle, Sens. Actuators, B, 2013, 177, 989–996 CrossRef CAS.
- A. Parchami, M. Mashinchi and A. Sharayei, Prod. Plan. Control., 2010, 21, 250–257 CrossRef.
- Y. Li, M. L. Wei, L. Liu, B. W. Yu, Z. W. Dong and Q. Xue, Chemosphere, 2021, 271 DOI:10.1016/j.chemosphere.2021.129571.
- C. Swain, M. N. Sahoo, A. Satpathy, K. Muhammad, S. Bakshi, J. J. P. C. Rodrigues and V. H. C. de Albuquerque, IEEE Internet Things J., 2021, 8, 12705–12715 Search PubMed.
- A. Ishizaka, C. Pearman and P. Nemery, Int. J. Prod. Res., 2012, 50, 4767–4784 CrossRef.
- M. M. Zhai, Y. Zhu, M. Y. Yang and C. B. Mao, Adv. Sci., 2020, 7 DOI:10.1002/advs.202001334.
- M. Gunasekaran, R. Mishra, P. Saha, D. Morales, W. C. Cheng, A. R. Jayaraman, J. R. Hoffman, L. Davidson, L. Chen, A. M. Shah, G. Bittle, X. B. Fu, A. Tulshyan, M. Abdullah, T. Kingsbury, C. Civin, P. X. Yang, M. E. Davis, R. Bolli, J. M. Hare, S. Sharma and S. Kaushal, iScience, 2022, 25 DOI:10.1016/j.isci.2022.104656.
Footnotes |
| † Electronic supplementary information (ESI) available. See DOI: https://doi.org/10.1039/d2gc03835h |
| ‡ The authors contributed equally to this work. |
| This journal is © The Royal Society of Chemistry 2023 |

