 Open Access Article
The role of the gold–platinum interface in AuPt/TiO2-catalyzed plasmon-induced reduction of CO2 with water†
Leila
Hammoud
a,
Claire
Strebler
a,
Joumana
Toufaily
 b,
Tayssir
Hamieh
 bc,
Valérie
Keller
 a and
Valérie
Caps
 *a
*a
aICPEES (CNRS UMR 7515/Université de Strasbourg), 25 rue Becquerel, 67087 Strasbourg, Cedex 02, France. E-mail: caps@unistra.fr
bLaboratory of Materials, Catalysis, Environment and Analytical Methods Laboratory (MCEMA), Faculty of Sciences, Lebanese University, Rafic Hariri Campus, Hadath, Lebanon
cFaculty of Science and Engineering, Maastricht University, 6200 MD, Maastrich, P.O. Box 616, The Netherlands
First published on 8th July 2022
Abstract
Bimetallic gold–platinum nanoparticles have been widely studied in the fields of nanoalloys, catalysis and plasmonics. Many preparation methods can lead to the formation of these bimetallic nanoparticles (NPs), and the structure and related properties of the nanoalloy often depend on the preparation method used. Here we investigate the ability of thermal dimethylformamide (DMF) reduction to prepare bimetallic gold–platinum sub-nm clusters supported on titania. We find that deposition of Pt preferentially occurs on gold. Formation of sub-nm clusters (vs. NPs) appears to be dependent on the metal concentration used: clusters can be obtained for metal loadings up to 4 wt% but 7–8 nm NPs are formed for metal loadings above 8 wt%, as shown using high resolution transmission electron microscopy (HRTEM). X-ray photoelectron spectroscopy (XPS) shows electron-rich Au and Pt components in a pure metallic form and significant platinum enrichment of the surface, which increases with increasing Pt/Au ratio and suggests the presence of Au@Pt core–shell type structures. By contrast, titania-supported bimetallic particles (typically >7 nm) obtained by sodium borohydride (NaBH4) reduction in DMF, contain Au/Pt Janus-type objects in addition to oxidized forms of Pt as evidenced by HRTEM, which is in agreement with the lower Pt surface enrichment found by XPS. Both types of supported nanostructures contain a gold–platinum interface, as shown by the chemical interface damping, i.e. gold plasmon damping by Pt, found using UV-visible spectroscopy. Evaluation of the materials for plasmon-induced continuous flow CO2 reduction with water, shows that: (1) subnanometer metallic clusters are not suitable for CO2 reduction with water, producing hydrogen from the competing water reduction instead, thereby highlighting the plasmonic nature of the reaction; (2) the highest methane production rates are obtained for the highest Pt enrichments of the surface, i.e. the core–shell-like structures achieved by the thermal DMF reduction method; (3) selectivity towards CO2 reduction vs. the competing water reduction is enhanced by loading of the plasmonic NPs, i.e. coverage of the titania semi-conductor by plasmonic NPs. Full selectivity is achieved for loadings above 6 wt%, regardless of the NPs composition and alloy structure.
Introduction
Nanoalloys and bimetallic nanoparticles have been widely studied because their size restriction and high surface to volume ratio may lead to unique properties that differ from that of bulk alloys.1–3 Besides, they may exhibit improved performance in comparison to their monometallic counterparts. In particular, bimetallic gold–platinum nanoparticles (NPs) have attracted a lot of interest in the fields of catalysis,4,5 electrocatalysis,6–14 sensors,15–17 and more recently in the field of photocatalysis18–20 and plasmonics.21–23 Amongst the improved properties that lead to improved performances, one can cite improved CO tolerance that leads to more stable oxidation (electro)catalysts, electron transfers between Au and Pt which leads to more active catalysts. These properties mostly depend on the structure of the nanoalloy, and in particular on whether Pt and Au atoms are homogeneously mixed within the NP (solid solution) or Pt and Au phases are segregated in core–shell or raspberry-type structures. Both types of structure can be synthesized at the nanoscale. Nanostructures are controlled by the method and conditions used during their synthesis, and can be finely tuned.19,24A large number of the methods developed to produce AuPt nanoalloys are based on the reduction of solubilized metal salts. In these methods, size and structure of the resulting bimetallic NPs are determined by the kinetics of nucleation vs. growth for each metal, thus by the reduction kinetics, which depend on the reducing agent, solvent, temperature and possible presence of surfactant to enhance size control. The most common reductants include sodium borohydride,25–30 sodium citrate,31 ascorbic acid,32,33 hydrogen, hydroxylamine,34 ethanol.
In 2008–2010, size-controlled monometallic gold clusters, i.e. sub-nanometer Au NPs, were synthesized by heating up a dimethylformamide (DMF) solution of a gold salt to 140 °C, in the absence of any additional reducing or stabilizing agent.35,36 It was shown that at this temperature, this common organic solvent could be used as both reductant and stabilizer to produce monometallic gold clusters. This protocol was later applied to the synthesis of surfactant-free, DMF-stabilized platinum,37 palladium,38 copper![[thin space (1/6-em)]](https://www.rsc.org/images/entities/char_2009.gif) 39 and iridium
39 and iridium![[thin space (1/6-em)]](https://www.rsc.org/images/entities/char_2009.gif) 40 clusters. The main characteristics and advantages of this method are the subnanometer size control achieved and the high purity of the colloidal solution produced (DMF-stabilized metal NPs).41 These colloidal solutions can thus straight-forwardly be used as catalysts for a variety of key organic reactions, without the need for any purification step or immobilization of the colloids. To the best of our knowledge, immobilization of these colloids on inorganic powders has never been investigated before.
40 clusters. The main characteristics and advantages of this method are the subnanometer size control achieved and the high purity of the colloidal solution produced (DMF-stabilized metal NPs).41 These colloidal solutions can thus straight-forwardly be used as catalysts for a variety of key organic reactions, without the need for any purification step or immobilization of the colloids. To the best of our knowledge, immobilization of these colloids on inorganic powders has never been investigated before.
Here we investigate the ability of this method to produce supported clusters in one pot, by performing the thermal DMF reduction of metal salts in the presence of titania powder. We focus on the synthesis of titania-supported Au, Pt and Au–Pt clusters and on the plasmon-induced catalytic properties of the resulting materials for the continuous gas phase photoreduction of CO2 with water (eqn (1), (2a), (2b)).42–44
| 4H2O + 8h+ → 2O2 + 8H+ | (1) |
| CO2 + 8H+ + 8e− → CH4 + 2H2O | (2a) |
| 2H+ + 2e− → H2 | (2b) |
We have recently shown that Au/TiO2 shows some activity for this reaction under visible light (λ > 420 nm), i.e. under plasmonic excitation of the localized surface plasmon resonance (LSPR) of Au NPs.28 The activity was however about 2 orders of magnitude lower than that observed under solar irradiation, i.e. upon additional activation of the semi-conductor (SC) support (titania). We here show that the titania-supported Au–Pt alloys obtained by thermal DMF reduction improves plasmon-induced CH4 production rates by one order of magnitude. By comparing with titania-supported Au, Pt and Au–Pt NPs produced by NaBH4 reduction of gold and platinum salts in DMF, we further uncover interesting effects of size, loading and composition of the bi-metallic NPs in plasmon-induced CO2-to-CH4 photoreduction with water.
Results and discussion
Bimetallic catalysts prepared by thermal DMF reduction
| Metal deposition | Catalytic performancesa | ||||||||||
|---|---|---|---|---|---|---|---|---|---|---|---|
| Au | Pt | Total M loading (wt%) | Pt/Au | r CH4 | r H2 | Selectivity (%) | |||||
| Loading (wt%) | Target (wt%) | Deposition yield (%) | Loading (wt%) | Target (wt%) | Deposition yield (%) | Molar ratio | (μmol h−1 g−1) | (μmol h−1 g−1) | |||
| a Averaged over 5 h of reaction under illumination (λ > 400 nm). | |||||||||||
| DMF/140 °C | |||||||||||
| Au5/TiO2 | 4.05 | 5 | 81 | 0 | 0 | — | 4.05 | 0.00 | 0 | 4 | 0 |
| Au2.5Pt2.5/TiO2 | 1.9 | 2.5 | 77 | 0.4 | 2.5 | 17 | 2.3 | 0.22 | 1.5 | 18.2 | 25 |
| Au5Pt5/TiO2 | 4.2 | 5 | 84 | 4.1 | 5 | 82 | 8.3 | 0.98 | 5.5 | 0 | 100 |
| Au7.5Pt7.5/TiO2 | 3.8 | 7.5 | 51 | 4.6 | 7.5 | 61 | 8.4 | 1.22 | 7.8 | 0 | 100 |
| Pt5/TiO2 | 0 | 0 | — | 0.3 | 5 | 6 | 0.3 | — | 0.2 | 0 | 100 |
![[thin space (1/6-em)]](https://www.rsc.org/images/entities/char_2009.gif) |
|||||||||||
| DMF/NaBH 4 | |||||||||||
| Au35/TiO2 | 33.4 | 35 | 95 | 0.0 | 0 | — | 33.4 | 0.00 | 0.1 | 0 | 100 |
| Au34Pt1/TiO2 | 34 | 34 | 100 | 1.0 | 1 | 100 | 35.0 | 0.03 | 1.5 | 0 | 100 |
| Au30Pt5/TiO2 | 30 | 30 | 100 | 2.7 | 5 | 54 | 32.7 | 0.09 | 2.8 | 0 | 100 |
| Au17.5Pt17.5/TiO2 | 17.5 | 17.5 | 100 | 2.4 | 17.5 | 13 | 19.9 | 0.14 | 4.7 | 0 | 100 |
| Au3.5Pt3.5/TiO2 | 2.8 | 3.5 | 80 | 0.4 | 3.5 | 10 | 3.2 | 0.13 | 0.7 | 0.1 | 97 |
| Au5Pt30/TiO2 | 5 | 5 | 100 | 1.3 | 30 | 4 | 6.3 | 0.25 | 1.9 | 0 | 100 |
| Pt35/TiO2 | 0 | 0 | — | 15.8 | 35 | 45 | 15.8 | — | 3.3 | 0 | 100 |
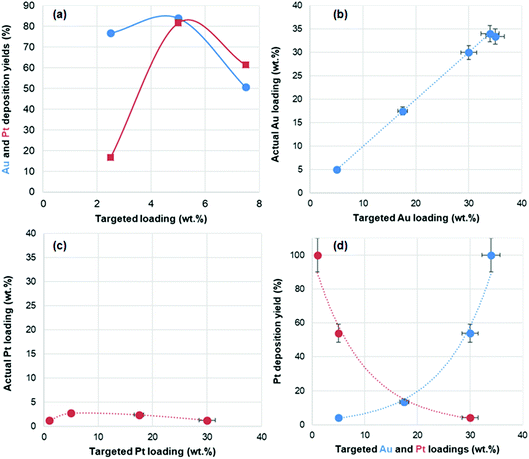
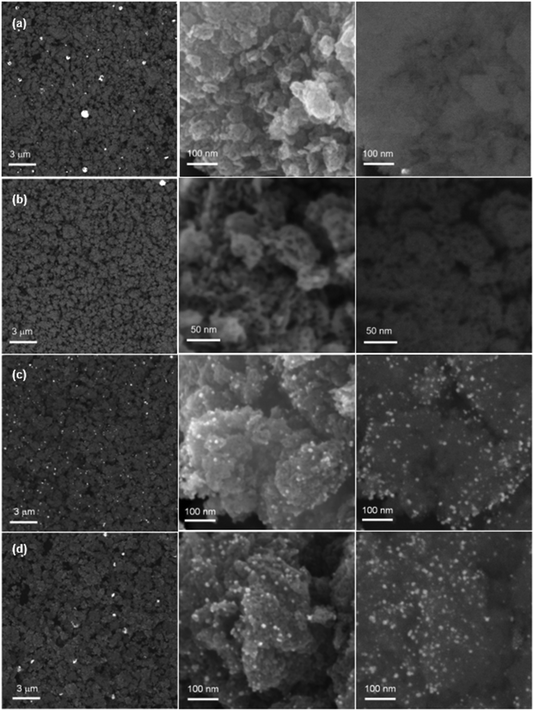
In the bimetallic catalysts, the actual loading of both metals, as measured by ICP, was found to be quite dependent on the nature of the metal, and for each metal, on the targeted metal loading, i.e. the initial metal concentration used (Table 1). Fig. 1a shows the deposition yields of Au and Pt as a function of their targeted loading. For gold, deposition yields vary between 51% and 84%. For platinum, deposition yields vary even more drastically, between 17% and 82%. The deposition of Pt is found to be particularly inefficient for the low loaded material (Au2.5Pt2.5/TiO2), but it markedly increases (to 61–82%) for the other two materials (Au5Pt5/TiO2 and Au7.5Pt7.5/TiO2). Optimal deposition is achieved for Au5Pt5/TiO2, in which more than 80% of the gold and the platinum present in the solution is deposited on TiO2. It is noted that only 6% of Pt was deposited in the absence of gold, at the same initial concentration of Pt (i.e. in Pt5/TiO2). The much higher deposition yield obtained in Au5Pt5/TiO2 thus highlights the key role of gold in platinum deposition. It suggests that gold may act as a nucleation site for Pt, i.e. that Pt deposition occurs preferentially on Au rather than on TiO2. As a result of variations in deposition yields, the series of bimetallic catalysts prepared by thermal reduction in DMF consists of AuPt/TiO2 materials with actual total metal loadings of 2.3, 8.3 and 8.4 wt% associated with increasing Pt/Au ratios of 0.22, 0.98 and 1.22, respectively.
 | ||
| Fig. 2 SEM images of Au5/TiO2 (a), Pt5/TiO2 (b), Au5Pt5/TiO2 (c), Au7.5Pt7.5/TiO2 (d), at low magnification (left) and at high magnification, using In Lens (middle) and BSE (left, right) detectors. | ||
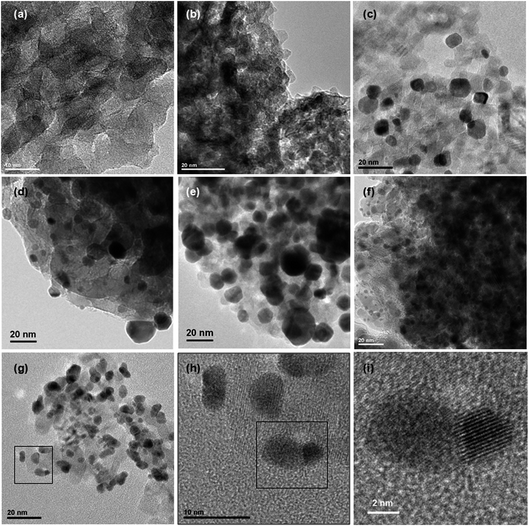
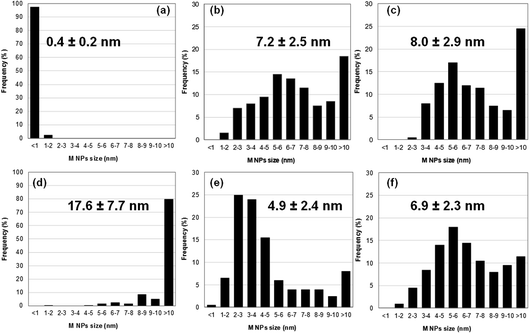
Size distributions of the smallest metallic NPs present in Au5Pt5/TiO2 and Au7.5Pt7.5/TiO2 were obtained by measuring the dimensions of 200 of the smaller NPs in the TEM images (Fig. 3c and d). A significant amount of metal NPs exhibit an oblong shape. Size distributions are presented in Fig. 4b and c. Both materials exhibit rather large size distributions, centered at 5–6 nm, with mean NP sizes around 7.2 and 8.0 nm for Au5Pt5/TiO2 and Au7.5Pt7.5/TiO2, respectively. Notably, Au7.5Pt7.5/TiO2 exhibits fewer NPs smaller than 3 nm (only 0.5% of the counted population vs. 8.5% in Au5Pt5/TiO2) and more NPs larger than 10 nm, which represent about 25% of the counted population. However, no particles (in the 2–20 nm size range) could be detected on Au2.5Pt2.5/TiO2, Au5/TiO2 and Pt5/TiO2. Sub-nm cluster-type objects were observed in all 3 materials. A large enough population could be measured in Pt5/TiO2 and a mean size of 0.4 ± 0.2 nm could be determined (Fig. 4a), clearly showing that the metallic phase in these materials exclusively consists of sub-nm clusters (except for Au5/TiO2 which contains some large gold aggregates in addition to the sub-nm clusters). Hence supported clusters were successfully prepared in one pot by performing the thermal DMF reduction of gold and platinum salts, inspired from previous studies, in the presence of titania.35–37
Surface atomic ratios can be calculated from XPS data. The Ti/O ratio is found to be 0.53 ± 0.02 eV in all five catalysts (Table 2). It is close to the expected theoretical ratio of 0.5 in TiO2. On the other hand, both the Au/Ti and Pt/Ti surface ratios vary. Interestingly, while the Pt/Ti surface ratio increases with increasing Pt/Ti bulk ratio (derived from the ICP data), the Au/Ti surface ratio varies independently from the bulk Au/Ti ratio and is much lower in the bimetallic catalysts, than in Au5/TiO2. As a result, the Pt/Au surface ratios (1.3, 42 and 146, for Au2.5Pt2.5/TiO2, Au5Pt5/TiO2 and Au7.5Pt7.5/TiO2, respectively) are found to be much higher than the Pt/Au bulk ratios (0.22, 0.98 and 1.22 for Au2.5Pt2.5/TiO2, Au5Pt5/TiO2 and Au7.5Pt7.5/TiO2, respectively), i.e. 6 times higher in Au2.5Pt2.5/TiO2, 43 times higher in Au5Pt5/TiO2 and 119 times higher in Au7.5Pt7.5/TiO2. This indicates massive Pt segregation on the surface and, more precisely, massive screening/coverage of the gold surface by Pt NPs larger than the inelastic mean free path of electrons (10–12 Å), which increases with increasing Pt content and Pt/Au bulk ratio.
| Surface (XPS) | ICP (bulk) | Surface/bulk | ||||||||
|---|---|---|---|---|---|---|---|---|---|---|
| Ti/O | Au/Ti | Pt/Ti | Pt/Au | Au/Ti | Pt/Ti | Pt/Au | Au/Ti | Pt/Ti | Pt/Au | |
| Au5/TiO2 | 0.52 | 0.10 | 0.00 | — | 0.0171 | 0 | — | 5.7 | — | — |
| Au2.5Pt2.5/TiO2 | 0.53 | 0.02 | 0.03 | 1.3 | 0.0080 | 0.0018 | 0.22 | 2.6 | 15.2 | 5.9 |
| Au5Pt5/TiO2 | 0.55 | 0.01 | 0.39 | 42 | 0.0186 | 0.0182 | 0.98 | 0.5 | 21.2 | 43 |
| Au7.5Pt7.5/TiO2 | 0.49 | 0.0048 | 0.70 | 146 | 0.0168 | 0.0206 | 1.22 | 0.3 | 34.3 | 119 |
| Pt5/TiO2 | 0.50 | 0 | 0.02 | — | 0 | 0.0016 | — | — | 15.0 | — |
| Au35/TiO2 | 0.51 | 1.53 | 0 | 0 | 0.2034 | — | — | 7.5 | — | — |
| Au34Pt1/TiO2 | 0.52 | 1.70 | 0.26 | 0.15 | 0.2121 | 0.0063 | 0.03 | 8.0 | 40.5 | 5.1 |
| Au30Pt5/TiO2 | 0.47 | 1.25 | 0.30 | 0.24 | 0.1808 | 0.0164 | 0.09 | 6.9 | 18.2 | 2.6 |
| Au17.5Pt17.5/TiO2 | 0.53 | 0.80 | 0.26 | 0.33 | 0.0954 | 0.0122 | 0.14 | 8.4 | 21.5 | 2.6 |
| Au3.5Pt3.5/TiO2 | 0.52 | 0.22 | 0.05 | 0.23 | 0.0117 | 0.0015 | 0.13 | 18.4 | 32.4 | 1.8 |
| Au5Pt30/TiO2 | 0.49 | 0.41 | 0.19 | 0.48 | 0.0216 | 0.0057 | 0.25 | 18.7 | 34.2 | 1.8 |
| Pt35/TiO2 | 0.48 | 0.00 | 1.54 | — | — | 0.0768 | — | — | 20.0 | — |
 | ||
| Fig. 5 UV-vis spectra of the Au–Pt/TiO2 materials prepared by thermal DMF reduction (a) and by NaBH4 reduction in DMF (b). | ||
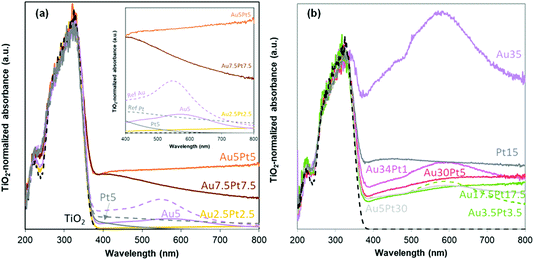
In the bimetallic catalysts, absorption in the visible range is clearly and markedly dependent on the metallic composition. Absorption in the visible range is quite limited for Au2.5Pt2.5/TiO2, and more specifically much smaller than in Au5/TiO2 and Pt5/TiO2. Given the far from negligible metal content of the material (2.3 wt%), the low visible absorption is consistent with Au and Pt NP size far below the LSPR size-limit detection, i.e. with the sub-nm cluster size and the absence of M NPs and aggregates evidenced by SEM and TEM. The more loaded catalysts (8.3–8.4 wt% metal) exhibit a much more significant absorption in the visible range. Intensity of the Pt NPs LSPR (420 nm) is much higher than in Pt5/TiO2 due to higher Pt loading and larger NPs size distribution. The similarity in intensities of Pt NPs LSPR (420 nm) in both Au5Pt5/TiO2 and Au7.5Pt7.5/TiO2 is consistent with the similar Pt loadings measured (4.1 and 4.6 wt%, respectively). However absorption remains high at λ > 420 nm in Au5Pt5/TiO2, while it decreases in Au7.5Pt7.5/TiO2. This can be attributed to a less pronounced contribution of Au NPs LSPR. It is attributed to efficient screening/quenching of the Au LSPR by Pt,53 at the highest Pt/Au ratio (1.22) achieved in Au7.5Pt7.5/TiO2, LSPR damping has been observed before in e.g. core–shell Au@Pt NPs.52
Catalytic properties for CO2-to-CH4 plasmon-induced reduction with water
Methane production rates obtained upon plasmonic excitation of the catalysts (λ > 400 nm) over time are shown in Fig. 6a. Negligible rates are obtained using the monometallic catalysts (0–0.1 μmol h−1 g−1 on average over 5 h). In previous work, we showed that Au(1 wt%, 3 nm)/TiO2 could produce about 0.3 μmol h−1 g−1 on average over 5 h.28 The lower activity of the monometallic Au5/TiO2 catalyst presented here is attributed to the much lower optical absorbance in the visible range. It also suggests that sub-nm Au (and Pt) clusters are not suitable plasmonic catalysts for the plasmon-induced reduction of CO2 with water. On the other hand, the bimetallic catalysts all exhibit significant methane productions – 1.5 to 7.8 μmol h−1 g−1 on average over 5 h, which increase with increasing Pt loading and Pt/Au ratio (Table 1). A useful synergy between gold and platinum is thus at play in these materials. Au2.5Pt2.5/TiO2 is indeed more active than both Au5/TiO2 and Pt5/TiO2, despite its lower optical absorbance (Fig. 5a). The most beneficial impact is found for Au7.5Pt7.5/TiO2, which produces 7.8 μmol h−1 g−1 of methane on average over 5 h of illumination, with 100% selectivity, thus showing the best catalytic performance of both catalyst series (Table 1). Hence, Pt segregation on the gold surface, as evidenced by XPS, is clearly beneficial to the production of methane. This suggests that the bimetallic catalysts may operate like an antenna-reactor-type system,54 in which the photon-derived energy and charges generated within the gold core are transferred to the platinum surface,47,52 where the reaction takes place. Besides, over the materials containing sub-nm metal clusters (Au5/TiO2, Pt5/TiO2, Au2.5Pt2.5/TiO2) hydrogen is produced from the competitive reduction of water, and the selectivity of Au2.5Pt2.5/TiO2 for methane does not exceed 25%. On the other hand, no production of hydrogen is observed on the materials containing 7–8 nm metal NPs (Au5Pt5/TiO2 and Au7.5Pt7.5/TiO2), and methane is thus produced with 100% selectivity. This suggests that the size of the plasmonic NPs affects the selectivity of the reaction, and that promoting the reduction of CO2 over the competitive reduction of water requires a certain metal NPs size. The higher loading of the plasmonic NPs in Au5Pt5/TiO2 and Au7.5Pt7.5/TiO2 (8.3–8.4 wt%) vs. Au5/TiO2, Pt5/TiO2, Au2.5Pt2.5/TiO2 (≤4%) may also contribute to increase the selectivity.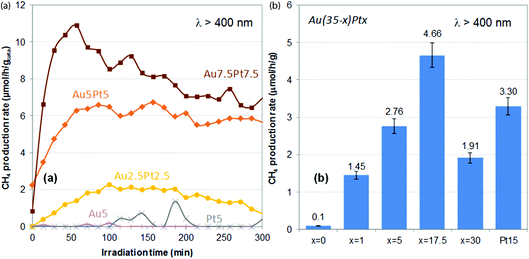 | ||
| Fig. 6 Plasmon-induced methane production rates observed under visible light irradiation (λ > 400 nm) over Au–Pt/TiO2 catalysts prepared by thermal DMF reduction (a) and Au(35 − x)Ptx/TiO2 catalysts prepared by NaBH4 reduction in DMF (b). In (b), methane production rates are average production rates over 5 h of reaction (Table 1). Error bars represent the uncertainty generally observed on such values, i.e. 7% of the absolute value. | ||
Bimetallic catalysts prepared by NaBH4 reduction in DMF
In the gold-containing mono- and bi-metallic catalysts, the actual gold loadings determined by ICP-OES are close to the targeted gold loadings (Table 1 and Fig. 1b), and deposition yields are close to 100% for targeted loadings above 5 wt%, and about 80% for the targeted loading of 3.5 wt%. On the other hand, Pt is not efficiently deposited with this method. In the monometallic catalyst, no Pt is actually deposited without slightly modifying the synthesis protocol (see Experimental section). In the bimetallic catalysts, Pt loadings do not exceed 2.7 wt% (Table 1 and Fig. 1c), with deposition yields exponentially decreasing with increasing targeted Pt loadings and decreasing targeted Au loading (Fig. 1d). This shows that, like for thermal DMF reduction, gold enhances Pt deposition, which suggests that deposited gold NPs, or the Au/TiO2 perimeter sites, may serve as nucleation sites for Pt. As a result, the targeted fixed metal loading of 35 wt% actually varies from 6.3 to 35 wt%, decreasing with decreasing gold content in the Au(35 − x)Ptx/TiO2 series, the range of Pt/Au ratios achieved is narrower than expected (0–0.25, instead of 0–6) and only gold-rich compositions are achieved (Pt/Au ratio < 0.25). Interestingly, due to the lower deposition yields of both Au and Pt in Au3.5Pt3.5/TiO2, a similar Pt/Au ratio of 0.13–0.14 is obtained in both Au3.5Pt3.5/TiO2 and Au17.5Pt17.5/TiO2, associated with two significantly different metal loadings (3.2 and 19.9 wt%, respectively).
 | ||
| Fig. 7 SEM images of Au35/TiO2 (a), Au3.5Pt3.5/TiO2 (b), Au17.5Pt17.5/TiO2 (c), at low magnification (left) and at high magnification, using In lens (middle) and BSE (left, right) detectors. | ||
Size distributions of the smaller metallic NPs present in Au35/TiO2, Pt15/TiO2 and Au17.5Pt17.5/TiO2 were obtained by measuring the lower dimension of 200 NPs on TEM images (Fig. 3e–g), in the case of oblong NPs. Like for the materials prepared by thermal DMF reduction, a significant amount of oblong metal NPs can be found in the bimetallic Au17.5Pt17/TiO2 catalyst. Size distributions are presented in Fig. 4d–f. They are centered at 17.6 ± 7.7 nm for Au35/TiO2, at 2–3 nm for Pt15/TiO2 with a mean NPs size of 4.9 ± 2.4 nm, and at 5–6 nm for Au17.5Pt17.5/TiO2 with a mean NPs size of 6.9 ± 2.3 nm. While mostly NPs > 10 nm are found in Au35/TiO2, a significant amount of very small NPs (<1–3 nm, 32% of the counted population) can be found in the Pt15/TiO2 catalyst. Au17.5Pt17.5/TiO2 exhibits fewer NPs smaller than 3 nm (6% of the counted population) and more NPs larger than 10 nm (12%). However most of the NPs (82%) have sizes between 3 and 10 nm (Fig. 4f), evidencing the critical role of Pt in Au NPs size control in this method. Interestingly, Janus-type NPs were detected on Au17.5Pt17.5/TiO2 (Fig. 3h, i and S2†). These Janus NPs consist of distinct Au and Pt nanocrystals sharing an interface, the Au nanocrystal being systematically larger than the Pt nanocrystal. The oblong shape of most of the metal NPs observed in the bimetallic Au17.5Pt17.5/TiO2 catalyst suggests that a significant proportion could consist of Janus NPs. This is the first time that Au–Pt Janus NPs have been obtained by the one pot co-reduction of metal salts,55 instead of multi-step seed-mediated growth.56–58 Our one pot method makes use of the intrinsic properties of gold and platinum, namely the difference in reduction potential of the two metal species and the preferential reduction of gold species,59 which favors the formation of phase segregated bi-metallic NPs with Pt on top of Au.60
Like for the materials prepared by thermal DMF reduction, platinum surface enrichment is observed by comparing Pt/Au surface ratios and Pt/Au bulk ratios (Table 2). The extent of the Pt enrichment is however more moderate, as Pt/Au surface ratios are indeed only 2 to 5 times higher than Pt/Au bulk ratios. This more moderate Pt surface enrichment is consistent with the Janus-type Au–Pt NPs observed by TEM (Fig. 3h and i) and the related partial coverage of Au surface by Pt NPs. It is attributed to a size effect, i.e. the larger size of Au NPs vs. Pt NPs (as evidenced e.g. for Au17.5Pt17.5/TiO2, see the TEM sub-section) considering the inelastic mean free path of electrons (10–12 Å).
Catalytic properties for CO2-to-CH4 plasmon-induced reduction
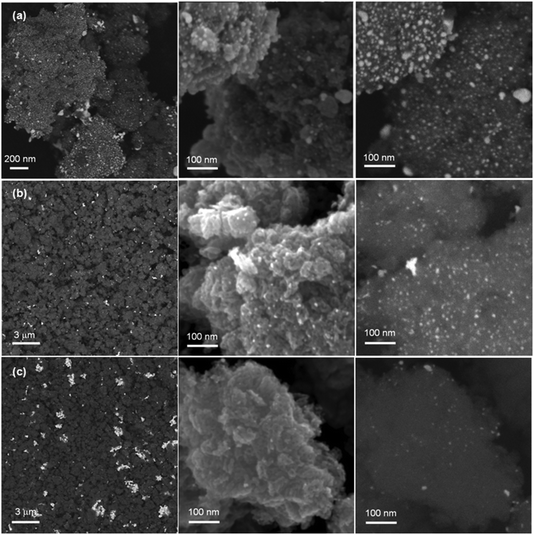
Methane production rates obtained on average over 5 h upon illumination of the catalysts with visible light (λ > 400 nm) are shown in Fig. 6b. Au35/TiO2 produces a negligible amount of methane (0.1 μmol h−1 g−1), despite its huge optical absorption in the visible range (Fig. 5b). This highlights the fact that an efficient light absorber is not necessarily an efficient plasmonic catalyst and that light absorption does not necessarily imply plasmon-induced activity. Plasmon-induced catalysis indeed relies on photogenerated charge carriers with very short lifetimes, the so-called “hot carriers” generated within the bulk of plasmonic NPs upon LSPR decay. To allow the catalytic reaction to proceed, the lifetime of these hot carriers need to be increased, by e.g. stabilization in the conduction band of an interfaced semi-conductor,63,64 after which they will need to reach the surface. These phenomena are clearly facilitated in NPs with high surface-to-volume ratio NPs, which implies that a size effect can be expected on the plasmon-induced reaction. These phenomena also require a high-quality M/SC interface. Hence the much lower activity of Au35/TiO2, as compared with that reported earlier for Au(1 wt%, 3 nm)/TiO2 catalyst (0.3 μmol h−1 g−1), can be attributed to the large size of the particles observed in Au35/TiO2 (Fig. 7a), the quasi-absent population of small particles, which implies a low surface-to-volume ratio, as well as the poor interface with the nanocrystalline support (13 nm). The monometallic Pt15/TiO2 catalyst exhibits a significant average methane production rate of 3.3 μmol h−1 g−1, in line with its suitable NPs size (Fig. 3f and 4e) in the range 2–10 nm. Most bimetallic catalysts exhibit methane production rates in-between those of Au35/TiO2 (0.1 μmol h−1 g−1) and Pt15/TiO2 (3.3 μmol h−1 g−1), only Au17.5Pt17.5/TiO2 exhibits a higher average methane production rate of 4.7 μmol h−1 g−1. The less evident synergistic effect between gold and platinum in these materials can be attributed to the prevalence of the poorly active gold phase, due to both the low Pt/Au ratios (0.03–0.25) and the lower coverage of the gold surface by platinum (see XPS sub-section and Table 2), i.e. to the more limited gold–platinum interface area. Utilization of the metal is clearly not optimal in these materials regarding the levels of CH4 produced (Table 1); activity may be impeded by the presence of oxidized forms of Pt, in addition to the limited Au/Pt interface. Nevertheless, one has to keep in mind that the bimetallic catalysts all contain a much lower amount of platinum (1–2.7%, Table 1) than the monometallic Pt15/TiO2 reference (15.8%). This shows that (1) the bimetallic catalysts are actually all more efficient than the monometallic reference on a Pt metal basis, highlighting the beneficial role of gold, and (2) a small amount of Pt, interfaced with Au, is sufficient to activate large inactive gold NPs. Besides, like for catalysts prepared by thermal DMF reduction, all materials containing a metal load above 6.3 wt% are 100% selective towards methane (no H2 produced, Table 1). This supports the previous assumption that higher loadings of the plasmonic NPs, i.e. higher coverage of titania with plasmonic NPs, successfully promote CO2 reduction over the competing water reduction reaction. None of the lower load catalysts (Au3.5Pt3.5/TiO2 from NaBH4 reduction and Au2.5Pt2.5/TiO2 thermal DMF reduction) indeed reaches full selectivity towards methane (Table 1). Selectivity is nevertheless favored by the metal NPs present in Au3.5Pt3.5/TiO2 rather than the sub-nm clusters present in Au2.5Pt2.5/TiO2. However, methane production rates on a metal basis are clearly enhanced by the suitable Au/Pt nanoalloy core–shell structure achieved by thermal DMF reduction, rather than the Au/Pt Janus structure derived from NaBH4 reduction.Experimental
Synthetic procedures
HAu(III)Cl4·3H2O (99.99%), NaAu(III)Cl4·2H2O (99.99%), H2Pt(IV)Cl6·xH2O (99.999%), K2Pt(II)Cl4 (99.9%) were purchased from Alfa-Aesar and used without further purification. NaBH4 (99%) was purchased from Sigma-Aldrich and used without further purification. DMF (99.9%) is purchased from Carlo Erba and used without further purification. TiO2 Hombikat UV100 is purchased from Sachtleben Chemie and calcined in a muffle furnace for 4 h in air at 350 °C before use, to obtain a well-defined nanocrystalline pure anatase powder containing well-calibrated anatase crystallites (13 nm) in an aggregated form (SEM), displaying a surface area of 140 m2 g−1 and no amorphous phase.Pt5/TiO2 is synthesized in the same way, replacing HAuCl4 by H2PtCl6 (1 mL/0.25 M/50 mg Pt).
A series of AuxPty/TiO2 catalysts (x = y = 2.5, 5, 7.5) is prepared in the same way, replacing HAuCl4 by the (quasi) simultaneous addition of both HAuCl4 and H2PtCl6 aqueous solutions (0.25 M), adjusting the volume of the solutions to the target loading. x and y stand for the targeted gold and platinum content (wt%), respectively, in the dried samples.
A series of Au(35 − x)Ptx/TiO2 catalysts (x = 0, 1, 5, 17.5, 30) is prepared in the same way, replacing NaAuCl4 by the (quasi) simultaneous addition of both NaAuCl4 and K2PtCl4 crystalline powders, adjusting the weight of the powders to the target loading and using NaBH4/(Au + Pt) = 10, where x stands for the targeted platinum content (wt%) in the dried samples.
A Au3.5Pt3.5/TiO2 catalyst was prepared in the same way, by adjusting the weight of the powders to the target loading.
An attempt to prepare Pt35/TiO2 by reacting K2PtCl4 alone under the conditions described for NaAuCl4 did not lead to any Pt deposition on TiO2, as evidenced by ICP-OES. After several attempts, we finally managed to prepare a monometallic Pt/TiO2 reference as follows: TiO2 (195 mg) is added to DMF (200 mL) and stirred for 5 min at room temperature (ca. 22 °C). K2PtCl4 (crystalline powder, 223.4 mg) is added and left to react for 5 min. NaBH4 is then introduced (204 mg/NaBH4/Pt = 10) and left to react for 30 min. The white powder in suspension is then isolated by filtration. The filtrate is left to settle overnight; a dark precipitate appears. The supernatant is sampled. The white powder is added to the supernatant under stirring and the mixture heated to 140 °C for 3 h. The powder in suspension that has turned grey is then isolated by filtration, washed (water/400 mL), dried (air/100 °C/24 h) and calcined in air at 200 °C for 1 h, leading to Pt15/TiO2, where [15] stands for the actual Pt content in the dried sample in wt% as measured by ICP-OES.
Efficiency of the methods is discussed on the basis of the deposition yield of each metal, which is defined as the ratio between the metal content measured in the dried samples by ICP-OES (IPHC/UMR CNRS 7178) and the targeted metal content (given the amount of metal initially present in the solution).
Characterization
Conclusions
Successful deposition of bimetallic Au–Pt sub-nm clusters on titania has been achieved in one pot by the thermal DMF co-reduction of gold and platinum salts in the presence of titania. The formation of sub-nm clusters is concentration-dependent. 7–8 nm NPs are formed at higher concentrations. Pt deposition is clearly occurring on gold, leading to fully metallic Au@Pt core–shell-type NPs. By comparison, titania-supported bimetallic Au–Pt NPs synthesized by NaBH4 reduction in DMF exhibit a less extensive Au–Pt interface, resulting from Janus-type nanostructures, and oxidized forms of Pt. For both types of bimetallic structures, a clear synergistic effect between gold and platinum is observed in the continuous flow gas phase CO2 reduction with water under visible light. Addition of platinum makes Au NPs more active and unselective gold clusters more selective towards the reduction of CO2vs. the competing reduction of water. These properties rely on the presence of an interface between Au and Pt. Activity is further boosted in the core–shell like nanostructures obtained by DMF thermal reduction, due to maximized Pt surface segregation and Au-Pt interface area, while selectivity clearly benefits from high loading of the plasmonic metal NPs, i.e. large coverage of the titania support with plasmonic NPs.Author contributions
L. H.: investigation, formal analysis, visualization; C. S.: investigation; J. T.: funding acquisition, supervision; T. H.: funding acquisition, supervision; V. K.: resources, supervision, writing – review and editing; V. C. conceptualization, funding acquisition, project administration, resources, supervision, validation, writing – original draft.Conflicts of interest
There are no conflicts to declare.Acknowledgements
This project has received financial support from the CNRS through the MITI interdisciplinary programs (SelCO2PlasmonRed project). This work of the Interdisciplinary Thematic Institute HiFunMat, as part of the ITI 2021–2028 program of the University of Strasbourg, CNRS and INSERM UMR 1121, was supported by IdEx Unistra (ANR-10-IDEX-0002) and SFRI (STRAT’US project, ANR-20-SFRI-0012) under the framework of the French Investments for the Future Program. L. H., J. T. and T. H. are grateful to the Centre islamique d’orientation et de l’enseignement supérieur (CIOES) for PhD fellowships. The French GDR OrNano and GDR Plasmonique active networks are gratefully acknowledged to have allowed fruitful and inspiring discussions about these results. Dr T. Dintzer (UMR CNRS 7515) and D. Ihiawakrim (UMR CNRS 7504) are thanked for acquiring SEM and TEM images respectively. Dr V. Papaefthimiou (UMR CNRS 7515) is thanked for acquiring XPS data.Notes and references
- R. Ferrando, J. Jellinek and R. L. Johnston, Chem. Rev., 2008, 108, 845 CrossRef CAS PubMed.
- H. B. Liu, U. Pal and J. A. Ascencio, J. Phys. Chem. C, 2008, 112, 19173 CrossRef CAS.
- J. Luo, M. M. Maye, V. Petkov, N. N. Kariuki, L. Wang, P. Njoki, D. Mott, Y. Lin and C.-J. Zhong, Chem. Mater., 2005, 17, 3086 CrossRef CAS.
- H. Zhang and N. Toshima, J. Colloid Interface Sci., 2013, 394, 166 CrossRef CAS PubMed.
- R. J. Wong, J. Scott, P. Kappen, G. K.-C. Low, J. N. Hart and R. Amal, Catal. Sci. Technol., 2017, 7, 4792 RSC.
- D. Zhao, Y.-H. Wang and B.-Q. Xu, J. Phys. Chem. C, 2009, 113, 20903 CrossRef CAS.
- C. Jin, J. Zhu, R. Dong and Q. Huo, Electrochim. Acta, 2016, 190, 829 CrossRef CAS.
- D. Zhao and B.-Q. Xu, Phys. Chem. Chem. Phys., 2006, 8, 5106 RSC.
- D. Zhao and B.-Q. Xu, Angew. Chem., Int. Ed., 2006, 45, 4955 Search PubMed.
- G. Selvarani, S. V. Selvaganesh, S. Krishnamurthy, G. V. M. Kiruthika, P. Sridhar, S. Pitchumani and A. K. Shukla, J. Phys. Chem. C, 2009, 113, 7461 CrossRef CAS.
- V. Petkov, B. N. Wanjala, R. Loukrakpam, J. Luo, L. Yang, C.-J. Zhong and S. Shastri, Nano Lett., 2012, 12, 4289 CrossRef CAS PubMed.
- J. Zhang, K. Sasaki, E. Sutter and R. R. Adzic, Science, 2007, 315, 220 CrossRef CAS.
- B. N. Wanjala, J. Luo, R. Loukrakpam, B. Fang, D. Mott, P. N. Njoki, M. Engelhard, H. R. Naslund, J. K. Wu, L. Wang, O. Malis and C.-J. Zhong, Chem. Mater., 2010, 22, 4282 CrossRef CAS.
- N. S. K. Gowthaman and S. Abraham John, RSC Adv., 2015, 5, 42369 RSC.
- Y. Yamauchi, A. Tonegawa, M. Komatsu, H. Wang, L. Wang, Y. Nemoto, N. Suzuki and K. Kuroda, J. Am. Chem. Soc., 2012, 134, 5100 CrossRef CAS PubMed.
- N. S. K. Gowthaman and S. Abraham John, J. Chem. Sci., 2016, 128, 331 CrossRef CAS.
- Z. Liu, H. Forsyth, N. Khaper and A. Chen, Analyst, 2016, 141, 4074 RSC.
- A. Gołąbiewska, W. Lisowski, M. Jarek, G. Nowaczyk, A. Zielińska-Jurek and A. Zaleska, Appl. Surf. Sci., 2014, 317, 1131 CrossRef.
- A. Zaleska-Medynska, M. Marchelek, M. Diak and E. Grabowska, Adv. Colloid Interface Sci., 2016, 229, 80 CrossRef CAS.
- S. Shuang and Z. Zhang, Molecules, 2018, 23, 525 CrossRef.
- Z. K. Zheng, T. Tachikawa and T. Majima, J. Am. Chem. Soc., 2014, 136, 6870 CrossRef CAS PubMed.
- H. Song, X. Meng, T. D. Dao, W. Zhou, H. Liu, L. Shi, H. Zhang, T. Nagao, T. Kako and J. Ye, ACS Appl. Mater. Interfaces, 2018, 10, 408 CrossRef CAS.
- X. Q. Yang, Y. Lu, Y. Liu, J. Wang, L. Shao and J. F. Wang, Small Struct., 2021, 2(12), 2100101 CrossRef CAS.
- B. N. Wanjala, J. Luo, B. Fang, D. Mott and C.-J. Zhong, J. Mater. Chem., 2011, 21, 4012 RSC.
- P. Lignier, M. Comotti, F. Schüth, J.-L. Rousset and V. Caps, Catal. Today, 2009, 141, 355 CrossRef CAS.
- K. Guillois, L. Burel, A. Tuel and V. Caps, Appl. Catal., A, 2012, 415, 1 CrossRef.
- F. Vigneron, A. Piquet, W. Baaziz, P. Ronot, A. Boos, I. Janowska, C. Pham-Huu, C. Petit and V. Caps, Catal. Today, 2014, 235, 90 CrossRef CAS.
- S. Bardey, A. Bonduelle-Skrzypczak, A. Fécant, Z. Cui, C. Colbeau-Justin, V. Caps and V. Keller, Faraday Discuss., 2019, 214, 417 RSC.
- L. Michel, S. Sall, T. Dintzer, A. Demange, C. Robert and V. Caps, Faraday Discuss., 2021, 227, 259 RSC.
- P. Jiménez-Calvo, L. Michel, V. Keller and V. Caps, ACS Appl. Mater. Interfaces, 2021, 13, 61015 CrossRef PubMed.
- M. Khalid, N. Wasio, T. Chase and K. Bandyopadhya, Nanoscale Res. Lett., 2010, 5 CrossRef CAS PubMed.
- L. Qian, Y. Sha and X. Yang, Thin Solid Films, 2006, 515, 1349 CrossRef CAS.
- S. Guo, J. Zhai, Y. Fang, S. Dong and E. Wang, Chem.–Asian J., 2008, 3, 1156 CrossRef CAS PubMed.
- L. Cao, L. Tong, P. Diao, T. Zhu and Z. Liu, Chem. Mater., 2004, 16, 3239 CrossRef CAS.
- X. Liu, C. Li, J. Xu, J. Lv, M. Zhu, Y. Guo, S. Cui, H. Liu, S. Wang and Y. Li, J. Phys. Chem. C, 2008, 112, 10778 CrossRef CAS.
- H. Kawasaki, H. Yamamoto, H. Fujimori, R. Arakawa, Y. Iwasaki and M. Inada, Langmuir, 2010, 26, 5926 CrossRef CAS.
- H. Kawasaki, H. Yamamoto, H. Fujimori, R. Arakawa, M. Inada and Y. Iwasaki, Chem. Commun., 2010, 46, 3759 RSC.
- M. Hyotanishi, Y. Isomura, H. Yamamoto, H. Kawasaki and Y. Obora, Chem. Commun., 2011, 47, 5750 RSC.
- Y. Isomura, T. Narushima, H. Kawasaki, T. Yonezawa and Y. Obora, Chem. Commun., 2012, 48, 3784 RSC.
- K. Oikawa, S. Itoh, H. Yano, H. Kawasaki and Y. Obora, Chem. Commun., 2017, 53, 1080 RSC.
- M. M. Heravi, M. Ghavidel and L. Mohammadkhani, RSC Adv., 2018, 8, 27832 RSC.
- X. Chang, T. Wang and J. Gong, Energy Environ. Sci., 2016, 9, 2177 RSC.
- W.-J. Yin, B. Wen, Q. Ge, X.-B. Li, G. Teobaldi and L.-M. Liu, Dalton Trans., 2020, 49, 12918 RSC.
- R. Verma, R. Belgamwar and V. Polshettiwar, ACS Mater. Lett., 2021, 3, 574 CrossRef CAS.
- N. Satoh, T. Nakashima and K. Yamamoto, Sci. Rep., 2013, 3, 1959 CrossRef.
- B. A. Sexton, A. E. Hughes and K. Foger, J. Catal., 1982, 77, 85 CrossRef CAS.
- C. Engelbrekt, K. T. Crampton, D. A. Fishman, M. Law and V. A. Apkarian, ACS Nano, 2020, 14, 5061 CrossRef CAS PubMed.
- C.-E. Kim, D.-H. Lim, J. H. Jang, H. J. Kim, S. P. Yoon, J. Han, S. W. Nam, S.-A. Hong, A. Soon and H. C. Ham, J. Chem. Phys., 2015, 142, 034707 CrossRef PubMed.
- D. Manchon, J. Lermé, T. Zhang, A. Mosset, C. Jamois, C. Bonnet, J.-M. Rye, A. Belarouci, M. Broyer, M. Pellarin and E. Cottancin, Nanoscale, 2015, 7, 1181 RSC.
- C. Langhammer, Z. Yuan, I. Zorić and B. Kasemo, Nano Lett., 2006, 6, 833 CrossRef CAS PubMed.
- M. Cueto, M. Piedrahita, C. Caro and B. Martínez-Haya, J. Phys. Chem. C, 2014, 118, 11432 CrossRef CAS.
- A. Joplin, S. A. Hosseini Jebeli, E. Sung, N. Diemler, P. J. Straney, M. Yorulmaz, W.-S. Chang, J. E. Millstone and S. Link, ACS Nano, 2017, 11, 12346 CrossRef CAS PubMed.
- N. Danielis, L. Vega, G. Fronzoni, M. Stener, A. Bruix and K. M. Neyman, J. Phys. Chem. C, 2021, 125, 17372 CrossRef CAS PubMed.
- D. F. Swearer, H. Zhao, L. Zhou, C. Zhang, H. Robatjazi, J. M. P. Martirez, C. M. Krauter, S. Yazdi, M. J. McClain, E. Ringe, E. A. Carter, P. Nordlander and N. J. Halas, Proc. Natl. Acad. Sci. U. S. A., 2016, 113, 8916 CrossRef CAS PubMed.
- J. Qiu, Q. N. Nguyen, Z. Lyu, Q. Wang and Y. Xia, Adv. Mater., 2022, 34, 210259 Search PubMed.
- C. C. Crane, J. Tao, F. Wang, Y. Zhu and J. Chen, J. Phys. Chem. C, 2014, 118, 28134 CrossRef CAS.
- I. Santiago, L. Jiang, J. Foord and A. J. Turberfield, Chem. Commun., 2018, 54, 1901 RSC.
- J. Qiu, M. Xie, Z. Lyu, K. D. Gilroy, H. Liu and Y. Xia, Nano Lett., 2019, 19, 6703 CrossRef CAS.
- H. Ataee-Esfahani, L. Wang, Y. Nemoto and Y. Yamauchi, Chem. Mater., 2010, 22, 6310 CrossRef CAS.
- B. Klebowski, J. Depciuch, M. Stec, D. Krzempek, W. Komenda, J. Baran and M. Parlinska-Wojtan, Int. J. Mol. Sci., 2020, 21, 9610 CrossRef CAS PubMed.
- E. I. Vovk, A. V. Kalinkin, M. Yu. Smirnov, I. O. Klembovskii and V. I. Bukhtiyarov, J. Phys. Chem. C, 2017, 121, 17297 CrossRef CAS.
- J. E. S. van der Hoeven, T.-S. Deng, W. Albrecht, L. A. Olthof, M. A. van Huis, P. E. de Jongh and A. van Blaaderen, ACS Omega, 2021, 6, 7034 CrossRef CAS PubMed.
- P. Christopher and M. Moskovits, Annu. Rev. Phys. Chem., 2017, 68, 379 CrossRef CAS PubMed.
- L. Du, A. Furube, K. Yamamoto, K. Hara, R. Katoh and M. Tachiya, J. Phys. Chem. C, 2009, 113, 6454–6462 CrossRef CAS.
- C. A. Schneider, W. S. Rasband and K. W. Eliceiri, Nat. Methods, 2012, 9, 671 CrossRef CAS PubMed.
Footnote |
| † Electronic supplementary information (ESI) available. See https://doi.org/10.1039/d2fd00094f |
| This journal is © The Royal Society of Chemistry 2023 |

