 Open Access Article
Method for growing edible Euglena gracilis in an inexpensive medium with tomato juice to a high cell density equivalent to the density in KH medium†
Kyohei
Yamashita
 *a,
Koji
Yamada
b,
Kengo
Suzuki
b and
Eiji
Tokunaga
a
aDepartment of Physics, Faculty of Science, Tokyo University of Science, 1-3 Kagurazaka, Shinjuku-ku, Tokyo 162-8601, Japan. E-mail: yamashita.k@rs.tus.ac.jp
bEuglena Co., Ltd., YBIC244, 1-6, Suehiro-cho, Tsurumi-ku Yokohama, Kanagawa, 230-0045, Japan
First published on 14th August 2023
Abstract
This paper proposes a low-cost technology for growing Euglena gracilis using beverages that people consume on a daily basis as a nutrient source. Among the 13 beverages tested, the most suitable one for growing E. gracilis was tomato juice. In four different brands of tomato juice, E. gracilis was grown to a cell density (107 cells per mL) comparable to that in KH medium, a conventional heterotrophic medium. The cost is only 1/6 of KH medium. In addition, growth of 100 times the initial cell density was observed in a medium containing tomato juice even without essential vitamins. Since this method does not use genetic modification or genome editing techniques and animal products, it expands the potential for the use of E. gracilis as a food.
Sustainability spotlightFood shortages and malnutrition are serious issues related to “food” that affect everyone in the world, and sustainable food production is desired. Euglena gracilis, a single-celled green alga that can grow through photosynthesis, synthesizes abundant nutrients and the functional component paramylon. This paper proposes an inexpensive technology for producing E. gracilis by using beverages that people consume on a daily basis as a nutrient source. This will enable the creation of a simple and inexpensive culture medium and eliminate the costs associated with conventional production processes (agitation, collection, drying, food processing, etc.). Therefore, the results of this research are expected to contribute to “Goal 2: End hunger, achieve food security and improved nutrition and promote sustainable agriculture” under the SDGs. |
1. Introduction
Biomass from microalgae is a source of useful resources such as β-carotene, astaxanthin, and polyunsaturated fatty acids used in nutraceuticals, pharmaceuticals, and cosmetics.1,2 The microalgae E. gracilis is a freshwater green microalgae of about 50 μm long and 8–12 μm in diameter that has been used as a model organism for photosynthesis research.3 In addition to E. gracilis, the genus Euglena includes more than 200 species, some of which have industrial value because of their beneficial abilities, such as the synthesis of paramylon and several other bioactive substances.4 Among these species, E. gracilis shows a much faster growth rate than other Euglena species under optimal growth conditions,5 making it suitable for mass culture and commercialization.In recent years, the successful mass cultivation of E. gracilis has led to its commercial supply as a raw material for functional foods, cosmetics, and biofuels. E. gracilis is highly nutritious, as discussed below, and unlike other microalgae, it has no cell walls, making it easily digestible when ingested. This makes it suitable as a food ingredient, and mixing E. gracilis into a variety of foods can enhance their nutritional value. In terms of human nutritional sources, E. gracilis is known to store amino acids, vitamins, lipids, and other nutrients suitable for human consumption.3–5 The protein of E. gracilis is high in methionine,6 a characteristic of animal protein, and its nutritional value is comparable to the casein found in milk. This property is expected to create demand for E. gracilis from Halal and vegetarians as an alternative to animal protein. E. gracilis cells also contain the essential fatty acids, DHA and EPA. In addition, E. gracilis is known to store 60% of its dry weight, a special type of beta-1-3-glucan called paramylon.7 Paramylon has been verified for its immunomodulatory8 and liver protective effects,9 and has been shown to alleviate symptoms of atopic dermatitis,10 influenza,11 and arthritis,12 and has been suggested to prevent colon cancer.13
E. gracilis can utilize a variety of carbon sources to promote its own growth and assimilate ammonia-form nitrogen.14 In particular, glutamic acid is a highly valuable nutrient for E. gracilis because it can be used as both a carbon and nitrogen source.15 It requires V.B1 and V.B12 as essential vitamins for growth.16 Based on the above nutritional requirements, culture media have been developed for E. gracilis. Widely used are the Cramer–Myers (CM) medium,14 an autotrophic medium, and the Koren–Hutner (KH) medium, a high-yielding heterotrophic medium.15 As an example of a mass culture method, E. gracilis is cultured in large outdoor ponds, agitated by a rotating device.17 Further development of various harvesting and processing methods is needed to convert the growing E. gracilis culture into an industrially useable dry powder form. In the algae production process, concentrating mass-cultured E. gracilis by techniques such as centrifugation, and filtration requires power-driven machinery, which is energy-intensive. This accounts for approximately 20–30% of production costs, making efficient cell harvesting process a challenge.18 A harvesting method for E. gracilis that depends on gravity-induced sedimentation of swimming detect mutants are reported.19,20 Although the method does not require power-driven machines, it is supposed to take longer time to harvest than existing methods. One of the above mentioned mutants is produces by genome editing (GE) technology,19,23 which has been suggested as a suitable tool for use in food grade systems.21
The resulting concentrate is then added to clean water and concentrated again to obtain a clean E. gracilis cell concentrate. In the drying process, the concentrated liquid is powdered in a spray dryer, a device that sprays the liquid into a mist and instantly dries it by exposing the mist to warm air. Finally, the powder is sucked and collected in a cyclone (a device that sucks and separates powdered solids present in gas).22
One way to improve the efficiency of E. gracilis production without genetic engineering or GE technology is to optimize the growth medium, and attempts have been made to use food processing by-products as an organic carbon source. With producing E. gracilis using food-grade highly sterilized food processing by-products, the product is applicable to functional foods and pharmaceuticals. Specifically, potato liquor,23 corn steep solid,24 corn steep liquor and brewer's spent grain,25 kinnow peel extract,26 tofu wastewater,27 mixture of sewage and organic wastes (molasses, corn steep liquor, and waste wine)28 and Spent Tomato Byproduct (STB)29 have been used to grow E. gracilis to efficiently and economically produce paramylon. In growth using STB, hydrolysis treatment of STB and adjustment to the appropriate pH enabled the production twice the amount of biomass of CM medium.29
In this paper, we report that when E. gracilis was used for edible purposes, the use of foods that people consume daily (edible parts) as culture substrates resulted in higher production at lower cost than conventional production methods. Among the foods tested, the simple method of diluting tomato juice with water and adding essential vitamins can be used to grow to nearly 10 times the cell density of CM medium. It has the same cell density as in the heterotrophic medium, KH medium, yet costs 1/6th of it. With respect to the culture method (ref. 29) using STB described above, our method differs in that we use juice solution of edible parts instead of STB. In terms of using tomatoes as a nutritional source, our patent (JP6998157B2) was filed in 2017 (Japanese Patent Application No. JP2017170589A) and published in 2019 (Japanese Unexamined Patent Publication No. JP2019041715A), which precedes the research in the ref. 29.
This method is more economical because the culture medium can be used as-is as an edible part, eliminating the need for cell collection, drying, and food processing, as is the case with large-scale pooled cultures. The beneficial functionality and nutrients of E. gracilis can be added to conventional food products. It is expected to contribute to expanding the range of use of E. gracilis as food by providing them with higher nutritional value at a lower cost than existing food products at present.
2. Materials and methods
2.1. Cell pre-culture
The wild type E. gracilis (Z strain) was provided by Euglena Co., Ltd. It was incubated in CM medium (pH 3.5), stationary and aerobically under continuous illumination with a cool white fluorescent light at 40–60 μmol m−2 s−1 and at constant temperature 21 °C. The pH of all cultures (without cells) was measured with a pH meter (D-55, HORIBA, Ltd.).2.2. Washing cells with sterile water
Cells grown in CM medium until steady state were washed twice with sterile water by centrifugation (6000 rpm, 5 min, 4 °C); sterile water was purified and autoclaved (121 °C, 20 min, model: KT-2322, ALP Co., Ltd.).2.3. Cell counting
Cells were counted using plankton counter plates (MPC-200, Matsunami Glass Ind., Ltd.) and a digital biological microscope (GR-D8T2, Shodensha, Inc.) with a 10× objective lens (NA 0.25, Shodensha, Inc.). For microscopic observation, the cell suspension was diluted and the cells were fixed using a 0.2% (w/v) benzalkonium chloride solution, which was diluted 50-fold with purified water from 10% (w/v) benzalkonium chloride solution (Nihon Pharmaceutical Co., Ltd.).2.4. Steady-state cell density in synthetic culture
E. gracilis was grown in a mixture of CM medium (independent nutrient medium) and KH medium (heterotrophic medium) at a ratio of 4![[thin space (1/6-em)]](https://www.rsc.org/images/entities/char_2009.gif) :
:![[thin space (1/6-em)]](https://www.rsc.org/images/entities/char_2009.gif) 1. The 20 μL of the cell suspension was added to CM medium and KH medium (3 mL each) and cultured under the following conditions.
1. The 20 μL of the cell suspension was added to CM medium and KH medium (3 mL each) and cultured under the following conditions.
• Samples were incubated under aerobic conditions.
• Light: white fluorescent light (90 μmol m−2 s−1), temperature: 23–25 °C.
• Initial cell density: 4.2× 10³ cells per mL.
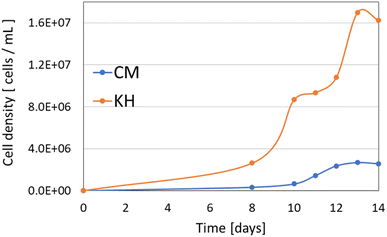
Cell counting was performed from day 8 to day 14 after the start of culture to generate a growth curve (Fig. 1).
2.5. Growth of E. gracilis using soft drink as culture medium
E. gracilis did not grow in CM medium that had been autoclaved multiple times because essential vitamins were destroyed (data not shown). Since commercial beverages are heat sterilized, we tested whether autoclaving during culture medium preparation affects growth.| Sample (soft drink) | Sample![[thin space (1/6-em)]](https://www.rsc.org/images/entities/char_2009.gif) : :![[thin space (1/6-em)]](https://www.rsc.org/images/entities/char_2009.gif) sterile water sterile water |
Sample [g] | Sterile water with cellsa [mL] | V.B1 [μg] | V.B12 [μg] | Total [mL] | pH |
|---|---|---|---|---|---|---|---|
| a Cells washed with sterile water were included. b V.B1 was added in equal volume to CM medium. V.B12 was added in equal volume to KH medium. See Table S1 in the ESI on “Sample". | |||||||
| CM (control) | — | — | — | — | — | 15 | 3.50 |
Grape (3![[thin space (1/6-em)]](https://www.rsc.org/images/entities/char_2009.gif) : :![[thin space (1/6-em)]](https://www.rsc.org/images/entities/char_2009.gif) 7) 7) |
3![[thin space (1/6-em)]](https://www.rsc.org/images/entities/char_2009.gif) : :![[thin space (1/6-em)]](https://www.rsc.org/images/entities/char_2009.gif) 7 7 |
4.5 | 10.5 | 1.5 | 0.075 | 15 | 3.21 |
Grape (7![[thin space (1/6-em)]](https://www.rsc.org/images/entities/char_2009.gif) : :![[thin space (1/6-em)]](https://www.rsc.org/images/entities/char_2009.gif) 3) 3) |
7![[thin space (1/6-em)]](https://www.rsc.org/images/entities/char_2009.gif) : :![[thin space (1/6-em)]](https://www.rsc.org/images/entities/char_2009.gif) 3 3 |
10.5 | 4.5 | 1.5 | 0.075 | 15 | 3.14 |
| Pineapple | 3![[thin space (1/6-em)]](https://www.rsc.org/images/entities/char_2009.gif) : :![[thin space (1/6-em)]](https://www.rsc.org/images/entities/char_2009.gif) 7 7 |
4.5 | 10.5 | 1.5 | 0.075 | 15 | 3.80 |
| Apple | 3![[thin space (1/6-em)]](https://www.rsc.org/images/entities/char_2009.gif) : :![[thin space (1/6-em)]](https://www.rsc.org/images/entities/char_2009.gif) 7 7 |
4.5 | 10.5 | 1.5 | 0.075 | 15 | 3.81 |
| Amazake | 3![[thin space (1/6-em)]](https://www.rsc.org/images/entities/char_2009.gif) : :![[thin space (1/6-em)]](https://www.rsc.org/images/entities/char_2009.gif) 7 7 |
4.5 | 10.5 | 1.5 | 0.075 | 15 | 5.71 |
Carrot (3![[thin space (1/6-em)]](https://www.rsc.org/images/entities/char_2009.gif) : :![[thin space (1/6-em)]](https://www.rsc.org/images/entities/char_2009.gif) 7) 7) |
3![[thin space (1/6-em)]](https://www.rsc.org/images/entities/char_2009.gif) : :![[thin space (1/6-em)]](https://www.rsc.org/images/entities/char_2009.gif) 7 7 |
4.5 | 10.5 | 1.5 | 0.075 | 15 | — |
Carrot (7![[thin space (1/6-em)]](https://www.rsc.org/images/entities/char_2009.gif) : :![[thin space (1/6-em)]](https://www.rsc.org/images/entities/char_2009.gif) 3) 3) |
7![[thin space (1/6-em)]](https://www.rsc.org/images/entities/char_2009.gif) : :![[thin space (1/6-em)]](https://www.rsc.org/images/entities/char_2009.gif) 3 3 |
10.5 | 4.5 | 1.5 | 0.075 | 15 | — |
| Tomato | 4![[thin space (1/6-em)]](https://www.rsc.org/images/entities/char_2009.gif) : :![[thin space (1/6-em)]](https://www.rsc.org/images/entities/char_2009.gif) 6 6 |
6 | 9 | 1.5 | 0.075 | 15 | 4.57 |
| Orange | 3![[thin space (1/6-em)]](https://www.rsc.org/images/entities/char_2009.gif) : :![[thin space (1/6-em)]](https://www.rsc.org/images/entities/char_2009.gif) 7 7 |
4.5 | 10.5 | 1.5 | 0.075 | 15 | 4.07 |
| Grapefruit | 3![[thin space (1/6-em)]](https://www.rsc.org/images/entities/char_2009.gif) : :![[thin space (1/6-em)]](https://www.rsc.org/images/entities/char_2009.gif) 7 7 |
4.5 | 10.5 | 1.5 | 0.075 | 15 | 3.48 |
| Prune | 3![[thin space (1/6-em)]](https://www.rsc.org/images/entities/char_2009.gif) : :![[thin space (1/6-em)]](https://www.rsc.org/images/entities/char_2009.gif) 7 7 |
4.5 | 10.5 | 1.5 | 0.075 | 15 | — |
| Coconut water | 14![[thin space (1/6-em)]](https://www.rsc.org/images/entities/char_2009.gif) : :![[thin space (1/6-em)]](https://www.rsc.org/images/entities/char_2009.gif) 1 1 |
14 | 1 | 1.5 | 0.075 | 15 | — |
| Maple water | 14![[thin space (1/6-em)]](https://www.rsc.org/images/entities/char_2009.gif) : :![[thin space (1/6-em)]](https://www.rsc.org/images/entities/char_2009.gif) 1 1 |
14 | 1 | 1.5 | 0.075 | 15 | — |
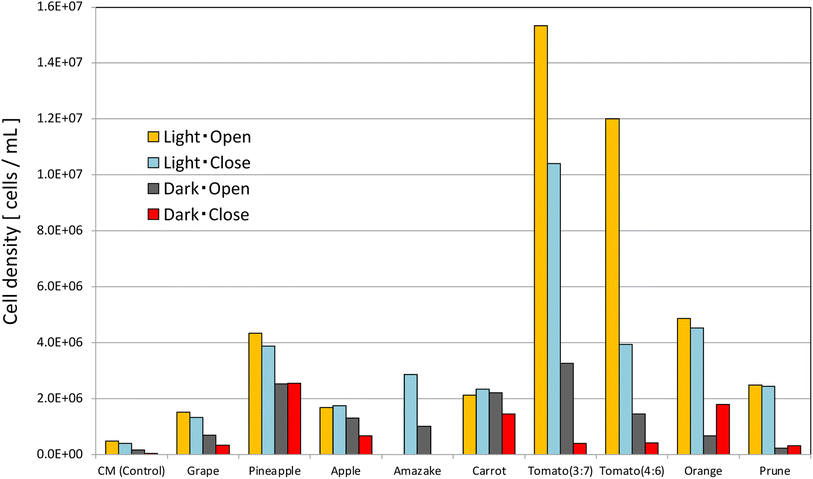
Each sample was incubated for 11 days under the following conditions, after which the respective cell density was measured (Fig. 2).
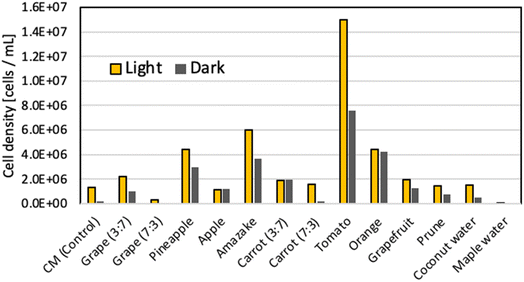 | ||
Fig. 2 Density of E. gracilis cells in non-autoclaved soft drink culture medium (11th day). Ratio in the figure indicates the volume ratio of “Soft drink![[thin space (1/6-em)]](https://www.rsc.org/images/entities/char_2009.gif) : :![[thin space (1/6-em)]](https://www.rsc.org/images/entities/char_2009.gif) Sterile water” (V.B1 and V.B12 were added). Sterile water” (V.B1 and V.B12 were added). | ||
• Samples were incubated under aerobic conditions.
• “Light” in Fig. 2: white fluorescent light (100 μmol m−2 s−1), temperature: 26 °C.
• “Dark” in Fig. 2: temperature: 23 °C.
• Initial cell density: 1.6 × 10⁴ cells per mL.
| Sample (soft drink) | Sample![[thin space (1/6-em)]](https://www.rsc.org/images/entities/char_2009.gif) : :![[thin space (1/6-em)]](https://www.rsc.org/images/entities/char_2009.gif) sterile water sterile water |
Sample [g] | Sterile water with cellsa [mL] | V.B1 [μg] | V.B12 [μg] | Total [mL] | pH |
|---|---|---|---|---|---|---|---|
| a Cells washed with sterile water were included. b V.B1 was added in equal volume to CM medium. V.B12 was added in equal volume to KH medium. See Table S2 in the ESI on “Sample”. | |||||||
| CM (control) | — | — | — | — | — | 15 | 3.50 |
| Grape | 3![[thin space (1/6-em)]](https://www.rsc.org/images/entities/char_2009.gif) : :![[thin space (1/6-em)]](https://www.rsc.org/images/entities/char_2009.gif) 7 7 |
4.5 | 10.5 | 1.5 | 0.075 | 15 | 3.23 |
| Pineapple | 3![[thin space (1/6-em)]](https://www.rsc.org/images/entities/char_2009.gif) : :![[thin space (1/6-em)]](https://www.rsc.org/images/entities/char_2009.gif) 7 7 |
4.5 | 10.5 | 1.5 | 0.075 | 15 | 3.81 |
| Apple | 3![[thin space (1/6-em)]](https://www.rsc.org/images/entities/char_2009.gif) : :![[thin space (1/6-em)]](https://www.rsc.org/images/entities/char_2009.gif) 7 7 |
4.5 | 10.5 | 1.5 | 0.075 | 15 | 3.83 |
| Amazake | 3![[thin space (1/6-em)]](https://www.rsc.org/images/entities/char_2009.gif) : :![[thin space (1/6-em)]](https://www.rsc.org/images/entities/char_2009.gif) 7 7 |
4.5 | 10.5 | 1.5 | 0.075 | 15 | 5.73 |
| Carrot | 3![[thin space (1/6-em)]](https://www.rsc.org/images/entities/char_2009.gif) : :![[thin space (1/6-em)]](https://www.rsc.org/images/entities/char_2009.gif) 7 7 |
4.5 | 10.5 | 1.5 | 0.075 | 15 | — |
Tomato (3![[thin space (1/6-em)]](https://www.rsc.org/images/entities/char_2009.gif) : :![[thin space (1/6-em)]](https://www.rsc.org/images/entities/char_2009.gif) 7) 7) |
3![[thin space (1/6-em)]](https://www.rsc.org/images/entities/char_2009.gif) : :![[thin space (1/6-em)]](https://www.rsc.org/images/entities/char_2009.gif) 7 7 |
4.5 | 10.5 | 1.5 | 0.075 | 15 | 4.55 |
Tomato (4![[thin space (1/6-em)]](https://www.rsc.org/images/entities/char_2009.gif) : :![[thin space (1/6-em)]](https://www.rsc.org/images/entities/char_2009.gif) 6) 6) |
4![[thin space (1/6-em)]](https://www.rsc.org/images/entities/char_2009.gif) : :![[thin space (1/6-em)]](https://www.rsc.org/images/entities/char_2009.gif) 6 6 |
6 | 9 | 1.5 | 0.075 | 15 | 4.53 |
| Orange | 3![[thin space (1/6-em)]](https://www.rsc.org/images/entities/char_2009.gif) : :![[thin space (1/6-em)]](https://www.rsc.org/images/entities/char_2009.gif) 7 7 |
4.5 | 10.5 | 1.5 | 0.075 | 15 | 4.08 |
| Prune | 3![[thin space (1/6-em)]](https://www.rsc.org/images/entities/char_2009.gif) : :![[thin space (1/6-em)]](https://www.rsc.org/images/entities/char_2009.gif) 7 7 |
4.5 | 10.5 | 1.5 | 0.075 | 15 | — |
Each sample was incubated for 9 days under the following conditions, after which cell density was determined (Fig. 3).
• The screw-tube bottles were incubated under aerobic conditions with the lids lightly loosened.
• “Light” in Fig. 3: white fluorescent light (100 μmol m−2 s−1), temperature: 26 °C.
• “Dark” in Fig. 3: temperature: 23 °C.
• “Open” in Fig. 3: screw-tube bottle with the lid lightly loosened.
• “Close” in Fig. 3: screw-tube bottle lid tightly closed.
• Initial cell density: 1.1 × 10⁴ cells per mL.
• E. gracilis was grown under the following four conditions for each food.
“Light/Open”, “Light/Close”, “Dark/Open”, and “Dark/Close”.
2.6. Growth of E. gracilis using vegetable juice as culture medium
Commercial red bell peppers had their spatulas and seeds removed and were pressed by a juicer (Kuvings, model: JSG-621, NUC Electronics Co., Ltd.). A tea strainer removed the fine solid components of the pressed juice. Paprika pressed juice was added to a laboratory run screw tube bottle (No. 5, AS ONE Corporation) in a predetermined volume (Table 3, “Sample”) and purified water was added until the total volume was about half of the container (about 10 mL). These were autoclaved. The washed cell suspension (100 μL) was added to all sample containers in equal volumes, and sterile water was added up to a predetermined volume (Table 3, “Sterile water with cells”).| Sample (juice) | Sample![[thin space (1/6-em)]](https://www.rsc.org/images/entities/char_2009.gif) : :![[thin space (1/6-em)]](https://www.rsc.org/images/entities/char_2009.gif) sterile water sterile water |
Sample [mL] | Sterile water with cellsa [mL] | V.B1 [μg] | V.B12 [μg] | Total [mL] |
|---|---|---|---|---|---|---|
| a Cells washed with sterile water were included. b Amount of V.B1 added is equal to that of CM medium. V.B12 is added in the same volume as KH medium. | ||||||
| Paprika | 1![[thin space (1/6-em)]](https://www.rsc.org/images/entities/char_2009.gif) : :![[thin space (1/6-em)]](https://www.rsc.org/images/entities/char_2009.gif) 9 9 |
1 | 9 | 1.0 | 0.05 | 10 |
2![[thin space (1/6-em)]](https://www.rsc.org/images/entities/char_2009.gif) : :![[thin space (1/6-em)]](https://www.rsc.org/images/entities/char_2009.gif) 8 8 |
2 | 8 | 1.0 | 0.05 | 10 | |
3![[thin space (1/6-em)]](https://www.rsc.org/images/entities/char_2009.gif) : :![[thin space (1/6-em)]](https://www.rsc.org/images/entities/char_2009.gif) 7 7 |
3 | 7 | 1.0 | 0.05 | 10 | |
4![[thin space (1/6-em)]](https://www.rsc.org/images/entities/char_2009.gif) : :![[thin space (1/6-em)]](https://www.rsc.org/images/entities/char_2009.gif) 6 6 |
4 | 6 | 1.0 | 0.05 | 10 | |
5![[thin space (1/6-em)]](https://www.rsc.org/images/entities/char_2009.gif) : :![[thin space (1/6-em)]](https://www.rsc.org/images/entities/char_2009.gif) 5 5 |
5 | 5 | 1.0 | 0.05 | 10 | |
6![[thin space (1/6-em)]](https://www.rsc.org/images/entities/char_2009.gif) : :![[thin space (1/6-em)]](https://www.rsc.org/images/entities/char_2009.gif) 4 4 |
6 | 4 | 1.0 | 0.05 | 10 | |
7![[thin space (1/6-em)]](https://www.rsc.org/images/entities/char_2009.gif) : :![[thin space (1/6-em)]](https://www.rsc.org/images/entities/char_2009.gif) 3 3 |
7 | 3 | 1.0 | 0.05 | 10 | |
8![[thin space (1/6-em)]](https://www.rsc.org/images/entities/char_2009.gif) : :![[thin space (1/6-em)]](https://www.rsc.org/images/entities/char_2009.gif) 2 2 |
8 | 2 | 1.0 | 0.05 | 10 | |
10![[thin space (1/6-em)]](https://www.rsc.org/images/entities/char_2009.gif) : :![[thin space (1/6-em)]](https://www.rsc.org/images/entities/char_2009.gif) 0 0 |
10 | 0 | 1.0 | 0.05 | 10 | |
Each sample was incubated for 12 days under the following conditions before cell density was determined (Fig. 5).
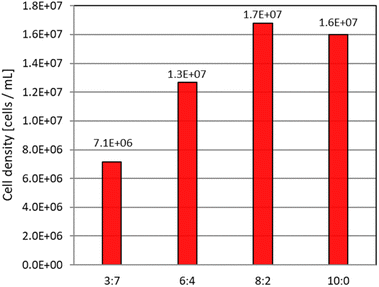 | ||
| Fig. 5 Density of E. gracilis cells in paprika juice as culture medium (12th day). The ratio in the figure shows the volume ratio of paprika juice to sterile water (V.B1 and V.B12 were added). | ||
• Sample tubes were lightly uncovered and incubated under aerobic conditions.
• Light: white fluorescent light (45 μmol m−2 s−1), temperature: 26 °C.
• Dark culture: temperature: 23 °C.
• Initial cell density: 6.3 × 10³ cells per mL.
See Fig. S2 and S3 in the ESI† for pictures of the culture medium and cells at the end of incubation.
2.7. Growth in wine and grape juice medium
As culture vessels, 30 mL sample vessels (screw tube No. 6, φ 30 × 65, AS ONE Corporation) or 50 mL sample vessels (FS media vials, φ 40 × 75, model: T-50, Nippon Electric Glass Co., Ltd.) were used. A predetermined amount of red wine (Table 4, “Sample”) was injected into the culture vessel and the alcohol was removed by hot water boiling. Paprika pressed juice was added to a laboran screw tube bottle (No. 5, AS ONE Corporation) in a predetermined volume (Table 4, “Sample”) and purified water was added until about half of the total volume (Table 4, “Total”). These were autoclaved. The washed cell suspension was added to all sample containers in equal volumes, and sterile water was added up to a predetermined volume (Table 4, “Sterile water with cells”). Each sample was cultured for 9 days under the following conditions and cell density was measured on day 9 (Fig. 6 and 7).| Sample (soft drink) | Sample![[thin space (1/6-em)]](https://www.rsc.org/images/entities/char_2009.gif) : :![[thin space (1/6-em)]](https://www.rsc.org/images/entities/char_2009.gif) sterile water sterile water |
Sample [mL] | Sterile water with cellsa [mL] | V.B1 [μg] | V.B12 [μg] | Total [mL] | pH |
|---|---|---|---|---|---|---|---|
| a Cells washed with sterile water were included. b A predetermined amount of wine was injected into the culture vessel and the alcohol was removed by boiling in hot water. Water evaporated during the removal of alcohol from the sample (red wine) was compensated by sterile water. The amount of V.B1 added was equal to the amount of CM medium. The amount of V.B12 added was equal to that of KH medium. “Red wine” delicious antioxidant-free wine (Fuyoka Red), Kirin Holdings Co. Ltd. “Grape juice” red grape (made by Nagoya Dairy Co., Ltd.). | |||||||
| Red wineb | 2![[thin space (1/6-em)]](https://www.rsc.org/images/entities/char_2009.gif) : :![[thin space (1/6-em)]](https://www.rsc.org/images/entities/char_2009.gif) 8 8 |
10 | 40 | 5 | 0.35 | 50 | 3.27 |
| Grape juice | 3![[thin space (1/6-em)]](https://www.rsc.org/images/entities/char_2009.gif) : :![[thin space (1/6-em)]](https://www.rsc.org/images/entities/char_2009.gif) 7 7 |
15 | 35 | 5 | 0.35 | 50 | 3.23 |
| Red wineb | 1![[thin space (1/6-em)]](https://www.rsc.org/images/entities/char_2009.gif) : :![[thin space (1/6-em)]](https://www.rsc.org/images/entities/char_2009.gif) 9 9 |
3 | 27 | 3 | 0.15 | 30 | 3.36 |
| Red wineb | 2![[thin space (1/6-em)]](https://www.rsc.org/images/entities/char_2009.gif) : :![[thin space (1/6-em)]](https://www.rsc.org/images/entities/char_2009.gif) 8 8 |
6 | 24 | 3 | 0.15 | 30 | 3.27 |
| Red wineb | 3![[thin space (1/6-em)]](https://www.rsc.org/images/entities/char_2009.gif) : :![[thin space (1/6-em)]](https://www.rsc.org/images/entities/char_2009.gif) 7 7 |
9 | 21 | 3 | 0.15 | 30 | 3.24 |
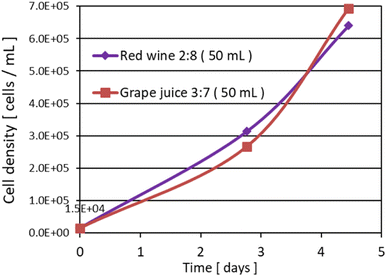 | ||
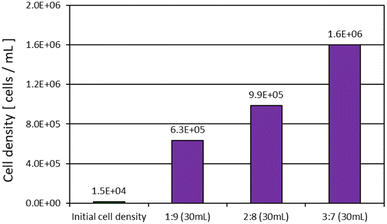
Fig. 6 Growth curve in the early stage of growth. The ratio in the figure indicates the volume ratio of “Sample![[thin space (1/6-em)]](https://www.rsc.org/images/entities/char_2009.gif) : :![[thin space (1/6-em)]](https://www.rsc.org/images/entities/char_2009.gif) Sterile water”. Total volume of each sample is 50 mL (V.B1 and V.B12 were added). Sterile water”. Total volume of each sample is 50 mL (V.B1 and V.B12 were added). | ||
• The sample tubes were lightly uncovered and incubated under aerobic conditions.
• Light irradiation conditions: constant white fluorescent light (40 μmol m−2 s−1), temperature: 26 °C.
• Initial cell density: 1.5 × 10⁴ cells per mL.
2.8. Growth in tomato juice cultures without essential vitamins
In the tomato juice medium where good growth can be obtained, an experiment was conducted in the case of no addition of essential vitamins. Cell suspensions grown to steady state were washed with sterile water. However, for this test only, three washes were performed to fully remove the original culture medium (including essential vitamins) from the transplants. Vial bottles (FS media vial (φ 55 × 85), model number: T-150, Nippon Electric Glass Co., Ltd.) were autoclaved. Tomato juice (tomato juice – no salt added, Kagome Co,. Ltd.) was opened in a clean bench and a predetermined amount (Table 5, “Sample”) was added to the vial without autoclaving. The washed cell suspension was added to all sample containers in equal volumes, and sterile water was added up to a predetermined volume (Table 5, “Sterile water with cells”).Each sample was cultured under the following conditions and cell density was measured on day 9 from the start of culture (Fig. 9).
• The sample tubes were lightly uncovered and incubated under aerobic conditions.
• Light irradiation conditions: white fluorescent light (40 μmol m−2 s−1), temperature: 25 °C.
• Initial cell density: 2.9 × 10⁴ cells per mL.
2.9. Effect of solids in tomato juice solution on growth
Fig. 8 suggests that tomato juice diluted with water and added with essential vitamins in the culture medium limits the amount of space and light available for E. gracilis growth because tomato solids are deposited in the lower layers of the medium. Therefore, we checked the growth in liquid-only tomato juice from which the solid component was removed from tomato juice. The growth of E. gracilis in a medium to which glutamic acid, a nutrient characteristic of tomatoes, was added in place of the tomato juice was also confirmed. Glutamic acid is a growth-beneficial amino acid that is used as both a carbon and nitrogen source in the growth of E. gracilis, it is found in KH medium, and its amount is about 10 times higher than other amino acids found in KH medium. The amount of glutamic acid added was determined to be approximately equivalent to this amount (Table 6). In laboran screw tube bottles (No. 5, AS ONE Corporation), various culture media were prepared according to the composition in Table 6 and then autoclaved.| Sample | Sample amount | Sterile water [μL] | V.B1 [μg] | V.B12 [μg] | Total [mL] | pH |
|---|---|---|---|---|---|---|
| a Amounts of V.B1, V.B12, and glutamic acid added were equal to those in KH medium. b Tomato (filtered): tomato juice (ideal tomato, ITO EN, Ltd.) filtered through filter paper (FILTER PAPER No. 2, Toyo Roshi Kaisha, Ltd.). c Glutamic acid: L-glutamic acid (FUJIFILM Wako Pure Chemical Corporation). | ||||||
| CM (control) | 3 [mL] | — | — | — | 3 | 3.50 |
| Tomato | 900 [μL] | 2100 | 0 | 0.015 | 3 | 4.55 |
| Tomato (filtered)b | 900 [μL] | 2100 | 0 | 0.015 | 3 | 4.54 |
| Glutamic acid | 0.01 [g] | 3000 | 7.5 | 0.015 | 3 | 3.17 |
E. gracilis cell suspensions (2.4 × 10⁵ cells per mL) cultured in CM medium for 4 days were transferred to 60 μL of each sample culture medium and cultured for 9 days under the following conditions.
• The sample tubes were lightly uncovered and incubated under aerobic conditions.
• Light: White fluorescent light (90–95 μmol m−2 s−1), temperature: 23.7–26.5 °C.
• Initial cell density: 4.8 × 10³ cells per mL.
2.10. Culture using different brands of tomato juice
E. gracilis grew well in cultures with tomato juice. Therefore, we cultured E. gracilis using four different brands of tomato juice.In laboran screw tube bottles (No. 5, AS ONE Corporation), various culture media were prepared according to the composition in Table 7 and then autoclaved.
| Sample (juice) | Sample![[thin space (1/6-em)]](https://www.rsc.org/images/entities/char_2009.gif) : :![[thin space (1/6-em)]](https://www.rsc.org/images/entities/char_2009.gif) sterile water sterile water |
Sample [g] | Purified water [g] | V.B1 [μg] | V.B12 [μg] | Total [g] | pH |
|---|---|---|---|---|---|---|---|
| a Tomato 1: ideal tomato (ITO EN, Ltd.) cf. same as “Tomato” in Tables 2, 3 and 6, and Fig. 2, 3 and 11. Tomato 2: tomato juice – no salt added (Kagome Co, Ltd.) cf. same as “Tomato” in Table 5, and Fig. 8 and 9. Tomato 3: tomato juice – no salt added, Del monte Quality (Kikkoman Corporation). Tomato 4: tomato juice – no salt added, Rich lycopene (Kagome Co, Ltd.). The amount of V.B1 added was equal to the amount of CM medium. The amount of V.B12 added was equal to that of KH medium. | |||||||
| CM | — | 3.0 | — | — | — | 3.0 | 3.50 |
| KH | — | 3.0 | — | — | — | 3.0 | 3.50 |
| Tomato 1 | 3![[thin space (1/6-em)]](https://www.rsc.org/images/entities/char_2009.gif) : :![[thin space (1/6-em)]](https://www.rsc.org/images/entities/char_2009.gif) 7 7 |
0.9 | 2.1 | 0.3 | 0.015 | 3.0 | 4.55 |
| Tomato 1 | 4![[thin space (1/6-em)]](https://www.rsc.org/images/entities/char_2009.gif) : :![[thin space (1/6-em)]](https://www.rsc.org/images/entities/char_2009.gif) 6 6 |
1.2 | 1.8 | 0.3 | 0.015 | 3.0 | 4.53 |
| Tomato 2 | 3![[thin space (1/6-em)]](https://www.rsc.org/images/entities/char_2009.gif) : :![[thin space (1/6-em)]](https://www.rsc.org/images/entities/char_2009.gif) 7 7 |
0.9 | 2.1 | 0.3 | 0.015 | 3.0 | 4.50 |
| Tomato 2 | 4![[thin space (1/6-em)]](https://www.rsc.org/images/entities/char_2009.gif) : :![[thin space (1/6-em)]](https://www.rsc.org/images/entities/char_2009.gif) 6 6 |
1.2 | 1.8 | 0.3 | 0.015 | 3.0 | 4.48 |
| Tomato 3 | 3![[thin space (1/6-em)]](https://www.rsc.org/images/entities/char_2009.gif) : :![[thin space (1/6-em)]](https://www.rsc.org/images/entities/char_2009.gif) 7 7 |
0.9 | 2.1 | 0.3 | 0.015 | 3.0 | 4.47 |
| Tomato 3 | 4![[thin space (1/6-em)]](https://www.rsc.org/images/entities/char_2009.gif) : :![[thin space (1/6-em)]](https://www.rsc.org/images/entities/char_2009.gif) 6 6 |
1.2 | 1.8 | 0.3 | 0.015 | 3.0 | 4.45 |
| Tomato 4 | 3![[thin space (1/6-em)]](https://www.rsc.org/images/entities/char_2009.gif) : :![[thin space (1/6-em)]](https://www.rsc.org/images/entities/char_2009.gif) 7 7 |
0.9 | 2.1 | 0.3 | 0.015 | 3.0 | 4.49 |
| Tomato 4 | 4![[thin space (1/6-em)]](https://www.rsc.org/images/entities/char_2009.gif) : :![[thin space (1/6-em)]](https://www.rsc.org/images/entities/char_2009.gif) 6 6 |
1.2 | 1.8 | 0.3 | 0.015 | 3.0 | 4.47 |
E. gracilis cell suspensions (9.8 × 10⁵ cells per mL) cultured in CM medium for 13 days were transferred to 30 μL of each sample culture medium and cultured for 10 days under the following conditions. All samples were made in duplicate (only “Tomato 1 (4![[thin space (1/6-em)]](https://www.rsc.org/images/entities/char_2009.gif) :
:![[thin space (1/6-em)]](https://www.rsc.org/images/entities/char_2009.gif) 6)” made three) and cell densities were measured on day 10 (Fig. 12).
6)” made three) and cell densities were measured on day 10 (Fig. 12).
• The sample tubes were lightly uncovered and incubated under aerobic conditions.
• Light: white fluorescent light (90 μmol m−2 s−1), temperature: 26.0–27.4 °C.
• Initial cell density: 9.8 × 10³ cells per mL.
3. Results and discussions
3.1. Stationary phase cell density in synthetic media
Fig. 1 shows that the steady-state cell density in CM medium was on the order of 106 cells per mL, while in KH medium it was on the order of 107 cells per mL. Although the prior literature agrees on the order of steady-state cell density in each of these media, the results in Fig. 1 are all about half of the literature values.30,31 This is likely due to the agitation of the culture conditions in the prior literature. In this study, cultures in the culture medium with food, described below, were incubated statically for around 10 days, so in the experiment in Fig. 1, the culture was continued statically until the 8th day after the start of culture, and after the 8th day, agitation was done only when measuring for cell counting. In both media, there was a change in cell density that increased after 8 days of agitation.3.2. Growth of E. gracilis using soft drink as culture medium
Fig. 2 and 3 show that the steady-state cell density in each food does not change significantly with or without autoclave treatment. Therefore, it is beneficial to autoclave food-containing media for hygiene and efficiency of culture medium preparation. In Fig. 3, the cell density was significantly higher in the “Light/Open” condition than in the “Light/Close” condition for tomato juice, but for the samples other than tomato juice, the “Light/Close” condition showed almost the same good growth as the “Light/Open” condition. However, the cell density of tomato juice “Light/Close” is greater than that of other food samples, indicating that good enough growth was achieved. The visual appearance of the cells in the culture medium, whether closed or open, was green in the light condition and white in the dark condition; in terms of cost, “Tomato juice (3![[thin space (1/6-em)]](https://www.rsc.org/images/entities/char_2009.gif) :
:![[thin space (1/6-em)]](https://www.rsc.org/images/entities/char_2009.gif) 7)” is about 1.2 times more economical than CM medium, because the cell density is 10 times higher.
7)” is about 1.2 times more economical than CM medium, because the cell density is 10 times higher.
In terms of cell coloration, E. gracilis grown in tomato juice was found to have bright green chloroplasts densely packed inside the cells, similar in size and shape to those grown in CM medium (Fig. S2 and S3 in the ESI,†cf.Fig. 12). On the other hand, some cells grown in beverages other than tomato juice had slightly less chloroplasts or a lighter green. This indicates that, compared to other beverages, tomato juice contains a good balance of the types and amounts of vitamins and trace elements suitable for the growth of E. gracilis (Table S4 in the ESI†). In the absence of light, the growing cells were light yellow-green in all samples.
3.3. Growth of E. gracilis using vegetable juice as culture medium
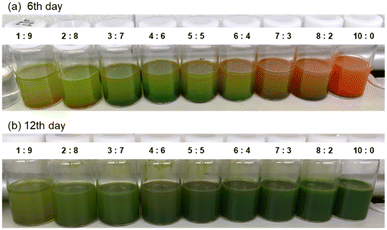
In all samples, cell proliferation was observed. On the sixth day of culture, as in the case of commercial beverages, good growth was obtained at a volume ratio of “Paprika juice![[thin space (1/6-em)]](https://www.rsc.org/images/entities/char_2009.gif) :
:![[thin space (1/6-em)]](https://www.rsc.org/images/entities/char_2009.gif) Sterile water” of “3
Sterile water” of “3![[thin space (1/6-em)]](https://www.rsc.org/images/entities/char_2009.gif) :
:![[thin space (1/6-em)]](https://www.rsc.org/images/entities/char_2009.gif) 7” or “4
7” or “4![[thin space (1/6-em)]](https://www.rsc.org/images/entities/char_2009.gif) :
:![[thin space (1/6-em)]](https://www.rsc.org/images/entities/char_2009.gif) 6” (Fig. 4a). A dramatic colour change (from red to green) was observed in the culture medium, similar to that of tomato juice; the red pigment in red paprika is mainly derived from the xanthophyll capsanthin,32 which, like lycopene in tomatoes, has high antioxidant capacity.33
6” (Fig. 4a). A dramatic colour change (from red to green) was observed in the culture medium, similar to that of tomato juice; the red pigment in red paprika is mainly derived from the xanthophyll capsanthin,32 which, like lycopene in tomatoes, has high antioxidant capacity.33
Continued observation showed that the steady state was reached sequentially from the lowest to the highest concentration of paprika juice solution, and the 100% concentration reached the steady state 12 days after the start of incubation (Fig. 4b).
3.4. Growth in wine and grape juice medium
It was found that the same good growth was obtained in red wine as in the juice solution if the alcohol was removed. However, as the growth progressed with red wine, the odor of algae became stronger. Grape juice, on the other hand, had a wine-like aroma. In addition, the odor of algae was masked in citrus fruits such as pineapple or orange because the substrate food itself had a strong, fresh aroma. For the concentration of red wine, the best growth was obtained at a “3![[thin space (1/6-em)]](https://www.rsc.org/images/entities/char_2009.gif) :
:![[thin space (1/6-em)]](https://www.rsc.org/images/entities/char_2009.gif) 7” ratio of “Red wine
7” ratio of “Red wine![[thin space (1/6-em)]](https://www.rsc.org/images/entities/char_2009.gif) :
:![[thin space (1/6-em)]](https://www.rsc.org/images/entities/char_2009.gif) Water” by volume, showing the same trend as the other beverages.
Water” by volume, showing the same trend as the other beverages.
3.5. Growth in tomato juice cultures without essential vitamins
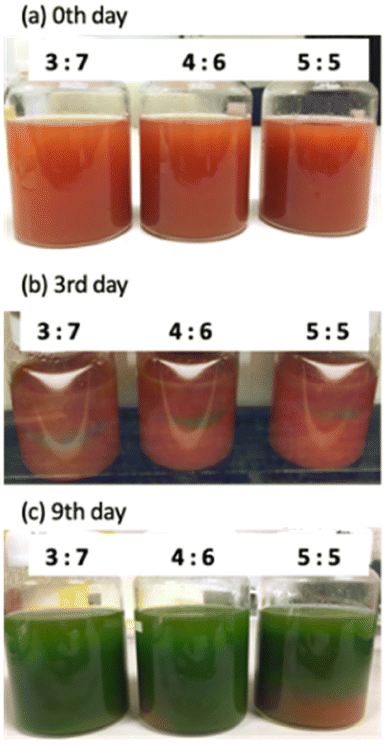
Fig. 9 shows that E. gracilis reached a cell density about 100 times higher than the initial cell density in each concentration of tomato juice medium, even though the medium contained no V.B12. This suggests that the nutrient composition of the tomato juice solution was suitable for the growth of E. gracilis, which in turn promoted growth. However, repeated transplanting in tomato juice medium without any essential vitamins results in a lack of cell proliferation (data not shown). Therefore, it can be said that growth inhibition due to long-term V.B12 restriction cannot be compensated for by other nutrients. It should be noted that protein, lipid, DNA, and paramylon levels are known to increase 2.0, 1.8, 4.2, and 3.0-fold, respectively, in V.B12-restricted cells.15 This method, which enables good growth under V.B12-limited conditions, could be an efficient way to produce paramylon, which is highly valuable as a functional food. As a characteristic of growth during static incubation, a solid tomato juice precipitation layer (lower layer) and an aqueous solution layer (upper layer) were formed in the container, and cells were observed to grow around the boundaries of these layers (Fig. 8c). Since the higher the juice concentration, the more solids are expected to be present, it is expected that the cell density will be greater with moderate agitation and efficient dispersion of nutrients, wastes, light, etc.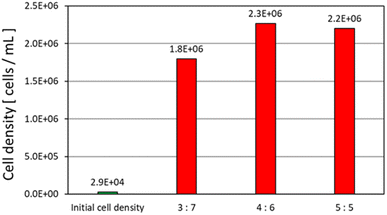 | ||
Fig. 9 Cell density in medium without essential vitamins (9th day). The ratio in the figure indicates the volume ratio of “tomato juice![[thin space (1/6-em)]](https://www.rsc.org/images/entities/char_2009.gif) : :![[thin space (1/6-em)]](https://www.rsc.org/images/entities/char_2009.gif) sterile water”. Neither V.B1 nor V.B12 were added. sterile water”. Neither V.B1 nor V.B12 were added. | ||
3.6. Effect of solids in tomato juice solution on growth of E. gracilis
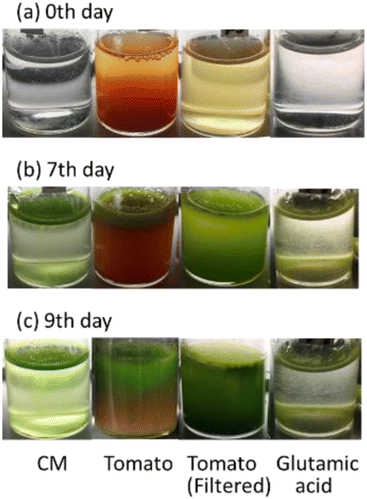
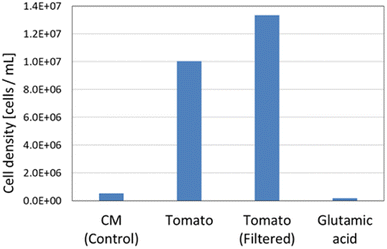
Fig. 10 shows that in the “Tomato (filtered)” culture, in which the solid component was removed from the tomato juice, the cells were distributed throughout the culture medium, whereas in the “Tomato” culture, in which the solid component was not removed, the cells were distributed in the upper part of the culture medium and were almost absent in the lower layers, where the solid material was accumulated.In Fig. 11, the cell density of “Tomato (filtered)” was greater than that of “Tomato”, suggesting that the removal of solid components may mitigate the limiting factor due to the density effect of E. gracilis (growing space, acquisition of light levels and nutrients, and accumulation of wastes). In addition, V.B1 does not necessarily need to be added in tomato juice medium, as the steady-state cell density in this experiment was comparable to that in KH medium (107 cells per mL), despite the fact that V.B1, an essential vitamin, was not added. The cell density of “Glutamic acid” in Fig. 11 is lower than that of the CM medium. This indicates that good growth cannot be achieved with glutamic acid (carbon and nitrogen source) alone.
The results of growth in CM medium with glutamic acid or Ajinomoto® (a chemical seasoning based on monosodium glutamate) instead of water as a solvent showed that the cell density reached 2 to 3 times that of CM medium (see Table S3, Fig. S1 in the ESI†). However, this cell density was about half that of tomato juice medium, suggesting that components in tomato juice other than glutamic acid (or monosodium glutamate) also contribute to good growth.
3.7. Culture using different brands of tomato juice
Fig. 12 shows the appearance of each sample culture medium at the start of culture and after 10 days, and micrographs after 10 days. In all brands and concentrations of tomato juice culture medium, the cells were found to be densely packed with bright green chloroplasts, similar in size and shape to E. gracilis grown on synthetic media (CM, KH medium). In terms of cell coloration, cells grown in all tomato juices are slightly darker green than cells grown in CM medium, which is the same as cells grown in KH medium.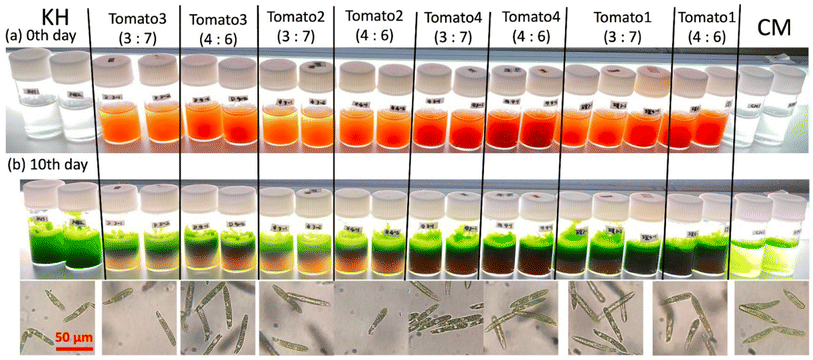 | ||
| Fig. 12 Culture medium and cells in different brands of tomato juice medium. A scale bar is the same size for all micrographs. | ||
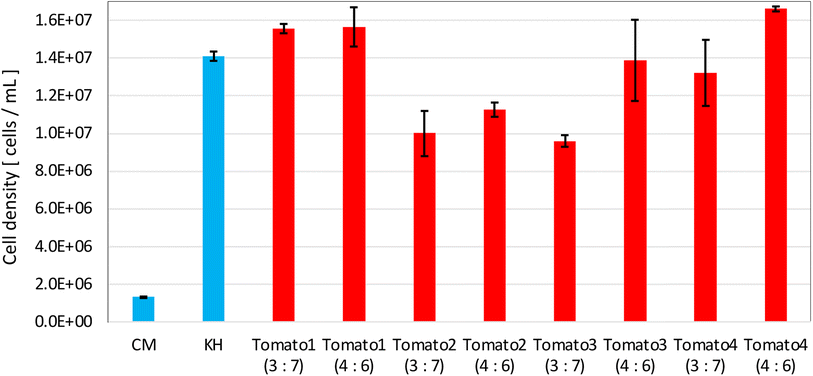
Fig. 13 shows the cell density of E. gracilis in the well-stirred culture medium of each sample in Fig. 12(b). For all brands of tomato juice, “Tomato juice![[thin space (1/6-em)]](https://www.rsc.org/images/entities/char_2009.gif) :
:![[thin space (1/6-em)]](https://www.rsc.org/images/entities/char_2009.gif) Sterile water = 4
Sterile water = 4![[thin space (1/6-em)]](https://www.rsc.org/images/entities/char_2009.gif) :
:![[thin space (1/6-em)]](https://www.rsc.org/images/entities/char_2009.gif) 6” shows growth to the order of 107 cells per mL, which is the cell density in KH medium. “Tomato 3 (3
6” shows growth to the order of 107 cells per mL, which is the cell density in KH medium. “Tomato 3 (3![[thin space (1/6-em)]](https://www.rsc.org/images/entities/char_2009.gif) :
:![[thin space (1/6-em)]](https://www.rsc.org/images/entities/char_2009.gif) 7)” had the lowest cell density among these, but it was still larger than the cell densities in Fig. 2 and 3 when grown in the other beverages. From the above, it appears that the cell density in the stationary phase is more influenced by the type of juice than by the brand of juice. For “Tomato 1”, tests were conducted in 2017 (Fig. 2 and 3), 2021 (Fig. 11), and 2023 (Fig. 13), and tomato juice was purchased each time. The fact that these results are almost identical suggests that the variation in quality in the same brand is small. This is likely because all manufacturers set the concentration of their juices according to people's tastes, so unless they are made by a special process or concentrated, they do not differ significantly.
7)” had the lowest cell density among these, but it was still larger than the cell densities in Fig. 2 and 3 when grown in the other beverages. From the above, it appears that the cell density in the stationary phase is more influenced by the type of juice than by the brand of juice. For “Tomato 1”, tests were conducted in 2017 (Fig. 2 and 3), 2021 (Fig. 11), and 2023 (Fig. 13), and tomato juice was purchased each time. The fact that these results are almost identical suggests that the variation in quality in the same brand is small. This is likely because all manufacturers set the concentration of their juices according to people's tastes, so unless they are made by a special process or concentrated, they do not differ significantly.
3.8. Comparison of amino acid content in foods with good growth and Euglena
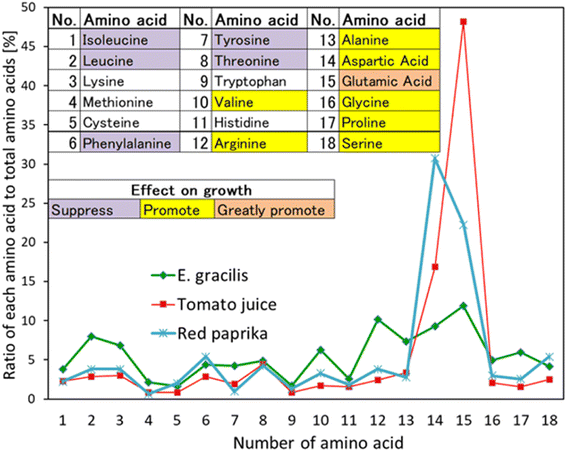
Two of the foods handled in each case, tomato juice and red paprika, which showed particularly good growth, were compared to Euglena with respect to the amino acid composition (Fig. 12).The numbers on the horizontal axis of Fig. 14 indicate the 18 amino acids, and the table at the top of the figure is the corresponding table. The three colours in the table correspond to the respective colours of “Effect on growth” in the figure.15 The vertical axis of the figure shows the percentage of each of the 18 individual amino acids relative to the total weight of the 18 amino acids in 100 g of edible portion of a food. The amino acid composition of Euglena was analyzed by the Japan Food Analysis Center.34 For other foods, the amino acid composition table per 100 g of edible portion of the Japanese Standard Tables of Food Composition 2015 (7th revision), Chapter 2, Table 1, Amino Acid Composition Table, which was applicable at the time this study was conducted, was referenced. However, the experiments in Fig. 10, 11 and S1 (see ESI†) were conducted after 2020, but the data (amino acid composition per 100 g edible portion) of the foods used were exactly the same in the 2020 edition of the Standard Tables of Food Composition in Japan, which was applied at that time, so they are not distinguished.
Foods that had good growth are characterized by a high content of glutamic acid (No. 15) and aspartic acid (No. 14). These are amino acids that promote growth in Euglena, especially glutamic acid, which can be used as both a carbon and nitrogen source,15 indicating that its abundance is favorable for growth. The correlation coefficients for the amino acid composition of Euglena are 0.65 for tomato juice and 0.64 for red bell pepper, indicating a positive correlation. The synthetic medium CM medium contains 13 chemicals and the KH medium contains 26 chemicals. Estimating the price of the culture medium, KH medium is about 7.7 times more expensive than CM medium, and the cell density in the stationary phase is about 10 times higher than that. In this method using tomato juice solution, the culture medium containing two nutrient sources (tomato juice solution and V.B12) is 1.2 times the cost of CM medium (1/6 of KH medium) yet allows the cells to reach a cell density similar to that of KH medium. Thus, this is a more easily adjusted and less expensive culture medium than conventional synthetic media.
4. Conclusions
It was confirmed that E. gracilis grew to a greater cell density in a medium prepared by the simple method of diluting a beverage that people consume daily with water to an appropriate concentration (beverage![[thin space (1/6-em)]](https://www.rsc.org/images/entities/char_2009.gif) :
:![[thin space (1/6-em)]](https://www.rsc.org/images/entities/char_2009.gif) water = 3
water = 3![[thin space (1/6-em)]](https://www.rsc.org/images/entities/char_2009.gif) :
:![[thin space (1/6-em)]](https://www.rsc.org/images/entities/char_2009.gif) 7) and adding essential vitamins to it than in the CM medium. Especially in four different brands of tomato juice solution, E. gracilis was able to grow to a cell density (107 cells per mL) comparable to that of KH medium, although the raw material cost of the tomato juice solution was 1/6 of KH medium. The nutrient of tomato juice is characterized by its extremely high content of glutamic acid, which is used as both a carbon and nitrogen source for E. gracilis growth. However, the addition of glutamic acid to the CM medium alone did not produce as much growth as the tomato juice medium. It was also observed that the cultures with tomato juice grew to 100 times the cell density at the time of transplanting, even without the addition of the essential vitamin V.B12. Therefore, the composition of the ingredients in tomato juice may be more suitable for the growth of E. gracilis than in other foods. In this study, we observed cell density and cell appearance, but it is expected that examining the composition of cells grown in the culture medium of each beverage will contribute to the efficient production of more beneficial substances. This method can further reduce costs by eliminating the conventional processes (stirring, collection, drying, and food processing) in the production of processed foods from E. gracilis. In addition, because it is a culture medium of plant food components, it can be offered to vegetarians, and because it does not use genetic modification technology, it is a food nutrient enhancement technology with broad applicability.
7) and adding essential vitamins to it than in the CM medium. Especially in four different brands of tomato juice solution, E. gracilis was able to grow to a cell density (107 cells per mL) comparable to that of KH medium, although the raw material cost of the tomato juice solution was 1/6 of KH medium. The nutrient of tomato juice is characterized by its extremely high content of glutamic acid, which is used as both a carbon and nitrogen source for E. gracilis growth. However, the addition of glutamic acid to the CM medium alone did not produce as much growth as the tomato juice medium. It was also observed that the cultures with tomato juice grew to 100 times the cell density at the time of transplanting, even without the addition of the essential vitamin V.B12. Therefore, the composition of the ingredients in tomato juice may be more suitable for the growth of E. gracilis than in other foods. In this study, we observed cell density and cell appearance, but it is expected that examining the composition of cells grown in the culture medium of each beverage will contribute to the efficient production of more beneficial substances. This method can further reduce costs by eliminating the conventional processes (stirring, collection, drying, and food processing) in the production of processed foods from E. gracilis. In addition, because it is a culture medium of plant food components, it can be offered to vegetarians, and because it does not use genetic modification technology, it is a food nutrient enhancement technology with broad applicability.
Author contributions
Conceptualization, K. Yamashita; methodology, K. Yamashita and E. Tokunaga; formal analysis, K. Yamashita; investigation, K. Yamashita; resources, K. Yamashita, K. Yamada, K. Suzuki, and E. Tokunaga; data curation, K. Yamashita; writing—original draft preparation, K. Yamashita; writing—review and editing, K. Yamashita, K. Yamada, K. Suzuki and E. Tokunaga; visualization, K. Yamashita; supervision, K. Yamashita and E. Tokunaga; project administration, K. Yamashita and E. Tokunaga. All authors have read and agreed to the published version of the manuscript.Conflicts of interest
There are no conflicts to declare.References
- P. Spolaore, C. Joannis-Cassan, E. Duran and A. Isambert, J. Biosci. Bioeng., 2006, 101, 87–96 CrossRef CAS PubMed.
- O. Pulz and W. Gross, Appl. Microbiol. Biotechnol., 2004, 65, 635–648 CrossRef CAS PubMed.
- J. J. Wolken, Euglena : an experimental organism for biochemical and biophysical studies, Appleton-Century-Crofts, 2nd edn, 1967 Search PubMed.
- R. Harada, T. Nomura, K. Yamada, K. Mochida and K. Suzuki, Front. Bioeng. Biotechnol., 2020, 8, 790 CrossRef PubMed.
- K. Suzuki, S. Mitra, O. Iwata, T. Ishikawa, S. Kato and K. Yamada, Biosci., Biotechnol., Biochem., 2015, 79, 1730–1736 CrossRef CAS PubMed.
- S. Kitaoka and K. Hosotani, J. Agric. Chem. Soc. Jpn., 1977, 51(8), 477–482 CAS.
- K. Yasuda, M. Ogushi, A. Nakashima, Y. Nakano and K. Suzuki, In Vivo, 2018, 32, 799–805 CrossRef CAS PubMed.
- M. Evans, P. H. Falcone, D. C. Crowley, A. M. Sulley, M. Campbell, N. Zakaria, J. A. Lasrado, E. P. Fritz and K. A. Herrlinger, Nutrients, 2019, 11, 2926 CrossRef PubMed.
- A. Sugiyama, K. Suzuki, S. Mitra, R. Arashida, E. Yoshida, R. Nakano, Y. Yabuta and T. Takeuchi, J. Vet. Med. Sci., 2009, 71, 885–890 CrossRef CAS PubMed.
- A. Sugiyama, S. Hata, K. Suzuki, E. Yoshida, R. Nakano, S. Mitra, R. Arashida, Y. Asayama, Y. Yabuta and T. Takeuchi, J. Vet. Med. Sci., 2010, 72, 755–763 CrossRef CAS PubMed.
- A. Nakashima, K. Suzuki, Y. Asayama, M. Konno, K. Saito, N. Yamazaki and H. Takimoto, Biochem. Biophys. Res. Commun., 2017, 494, 379–383 CrossRef CAS PubMed.
- K. Suzuki, A. Nakashima, M. Igarashi, K. Saito, M. Konno, N. Yamazaki and H. Takimoto, PLoS One, 2018, 13, e0191462 CrossRef PubMed.
- T. Watanabe, R. Shimada, A. Matsuyama, M. Yuasa, H. Sawamura, E. Yoshida and K. Suzuki, Food Funct., 2013, 4, 1685–1690 RSC.
- M. Cramer and J. Myers, Arch. Mikrobiol., 1952, 17, 384–402 CAS.
- S. Kitaoka, Euglena: Physiology and Biochemistry, Academic Press Center, Tokyo, 1989 Search PubMed.
- S. H. Hutner, L. Provasoli, E. L. R. Stokstad, C. E. Hoffmann, M. Belt, A. L. Franklin and T. H. Jukes, Proc. Soc. Exp. Biol. Med., 1949, 70, 118–120 CrossRef CAS PubMed.
- S. D. Schwartzbach and S. Shigeoka, Euglena: Biochemistry, Cell and Molecular Biology, Springer, 2017 Search PubMed.
- L. Brennan and P. Owende, Renewable Sustainable Energy Rev., 2010, 14, 557–577 CrossRef CAS.
- M. Ishikawa, T. Nomura, S. Tamaki, K. Ozasa, T. Suzuki, K. Toyooka, K. Hirota, K. Yamada, K. Suzuki and K. Mochida, Plant Biotechnol. J., 2022, 20, 2042–2044 CrossRef CAS PubMed.
- S. Muramatsu, K. Atsuji, K. Yamada, K. Ozasa, H. Suzuki, T. Takeuchi, Y. Hashimoto-Marukawa, Y. Kazama, T. Abe, K. Suzuki and O. Iwata, PeerJ, 2020, 8, e10002 CrossRef PubMed.
- M. Aman Mohammadi, M. R. Maximiano, S. M. Hosseini and O. L. Franco, Bioprocess Biosyst. Eng., 2023, 46, 483–497 CrossRef CAS PubMed.
- K. Suzuki, Dr. Midorimushi's Super Entrepreneurial Thinking: How to Change the World Talked by the Strongest Researcher of Euglena, Nikkei Business Publications, 2021 Search PubMed.
- B. Šantek, M. Felski, K. Friehs, M. Lotz and E. Flaschel, Eng. Life Sci., 2010, 10, 165–170 Search PubMed.
- F. Ivušić and B. Šantek, Bioprocess Biosyst. Eng., 2015, 38, 1103–1112 CrossRef PubMed.
- S. Kim, D. Lee, D. Lim, S. Lim, S. Park, C. Kang, J. Yu and T. Lee, Algal Res., 2020, 47, 101826 CrossRef.
- Amit and U. K. Ghosh, J. Environ. Chem. Eng., 2019, 7, 103135 CrossRef CAS.
- A. P. Asiandu, A. P. Nugroho, A. S. Naser, B. R. Sadewo, M. D. Koerniawan, A. Budiman, U. J. Siregar, S. Suwanti and E. A. Suyono, Curr. Appl. Sci. Technol., 2023, 23(2) DOI:10.55003/cast.2022.02.23.010.
- Rubiyatno, T. Matsui, K. Mori and T. Toyama, Bioresour. Technol. Rep., 2021, 15, 100735 CrossRef CAS.
- S. Kim, R. Wirasnita, D. Lee, J. Yu and T. Lee, Appl. Sci., 2021, 11, 8182 CrossRef CAS.
- S. Shibata, S. Arimura, T. Ishikawa and K. Awai, Front. Plant Sci., 2018, 9, 370 CrossRef PubMed.
- T. Tomiyama, K. Goto, Y. Tanaka, T. Maruta, T. Ogawa, Y. Sawa, T. Ito and T. Ishikawa, PLoS One, 2019, 14, e0210755 CrossRef CAS PubMed.
- J.-S. Kim, T.-Y. Ha, S. Kim, S.-J. Lee and J. Ahn, J. Funct. Foods, 2017, 31, 131–140 CrossRef CAS.
- S. Agarwal and A. V. Rao, Can. Med. Assoc. J., 2000, 163, 739–744 CAS.
- Nutrients contained in Euglena and their nutritional value, https://www.eu-glena.net/eiyou/, accessed 12 April 2023 Search PubMed.
Footnote |
| † Electronic supplementary information (ESI) available. See DOI: https://doi.org/10.1039/d3fb00086a |
| This journal is © The Royal Society of Chemistry 2023 |

