Influence of sugarcane bagasse fibre on the properties of sweet lime peel- and polyvinyl alcohol-based biodegradable films
Received
16th April 2023
, Accepted 19th June 2023
First published on 19th June 2023
Abstract
Sugarcane bagasse is a readily available agro-waste, which can be found across the world and has been used in a wide range of applications. One of the applications is to use this waste as a reinforcing material in bio-based composites. The purpose of the present study was to develop a sweet lime peel powder (SLPP) and polyvinyl alcohol (PVOH) based biodegradable film by incorporating fibre from sugarcane bagasse. The film forming solution was made using SLPP and PVOH (1![[thin space (1/6-em)]](https://www.rsc.org/images/entities/char_2009.gif) :1) and sugarcane bagasse fibre (SBF) was added into the solution in varying proportions (0, 25, 50, 75 and 100 wt% of SLPP) and the biodegradable film was made using the casting method. The mechanical and barrier properties of the film samples were investigated. It was concluded that adding 25% fibre enhanced water vapor permeability (1.53 ± 0.03 10−7 g Pa−1 h−1 m−1) along with improvement in the tensile strength (0.947 ± 0.446 MPa) and elongation at break (11.35 ± 0.009%) of the film compared with the film prepared without SBF. For solubility, the film with 100% SBF showed the least solubility (34.92 ± 0.50%) because of a higher percentage of fibre. The films with 50%, 75% and 100% showed less tensile strength and elongation at break because of the separation of the phase of fibre, SLPP and the PVOH matrix. SEM analysis revealed smooth SLPP and SBF dispersion throughout the film matrix as well. Several characteristic peaks of the functional groups were found in FTIR analysis. The incorporation of SBF in the SLPP based film forming solution improved the overall film properties making it ideal for food packaging applications.
:1) and sugarcane bagasse fibre (SBF) was added into the solution in varying proportions (0, 25, 50, 75 and 100 wt% of SLPP) and the biodegradable film was made using the casting method. The mechanical and barrier properties of the film samples were investigated. It was concluded that adding 25% fibre enhanced water vapor permeability (1.53 ± 0.03 10−7 g Pa−1 h−1 m−1) along with improvement in the tensile strength (0.947 ± 0.446 MPa) and elongation at break (11.35 ± 0.009%) of the film compared with the film prepared without SBF. For solubility, the film with 100% SBF showed the least solubility (34.92 ± 0.50%) because of a higher percentage of fibre. The films with 50%, 75% and 100% showed less tensile strength and elongation at break because of the separation of the phase of fibre, SLPP and the PVOH matrix. SEM analysis revealed smooth SLPP and SBF dispersion throughout the film matrix as well. Several characteristic peaks of the functional groups were found in FTIR analysis. The incorporation of SBF in the SLPP based film forming solution improved the overall film properties making it ideal for food packaging applications.
Sustainability spotlight
Biodegradable packaging films were developed using sugarcane bagasse fibre. The effects of sugarcane bagasse fibre on sweet lime peel powder and polyvinyl alcohol based biodegradable films were studied. Sugarcane bagasse fibre was successfully incorporated into a sweet lime peel powder and polyvinyl alcohol based biodegradable film matrix. The incorporation of sugarcane bagasse fibre improved the film barrier and mechanical properties.
|
1 Introduction
Bagasse from sugarcane is a dry pulpy fibrous material obtained in vast quantities from sugar and alcohol industries all over the world. In 2020, globally around 1869.71 million metric tons of sugarcane was produced1 and generally, 1 tonne of sugarcane yields approximately 280 kg of bagasse.2 The primary elements of sugarcane bagasse, according to an analysis, are cellulose, hemicellulose, lignin, ash, and wax.3 These chemical compositions of the sugarcane bagasse make it an excellent element for use as a reinforcing fibre in composite materials to create biomaterials with unique physical and chemical properties. Although there are wide varieties of biopolymers such as cellulose, starch, chitin and chitosan available which can be used to develop biodegradable films, because of the hydrophilic nature of these biopolymers, these biodegradable films have poor barrier properties.4
The cellulose from sugarcane bagasse can improve the barrier properties and biocompatibility and reinforce strength of such composite materials.5 In terms of cost, because of the low production and pre-treatment costs, fibres from sugarcane bagasse have a significant commercial economic benefit compared to fibres from other materials. The considerable expense of collecting and transportation that is generally necessary for other fibre sources is not required in the case of sugarcane bagasse. Sugarcane bagasse is a by-product of the sugar making process, and sugar mills' enormous stock piles of sugarcane bagasse fibre provide them an economic advantage over other fibres.6 All these rationales have stimulated the curiosity of many researchers in using bagasse waste to develop value-added products. There have been numerous research studies on the utilization of sugarcane bagasse to create biodegradable films. In one study, Gupta et al.7 developed a biodegradable packaging film from sugarcane bagasse and rice husk. Biodegradable films based on PVOH/starch and nanocellulose from sugarcane bagasse have also been developed.4 Other literature on sugarcane fibre cellulose (SCFC) potential to be used as a composite material ingredient is also available where the findings indicated that increasing the SCFC content enhanced the mechanical properties of fabricated composites, notably the flexural and impact properties.8
Citrus limetta or sweet lime is a species of citrus, which is a fruit that is grown all over the world. The peel of a sweet lime comprises about 60–65% waste,9 which is typically thrown away. On a dry basis, citrus peel contains 30–40% pectin10 along with high concentrations of essential oils and flavonoids.11 Because of the presence of pectin in sweet lime peel, these peels have been effectively used for the development of biodegradable packaging films and containers.12–14
Despite the fact that sugarcane bagasse has been used in various composites before, till now no research has been done on using this agricultural waste as a reinforcement for sweet lime peel based films. Due to the presence of strong intermolecular interactions, films created from the mixing of two or more biopolymers have greater attributes than films made from a single biopolymer.15,16 Hence sweet lime peel powder (SLPP) and sugarcane bagasse fibre (SBF) were used as filler materials in this investigation, while polyvinyl alcohol was used as a matrix for film development. PVOH is a substance having a large polar hydroxyl group (–OH) that, by creating inter- and intra-molecule hydrogen bonds, can enhance the wholeness of blended films and have an impact on their functionality.17 Meanwhile, glycerol was used as a plasticizer to increase flexural capabilities by enhancing the capacity to wet the surface by the film forming solution matrix, reducing hydrogen bonding in polymer chains and improving fibre flexibility.
The biopolymer film that is developed is plant-based and biodegradable and can generate a commercial by-product of significant value. The basic objective of this work was to create a film by incorporating sugarcane bagasse fibre into sweet lime peel powder and PVOH based film forming solution and to also investigate the impact of fibre on film's various properties.
2 Materials and methods
2.1. Raw materials
Sugarcane bagasse and raw sweet lime peels were collected from a community fruit juice shop near Tezpur University, Tezpur, Assam, India. PVOH (M.W. = 115000; degree of polymerization = 1700–1800; hydrolysis (mol%) = 98–99; viscosity (cP) = 25–32), glycerol and other chemicals and reagents were provided by Hi Media Laboratories (India).
2.2. Pre-treatment of sugarcane bagasse and sweet lime peels
To remove any extraneous particles, sugarcane bagasse was thoroughly cleaned by washing. Bagasse was then dried for 48 hours at 50 °C in a tray dryer (IKON, Delhi, India). After the drying process was done, a grinder was used to ground sugarcane bagasse into fine powder particles. The sugarcane bagasse powder was then sealed in a zip lock polyethylene bag and stored in a desiccator filled with dried self-indicating crystal silica gel (RH 0%). The dissector was kept at room temperature for further use. With a few modifications, the fibres were isolated from sugarcane bagasse powder using the method reported by K. Beninia, H. J. C. Voorwald and M. Cioffi.18 At room temperature, 100 g of sugarcane bagasse powder was treated with 1000 ml of 5% NaOH solution for 1 h with continuous stirring. This alkaline treatment was used to remove any waxy materials and lignin from bagasse powder. The derived fibre paste was rinsed with distilled water until it reached a pH of 7, and then dried in a hot air oven at 50 °C for 24 h. 5 g of this dried fibre was then bleached on a hot plate for about 2 h by constantly stirring it in a 200 ml solution, which was prepared by adding 1 ml vinegar and 3 g NaCl. The bleaching treatment made the fibre less vulnerable to moisture and ultraviolet light, which is one of the components that contribute to degradation.18 Fine fibre powder was tested to determine the moisture content,19 which was found to be 9.21 ± 0.01%.
The pre-treatment of the sweet lime peels was done according to the method described by Singha et al. in ref. 14. After a thorough wash of sweet lime peels, they were dried in a tray dryer (IKON, Delhi, India) at 50 °C for 48 h. After drying, the peels were ground and were screened through a sieve to get 500 micron sized SLPP particles. This fine SLPP was kept in a sealed polythene bag until further use.
2.3. Thermal analysis of sugarcane bagasse fibre
The thermal characteristics of the sugarcane bagasse fibre sample were evaluated using a differential scanning calorimeter (DSC-028 Mattlere Toledo Inc., Columbus OH). 5 mg of sample was heated in a nitrogen atmosphere from 20 °C to 400 °C. The onset melting temperature and crystallization temperature were determined utilizing a DSC thermogram.
2.4. Dynamic light scattering (DLS) analysis of sugarcane bagasse fibre
DLS, also referred to as photon correlation spectroscopy, is one of the most suited methods for determining particle nanosize and has been extensively used to determine the nanosize of cellulose in natural fibre. The particle size can be estimated by observing the random variations in the light intensity that is scattered out of a suspension/solution. DLS (nanoplus-3) was used to determine the average particle size distribution of the fibre. The following conditions were kept for analysis: dispersant name: water, RI: 1.330 dispersant, temperature (°C): 25 °C, and viscosity (cP): 0.8872.
2.5. Development of sweet lime peel powder (SLPP) and polyvinyl alcohol (PVOH) based biodegradable films incorporated with sugarcane bagasse fibre (SBF)
Film forming solution was made by taking equal proportions of SLPP (3 g) and PVOH (3 g). This proportion was found to be the best for making a SLPP and PVOH based biodegradable film according to a previous study.14 To obtain a homogeneous solution, SLPP was mixed with 100 ml distilled water and was homogenised for 15 min on a magnetic stirrer set to 800 rpm. Glycerol (15 ml/100 ml solution) is added to the suspension as a plasticizer to reduce the brittleness of the film.20 The solution was then heated for 45 min at 85 °C. By blending a PVOH solution, an SLPP and PVOH based film forming solution with a total volume of 100 ml was developed. Fibre was incorporated into the SLPP and PVOH based film forming solution in varying proportions (0, 25, 50, 75, and 100% of SLPP) using a magnetic stirrer at 800 rpm for 15 min. The solutions were poured into glass Petri plates (10 cm in diameter) and dried for 24 h in a hot air oven set to 50 °C. The film code is given in Table 1. The dried films were then peeled off from the surface of the casting undamaged and were subjected to a variety of tests as mentioned in section 2.4.
Table 1 Moisture content, thickness, solubility and WVP of SLPP–PVOH–SBF based filmsa
| Code |
SBF (wt% of SLPP) |
Thickness (mm) |
Moisture content (%) |
Solubility (%) |
WVP (10−7 g Pa−1 h−1 m−1) |
|
The values of different properties are expressed as mean ± standard deviation. In the same column, the mean followed by different letters (a, b, c, d, and e) differs significantly (p ≤ 0.05).
|
| SLPP/PVOH/SBF-0 |
0 |
1.12 ± 0.01a |
36.71 ± 0.21c |
85.09 ± 0.20e |
2.54 ± 0.02c |
| SLPP/PVOH/SBF-25 |
25 |
1.16 ± 0.02ab |
37.97 ± 0.32d |
49.76 ± 0.59d |
1.53 ± 0.03a |
| SLPP/PVOH/SBF-50 |
50 |
1.21 ± 0.01bc |
34.94 ± 0.66b |
48.76 ± 0.72c |
2.18 ± 0.05b |
| SLPP/PVOH/SBF-75 |
75 |
1.25 ± 0.01c |
34.59 ± 0.39b |
46.21 ± 0.62b |
2.54 ± 0.2c |
| SLPP/PVOH/SBF-100 |
100 |
1.31 ± 0.06d |
32.32 ± 0.16a |
34.92 ± 0.50a |
3.75 ± 0.05d |
2.6. Film thickness and moisture content
A hand-held micrometre (Alton M820-25, China) was used to measure the thickness of the film, which had a sensitivity of 0.01 mm. The average thickness of ten films was measured after stacking them one on top of the other.10 The moisture content of the films was calculated by drying them in a hot air oven at 105 °C until they reached a constant weight.19
2.7. Solubility in water
Solubility in water is defined as the percentage of dry materials dissolved in water after 24 h.21 The method described by Wu et al.22 was followed to determine the solubility of the films. The films were snipped into 20 × 20 mm squares. These pieces were dried for 24 h in a hot air oven at 70 °C, and their weight was recorded as the initial weight (mo). The films were soaked in distilled water for 24 h before being removed. To determine their final weight (mt), the left over films were placed in a hot air oven at 70 °C for 24 h. The solubility is calculated using eqn (1).| |  | (1) |
where mo and mt are the initial and final weights of the film respectively.
2.8. Water vapor permeability (WVP)
WVP tests have been carried out as described by L. S. Badwaik, P. K. Borah and S. C. Deka.23 Glass beakers with an average diameter of 20 mm and a depth of 45 mm were utilized to measure the WVP of the films. A film slightly bigger than the diameter of the beaker was cut out. Anhydrous CaSO4 (3 g) was added to each beaker, so that a relative humidity (RH) of 0% was maintained. Films of various compositions were used to cover these beakers. All of the beakers were positioned in a desiccator enclosing a saturated K2SO4 solution that maintained a RH of 97% at 25 °C. To ensure that the film remains in its position so as to prevent the migration of humidity with any openings, the circumference of the film was sealed to the beaker using cello tape. These beakers were weighed every 24 h, and weight variations were noted as a function of time. The slope was calculated using linear regression (weight change vs. time). Subsequently, by dividing the slope (g h−1) by the transfer area (m2), the water vapour transmission rate (WVTR) was calculated. Finally, WVP (g Pa−1 h−1 m−1) was calculated using eqn (2).| |  | (2) |
where P is the saturation vapor pressure of water (Pa) at a test temperature of 25 °C, R1 and R2 are the RH in the desiccator and cup respectively and X is the film thickness (m).
2.9. Film colour
A Hunter Lab colorimeter (Ultrascan VIS, HunterLab. Inc., USA) in reflectance mode, a CIELab scale (L*, a* and b*), as an illuminant D65 and as a reference system, and a 10-degree observer angle were used to evaluate the colours of the films. Lightness L* (L* = 0 for black and L* = 100 for white) and chromaticity parameters a*(green [−] to red [+]) and b*(blue [−] to yellow [+]) were used to express these colour measurements. The total color difference (ΔE) was calculated using eqn (3).24| |  | (3) |
where L*, a* and b* are the colour values of the film and  ,
,  and
and  are the colour values of the control film (SLPP/PVOH/SBF-0).
2.10. Film transparency
The Fang et al.25 method for determining film transparency was adopted with minor modifications. The film samples were cut into rectangles (2 × 40 mm) and were positioned perpendicular to the UV spectrum inside a spectrophotometer cell. A UV-VIS spectrophotometer (Spectronic 20D+, Thermo Scientific, USA) was used to assess the light barrier properties of the film samples at wavelengths between 250 nm and 850 nm. The transparency was calculated using eqn (4).| |  | (4) |
2.11. Mechanical properties
A texture analyzer (TA-HDPlus, Stable Microsystems, UK) with a tensile grip (A/MTG) was used to test the films' tensile strength and elongation at break (%E). Each film was cut into thin pieces of 60 × 20 mm, which were used to evaluate the textural features. In the tests, there was a tension mode with the following parameters. The pre-test speed was adjusted to 5 mm s−1, the test speed to 1 mm s−1, and the post-test speed to 5 mm s−1 with a distance of 150 mm and a trigger force of 5 g. A 5 kg load cell was linked to the probe.10 Using eqn (5) and (6), tensile strength and elongation at break were calculated respectively.| |  | (5) |
| |  | (6) |
2.12. Fourier-transform infrared spectroscopy (FTIR)
FTIR (Fourier-transform infrared spectroscopy) is a technique that provides an infrared spectrum of the absorption or emission of a solid, liquid, or gas.26 The FTIR analysis was done by following the method mentioned by Li et al.27 The film was reduced into tiny bits and was mixed with IR grade KBr by using an FTIR hand operated press at approximately 12000 psi pressure. The data were taken in the 400 to 4000 cm−1 range. These collected data were analysed using Origin 2021 software to identify the functional groups and bonds present in the films.
2.13. XRD
Using an X-ray powder diffraction system, the crystalline phase of the films was observed. To obtain the XRD patterns of the films, the X-ray generator will be outfitted with a copper tube operating at 40 kV and the sample was irradiated with monochromatic Cu Kα radiation. Diffraction intensities were analyzed at a rate of 3° per minute between 5° and 65° (2θ angle range). The crystallinity factor was determined using the Segal method using eqn (7).| |  | (7) |
where I200 is the maximum intensity of the diffraction peak and Iam is the intensity of the amorphous diffraction peak.
2.14. Surface morphology
To examine the surface morphology of the film, a scanning electron microscope (JEOL JSM 6390 LV, Singapore) was used. Platinum was sputtered onto the dried film samples, and images were captured at 20 kV accelerating voltage and magnifications of 1000× and 500×.
2.15. Statistical analysis
All evaluations were carried out with three replicates, and the results were reported as mean ± SD. Using the IBM SPSS statistics 23 statistical tool, Duncan's multiple range tests were used to determine significant differences between means at a significance level of 0.05.10
3 Results and discussion
3.1. Properties of sugarcane bagasse fibre
3.1.1. DSC of fibre.
The thermal analysis of the sugarcane bagasse fiber was done through a differential scanning calorimeter. In the process of analysis, the fibers samples were subjected to heat from 20 °C to 400 °C at a rate of 10 K min−1. The onset temperature (T0) for the sugarcane bagasse fibre can be seen at 36.2 °C (Fig. 1). The enthalpy (ΔE) obtained was −204.4 J g−1. The initial endothermic peak was seen initiated around 25 °C. The second endothermic peak (Tm) occurs at a temperature of around 66.2 °C. The end temperature (Te) was recorded at 100.4 °C associated with the evaporation of water on the surface of cellulose of sugarcane bagasse. The exothermic peak started around 360 °C and ended at 400 °C. A similar study was also reported by Jonasson et al.28 They observed first endothermic peak at 100 °C which was associated with evaporation of water molecules; whereas second endothermic peak at 298 °C was associated with initiation of the decomposition of cellulose and the highest peak was at 338 °C. The peak temperature between 359 °C and 482 °C is attributed to decomposition of hemicellulose and residual lignin present in cellulose samples after chemical treatment respectively.
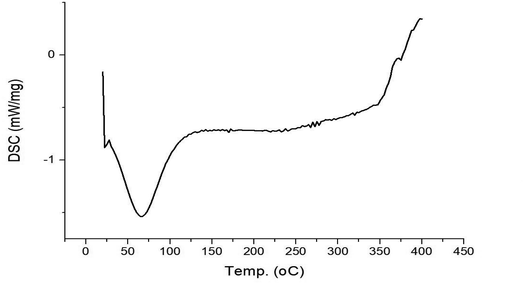 |
| | Fig. 1 DSC thermogram of sugarcane bagasse fibre. | |
In the study of Otenda et al.,29 the thermal analysis of TEMPO-oxidized fibers showed the first endothermic peak centred at 44 °C was associated with water evaporation while the second endothermic peak centred at 324 °C was associated with decomposition of cellulose. The differences found in the literature and in the research of thermal stability of cellulose during thermal decomposition were due to the differences in the size of the fibers as it has been seen that the shorter the fibers, the easier the dissipation of heat and hence the lower the thermal stability of TEMPO-oxidized fibers of sugarcane bagasse. The degradation of the fibers involves decarboxylation, depolymerization, and decomposition of cellulose and hemicellulose fragments.30
3.1.2. DLS.
DLS evaluates the hydrodynamic diameter of the suspension.31 The potent hydrophilic nature of cellulose suspension will cause aggregation. Agglomeration leads to the development of larger spheres, which increases the particle size over several nanometres. The existence of a large number of hydroxyl groups is the source of aggregate formation and since Brownian motion is slower for larger particles, the intensity of scattering light is greater.32 DLS can be helpful in studying the particle distribution of the fibres in the suspension of film preparation. The particle size distribution analyzed is shown in Fig. 2. It was observed that the average particle size distribution of cellulose fibres was 1101 nm with an intensity range from 10.4 to 24059.9 nm. The larger size is mainly owing to the aggregation of fibres prompted by hydrogen bonding amongst hydroxyl groups in the cellulose fibres. The intensity distribution indicates the presence of agglomeration in the fibres in the presence of water as solvent taken for analysis. The vast difference in the particle size can be related to the transformation of cellulose I and cellulose II, which are normally achieved with a higher concentration of NaOH for the treatment of at least 10 wt%.33
 |
| | Fig. 2 Particle size distribution of sugarcane bagasse fibre. | |
3.2. Properties of sweet lime peel powder (SLPP) and polyvinyl alcohol (PVOH) based films incorporated with sugarcane bagasse fibre (SBF)
Pretreated SBF was used for the preparation of SLPP and PVOH based films incorporated with fibre. A total of five different films as shown in Fig. 3 were developed namely SLPP/PVOH/SBF-0, SLPP/PVOH/SBF-25, SLPP/PVOH/SBF-50, SLPP/PVOH/SBF-75 and SLPP/PVOH/SBF-100 where SBF was added in different weight percentages of 0, 25, 50, 75 and 100 weight% of SLPP respectively. The moisture content, solubility, water vapor permeability, tensile strength, elongation at break, colour, transparency, FTIR and surface morphology were all examined on the five distinct films that were created.
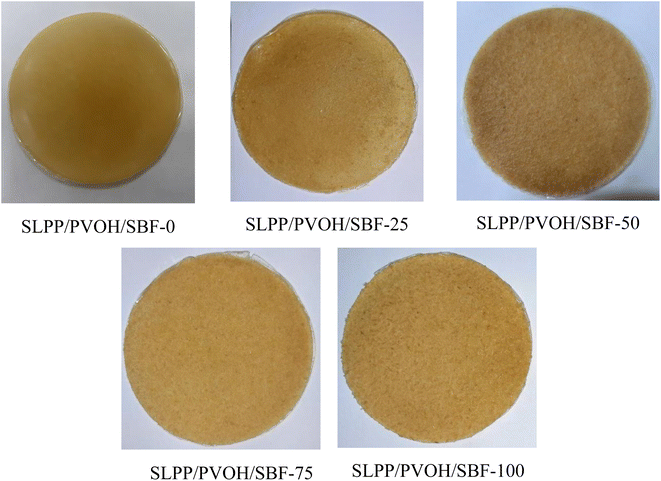 |
| | Fig. 3 Images of SLPP–PVOH based films incorporated with SBF. | |
3.2.1. Moisture content and thickness.
The moisture content of all five distinct films was in the range of 32–38% (Table 1) with SLPP/PVOH/SBF-25 having the highest moisture content of 37.97 ± 0.32% and SLPP/PVOH/SBF-100 having the lowest moisture content of 32.32 ± 0.16%. A decreasing trend in the moisture content was observed with increase in the percentage of SBF. Among SLPP/PVOH/SBF-50 and SLPP/PVOH/SBF-75, there was not any significant difference between the moisture contents of the respective films (p ≤ 0.05), whereas there was a significant difference among the moisture contents of the other films. The higher percentage of SBF in the film forming solution may help for effective bonding of fiber with SLPP and PVOH that prevented the creation of voids in film through which water molecules might travel,34 resulting in less moisture content. This may be due to the binding capacity of sugarcane bagasse fibres with the molecules present in the film forming suspension. The moisture content value of SLPP/SBF-100 was found to be the best, since it had the lowest moisture content and hence is suitable for packaging purposes. A low moisture level aids in the film ability to resist mould formation, which can damage the film look and mechanical properties. Micro-organisms' metabolic activity is accelerated by a high moisture content.10
The thickness range of the prepared films was 1.12 ± 0.01 to 1.31 ± 0.06. From Table 1, it can be observed that the thickness of the film increases as the percentage of SBF added in the film forming solution increases. There was a significant difference (p ≤ 0.05) of thickness between SLPP/SBF-0, SLPP/SBF-25 and SLPP/SBF-50 when SBF was added to the film forming solution indicating that the matrices formed among these films were not similar in density.
3.2.2. Solubility.
The weight loss of the material when subjected to occasional agitation for a specific time is measured during the investigation of the water solubility of a film. This test shows how materials degrade when they are disposed of in water.35 Because of the high solubility of PVOH-based films in water, solubility tests are an important metric to assess.36 Various research studies have been conducted where shortcomings were tried to overcome by crosslinking PVOH-based films with different composites.4,37Table 1 illustrates the solubility of films with varying amounts of SBF added. The SLPP/PVOH/SBF-0 film had the maximum solubility of 85.09 ± 0.20%, where no SBF was added, whereas SLPP/PVOH/SBF-100 had the lowest solubility of 34.92 ± 0.50% which is desirable. A significant decrease (p ≤ 0.05) in the solubility trend was observed as the percentage of SBF was introduced into the film forming solution. This can be due to the fibre's hydrophobicity, which means that it absorbs less water than the SLPP matrix. This finding is in line with that of Jumaidin et al.38 where the incorporation of fibre resulted in a decrease in the solubility of a sugarcane bagasse fibre reinforced thermoplastic potato starch bio composite (from 61.12% to 24.41%). The SLPP based PVOH film is made up of –OH (hydroxyl groups) that has a high affinity for water molecules, making the resulting films more soluble.39 This reduces its mechanical strength, putting it at a significant disadvantage in terms of its use as a packaging material. But with the addition of fibre in the SLPP matrix, the solubility was reduced to a great extent.
3.2.3. Water vapour permeability (WVP).
When SBF was introduced into SLPP–PVOH based films, there was a significant difference (p ≤ 0.05) in WVP as can be seen from Table 1. The WVP of SLPP/PVOH/SBF-25 was lowest i.e. 1.53 ± 0.03 (10−7 g Pa−1 h−1 m−1), whereas the SLPP/PVOH/SBF-100 film had the highest WVP value of 3.75 ± 0.05 (10−7 g Pa−1 h−1 m−1). Low WVP indicates that the bioplastic has the ability to limit moisture transfer between food and the environment.40 As a consequence, low WVP films are preferable for food packaging. In Table 1, it can be seen that as the concentration of SBF increased, the water vapour permeability of the film also increased. In contrast to Azmin and Nor,41 where the addition of fibre resulted in lowered WVP of the films, in the present study, the addition of the fibre in the film didn't assisted in decreasing the value of the WVP except for the SLPP/PVOH/SBF-25 film. The morphology of the SBF had a significant influence on the film's WVP. In one study, Kiani et al.42 reported that due to the porous tubular structure of PVC reinforced with pulp fibres, water absorption rises as the fibre content increases, promoting water passage into the polymer membrane. To summarise, the porous structure of the fibres may increase the material's water permeability. Therefore it is safe to conclude that among all the films where SBF was added, SLPP/PVOH/SBF-25 was the best as it showed the lowest WVP.
3.2.4. Film colour and colour difference.
The colour attribute is crucial because it has a big impact on how people perceive the quality of the finished product.41 The colour analysis results show how the concentration of SLPP, PVOH, and SBF affects the film appearance. Table 2 shows the colour parameter or the value of L*, a* and b* of the film. The value of L* ranged from 52.98 ± 0.28 to 63.44 ± 0.92, where the SLPP/PVOH/SBF-0 film had the lowest value and hence the darkest, and the SLPP/PVOH/SBF-50 film had the highest L* value and hence the lightest of all the films. The effect of SBF on L* varied. A trend was observed where the value of L* first increased and then decreased. This is because as the concentration of the SBF increased up to 50%, the film had a slight dark colour but as the concentration of SBF increased from 50% to 100%, the matrix of the film forming solution was packed in a compact manner and has a lighter colour in appearance. In films containing SBF, the most noticeable visual effect was a yellowish tint, which was indicated by an increase in parameter b*. As can be seen from Table 2, the value for a* and b* at first increased and then decreased because of the different concentrations of the SBF in the film forming solution. Increase in fibre content imparted a yellowish tint to the film as can be seen from the positive values of b*.
Table 2 Colour, transparency and mechanical properties of SLPP–PVOH–SBF based filmsa
| Film |
SBF (wt% of SLPP) |
Colour values |
Colour difference (ΔE) |
Tensile strength (MPa) |
Elongation at break (%) |
|
L* |
a* |
b* |
|
The values of different properties are expressed as mean ± standard deviation. In the same column, the mean followed by different letters (a, b, c, d, and e) differs significantly (p ≤ 0.05).
|
| SLPP/PVOH/SBF-0 |
0 |
52.98 ± 0.28c |
5.5 ± 0.14a |
33.83 ± 0.34c |
— |
0.509 ± 0.053b |
11.31 ± 0.05d |
| SLPP/PVOH/SBF-25 |
25 |
54.83 ± 1.35a |
6.83 ± 0.25b |
35.99 ± 0.94a |
6.03 ± 0.02b |
0.947 ± 0.046.e |
11.35 ± 0.009d |
| SLPP/PVOH/SBF-50 |
50 |
63.44 ± 0.92b |
6.16 ± 0.47d |
38.65 ± 0.39b |
4.35 ± 0.01a |
0.703 ± 0.029d |
11.06 ± 0.03c |
| SLPP/PVOH/SBF-75 |
75 |
61.83 ± 0.67e |
6.54 ± 0.18c |
37.55 ± 0.48d |
6.38 ± 0.04c |
0.619 ± 0.047c |
10.65 ± 0.102b |
| SLPP/PVOH/SBF-100 |
100 |
57.71 ± 0.32d |
3.77 ± 0.07cd |
37.16 ± 0.59c |
4.45 ± 0.06a |
0.498 ± 0.042a |
10.37 ± 0.002a |
The colour difference (ΔE) was calculated for the SBF films taking SLPP/PVOH/SBF-0 as the control film, where no SBF was added. The evaluation of the overall change in colour (ΔE) of the developed films can be seen in Table 2. The ΔE value is a convenient way to express the degree of colour shift noticeable to the naked eye. A value of ΔE greater than 3 indicates a colour difference that can be perceived with the naked eye.43 The maximum value of ΔE was obtained by the SLPP/PVOH/SBF-75 film. The colour difference between SLPP/PVOH/SBF-50 and SLPP/PVOH/SBF-100 was not significant (p ≤ 0.05), whereas the other two films differed significantly.
3.2.5. Mechanical properties.
With changes in SBF concentration, the texture of the film changes notably. When compared to other ratios, the film gets dryer and tougher as the SBF concentration increases. From Table 2, it can be seen that with the addition of SBF, the film tensile strength increased significantly (p ≤ 0.05) from a minimum value of 0.509 ± 0.053 MPa (SLPP/PVOH/SBF-0) to a maximum value of 0.947 ± 0.446 MPa (SLPP/PVOH/SBF-25). This increase in tensile strength is due to the fact that adding fibre to a film makes it tougher by creating a tighter network with more junction sites.44 However the film tensile strength decreased as SBF concentration was increased gradually from 50% to 100%. The increase in tensile strength indicates that the bonding between the SLPP–PVOH matrix and bagasse fibre is strong enough to allow strength transfer from fibre to SLPP–PVOH during testing. The decline in film strength, on the other hand, could be due to fibre accumulation or overloading during casting or other components, thereby limiting the fibre to SLPP–PVOH matrix bond. Tensile testing results obtained in this study demonstrate the same trend as previously reported in the literature Gilfillan et al. (2012), where tensile strength increased with 5–10 wt% but decreased with the addition of more fibre that is 20 wt% fibre. A similar result was also obtained by Gilfillan et al.,6 where the tensile strength of films containing 0% and 10%, sugarcane bagasse nano-fibre increased from 3.1 to 6.2 MPa, but declined to 5.8 MPa when 20% nano-fibre was added. The addition of the SBF resulted in a considerable increase with a significant difference (p ≤ 0.05) in elongation at break as can be seen from Table 2. SLPP/PVOH/SBF-25 showed the highest elongation value of 11.35 ± 0.05% after the addition of the SBF. Increasing the SBF content from 0 to 25% resulted in an increased value of elongation at break from 11.31 ± 0.05% to 11.35 ± 0.009%. However the addition of SBF of more than 25% resulted in the reduction of elongation at break. This might be due to phase separation of SBF and SLPP matrices and also, the SBF's rigidity can also be the reason behind this.45 This can also be explained by the reason that with the further addition of SBF, SLPP–PVOH based film forming solution may have failed to form hydrogen bonds (either intramolecularly or intermolecularly) to the extent desired, resulting in an increase in ductility as the formation of hydrogen bonds between PVOH chains is disrupted during drying after casting due to the presence of fibre particles.46 SLPP/PVOH/SBF-25 not only showed the highest elongation at break but its tensile strength was also the highest. Hence SLPP/PVOH/SBF-25 had the desirable mechanical properties.
3.2.6. Fourier-transform infrared spectroscopy (FTIR) analysis of SLPP–SBF based films.
This technique analyses the chemical components and interactions of a material by passing infrared waves across it. As a result, it can be used to examine the microstructure of that material. The film with 25% SBF was chosen as the best fibre incorporated film based on its various barrier and mechanical properties shown. This film was analyzed for FTIR along with the control film i.e. the film with 0% SBF which are displayed in Fig. 4. When compared to the SLPP–PVOH based film with no fibre, the FTIR spectra of the fibre incorporated films showed some changes associated with the larger SBF loadings. The peak at 1648 cm−1 is due to C![[double bond, length as m-dash]](https://www.rsc.org/images/entities/char_e001.gif) C stretching because of the presence of the acetyl group in hemicellulose.37 In the fingerprint region, C–O is responsible for the absorbance peak at 1111 cm−1, indicating the existence of second-order alcohol and the peak at 1043 cm−1 is due to CO–O–CO stretching. At 675 cm−1, the sugar unit is indicated by glucosidic linkages. Finally, the peak at 592–569 cm−1 is caused by C–I stretching of the halo compound. All these results were found to be in line with the study of Singha et al.,14 Rathinavel and Saravanakumar37 and Wu et al.22
C stretching because of the presence of the acetyl group in hemicellulose.37 In the fingerprint region, C–O is responsible for the absorbance peak at 1111 cm−1, indicating the existence of second-order alcohol and the peak at 1043 cm−1 is due to CO–O–CO stretching. At 675 cm−1, the sugar unit is indicated by glucosidic linkages. Finally, the peak at 592–569 cm−1 is caused by C–I stretching of the halo compound. All these results were found to be in line with the study of Singha et al.,14 Rathinavel and Saravanakumar37 and Wu et al.22
 |
| | Fig. 4 FTIR spectra for the SLPP–PVOH based film (SLPP/PVOH/SBF-0) and SBF incorporated SLPP–PVOH based film (SLPP/PVOH/SBF-25). | |
The major constituents of sugarcane bagasse fibre (cellulose, hemicelluloses, and lignin) are alkanes, ketones, esters, alcohols, and aromatics with distinct oxygen-containing functional groups. For SBF incorporated SLPP and PVOH based films, the presence of strong O–H groups in the hydroxyl group of cellulose and hemicelluloses is indicated by the presence of a broad band at 3421–3403 cm−1 which is wide and smooth. The C–H stretching of the alkane group of hemicelluloses is responsible for the peak at 2933 cm−1. The peak at 1459 cm−1 is caused by C–H bending, indicating the presence of a methyl group. The band at 1231 cm−1 is attributed to C–O out of plane stretching due to the aryl group in lignin.47 There are no significant changes in the spectra reported with the addition of SBF in the rest of the peaks under the finger print region. All of these findings revealed that the characteristic absorption peaks are in agreement with the published data of Liu et al.,48 Gilfillan et al.6 and Gond et al.49
3.2.7. XRD.
The XRD patterns and crystallinity indices of the five distinct films are depicted in Fig. 5. Cellulose comprises both crystalline and amorphous domains, which affect the observed XRD diffractogram. A significant diffraction peak for 2θ ranging from 22 to 23, which correlates to cellulose crystallographic planes, was observed. For all five films, the average highest values of intensity and the crystallinity index were observed between 19° and 24° 2θ with different intensities. Typically, cellulose I displays a sharp diffraction peak at a 2θ of 22°. This indicates the presence of cellulose I in all fibre added films. The crystallinity index can be used to predict the stiffness and strength of films. The highest (26.10%) and lowest (12.375%) values of the crystallinity index were found for SLPP/PVOH/SBF-25 and SLPP/PVOH/SBF, respectively, while intermediate values were found for the other films The highest crystallinity for SLPP/PVOH/SBF-25 can be caused by the formation of H bonds, which resists the free mobility of cellulose chains, giving rise in a parallel crystalline structure.49 An increase in the crystallinity of all the SBF added films was observed, which could be attributed to the treatment given to the SBF. Similar findings for crystalline behavior following acid treatment have previously been reported by Gond et al.49
 |
| | Fig. 5 XRD graph for the five different films with various percentages of SBF. | |
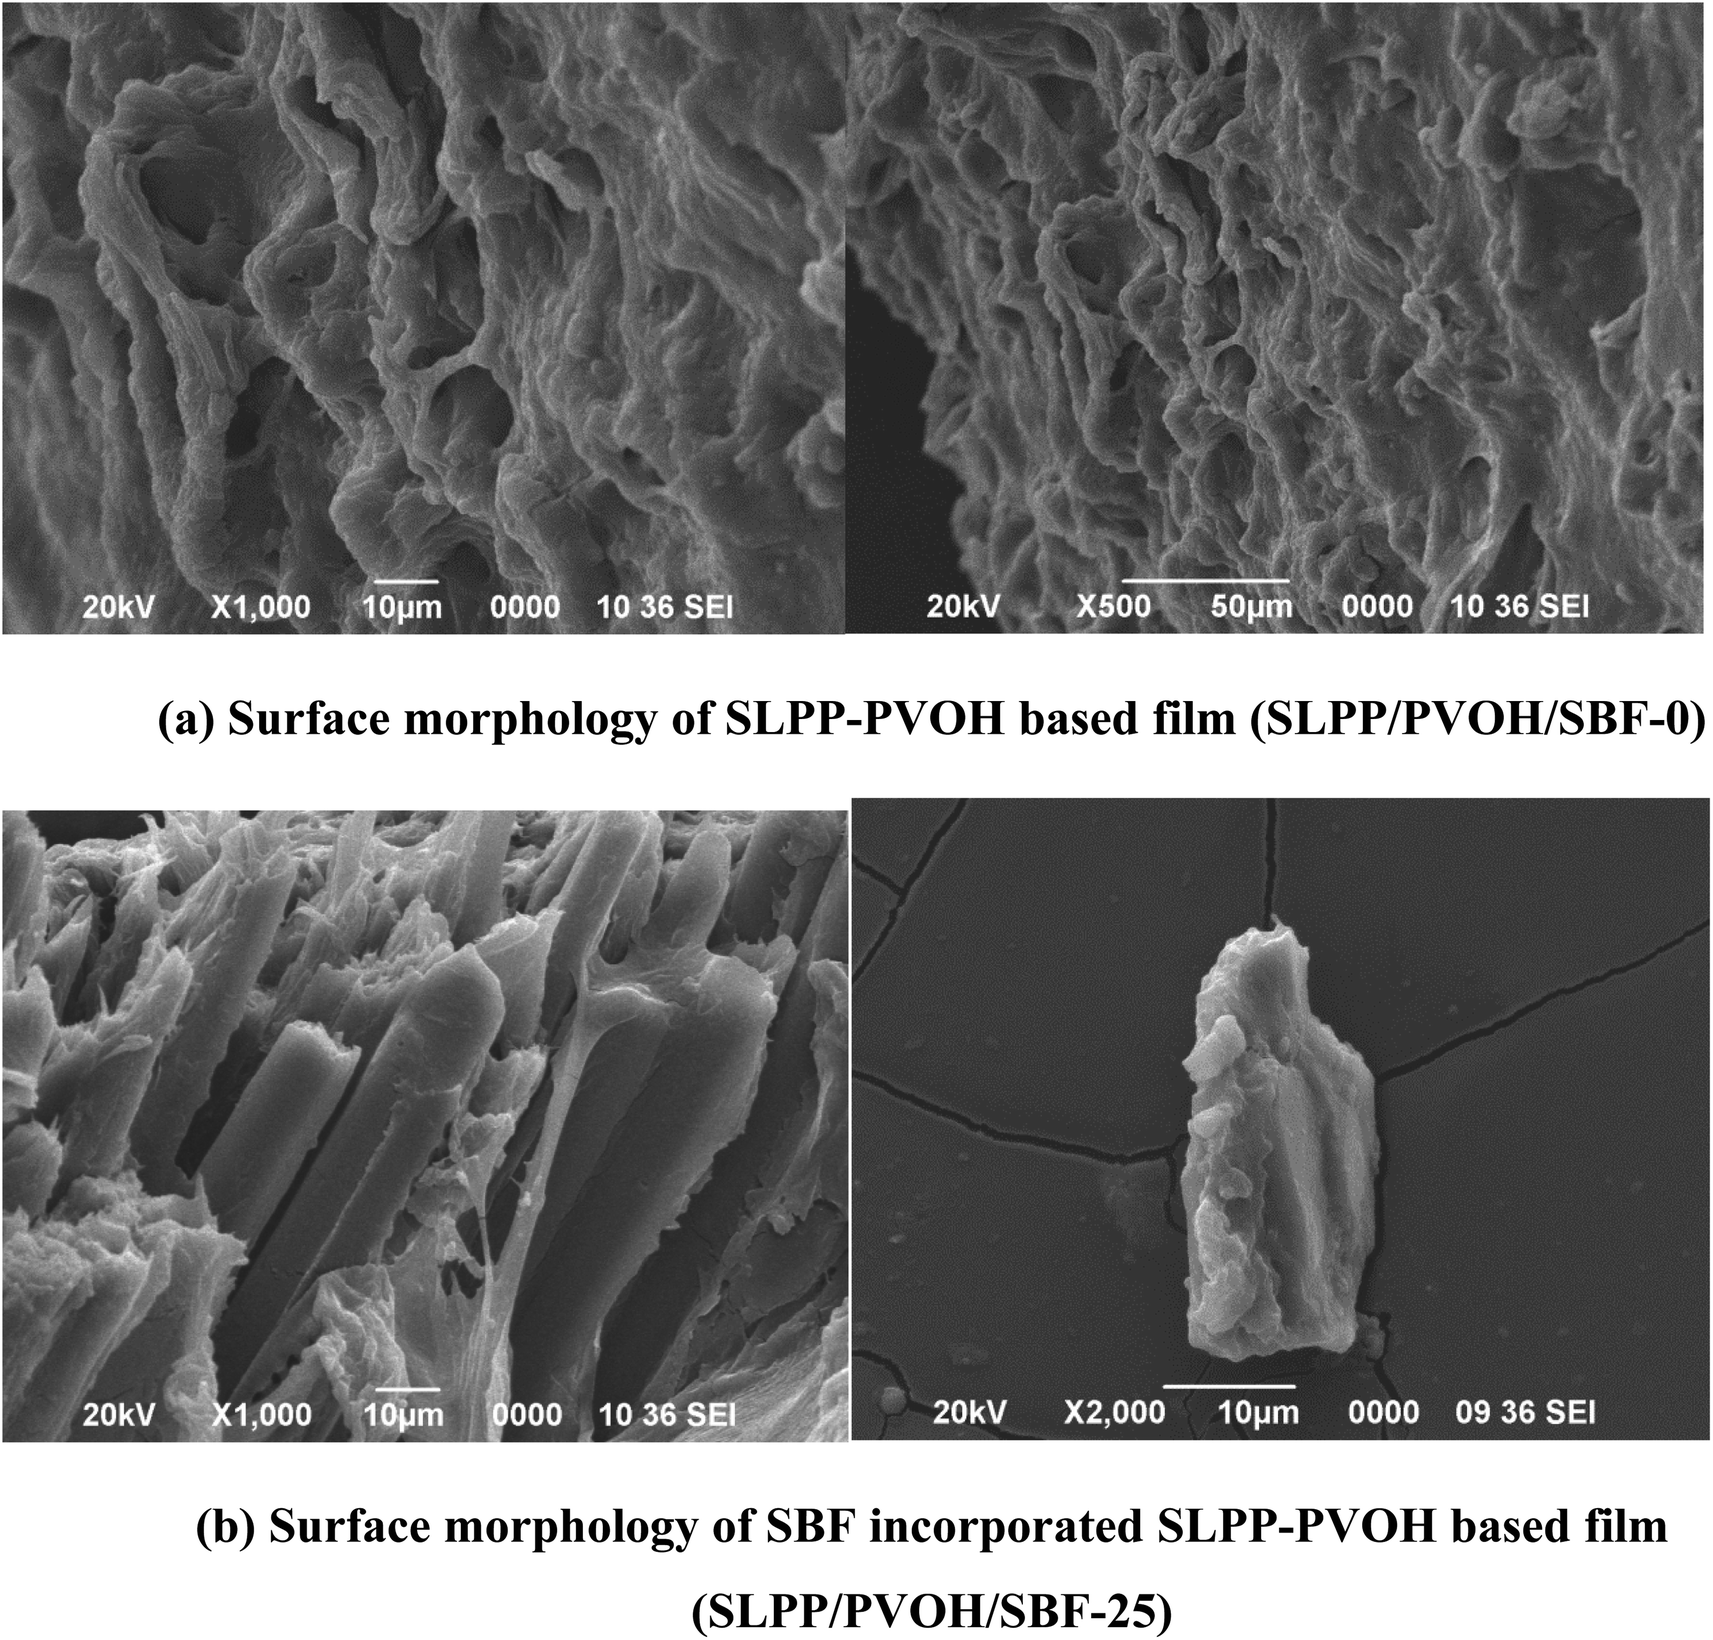
3.2.8. Surface morphology.
The surface SEM images of film control films i.e. (a) SLPP/PVOH/SBF-0 and (b) SLPP/PVOH/SBF-25 developed are shown in Fig. 6. As can be seen from Fig. 6(a), which shows the surface morphology of the SLPP–PVOH based film, a continuous matrix can be seen with rough surfaces and gullies indicating that the film lacks in structural and physical properties. Hence further treatment or some addition of other polymer is needed.
 |
| | Fig. 6 SEM images of the (a) SLPP–PVOH based film (b) SBF incorporated SLPP–PVOH based film. | |
The treatment of sugarcane bagasse fibre resulted in a yield of fibre which is stripped of its lignin. The network structure of the interconnected fibres made it difficult to measure the length of individual fibres observed during SEM analysis as can be seen from Fig. 6(b). The film presented a compact and dense layered structure with some surface roughness. Some cracks can also be observed on the surface of the film, but this doesn't much affect the strength of the film as can be seen from the tensile test where the SBF incorporated films gave much better results than SLPP–PVOH based films.
4 Conclusions
In this study, biodegradable films based on SBF and SLPP filled with a PVOH blend were prepared through the casting method. The physical properties of the films were changed as a result of combination of SBF, SLPP and PVOH. With the addition of SBF to the SLPP–PVOH film forming solution, the film's water solubility has decreased notably as compared to the solubility of only SLPP–PVOH based films. In the case of WVP only one film i.e. the SLPP/PVOH/SBF-25 film showed decrease in the WVP value. These findings reveal that incorporating SBF into the SLPP–PVOH based film forming matrix lowers the material's hydrophilicity while also improving its dimensional stability. Moreover, the fibre incorporated films showed improved tensile strength and elongation at break as well. Hence by varying the ratio of SBF in the SLPP–PVOH based film forming solution it was possible to construct fibre incorporated SLPP–PVOH based biodegradable films. Among all the fibre incorporated films, the film SLPP/PVOH/SBF-25 was found desirable based on film characteristics.
The attributes of SBF-incorporated SLPP–PVOH-based films can be enhanced further by optimizing film-forming factors such as the concentration of PVOH, film-forming solution heating time, and the use of different types and concentrations of emulsifiers and plasticizers. The methods and techniques explored and devised in this work ought to be very beneficial for future research.
Consent for publication
All authors consent to publishing this work.
Author contributions
PS: data curation, formal analysis, investigation and writing – original draft; RR: methodology, resources, validation, and visualization; LSB: conceptualization, project administration, resources, supervision, and writing – review & editing.
Conflicts of interest
The authors have declared that there is no conflict of interest for this work.
Acknowledgements
The authors are also grateful for support received from DST-FIST and UGC-SAP. The authors are also thankful to Prof. Pritam Deb, Department of Physics, Tezpur University, Napaam, Assam, India for his help with DLS analysis.
References
-
Statistica, 2022 Search PubMed.
- D. A. Cerqueira, G. Rodrigues Filho and C. da Silva Meireles, Carbohydr. Polym., 2007, 69(3), 579–582 CrossRef CAS.
-
S. Walford, Sugarcane bagasse: how easy is it to measure its constituents?, Proceedings of the Annual Congress-South African Sugar Technologists' Association, South African Sugar Technologists' Association, 2008, pp. 266–273 Search PubMed.
-
M. Asem, W. Nawawi, and D. Jimat, Evaluation of water absorption of polyvinyl alcohol-starch biocomposite reinforced with sugarcane bagasse nanofibre: optimization using two-level factorial design, IOP Conference Series: Materials Science and Engineering, IOP Publishing, 2018, p. 012005 Search PubMed.
-
S. Fu, C. Tian, and L. A. Lucia, Handbook of Nanocellulose and Cellulose Nanocomposites, 2017, vol. 2, pp. 649–681 Search PubMed.
- W. N. Gilfillan, L. Moghaddam and W. O. Doherty, Cellulose, 2014, 21(4), 2695–2712 CrossRef CAS.
- H. Gupta, H. Kumar, M. Kumar, A. K. Gehlaut, A. Gaur, S. Sachan and J.-W. Park, Environ. Eng. Res., 2020, 25(4), 506–514 CrossRef.
- A. Jeefferie, O. Nurul Fariha, A. Mohd Warikh, M. Yuhazri, H. Sihombing and J. Ramli, J. Eng. Appl. Sci., 2011, 6(4), 1819–6608 Search PubMed.
- M. Bakr, Egypt. J. Anim. Prod., 2020, 57, 73–80 CrossRef.
- P. P. Borah, P. Das and L. S. Badwaik, Ultrason. Sonochem., 2017, 36, 11–19 CrossRef CAS PubMed.
- M. C. Colecio-Juárez, R. E. Rubio-Núñez, J. E. Botello-Álvarez, G. M. Martínez-González, J. L. Navarrete-Bolaños and H. Jiménez-Islas, Chil. J. Agric. Res., 2012, 72(2), 275 Search PubMed.
- N. J. Changmai and L. S. Badwaik, J. Package. Technol. Res., 2021, 1–8 Search PubMed.
- Y. Arafat, A. Altemimi, A. Pratap-Singh and L. S. Badwaik, Polymers, 2021, 13(8), 1240 CrossRef CAS PubMed.
- P. Singha, R. Rani and L. S. Badwaik, Polym. Bull., 2022, 1–17 Search PubMed.
- B. Ghanbarzadeh, H. Almasi and A. A. Entezami, Innovative Food Sci. Emerging Technol., 2010, 11(4), 697–702 CrossRef CAS.
- N. Hameed, R. Xiong, N. V. Salim and Q. Guo, Cellulose, 2013, 20(5), 2517–2527 CrossRef CAS.
- X. Tang and S. Alavi, Carbohydr. Polym., 2011, 85(1), 7–16 CrossRef CAS.
- K. Beninia, H. J. C. Voorwald and M. Cioffi, Procedia Eng., 2011, 10, 3246–3251 CrossRef.
-
S. Ranganna, Handbook of analysis and quality control for fruit and vegetable products, 2001, vol. 2, pp. 12–17 Search PubMed.
- A. Cagri, Z. Ustunol and E. T. Ryser, J. Food Prot., 2004, 67(4), 833–848 CrossRef CAS PubMed.
- N. Gontard, C. Duchez, J. L. CUQ and S. Guilbert, Int. J. Food Sci. Technol., 1994, 29(1), 39–50 CrossRef CAS.
- Z. Wu, J. Wu, T. Peng, Y. Li, D. Lin, B. Xing, C. Li, Y. Yang, L. Yang and L. Zhang, Polymers, 2017, 9(3), 102 CrossRef PubMed.
- L. S. Badwaik, P. K. Borah and S. C. Deka, Carbohydr. Polym., 2014, 103, 213–220 CrossRef CAS PubMed.
- T. G. Hoffmann, B. L. Angioletti, S. L. Bertoli and C. K. de Souza, J. Food Sci. Technol., 2022, 59(3), 1001–1010 CrossRef CAS PubMed.
- Y. Fang, M. Tung, I. Britt, S. Yada and D. Dalgleish, J. Food Sci., 2002, 67(1), 188–193 CrossRef CAS.
-
P. R. Griffiths and J. A. De Haseth, Fourier transform infrared spectrometry, John Wiley & Sons, 2007 Search PubMed.
- N. Li, G. Qi, X. S. Sun, D. Wang, S. Bean and D. Blackwell, Trans. ASABE, 2014, 57(1), 169–178 CrossRef CAS PubMed.
- S. Jonasson, A. Bünder, T. Niittylä and K. Oksman, Cellulose, 2020, 27, 185–203 CrossRef CAS.
- B. V. Otenda, P. G. Kareru, E. S. Madivoli, E. G. Maina, S. I. Wanakai and W. C. Wanyonyi, J. Nat. Fibers, 2022, 19(10), 3585–3597 CrossRef CAS.
- L. K. Kian, M. Jawaid, H. Ariffin and O. Y. Alothman, Int. J. Biol. Macromol., 2017, 103, 931–940 CrossRef CAS PubMed.
- M. Adsul, S. K. Soni, S. K. Bhargava and V. Bansal, Biomacromolecules, 2012, 13(9), 2890–2895 CrossRef CAS PubMed.
- C. R. Bauli, D. B. Rocha, S. A. de Oliveira and D. S. Rosa, J. Cleaner Prod., 2019, 211, 408–416 CrossRef CAS.
- E. Dinand, M. Vignon, H. Chanzy and L. Heux, Cellulose, 2002, 9, 7–18 CrossRef CAS.
- M. B. Agustin, B. Ahmmad, S. M. M. Alonzo and F. M. Patriana, J. Reinf. Plast. Compos., 2014, 33(24), 2205–2213 CrossRef.
-
E. Haque, Development and Characterization of Thermoplastic SMC: Mineral-filled GMT, 2000 Search PubMed.
- N. Jain, V. K. Singh and S. Chauhan, J. Mech. Behav. Mater., 2017, 26(5–6), 213–222 CAS.
- S. Rathinavel and S. Saravanakumar, J. Nat. Fibers, 2020, 1–10 Search PubMed.
- R. Jumaidin, N. W. Adam, R. A. Ilyas, M. S. F. Hussin, M. M. Taha, M. R. Mansor, U. A.-A. Azlan and M. S. Yob, J. Adv. Res. Fluid Mech. Therm. Sci., 2019, 61(2), 273–281 Search PubMed.
- B. V. Otenda, P. G. Kareru, E. S. Madivoli, E. G. Maina, S. I. Wanakai and W. C. Wanyonyi, J. Nat. Fibers, 2020, 1–13 Search PubMed.
- C. L. Luchese, J. M. Frick, V. L. Patzer, J. C. Spada and I. C. Tessaro, Food Hydrocolloids, 2015, 45, 203–210 CrossRef CAS.
- S. N. H. M. Azmin and M. S. M. Nor, J. Bioresour. Bioprod., 2020, 5(4), 248–255 CrossRef CAS.
- H. Kiani, A. Ashori and S. A. Mozaffari, Polym. Bull., 2011, 66(6), 797–802 CrossRef CAS.
- A. Yap, C. Sim, W. Loh and J. Teo, Oper. Dent., 1999, 24, 358–363 CAS.
- M. Ghaderi, M. Mousavi, H. Yousefi and M. Labbafi, Carbohydr. Polym., 2014, 104, 59–65 CrossRef CAS PubMed.
- B. Wang and M. Sain, Polym. Int., 2007, 56(4), 538–546 CrossRef CAS.
- A. Mandal and D. Chakrabarty, J. Ind. Eng. Chem., 2014, 20(2), 462–473 CrossRef CAS.
- A. Kumar, Y. S. Negi, V. Choudhary and N. K. Bhardwaj, J. Mater. Phys. Chem., 2014, 2(1), 1–8 Search PubMed.
- C. Liu, R. Sun, A. Zhang, J. Ren and Z. Geng, Polym. Degrad. Stab., 2006, 91(12), 3040–3047 CrossRef CAS.
- R. Gond, M. Gupta and M. Jawaid, Polym. Compos., 2021, 42(10), 5400–5412 CrossRef CAS.
|
| This journal is © The Royal Society of Chemistry 2023 |
Click here to see how this site uses Cookies. View our privacy policy here. 
 Open Access Article
 This Open Access Article is licensed under a
  *
*


 ,
,  and
and  are the colour values of the control film (SLPP/PVOH/SBF-0).