 Open Access Article
Creative Commons Attribution 3.0 Unported Licence
Effects of high-pressure and transglutaminase, individually and simultaneously applied, on pea and soy protein isolates†
Rui Pedro
Neto Queirós
 a,
Carlos Alberto
Cruz Pinto
 b,
José António
Lopes-da-Silva
 b and
Jorge Manuel
Alexandre Saraiva
 *b
*b
aDepartment of Applications and Food Processing, Hiperbaric S.A., Calle Condado de Treviño, 6, 09001 Burgos, Spain. E-mail: r.queiros@hiperbaric.com
bLAQV-REQUIMTE, Chemistry Department, University of Aveiro, Campus Universitario de Santiago, 3810-193 Aveiro, Portugal. E-mail: jals@ua.pt; jorgesaraiva@ua.pt
First published on 29th August 2023
Abstract
Microbial transglutaminase (MTG) is an enzyme broadly used to improve the technological properties of proteins; however, many globular proteins are poorly susceptible or unsusceptible to its action. High-pressure processing (HPP) can change the conformation of proteins; thus it may be a useful tool to increase the accessibility of MTG to some proteins. Still, HPP conditions and the concentration of MTG need to be carefully studied to achieve the desired effects. The effects of combined MTG (up to 30 U per g of protein) and HPP (200–600 MPa; 5–15 minutes) on the solubility, the content of accessible sulfhydryl groups and surface hydrophobicity of pea (PPI) and soy (SPI) protein isolates were evaluated employing response surface methodology. The regression models obtained presented high coefficients of determination and high F values. Overall, all three parameters were differently affected by pressure. HPP increased solubility in both PPI and SPI (up to ∼200% at 600 MPa); however, it decreased the concentration of accessible sulfhydryl groups in PPI (∼80% at 600/10 min) and increased it in SPI (up to 28% at 200 MPa/10 min). HPP also affected the surface hydrophobicity of both protein isolates differently, decreasing it in PPI (up to ∼25% at 200 MPa/10 min) and increasing it in the SPI (up to ∼30% at 200 MPa/10 min). Non-HPP protein isolates were not affected by MTG, most likely due to the low accessibility of the enzyme to the proteins. However, when combined, HPP and MTG seem to have both synergistic and antagonistic effects, thus broadening the potential to alter the properties of these proteins. These results suggest that simultaneous HPP and MTG treatments can be used to modify the structure of proteins to tailor their techno-functional properties.
Introduction
Enzymatic crosslinking of food proteins is an attractive “green” approach to manipulate the food structure, as it is a chemical-free technique meaning that it leaves behind no harmful residues that could pollute the environment and in many cases does not require high inputs of energy (e.g. heat). Among potential enzymes for protein crosslinking is transglutaminase, particularly microbial transglutaminase (MTG), which has been broadly studied and is commercially available. Transglutaminase (E.C 2.3.2.13) is an enzyme that catalyses the acyl transfer reaction between the γ-carboxyamide group of protein-bound glutamine residues and primary amines, preferentially the ε-amino group of lysine residues. This reaction may lead to the formation of intra- and/or intermolecular crosslinks between proteins.1 Although most studies have been directed at meat, seafood and dairy proteins, the influence of MTG crosslinking on some technical and physiological functionalities of soy and other plant proteins has already been reported.2–5The extent of the crosslinking reaction is dependent on environmental conditions (pH, temperature, and the absence of enzyme inhibitors) and the structure and conformation of the target protein(s). Several studies have shown that non-globular proteins are more easily accessible to MTG crosslinking activity than globular proteins.6,7 Also, different vegetable proteins have shown different susceptibilities to the MTG crosslinking activity.4 Therefore, despite the ease of MTG in crosslinking various proteins, many of them, particularly globular proteins, are not affected by MTG in their native state due to the inaccessibility of the reactive residues buried within the protein tertiary structure.
High pressure processing (HPP) is an environmentally friendly non-thermal treatment that requires water (which is largely recycled), compressed air, and electricity (which can be produced from renewable sources) and does not produce any effluents. It may induce structural changes in proteins that could expose the mentioned residues, making them (more) accessible to the MTG's acyl active site.8 With this in mind, research studies have already been performed9–11 regarding MTG stability under high pressure, both in buffer solutions and food products, and how the crosslinking activity of the enzyme is affected by pressure. Overall, MTG is stable under pressure, particularly at pH 6 and 7, retaining more than 40% of its activity even at 600 MPa for 30 min.12
The possible increase in crosslinking obtained by MTG and HPP combined treatments may be a suitable tool for the enhanced modification of proteins, allowing the improvement of functional properties without requiring a pre-treatment or using reducing agents.1,13 Hence, it is possible to infer that the combination of MTG and HPP may offer new perspectives for the modification of proteins and may allow desirable functional and technological changes in the protein matrix to be tailor-made . Despite what is already known regarding HPP effects on protein functionality and MTG effects on protein crosslinking and structure development, knowledge concerning the influence of combined physical and enzymatic treatments on vegetable proteins' techno-functional properties is still needed, as most studies were performed on fish,14 meat15 and dairy16,17 products. Therefore, the objective of this work was to evaluate the combined effects of MTG and HPP on protein solubility, the content of accessible sulfhydryl (SH) groups, and surface hydrophobicity (H0) of pea (PPI) and soy (SPI) protein isolates. Tests were performed based on a factorial experimental design to analyze the effect of HPP conditions, pressure (200, 400, and 600 MPa) and holding time (5, 10, and 15 min) and MTG's concentration (0, 15 and 30 U per g protein). An experimental design approach could be further utilized to identify the optimal conditions for protein modification.
Materials and methods
Materials
Readily dispersible PPI (Pisane® M9, Cosucra) and SPI (Induxtra W, Induxtra) were obtained from Induxtra (Induxtra de Suministros Llorella Portuguesa - Indústria Alimentar, Lda., Moita, Portugal). Protein content, determined by elemental analysis (N × 6.25), was 80.9 ± 0.2% for PPI and 86.3 ± 0.4% for SPI. The water content of both protein isolates was ∼10%. According to the suppliers, ash content was lower than 6% and fat content was lower than 4% in both protein isolates. All reagents used were of analytical grade. Activa® Transglutaminase (100 U g−1) was a kind gift from Ajinomoto Foods Europe SAS (Hamburg, Germany).Experimental design and modelling
A Box–Behnken design was the experimental design adopted to analyse the effect of HPP conditions, pressure and holding time, and transglutaminase concentration on the defined properties of PPI and SPI. A set of 45 experiments, including 9 replicates at the central point, were performed in a randomized order. For the description of the response, a quadratic polynomial equation (eqn (1)) and its subsets were used. The general formulation of the model was as follows: | (1) |
| Level (−1) | Level (0) | Level (+1) | |
|---|---|---|---|
| Pressure, P (MPa) (x1) | 200 | 400 | 600 |
| Holding time, t (min) (x2) | 5 | 10 | 15 |
| MTG (U per g of protein) (x3) | 0 | 15 | 30 |
Therefore, six models were constructed: two for soluble protein–pea protein isolate (PPISOL) and soy protein isolate (SPISOL); two for accessible sulfhydryl groups – pea protein isolate (PPISH) and soy protein isolate (SPISH); and two for surface hydrophobicity – pea protein isolate (PPIH0) and soy protein isolate (SPIH0).
Sample preparation
The protein isolates were dispersed in distilled water (1%, w/v) and stirred for 4 h at room temperature for hydration. The pH was adjusted to 7 with 0.1 mol L−1 citric acid and the dispersions were stirred for 40 min at room temperature. The dispersions (40 mL) were placed in flasks (Thermo Scientific™ Nalgene™ Wide-Mouth Lab Quality HDPE Bottles) for processing.Transglutaminase reaction
To assess the isolated effect of MTG on the protein dispersions, a solution of MTG was prepared in distilled water and diluted to have a final concentration of 10, 20 or 30 U per g of protein when added to the dispersions. After adding the MTG solution to the protein dispersions, the samples were incubated at 37 °C for 60, 120 and 180 min. To evaluate the combined effects of HPP and MTG, a solution of MTG was prepared in distilled water and diluted to have a final concentration of 15 or 30 U per g of protein when added to the dispersions. For trials combining MTG and HPP, MTG was added to the dispersions immediately before HPP. After processing all the samples were kept at 37 °C for 60 min (both with and without added MTG). At the end of the reaction time of both pressure treated and untreated dispersions, MTG was inactivated by adding N-ethylmaleimide (0.1 mL; 0.1%).19 All samples were kept at 4 °C overnight and were centrifuged at 6000 rpm for 20 min at 4 °C before analysis (solubility, sulfhydryl groups, and surface hydrophobicity).Pressure treatments
For the samples to be studied according to the experimental design described above, HPP conditions and MTG concentrations were those shown in Table 1. HPP was performed at room temperature, ∼20 °C, using a hydrostatic press (Hiperbaric 55, Burgos, Spain). This HPP equipment has a pressure vessel of 200 mm inner diameter and 2000 mm length and a maximum operating pressure of 600 MPa.Soluble protein
After centrifugation, the concentration of soluble protein was determined in the supernatant using the method of Bradford (1976)20 with a few modifications. Specifically, 250 μL of the Bradford Reagent were added to an aliquot of 50 μL of the protein dispersion, mixed for 30 s and then incubated for 20 min at room temperature. The absorbance was measured at 595 nm using a spectrophotometer (Microplate Spectrophotometer Multiskan Go, Thermo Scientific, USA) and the protein concentration was determined using a calibration curve using BSA standards.Sulfhydryl groups
The content of accessible sulfhydryl groups was determined according to the method of Beveridge, Toma & Nakai (1974)21 with some modifications. After centrifugation, the control and pressurized protein dispersions were diluted in 0.086 mol L−1 Tris buffer (pH 8.0). Specifically, 500 μL of the dispersions were added to 500 μL Tris buffer and 50 μL Ellman's reagent and kept for 60 min at room temperature (∼20 °C). The mixture's absorbance was measured at 412 nm using a spectrophotometer (Shimadzu UV-1280, Japan). The content of SH was determined by dividing the absorbance value by the molar extinction coefficient of 13![[thin space (1/6-em)]](https://www.rsc.org/images/entities/char_2009.gif) 600.
600.
Surface hydrophobicity
The surface hydrophobicity of the proteins was determined using the fluorescent probe 1-anilino-8-naphthalene-sulfonate (ANS) according to the method of Kato & Nakai (1980).22 Protein dispersions were diluted to 0.05–0.25 mg mL−1 with 0.01 mol L−1 phosphate buffer pH 7. An aliquot of 20 μL of ANS (0.008 mol L−1 in 0.01 mol L−1 phosphate buffer) was added to 4 mL of each protein solution and then the fluorescence intensity was measured (390 nm – excitation; 470 nm – emission) using a fluorescence spectrometer (Hitachi F2000 fluorescence spectrophotometer, Tokyo, Japan). The index of H0 was calculated using the initial slope of a fluorescence intensity vs. protein concentration (mg mL−1) plot (calculated by linear regression analysis).Statistical analysis
A stepwise method was used to construct the regression models where the variables were included or excluded from the model based on its p-value with a significance of p = 0.05. When no more variables were eligible for inclusion or removal the iterative method ended. The coefficients of the model were estimated by maximum likelihood. Their standard errors and p-values were used to inspect the statistical significance of the coefficients. The model summary statistics include model significance, goodness-of-fit and predictive ability. Analysis of variance (ANOVA) and an evaluation of the F statistics and its significance were used to assess the statistical significance of the regression models. The goodness-of-fit was evaluated by the coefficient of determination (0% ≤ R2 ≤ 100%) and the R2 was adjusted for the number of terms in the model (adjusted R2). Additionally, the model’s predictive ability was quantified from the predicted R2 obtained from the R2 evaluated from residuals of observations not considered in the construction of the model (i.e., each observation was removed from the dataset, the regression model was estimated, and the corresponding residual was evaluated). The variance of the data was decomposed into the contribution of the model terms, discerning between the contribution of linear, quadratic and 2-way interaction terms, which sum up to R2, and error terms, distinguishing lack-of-fit and pure error. The lack-of-fit of the models was also investigated as experimental data contained replicate measures, where differences between replicate measures are assumed to represent the pure error in the analysis. All statistical analyses were performed with Minitab v19 (PA, USA) and Microsoft Excel 2010 (Microsoft Office System, USA), considering a statistical significance of p = 0.05.Results and discussion
Regression modelling
The model described in eqn (1) was fitted to the experimental data in Table 2 and the estimates of the coefficients of the models are presented in Table 3. Constant terms were statistically significant in all models (p < 0.001). Regarding the linear terms, pressure, holding time and concentration of MTG were statistically significant in the models PPISOL, PPISH, and SPIH0. Still regarding the linear terms, in SPISOL the holding time was not statistically significant, and in PPIH0 and SPISOL only the concentration of MTG was statistically significant (p < 0.001). With respect to quadratic terms, the pressure was statistically significant only in PPISH and SPISOL, whereas the holding time was statistically significant in PPISOL, PPIH0, SPISOL, and SPIH0. MTG's concentration was not statistically significant only in SPISH. Finally, there were 2-way interaction terms statistically significant in all the models, with emphasis on pressure and holding time, which were significant in all models. On the overall assessment of the models, Table S1 (available in the ESI†) shows the model's summary statistics. All models were statistically significant, with the ANOVA showing low values of the p-values. Regarding the goodness-of-fit and predictive ability of the models, Table S1† shows that R2, adjusted R2 and predicted R2 were large for all models, hence supporting that a large percentage of the variability of the data is explained using the constructed models. Finally, lack-of-fit was not significant (p > 0.05) in all models. Furthermore, plots of residuals vs. the predicted response showed no defined structure and the normal probability plots of residuals exhibited a straight line (ESI; Fig. S1–S6†). Thus, overall, the six models seem to be good representatives of the combined effects that HPP and MTG have on the referred properties of PPI and SPI. The contribution of the data variability explained using the model terms (expressed as a %), distinguishing linear, quadratic and interaction ones is also presented. In the soluble protein models, linear components have the largest contribution to the respective models (c.a. 50%), whereas, in the SH models, 2-way interactions have the largest contribution (ca. 50%). For soy proteins, a large contribution of the linear components was also observed for the surface hydrophobicity model.| Pressure(MPa) | Time (min) | MTG (U g−1) | Pea protein isolates | Soy protein isolates | ||||
|---|---|---|---|---|---|---|---|---|
| Soluble protein (mg mL−1) | SH groups (μmol per g protein) | Surface hydrophobicity | Soluble protein (mg mL−1) | SH groups (μmol per g protein) | Surface hydrophobicity | |||
| a Values are presented as a mean ± standard deviation (n = 3). | ||||||||
| 200 | 5 | 15 | 0.67 ± 0.02 | 2.47 ± 0.26 | 1939 ± 108 | 2.78 ± 0.04 | 3.12 ± 0.09 | 3487 ± 104 |
| 200 | 10 | 0 | 2.02 ± 0.15 | 2.59 ± 0.19 | 1896 ± 66 | 2.79 ± 0.07 | 3.57 ± 0.16 | 3467 ± 108 |
| 200 | 10 | 30 | 1.19 ± 0.07 | 1.45 ± 0.17 | 1951 ± 151 | 2.33 ± 0.10 | 2.07 ± 0.22 | 3083 ± 86 |
| 200 | 15 | 15 | 1.40 ± 0.06 | 0.63 ± 0.09 | 1678 ± 87 | 2.57 ± 0.09 | 2.11 ± 0.20 | 2036 ± 105 |
| 400 | 5 | 0 | 1.55 ± 0.09 | 1.11 ± 0.14 | 2853 ± 112 | 3.00 ± 0.02 | 2.90 ± 0.13 | 3035 ± 110 |
| 400 | 5 | 30 | 1.34 ± 0.11 | 1.41 ± 0.21 | 1649 ± 111 | 2.46 ± 0.08 | 2.12 ± 0.09 | 2387 ± 51 |
| 400 | 10 | 15 | 1.67 ± 0.07 | 0.68 ± 0.22 | 1470 ± 57 | 2.26 ± 0.04 | 2.48 ± 0.23 | 2080 ± 91 |
| 400 | 10 | 15 | 1.80 ± 0.05 | 0.54 ± 0.10 | 1550 ± 123 | 2.27 ± 0.09 | 2.61 ± 0.09 | 1960 ± 71 |
| 400 | 10 | 15 | 1.74 ± 0.04 | 0.70 ± 0.21 | 1474 ± 83 | 2.29 ± 0.09 | 2.64 ± 0.16 | 2013 ± 54 |
| 400 | 15 | 0 | 2.02 ± 0.09 | 0.54 ± 0.20 | 2021 ± 45 | 3.21 ± 0.09 | 2.86 ± 0.03 | 2813 ± 112 |
| 400 | 15 | 30 | 1.61 ± 0.05 | 0.64 ± 0.09 | 2057 ± 127 | 2.57 ± 0.07 | 2.14 ± 0.20 | 2182 ± 102 |
| 600 | 5 | 15 | 1.67 ± 0.07 | 0.55 ± 0.20 | 1587 ± 64 | 2.70 ± 0.08 | 2.07 ± 0.06 | 1491 ± 106 |
| 600 | 10 | 0 | 2.10 ± 0.07 | 0.40 ± 0.18 | 2563 ± 103 | 2.86 ± 0.10 | 2.11 ± 0.22 | 2675 ± 99 |
| 600 | 10 | 30 | 2.49 ± 0.11 | 2.12 ± 0.24 | 1367 ± 108 | 2.27 ± 0.10 | 2.43 ± 0.16 | 2269 ± 64 |
| 600 | 15 | 15 | 1.76 ± 0.14 | 1.76 ± 0.20 | 1926 ± 58 | 2.90 ± 0.13 | 2.87 ± 0.23 | 2352 ± 16 |
| Estimated coded coefficients | Pea protein isolates | Soy protein isolates | ||||
|---|---|---|---|---|---|---|
| Soluble protein | SH groups | Surface hydrophobicity | Soluble protein | SH groups | Surface hydrophobicity | |
| a Values are presented as a mean ± standard error; x1, x2, and x3 represent dimensionless coded forms of pressure, holding time, and transglutaminase concentration, respectively. All terms are significant (p < 0.001) otherwise marked: *0.001 ≤ p < 0.01; **0.01 ≤ p < 0.05. | ||||||
| Constant | 1.72 ± 0.03 | 0.64 ± 0.06 | 1524 ± 35 | 2.27 ± 0.04 | 2.54 ± 0.03 | 2035 ± 32 |
| x 1 | 0.34 ± 0.02 | −0.29 ± 0.05 | — | — | −0.17 ± 0.04 | −411 ± 23 |
| x 2 | 0.19 ± 0.02 | −0.25 ± 0.05 | — | — | — | −127 ± 23 |
| x 3 | −0.13 ± 0.02 | 0.12 ± 0.05** | −289 ± 26 | −0.28 ± 0.02 | −0.34 ± 0.04 | −259 ± 23 |
| x 1·x1 | — | 0.71 ± 0.07 | — | 0.11 ± 0.03* | — | — |
| x 2·x2 | −0.34 ± 0.03 | — | 239 ± 38 | 0.35 ± 0.03 | — | 294 ± 34 |
| x 3·x3 | 0.24 ± 0.03 | 0.28 ± 0.07 | 401 ± 38 | 0.18 ± 0.03 | — | 557 ± 34 |
| x 1·x2 | −0.16 ± 0.03 | 0.76 ± 0.07 | 150 ± 36 | 0.11 ± 0.03* | 0.45 ± 0.06 | 578 ± 33 |
| x 1·x3 | 0.30 ± 0.03 | 0.71 ± 0.07 | −313 ± 36 | — | 0.45 ± 0.06 | — |
| x 2·x3 | — | — | 310 ± 36 | — | — | — |
Effects of HPP and MTG on solubility
The solubility of proteins is greatly associated with their techno-functional properties, being decisive for their stabilizing, thickening, and gelling capabilities.23 From the initial amount of PPI dispersed in water, 10 mg mL−1, the amount of solubilized pea protein for the unprocessed sample was 0.70 ± 0.04 mg mL−1, less than half of the soluble protein amount obtained for the unprocessed SPI (1.90 ± 0.06 mg mL−1). The low amount of soluble protein is a common characteristic of commercial protein isolates, already reported in previous studies with PPI24 and SPI,25 and is generally attributed to a high degree of protein's denaturation and the presence of insoluble aggregates formed during isoelectric precipitation.Overall, the addition of MTG to non-HPP protein isolates (up to 30 U per g protein and to a reaction time of 180 min) resulted in no significant differences (p > 0.05) in the concentration of soluble proteins relative to the control samples – Table 4. The lower solubility of the protein isolates, particularly in the case of globular proteins that have a compact structure, may limit the accessibility of MTG to glutamine and lysine residues, limiting the enzyme effects.26 An exception was verified for PPI, where a MTG's concentration of 30 U per g protein and a reaction time above 120 minutes led to an increase in the concentration of soluble protein of approximately 31%. MTG catalyses the acyl transfer reaction between glutamine and lysine residues; however, in the absence of lysine or other primary amines, water will react as a nucleophile, resulting in deamidation.26 Pea proteins are rich in glutamine and asparagine, which can be converted through MTG into glutamic acid and aspartic acid, respectively. In the absence of conditions that could lead to a pronounced crosslinking and formation of large protein aggregates that would decrease protein solubility, the resulting increased electrostatic repulsion between deamidated proteins may increase their solubility.2,27
| MTG (U per g protein) | Time (min) | Pea protein isolates | Soy protein isolates | ||||
|---|---|---|---|---|---|---|---|
| Soluble protein (mg mL−1) | SH groups (μmol per g protein) | Surface hydrophobicity | Soluble protein (mg mL−1) | SH groups (μmol per g protein) | Surface hydrophobicity | ||
| a Values are presented as a mean ± standard deviation (n = 3). Different letters indicate significant differences (p < 0.05). | |||||||
| 10 | 0 | 0.79 ± 0.08a | 2.48 ± 0.18a | 2517 ± 63a | 2.09 ± 0.20a | 1.98 ± 0.22a | 2595 ± 89a |
| 60 | 0.81 ± 0.13a | 2.48 ± 0.09a | 2586 ± 78a | 1.93 ± 0.08a | 2.01 ± 0.07a | 2573 ± 31a | |
| 120 | 0.82 ± 0.13a | 2.46 ± 0.05a | 2535 ± 85a | 1.92 ± 0.07a | 2.04 ± 0.06a | 2555 ± 86a | |
| 180 | 0.93 ± 0.04a | 2.43 ± 0.18a | 2510 ± 57a | 2.10 ± 0.13a | 1.88 ± 0.09a | 2622 ± 96a | |
| 20 | 0 | 0.86 ± 0.05a | 2.34 ± 0.15a | 2528 ± 72a | 2.05 ± 0.10a | 1.93 ± 0.06a | 2630 ± 86a |
| 60 | 0.93 ± 0.07a | 2.42 ± 0.12a | 2509 ± 60a | 1.94 ± 0.12a | 2.11 ± 0.12a | 2643 ± 107a | |
| 120 | 0.90 ± 0.02a | 2.39 ± 0.11a | 2519 ± 51a | 2.00 ± 0.08a | 1.90 ± 0.05a | 2590 ± 62a | |
| 180 | 0.91 ± 0.04a | 2.38 ± 0.06a | 2499 ± 86a | 1.99 ± 0.10a | 1.92 ± 0.10a | 2484 ± 103a | |
| 30 | 0 | 0.80 ± 0.07a | 2.33 ± 0.16a | 2571 ± 74a | 1.99 ± 0.20a | 1.97 ± 0.17a | 2524 ± 76a |
| 60 | 0.91 ± 0.03a | 2.36 ± 0.09a | 2504 ± 60a | 1.99 ± 0.14a | 1.94 ± 0.14a | 2557 ± 44a | |
| 120 | 1.09 ± 0.08 b | 2.40 ± 0.14a | 2558 ± 57a | 1.94 ± 0.13a | 1.98 ± 0.16a | 2490 ± 92a | |
| 180 | 1.05 ± 0.09 b | 2.51 ± 0.13a | 2629 ± 51a | 2.00 ± 0.22a | 2.00 ± 0.08a | 2538 ± 120 a | |
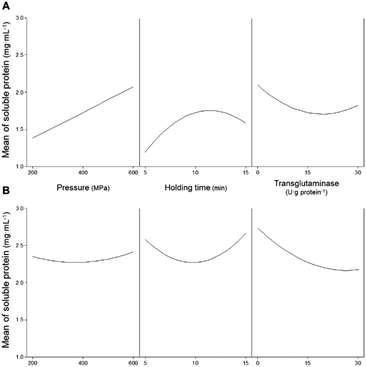
For pressurized samples, all tested conditions increased the concentration of soluble proteins for PPI, except for 200 MPa/5 min/15 U g−1 that did not have a significant effect, and also for SPI. Fig. 1 shows the individual effects of each parameter on the concentration of soluble proteins present in the PPI (Fig. 1A), as predicted by the model PPISOL, and in SPI (Fig. 1B), as predicted by the PPISOL model. For PPI, it is evident that raising pressure increases the amount of soluble proteins.
Similarly, increasing holding time up to approximately 13 min also increased proteins' solubility; however, a further increase in time does not further increase the concentration of soluble proteins.
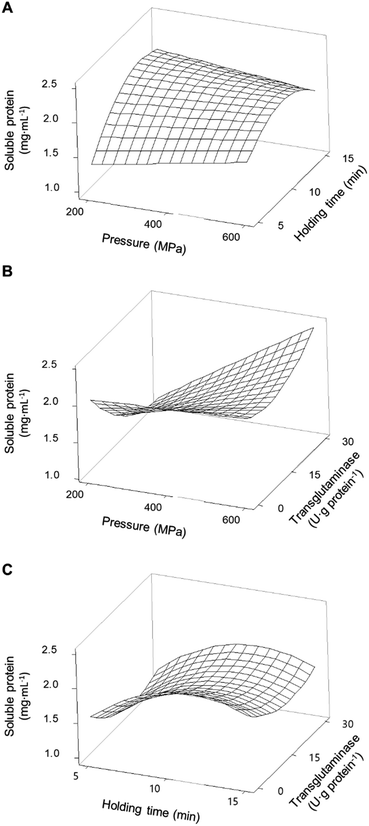
Fig. 2A shows the interaction effects of HPP parameters (pressure and holding time) on the concentration of soluble proteins without the addition of MTG. The smallest increase in the concentration of soluble proteins (an increase of 91%) was verified under the lowest HPP conditions (i.e., 200 MPa/5 min). Overall, increasing pressure and increasing holding time, up to ca. 13 min, led to an increase of up to approximately 200% in the concentration of soluble protein compared to control samples. When a pressure above 400 MPa is considered, a longer holding time does not further increase the proteins' solubility.
In what concerns SPI, every tested condition involving pressure increased proteins' solubility (Table 2). Considering only the individual parameters, although pressure increased the concentration of soluble protein, the pressure level seemed to not have much influence (Fig. 1B).
On the other hand, varying the holding time impacted the proteins' solubility, as intermediate holding times (around 10 min) resulted in a smaller increase than at 5 or 15 min. Although there are some interaction effects of pressure and holding time, these are not very large.
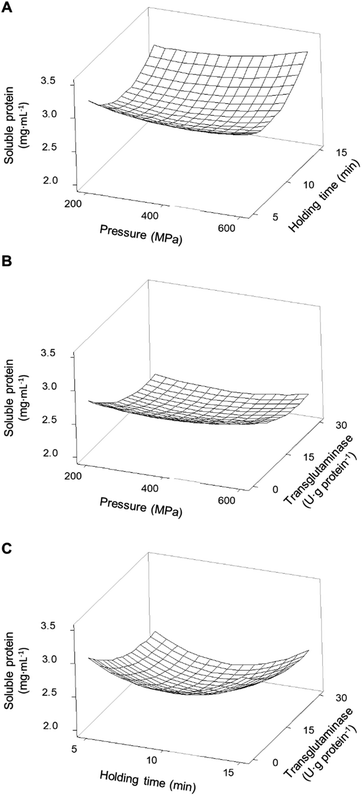
All combinations of pressure and holding time led to an increase in soluble proteins and a synergetic effect was observable at the higher pressures and longer times, peaking at 600 MPa/15 min where the concentration of soluble proteins increased by 77% relative to unprocessed samples (Fig. 3A).
The smaller increase in the concentration of soluble proteins, around 44%, was verified under intermediate HPP conditions (375 MPa/9 min). In general HPP caused an increase in protein solubility, although with a magnitude dependent on the type of protein and HPP conditions, which is in accordance with what is described in the literature, especially for soy proteins.28–31 This increase is most likely due to some unfolding of the proteins and the dissociation of aggregates promoted by pressure.32,33 It is worth mentioning that pressure may enhance interactions between the protein and solvent, thus increasing solubility; however, it may also expose hydrophobic residues increasing intermolecular interactions and the formation of insoluble aggregates, therefore, reducing solubility.34,35 These phenomena may explain why longer holding times did not further increase the pea proteins' solubility or why there was a smaller increase in SPI's solubility at intermediate holding times compared to 5 or 15 min.
MTG had the contrary effect of the HPP parameters, since the presence of the enzyme during the HPP treatments led to a general decrease in protein solubility, for both PPI (Fig. 1A) and SPI (Fig. 1B). However, when interactions were considered, the addition of MTG resulted in different effects depending on the pressure level and type of protein.
For PPI, at low-pressure levels, i.e. <400 MPa, increasing MTG's concentration decreased proteins' solubility, reaching levels near the control samples at 200 MPa, counteracting the effects of pressure (Fig. 2B). On the other hand, at pressure levels above 400 MPa and 10 min holding time, increasing MTG's concentration increased the concentration of soluble proteins up to 2.48 ± 0.05 mg mL−1 (∼250% increase compared to control), showing a synergetic effect between pressure and the MTG concentration. In a general way increasing holding time, at moderate pressure (400 MPa), increased the concentration of soluble proteins; however, this parameter seems to have no interaction effect with the concentration of MTG – Fig. 2C and Table 2. The increase in the concentration of MTG progressively reduced the proteins' solubility present in the SPI – Fig. 1B. Overall, the higher the concentration of MTG the more pronounced the reduction of protein solubility, counteracting, to some extent, the increase promoted by pressure (Fig. 3B).
Overall, there were no synergetic or antagonistic effects between holding time and the MTG concentration – Fig. 3C and Table 2.
Information about the combined effects of HPP and MTG on the solubility of proteins from legumes is scarce. Still, when considering other types of proteins (e.g., β-lactoglobulin, casein, bovine serum albumin, ovalbumin, etc.), one can expect that HPP facilitates the crosslinking of proteins catalysed by MTG.10,13 HPP might induce structural changes in proteins that may expose glutamine and lysine residues, making them accessible to the MTG's acyl active site.8 Studies on the effects of MTG on SPI indicate that β-conglycinin (subunits α, α′and β) and the acidic subunits of glycinin can be crosslinked by MTG, forming high molecular weight biopolymers, whereas the basic subunits of glycinin remain intact. As a result, the solubility of the protein isolates decreased due to MTG activity. In addition, since the glycinin's basic subunits may remain intact, they can form aggregates that add to the reduction of solubility.5,36 A similar reduction in solubility of crosslinked PPI due to the formation of large molecular weight compounds was also reported.37 Therefore, the results suggest that HPP may dissociate proteins' aggregates present in PPI and SPI increasing their solubility. In doing so, and by altering the structure of proteins, pressure can make them more accessible to the action of MTG, which can result in the formation of high molecular weight biopolymers. Still, for PPI, a pressure >400 MPa and an increase in MTG's concentration from 15 to 30 U per g protein led to an increase in proteins' solubility, suggesting that these conditions may have promoted the deamidation of glutamine and asparagine.
Effects of HPP and MTG on accessible sulfhydryl groups
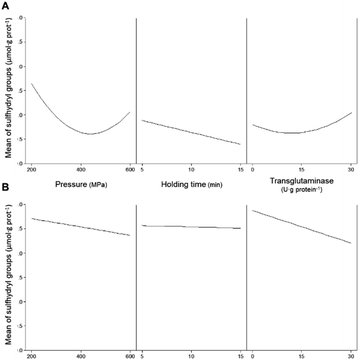
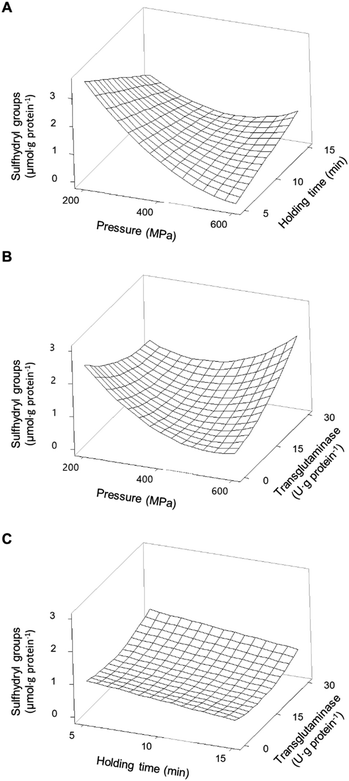
Free/accessible sulfhydryl groups and disulphide bonds can influence the technological properties of proteins. These weak secondary bonds help maintain the tertiary structure of proteins, and their manipulation is important to influence the functional properties of proteins.35 The addition of MTG up to 30 U·per (g protein) with a reaction time of up to 180 min, without pressure treatment, did not significantly (p > 0.05) affect the concentration of SH in any of the protein isolates (Table 4). As previously discussed, the lack of effects of MTG on non-HPP protein isolates is most likely due to the inaccessibility of the enzyme to glutamine and lysine residues. The content of SH for unprocessed PPI was 2.2 ± 0.4 μmol·per (g protein), whereas that measured for the unprocessed SPI was 1.9 ± 0.1 μmol·per (g protein). Most treatments involving pressure decreased the concentration of SH for PPI samples, whereas an opposite effect, although less pronounced, was observed for the SPI samples, especially at the lowest tested pressure (Table 2). HPP alone has shown a more pronounced effect on decreasing the amount of accessible SH for pea proteins than for soy proteins. Fig. 4A illustrates the individual main effects of each one of the parameters on the concentration of SH present in PPI as predicted by the model PPISH.When considering the pressure individually, this parameter decreases the concentration of SH groups, particularly at intermediate pressures, within the range analysed. At 400 MPa, the holding time decreases the SH content linearly, but the effect seems to be dependent on the applied pressure (Fig. 5A).
A maximum SH content was predicted at 200 MPa/5 min and represents a 91% increase relative to non-processed samples (Fig. 5A).
However, increasing the severity of HPP conditions led to a progressive reduction of the concentration of accessible SH groups, reaching a predicted minimum at 600 MPa/5 min. Under more severe pressure conditions, i.e., 500 – 600 MPa, longer holding times appear to have a less negative effect on accessible SH than short times.
When MTG was added to PPI, and only considering its main effect, it had a contrary effect to the other processing parameters, as concentrations above 15 U per g protein increased the content of SH (Fig. 4A). The effects of combined pressure and MTG are complex (Fig. 5B), and it seems that these parameters had an antagonistic effect, with the presence of MTG counteracting the reduction of SH caused by HPP. No significant interaction effect was observed between MTG's concentration and the holding time (Table 3).
Moreover, it appears that the PPI with MTG is associated with an increase in the accessible SH content, and this in turn is correlated with an increase in protein solubility.
However, it has been observed that the application of pressure to PPI can lead to a decrease in SH content, yet still result in improved protein solubility. This suggests that the relationship between SH groups and protein solubility is not always linear and that a variety of other factors may come into play.
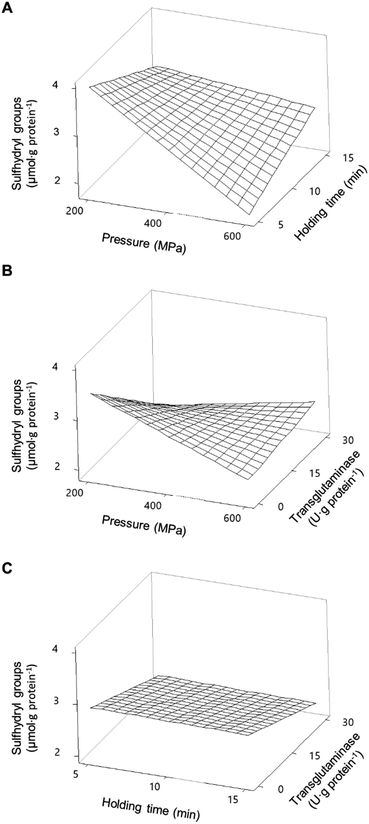
With respect to SPI, Fig. 4B illustrates the individual main effects predicted by the model SPISH. Although HPP caused a slight increase in the SH concentration, compared to the non-pressurized sample, the increase in pressure also caused a decrease in SH for the soy proteins, whereas the holding time seemed to have no impact (Fig. 4B).
When considering the combined effects of HPP parameters (pressure and time), and without the addition of MTG, the decrease in SH promoted by increasing pressure is clearly dependent on the holding time and somewhat unexpected; the higher the holding time the less pronounced the effect of increasing pressure (Fig. 6A), nevertheless presenting a behaviour similar to that observed for PPI. It is worth mentioning that even so all pressurized samples showed higher SH than the SPI unprocessed samples (Table 2), with the maximum increase predicted to be approximately 110% at 200 MPa/5 min.
The minimum predicted concentration of SH in processed SPI was verified at 600 MPa/5 min, comparable to the value of unprocessed samples. Overall, the results suggest that applying pressure resulted in the dissociation/unfolding of the proteins exposing buried SH, particularly at lower pressure values (<400 MPa).
However, higher pressure values may have promoted hydrophobic interactions that led to S–S exchange and/or formation of new disulphide bonds resulting in a decrease in SH.38,39 The results here described agree with the available literature concerning soy proteins and proteins from other sources, where it is reported that pressure below 300 MPa may preserve or improve the content of SH, whereas higher pressure values or longer holding times seem to decrease it.35,38,40
The individual main effect of MTG was the decrease in the amount of SH for soy proteins, as can be seen in Fig. 4B. In fact, the higher the MTG's concentration, the higher the observed decrease in SH. However, when considering its combined effect with pressure, this reduction seemed to be much more accentuated at lower pressure values (e.g., 200 MPa) than at 600 MPa, where the effect of MTG is barely noticeable (Fig. 6B). Similarly to PPI, an interaction effect between MTG's concentration and the holding time was not verified .
Therefore, most treatments with MTG led to a decrease in SH. This decrease after MTG catalytic action was already reported for SPI41 and a vicilin-rich kidney protein isolate.33 This is most likely due to the crosslinking between proteins, which may have promoted some changes in the conformation of the proteins and consequent formation of new disulphide bonds and/or buried SH into the resulting high molecular weight aggregates making it no longer measurable as free/accessible sulfhydryl groups.33,41 Still, some conditions have led to an increase in SH present in PPI after MTG, namely when pressure >300 MPa was applied. Similar results were reported for sweet potato protein isolate and peanut protein isolate treated with HPP and micro-fluidization, respectively, and subsequent MTG crosslinking.42,43 The mechanism by which this happens is not yet fully understood; still, it is suggested that the conformational changes mentioned above promoted by the crosslinking may expose buried free sulfhydryl groups.43 Furthermore, analysing Fig. 3 and 6, a noticeable trend can be observed in SPI samples treated with MTG. Specifically, a decrease in the content of accessible sulfhydryl groups appeared to correspond with a decrease in protein solubility. This observation may suggest a potential correlation between these two parameters.
Effects of HPP and MTG on surface hydrophobicity
Another important factor affecting the technological properties of proteins is their surface hydrophobicity. Increases in the H0 are related to the exposure of the side chain of aromatic amino acids, that is to say, the higher the H0 the higher the number of hydrophobic groups exposed to the outside of the protein.35 For the samples here analysed, the H0 of both unprocessed protein isolates presented similar values, c.a. 2600. This value was not significantly (p > 0.05) affected by the addition of MTG up to 30 U per g protein and a reaction time of up to 180 min without pressure treatment (Table 4). Similarly to solubility and content of accessible sulfhydryl groups, H0 was not affected when MTG was added to non-HPP protein isolates most likely due to the inaccessibility of the enzyme to its substrates. Fig. 7A illustrates the individual main effects of each one of the studied parameters on the H0 of PPI as predicted by the model PPIH0.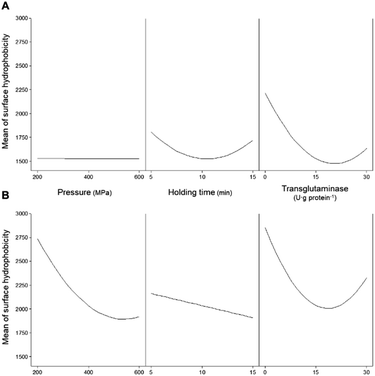 | ||
| Fig. 7 Main effects of the independent variables (pressure, holding time, and concentration of transglutaminase) on the surface hydrophobicity of (A) pea and (B) soy protein isolates. | ||
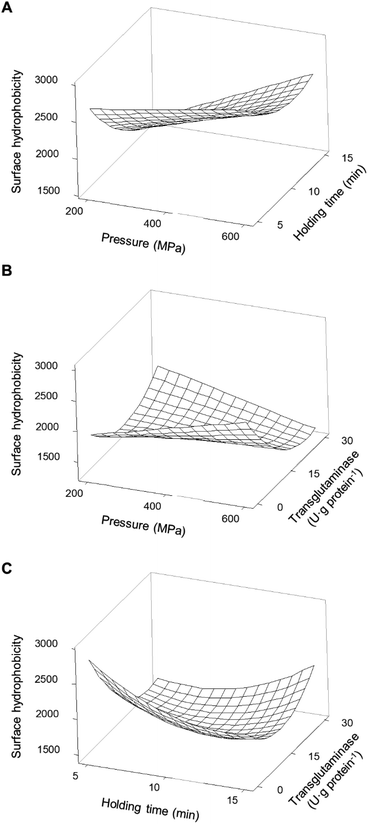
It seems that the effect of pressure on the surface hydrophobicity was not dependent on the pressure level. On the other hand, intermediate holding times seem to have resulted in lower surface hydrophobicity values than low or high holding time values. When considering the combination of the HPP parameters (pressure and time – Fig. 8A) it was observed that the holding time and pressure values had interaction effects.
For instance, the H0 decreased to 38% when the holding time increased from 5 to 15 min at 200 MPa, whereas a reduction of 14% with the same time increase was observed at 600 MPa. An increase in H0 occurred with increasing pressure, more markedly at longer times. For instance, for a holding time of 5 min, increasing pressure from 200 to 600 MPa resulted in a small increase (12%), while the same increase in pressure with a 15 min holding time led to an increase of 56%. Still, most HPP conditions with higher holding times decrease the H0 when compared with untreated samples, particularly at lower 200 MPa and 15 min.
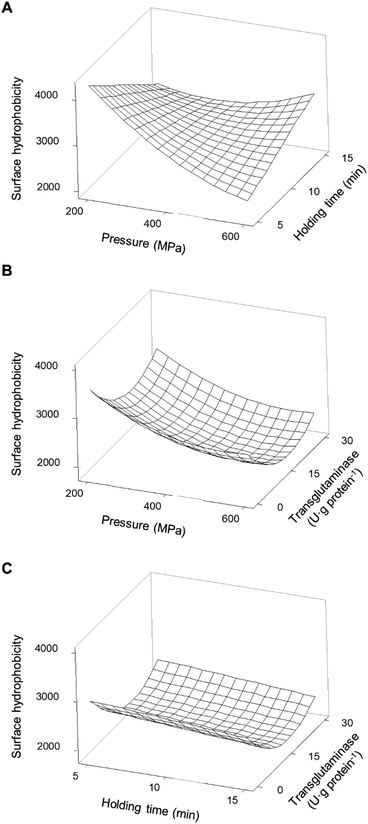
In what concerns SPI, considering the individual main effects of HPP (i.e. pressure and holding time), the increase in both led to lower values of H0; still, an additional increase of pressure from ca. 500 MPa did not further decrease H0 – Fig. 7B. Considering the combined effect of HPP parameters (Fig. 9A) it was possible to observe distinct behaviours at low and high pressure and at shorter and longer holding times.
The predicted higher value of H0 was 4261 ± 60 at 200 MPa/5 min, which represents an increase of 67% relative to the unprocessed samples. From this point, increasing pressure up to 600 MPa resulted in a decrease of 46% of the H0 and increasing holding time to 15 min caused a 33% decrease. In contrast, increasing the holding time, from 5 to 15 min, at 600 MPa increased H0 by 40%. Overall, it seems that pressure variations had more impact on the H0 at shorter than longer holding times, under most pressure conditions resulting in an increase in H0 compared to the untreated SPI.
Applying pressure may result in the unfolding of the proteins, thus exposing the number of hydrophobic groups on their surface. As a result, in general, HPP increases the H0 of proteins due to the resulting conformational changes.35 Still, as described here, the combination of low pressure (i.e. 200 MPa) and high holding time (15 min) has led to a decrease in H0 of PPI, whereas more intensive HPP conditions did not mainly impact this parameter. Pressure may promote interactions between the proteins' hydrophobic regions and solvent or between proteins and change the equilibrium between aggregation and dissociation processes decreasing H0.44
In this particular case, it is possible that these low HPP conditions may have promoted protein–water interactions of PPI, reducing H0 and consequently increasing protein solubility, as the solubility of PPI was higher under these conditions – Fig. 2A. The described results for SPI are in agreement with what is reported in the literature; for instance, applying low pressure to soy's glycinin and β-conglycinin increased their H0.45,46 Still, increasing pressure may lead to a smaller increase in H0 or even decrease it.
This lower H0 under more severe HPP conditions compared to that under mild conditions was already reported for SPI,31,38 which is likely due to an increased aggregation accompanied by conformational changes (dissociation of protein subunits, changes in the tertiary and secondary structures, increasing exposure of hydrophobic groups, etc.).35
The addition of MTG to PPI changed the effect of pressure on H0 – Fig. 8B. While without MTG the increase in pressure from 200 to 600 MPa led to an increase of approximately 30% of H0 when in combination with MTG, the same increase in pressure led to a decrease of also ca. 30% with 30 U·per (g protein). An interaction effect was also observed between holding time and MTG's concentration – Fig. 8C. While, at 400 MPa and no MTG, an increase in holding time from 5 to 15 min led to a 25% reduction of H0, the combination with 30 U·per (g protein) of MTG had a contrary effect, i.e. the same increase in holding time increased H0 by approximately 30%. A lower concentration of MTG (i.e. around 15 U·per (g protein)) seemed to stabilize H0 regarding HPP parameter variations, as H0 did not vary considerably with pressure or holding time changes when this concentration of MTG was used – Fig. 8B and C.
Considering SPI, the addition of MTG at a lower concentration (15 U·per (g protein)) decreased H0; however, it did not seem to have an antagonistic or synergetic effect with any of the other studied parameters, as can be seen in Table 3 and Fig. 9B and C. Still, increasing the concentration of MTG to 30 U·per (g protein) appeared to have a smaller impact on the H0. Broadly, adding MTG during HPP yielded a lower H0; however, in most cases, the reduction was higher with an MTG concentration of 15 than with 30 U·per (g protein). There are reports where MTG both increases47,48 and decreases49,50 the H0 of different proteins. The crosslink promoted by MTG may occlude hydrophobic residues inside the structure of the higher molecular weight polymers formed, decreasing H0.49 Additionally, the deamination of glutamic and aspartic acids may increase the overall negative charge of the proteins, leading to a decrease in H0.26 In contrast, the crosslinking of proteins may also change their structure consequently resulting in unfolding, thus exposing hydrophobic regions and increasing the H0.42 Therefore, the concentration of MTG may lead to different degrees of crosslinking and deamination reaction rates, differently affecting the H0 of proteins. Similar to the observed possible correlation between accessible SH content and protein solubility, there appears to be a potential relationship between the H0 and protein solubility. Specifically, a decrease in the H0 appeared to correspond with a decrease in protein solubility, as observed in the analysed data.
Conclusions
This work has shown that the combination of HPP and MTG may be an interesting tool to modify the function of food proteins. Overall, the effects of MTG and HPP on the studied properties are dependent on the selected processing conditions and on the protein type. A series of synergistic and antagonistic effects between HPP and MTG were observed throughout this work. For instance, the addition of MTG seems to thwart the increase in solubility promoted by HPP. The possible dissociation of aggregates and protein conformational expansion promoted by HPP seems to have made the proteins more accessible to MTG, which further modified the properties of these proteins. It is also important to highlight that the presented results indicate the presence of certain possible correlations between solubility, SH, and H0 in some cases. It is noteworthy that the correlation analysis does not establish a causal relationship. The current observations indicate a potential association between the variables; however, additional research is warranted to elucidate the precise nature of these associations and the underlying mechanisms. These findings would be useful for understanding how combined HPP and MTG treatments may help modify the structure of proteins and consequently tailor their techno-functional properties, both by synergistic and antagonistic effects of HPP and MTG. Furthermore, it is important to note that these results should be further explored, as the data obtained in this work are limited to model proteins. The use of real food should be explored in order to further understand the effects of combined HPP and MTG treatments, for instance to improve emulsions or gelation of foods. Additionally, the optimization of the HPP and MTG concentration conditions should be explored in order to determine the optimal conditions that may help modify the structure of proteins and tailor their techno-functional properties to each specific food.Conflicts of interest
The authors have no conflict of interest to declare.Acknowledgements
This work received financial support from PT national funds (FCT/MCTES, Fundação para a Ciência e Tecnologia and Ministério da Ciência, Tecnologia e Ensino Superior) through the projects UIDB/50006/2020 and UIDP/50006/2020. Thanks are also due to FCT/MCTES for financing the PhD scholarships of Rui Queirós (SFRH/BD/111002/2015) and Carlos A. Pinto (SFRH/BD/137036/2018 and COVID/BD/153220/2023).References
- C. Partschefeld, S. Richter, U. Schwarzenbolz and T. Henle, Biotechnol. J., 2007, 2, 462–468 CrossRef CAS PubMed.
- E. E. Babiker, Food Chem., 2000, 70, 139–145 CrossRef CAS.
- M. Dube, C. Schäfer, S. Neidhart and R. Carle, Eur. Food Res. Technol., 2007, 225, 287–299 CrossRef CAS.
- C. Schäfer, C. Zacherl, K.-H. Engel, S. Neidhart and R. Carle, Innovative Food Sci. Emerging Technol., 2007, 8, 269–278 CrossRef.
- C.-H. Tang, L. Li and X.-Q. Yang, J. Food Biochem., 2006, 30, 718–731 CrossRef CAS.
- P. C. Lorenzen, E. Schlimme and N. Roos, Nahrung, 1998, 42, 151–154 CrossRef CAS PubMed.
- R. Sharma, P. C. Lorenzen and K. B. Qvist, J. Food Biochem., 2001, 11, 785–793 CAS.
- O. Menéndez, H. Rawel, U. Schwarzenbolz and T. Henle, J. Agric. Food Chem., 2006, 54, 1716–1721 CrossRef PubMed.
- M. Nonaka, R. Ito, A. Sawa, M. Motoki and N. Nio, Food Hydrocolloids, 1997, 11, 351–353 CrossRef CAS.
- S. Lauber, I. Krause, H. Klostermeyer and T. Henle, Eur. Food Res. Technol., 2003, 216, 15–17 CrossRef CAS.
- S. Lauber, I. Noack, H. Klostermeyer and T. Henle, Eur. Food Res. Technol., 2001, 213, 246–247 CrossRef CAS.
- R. P. Queirós, S. Gouveia, J. A. Saraiva and J. A. Lopes-da-Silva, Food Res. Int., 2019, 115, 73–82 CrossRef PubMed.
- S. M. T. Gharibzahedi, S. Roohinejad, S. George, F. J. Barba, R. Greiner, G. V. Barbosa-Cánovas and K. Mallikarjunan, Trends Food Sci. Technol., 2018, 75, 194–205 CrossRef CAS.
- C. L. Cardoso, R. O. Mendes, J. A. Saraiva, P. R. Vaz-Pires and M. L. Nunes, J. Aquat. Food Prod. Technol., 2010, 19, 193–213 CrossRef CAS.
- P. Trespalacios and R. Pla, Food Chem., 2007, 104, 1718–1727 CrossRef CAS.
- M. S. Tsevdou, E. G. Eleftheriou and P. S. Taoukis, Innovative Food Sci. Emerging Technol., 2013, 17, 144–152 CrossRef CAS.
- M. Tsevdou, C. Soukoulis, L. Cappellin, F. Gasperi, P. S. Taoukis and F. Biasioli, Food Chem., 2013, 138, 2159–2167 CrossRef CAS PubMed.
- D. Baş and İ. H. Boyacı, J. Food Eng., 2007, 78, 836–845 CrossRef.
- A. Kato, T. Wada, K. Kobayashi, K. Seguro and M. Motoki, Agric. Biol. Chem., 1991, 55, 1027–1031 CAS.
- M. M. Bradford, Anal. Biochem., 1976, 72, 248–254 CrossRef CAS PubMed.
- T. Beveridge, S. j. Toma and S. Nakai, J. Food Sci., 1974, 39, 49–51 CrossRef CAS.
- A. Kato and S. Nakai, Biochim. Biophys. Acta, Protein Struct., 1980, 624, 13–20 CrossRef CAS PubMed.
- A. K. Baier and D. Knorr, Food Res. Int., 2015, 77, 753–761 CrossRef CAS.
- A. P. Adebiyi and R. E. Aluko, Food Chem., 2011, 128, 902–908 CrossRef CAS.
- K. H. Lee, H. S. Ryu and K. C. Rhee, J. Am. Oil Chem. Soc., 2003, 80, 85–90 CrossRef CAS.
- G. a. h. DeJong and S. j. Koppelman, J. Food Sci., 2002, 67, 2798–2806 CrossRef CAS.
- A. L. C. Gaspar and S. P. de Góes-Favoni, Food Chem., 2015, 171, 315–322 CrossRef CAS PubMed.
- C. A. Manassero, S. R. Vaudagna, A. M. Sancho, M. C. Añón, F. Speroni, A. Mar and A. Cristina, Innovative Food Sci. Emerging Technol., 2016, 35, 86–95 CrossRef CAS.
- C. Puppo, N. Chapleau, F. Speroni, M. De Lamballerie-Anton, F. Michel, C. Añón and M. Anton, J. Agric. Food Chem., 2004, 52, 1564–1571 CrossRef CAS PubMed.
- F. Speroni, V. Beaumal, M. de Lamballerie, M. Anton, M. C. Añón and M. C. Puppo, Food Hydrocolloids, 2009, 23, 1433–1442 CrossRef CAS.
- H. Yang, A. Yang, J. Gao and H. Chen, J. Food Sci., 2014, 79, C2157–C2163 CrossRef CAS PubMed.
- A. Achouri and J. I. Boye, Food Res. Int., 2013, 53, 240–251 CrossRef CAS.
- C.-H. Tang, X. Sun, S.-W. Yin and C.-Y. Ma, Food Res. Int., 2008, 41, 941–947 CrossRef CAS.
- H. Li, K. Zhu, H. Zhou and W. Peng, J. Agric. Food Chem., 2011, 59, 12028–12036 CrossRef CAS PubMed.
- R. P. Queirós, J. A. Saraiva and J. A. L. da Silva, Crit. Rev. Food Sci. Nutr., 2018, 58, 1538–1556 CrossRef PubMed.
- S. B. M. Yasir, K. H. Sutton, M. P. Newberry, N. R. Andrews and J. A. Gerrard, Food Chem., 2007, 104, 1491–1501 CrossRef.
- P. D. Ribotta, A. Colombo and C. M. Rosell, Food Hydrocolloids, 2012, 27, 185–190 CrossRef CAS.
- H. Li, K. Zhu, H. Zhou and W. Peng, Food Chem., 2012, 132, 808–814 CrossRef CAS.
- S.-W. Yin, C.-H. Tang, Q.-B. Wen, X.-Q. Yang and L. Li, Food Chem., 2008, 110, 938–945 CrossRef CAS PubMed.
- R. He, H.-Y. He, D. Chao, X. Ju and R. Aluko, Food Bioprocess Technol., 2014, 7, 1344–1353 CrossRef CAS.
- P. Zhang, T. Hu, S. Feng, Q. Xu, T. Zheng, M. Zhou, X. Chu, X. Huang, X. Lu, S. Pan, E. C. Y. Li-Chan and H. Hu, Ultrason. Sonochem., 2016, 29, 380–387 CrossRef CAS PubMed.
- X. Hu, M. Zhao, W. Sun, G. Zhao and J. Ren, J. Agric. Food Chem., 2011, 59, 8886–8894 CrossRef CAS PubMed.
- Z.-K. Zhao, T.-H. Mu, M. Zhang and A. Richel, Lebensm.-Wiss. Technol., 2019, 115, 108436 CrossRef CAS.
- Z. Qin, X. Guo, Y. Lin, J. Chen, X. Liao, X. Hu and J. Wu, J. Sci. Food Agric., 2013, 93, 1105–1111 CrossRef CAS PubMed.
- J.-M. Wang, X.-Q. Yang, S.-W. Yin, Y. Zhang, C.-H. Tang, B.-S. Li, D.-B. Yuan and J. Guo, J. Agric. Food Chem., 2011, 59, 7324–7332 CrossRef CAS PubMed.
- H. Zhang, L. Li, E. Tatsumi and S. Kotwal, Innovative Food Sci. Emerging Technol., 2003, 4, 269–275 CrossRef CAS.
- S.-J. Jiang and X.-H. Zhao, Eur. Food Res. Technol., 2010, 231, 679–689 CrossRef CAS.
- C.-L. Song and X.-H. Zhao, Food Chem., 2014, 163, 114–119 CrossRef CAS PubMed.
- K. K. Agyare, Y. L. Xiong and K. Addo, Food Chem., 2008, 107, 1131–1137 CAS.
- Y. Jiang, C.-H. Tang, Q.-B. Wen, L. Li and X.-Q. Yang, Innovative Food Sci. Emerging Technol., 2007, 8, 218–225 CrossRef CAS.
Footnote |
| † Electronic supplementary information (ESI) available. See DOI: https://doi.org/10.1039/d3fb00039g |
| This journal is © The Royal Society of Chemistry 2023 |

