 Open Access Article
Sustainable processing of Greek yogurt acid-whey waste to develop folic acid encapsulated millet powders
Sargun
Malik
a,
Mohamed B.
Bayati
b,
Chung-Ho
Lin
bc and
Kiruba
Krishnaswamy
 *ad
*ad
aDepartment of Food, Nutrition & Exercise Sciences, University of Missouri, Kiruba Krishnaswamy, 244, Agriculture Engineering Building, Columbia, MO 65201, USA. E-mail: krishnaswamyk@umsystem.edu
bSchool of Natural Resources, University of Missouri, Columbia, MO, USA
cCenter of Agroforestry, University of Missouri, Columbia, MO, USA
dDepartment of Biomedical, Biological and Chemical Engineering, University of Missouri, Columbia, MO, USA
First published on 21st April 2023
Abstract
Folic acid is an essential nutrient that is required to prevent anemia in women and neural tube defects in infants. Hence, it is important to develop food products that can act as a source of folic acid and are easily accessible. For product development, two encapsulation methods were used: spray drying and extrusion. The encapsulated powder was formed using the matrix of acid whey, kodo, and proso millet. The extrusion method used a folic acid-alginate solution that was dispensed in cross-linking solutions containing acid whey and millets. The objective of the paper was to analyze the developed products for shelf stability and commercial viability. Adding millets to acid whey led to a high yield and the obtained powder was free-flowing. The encapsulated capsules were stable in different pH conditions. The in vitro digestibility model indicated that both powder mix and alginate capsules were efficient sources of folic acid.
1 Introduction
According to the World Health Organization (WHO), 29.9% of women of reproductive age (15–49 years) suffer from anemia wherein 36.5% of pregnant women are anemic globally.1 Folate-deficiency acid anemia occurs when the folic acid in the blood is not enough further causing megaloblastic anemia wherein the red blood cells are fewer and larger than normal complicating the pregnancy.2 In addition, folic acid deficiency can also cause neural tube defects as folic acid helps in the formation of the neural tube. Hence, folic acid is important to prevent major defects such as anencephaly and spina bifida. Consequently, the Centers for Disease Control and Prevention has recommended that all women of reproductive age should have at least 400 mg of Dietary Folate Equivalent (DFE) of folic acid and pregnant women should consume 600 mg of DFE daily to prevent neural tube defects in babies.3Folic acid (Vitamin B9) is one of the most essential nutrients that naturally occur as folate. The primary function of folate is that it acts as a coenzyme in the single-carbon transfer that further leads to the synthesis of DNA and RNA. It also helps in the metabolism of amino acids. The dietary source of folate includes raw green leafy vegetables, seafood, nuts, broccoli, brussels sprouts, kale, etc.4 Folic acid is the fully oxidized monoglutamate form of folate composed of pteridine, p-aminobenzoic acid (PABA), and glutamic acid. The folates present in food products are very sensitive to the environment, for example, high-temperature conditions, UV light, metal ions, and extreme pH changes. If the food product is stored for a long time, there is oxidation, and it gets converted to its derivative compounds. Processing can also reduce the vitamin content by 50–80%, especially in thermal processing.5
Encapsulation of bioactive ingredients helps in increasing the shelf life of a product, protecting it from any adverse environmental condition such as extreme temperature, light, oxygen, pH, moisture, etc. It involves entrapping or coating the active agent into a wall material or carrier agent. These carrier agents can be made from different polysaccharides, proteins, and lipids.6 There are various methods through which encapsulation of functional components can be done such as spray drying, extrusion methods, coacervation, spray cooling, etc.7 Spray drying is a common and extensively used bottom-down technique for microencapsulation in which a liquid feed is atomized into a drying chamber wherein it undergoes rapid evaporation, as it encounters a drying medium such as hot air.8 The liquid feed containing the wall material converts into a powder that encapsulates the functional ingredient.9 Similarly, extrusion is a top-down technique wherein a solution containing an active agent and carrier agent such as alginate is passed through a nozzle to a gelling environment. Alginate is a polysaccharide that is derived from brown algae and can be used as a delivery system that preserves the bioactive component.10 The ionic crosslinking is commonly used for this gelling process wherein wall material is combined with cross-linking agents such as divalent cations that combine with the guluronate blocks present in the alginate chain.11
In the domain of food security and nutrition, there is always an intersection of food loss and waste that needs to be addressed.12 The Greek yogurt processing generates a large quantity of acid whey that is dumped into the surroundings causing damage to the environment. This acid whey has been found to have different macro-micro nutrients and hence can be upcycled for the production of value-added products.13 Likewise, millets are underutilized climate-resilient ancient grains.14 The probiotic component from acid whey can be combined with the prebiotic component of millets to have a potential synbiotic food product.15–17 The formed matrix can further be fortified with folic acid and spray dried for the production of a nutrition mix that can be utilized to fulfill the daily requirement of folic acid. Alternatively, the extrusion method can be used for the production of folic acid capsules wherein folic acid can be combined with sodium alginate and dropped into a millet-acid whey matrix that is rich in minerals and hence, a source of cations and anions for crosslinking.
Hence, the objective of the paper is to develop a folic acid-based food ingredient with the aid of acid whey and millets. The study aims to analyze the physicochemical characteristics of the constructed food ingredients and evaluate its shelf stability and consequently commercial viability.
2 Material & methods
2.1 Development of encapsulated product
The utilized acid whey was separated from Greek yogurt prepared in the laboratory. Greek yogurt was prepared by first heating 1 L of pasteurized milk (Grade A, Vitamin D fortified whole milk, Central Dairy, Columbia, MO, USA) at 82 °C, cooling it to 43.3 °C before adding 10 g of starter culture (Chobani® Plain Greek Yogurt, Norwich, New York, USA). After the addition of culture, the product was kept in an incubator at 37 °C for 8 hours. Subsequently, the formed yogurt was filtered using a cheesecloth and acid whey was collected and stored at 4 °C.
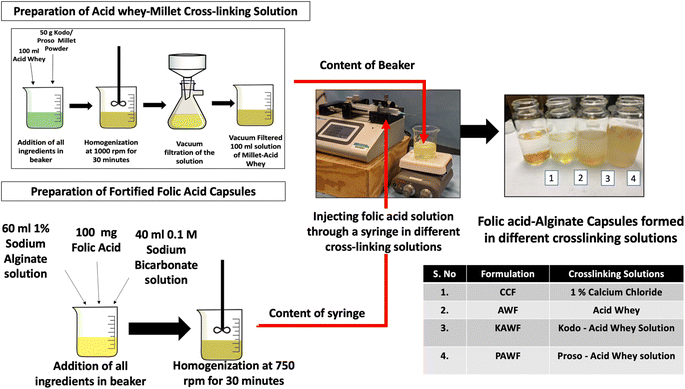
For mixing all the three components (millet powder, folic acid, and acid whey), a homogenizer (IKA Eurostar 40, Wilmington, NC, USA) was used at 1000 rpm for 30 minutes. Two separate slurries were formulated wherein one contained kodo millet and the other contained proso millet. The slurries were then passed through a vacuum filtration process and the filtered liquid was collected and spray dried as shown in Fig. 1.
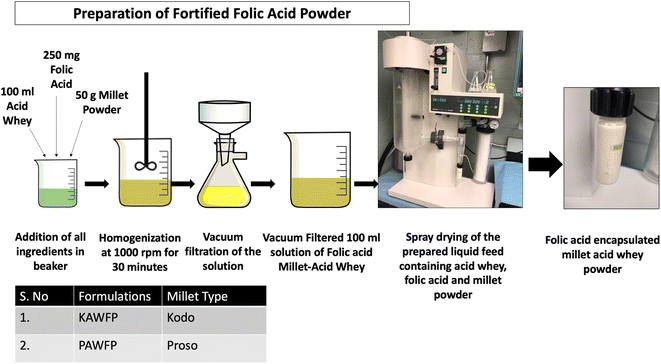 | ||
| Fig. 1 Development of folic acid encapsulated powder using ingredients, acid whey from Greek yogurt processing, millets (kodo & proso), and folic acid. | ||
Spray drying operation was conducted on the vacuum-filtered permeates using a spray dryer (Mini Spray Dryer B-290, New Castle, DE, USA). The process was carried out at an inlet temperature of around 160 °C. The flowmeter for spraying air, feed flow rate, and aspiration rate was adjusted for obtaining maximum yield. Likewise, two types of powders were formed one containing kodo (KAWFP) and the other containing proso millet (PAWFP). After each run, the obtained powder was weighed and stored at 4 °C. The yield of the spray drying powder was calculated based on eqn (1).
 | (1) |
2.2 Folic acid content analysis in the developed products
The folic acid amount obtained from the analysis was used to calculate the encapsulation efficiency using eqn (2).
 | (2) |
2.3 Color analysis
The color analysis was conducted using a colorimeter (Konika Minolta® CR-410, Ramsey, New Jersey, USA) and based on to Commission Internationale d'Eclairage (CIE) LAB system. The samples were placed in a Petri dish and were gently spread. “L”, “a” and “b” values were taken and using the obtained valued Hue (eqn (3)), chroma (eqn (4)), and whitening index (eqn (5)) were calculated.| Hue angle = tan−1b/a | (3) |
 | (4) |
 | (5) |
2.4 Moisture content and water activity
The moisture content was obtained using a moisture analyzer (Model HE53, Mettler Toledo, Columbus, OH, US). For measurement, 3 g of sample was weighed and poured over the aluminum dish where it was spread evenly. The water activity was measured using a water activity meter (Aqua lab model CX-2, Pullman, WA). For measurement, the water activity meter cups were filled with an appropriate amount of sample that permitted the required headspace. The readings were taken in triplicates.2.5 Thermal analysis of samples
The thermal properties were analyzed using Differential Scanning Calorimeter (Thermal Analyzer instrument Q 20, New Castle, DE, USA). For measurement, 8 mg of sample was weighed and placed in an aluminum pan. Further, the pan was sealed and loaded into the instrument. The instrument was fixed at ramp mode wherein the heating rate was set at 10 °C min−1 and the temperature range was kept at 20 to 250 °C. The data was analyzed to obtain peak thermal degradation and glass transition temperature. The analysis was conducted in triplicates.2.6 Particle size analysis
The mean diameter, mean polydispersity index (PDI), and zeta potential (ζ) were obtained using Dynamic Light Scattering (DLS) system (Delsa Nano Submicron Particle Size and Zeta Potential particle Analyzer, Beckman Coulter California, United States). The scattering angle of the system was adjusted at 15°. Water was used as a diluent for sample preparation. For the preparation of the sample, 1 g of powder was mixed with 10 mL of DI water to prepare a stock solution. The solution was further diluted by taking 200 μL of the stock solution and mixed 9.8 mL of DI water for DLS analysis.For encapsulated capsules, open-source image processing FIJI software was utilized to calculate average diameter and sphericity. The sphericity was calculated by taking ratio of longest and shortest diameter.
2.7 Scanning electron microscopy
Scanning electron microscopy was used to analyze the morphology of the formed encapsulated powder and capsules. The analysis was conducted with the help of the Electron Microscopy Core Facility, University of Missouri-Columbia. The powder samples were sprinkled on the stub holders with the help of carbon tapes. To prevent clustering air was passed through the surface after the placing step. For the capsule samples, one to two capsules were placed. The samples were then sputtered with 25 nm Pt for the imaging in FEI Quanta 600F ESEM (Hillsboro, Oregon, United States). The images were taken under high vacuum conditions with the voltage of 5 kV, working distance adjusted to 8 mm, objective aperture of 30 μm, and 3.5 spot size. Energy-dispersive X-ray spectroscopy (EDS) analysis was conducted for the capsule samples to view morphology along with chemical composition.2.8 Stability of folic acid capsules
2.9 Functional properties of spray dried powder
 | (6) |
 | (7) |
 | (8) |
 | (9) |
 | (10) |
![[thin space (1/6-em)]](https://www.rsc.org/images/entities/char_2009.gif) θ value. The calculations were done using eqn (11).20
θ value. The calculations were done using eqn (11).20 | (11) |
 | (12) |
 | (13) |
 | (14) |
 | (15) |
2.10 In vitro digestibility
The in vitro digestibility analysis was conducted based on the protocol by Minekus et al.23 For the analysis of salivary phase digestibility, 5 mL of reconstituted spray dried sample (PAWFP) and 5 g capsule (PAWF) sample were taken respectively and mixed with 3.5 mL of electrolyte solution. The electrolyte solution was prepared by mixing 15.1 mL of 0.5 M potassium chloride, 3.7 mL of 0.5 M potassium phosphate, 6.8 mL of 1 M sodium bicarbonate, and 0.5 mL of 0.15 M magnesium chloride, 0.06 mL of 0.5 M ammonium carbonate and 373.35 mL of DI water. Mincing of the food was done using a mortar pestle until paste-like consistency was achieved. To the paste, 0.5 mL of salivary α-amylase of activity 75 U mL−1 was added which was followed by the addition of 25 μL of 0.075 mM calcium chloride. The whole solution was maintained at pH 7 and was kept in the incubator at 37 °C for 2 minutes.For the gastric phase, the 10 mL of oral bolus was mixed with 7.5 mL of gastric phase electrolyte solution. The electrolyte solution was prepared by mixing 6.9 mL of 0.5 M potassium chloride, 0.9 mL of 0.5 M potassium phosphate, 12.5 mL of 1 M sodium bicarbonate, 11.8 mL of 2 M sodium chloride, 0.4 mL of 0.15 M magnesium chloride, 0.5 mL of 0.5 M ammonium carbonate and 371 mL of DI water. To the gastric solution, 1.6 mL of porcine pepsin of activity 2000 U mL−1 was added, followed by 5 μL of 0.075 M of calcium chloride. The solution was maintained at pH 3 by the addition of 1 M hydrochloric acid and was incubated for 2 hours at 37 °C.
For the intestinal phase, the 20 mL gastric chyme was mixed with 11 mL of intestinal electrolyte solution. The electrolyte solution was prepared by mixing 6.8 mL of 0.5 M potassium chloride, 0.8 mL of 0.5 M potassium phosphate, 42.5 mL of 1 M sodium bicarbonate, 9.6 mL of 2 M sodium chloride, 1.1 mL of 0.15 M magnesium chloride and 339.2 mL of DI water. To the intestinal solution 5 mL of pancreatin from the porcine pancreas of activity 100 U mL−1 and lipase of activity 2000 U mL−1 was added, followed by the addition of 2.5 mL bile salts and 1.31 mL of DI water. The intestinal solution was maintained at pH 7 by addition of 1 M sodium hydroxide and incubated for 2 hours at 37 °C.
From each phase after incubation, 1 mL of solution was drawn for folic acid extraction and ran in the LC-MS/MS system.
2.11 Statistical analysis
The statistical analysis was conducted using JMP software (Cary, NC, USA). One-way ANOVA was used for confirming the difference among samples. For the post-hoc test, Tukey's honest significant difference test was used as it helps in explaining the pairwise difference among the samples. The significance of the results was considered at an alpha value of 0.05.3 Results & discussion
3.1 Percentage yield & encapsulation efficiency
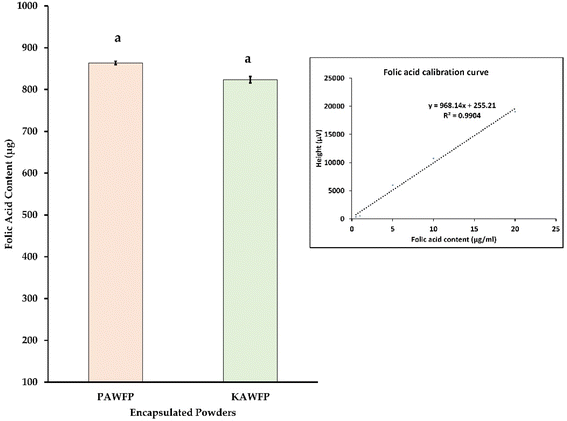
Spray drying is one of the most extensively used techniques for biologically sensitive material with only a slight loss in activity.24 Even with a high inlet temperature of 160 °C, there is not much deterioration because of a small residence time of the droplet in the drying chamber of approximately 12 to 30 seconds and subsequent evaporative cooling effect.25 The product yield of 71.49 ± 1.35% was obtained for KAWFP and 76.23 ± 2.65% for PAWFP. A high percentage indicates that the powder was not sticky and was able to be recovered from the collection chamber.Usually, acid whey due to its low pH range (3.6–4.5) is challenging to process. This difficulty is attributed to the behavior of lactose with the present whey proteins, organic acids, and minerals. The crystallization of lactose also gets affected by the pH which further affects the processing performance. Millets being of alkaline nature help in neutralizing the acid whey which further helps in processing.14,26 Folic acid has a low aqueous solubility of about 0.01 mg mL−1 below pH 5 and when it is dispersed in water, the pH is in the range of 4 to 4.8. However, it has good stability in the buffer solutions having a pH of 5.39 to 10.40.27 The pH of the prepared feed containing folic acid, millet, and acid whey was 4.78 and 5.09 for kodo and proso millet species respectively. Since the pH was lower than the stability requirement, the liquid feed had a lot of undissolved folic acid settled at the bottom of the flask forming a cake. A substantial amount of folic acid was lost during the vacuum filtration step. Consequently, the encapsulation efficiency % of folic acid when calculated based on the folic acid present in the powder and added in the matrix, varied from 1.65–1.73%. Fig. 3 illustrates the final powder product formed by the spray dryer. The amount of folic acid obtained in the final encapsulated powders, KAWFP, and PAWFP were found to be similar as shown in Fig. 4 (p > 0.05).
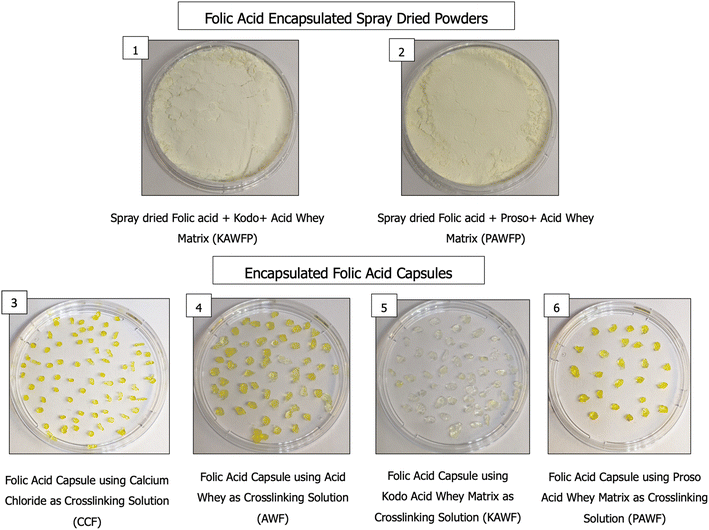 | ||
| Fig. 3 Folic acid encapsulated powder was developed using kodo millet KAWFP1 and developed using proso millet PAWFP.2 Folic acid capsules were developed using different crosslinking solutions such as calcium chloride CCF,3 acid whey AWF,4 kodo & acid whey solution KAWF,5 and proso & acid whey solution PAWF.6 | ||
The commercial vitamin mixes are available in form of sachets that contain around 6.5 g (0.22–0.23 onz) of powder. According to the said quantity, if a similar amount of powder was to be used, the powder samples would have been able to contain 850.2 μg and 806 μg of folic acid in the samples PAWFP and KAWFP respectively. These values are equivalent to 510.12 and 483 Dietary Folate Equivalent (DFE) μg respectively exceeding the daily required value of folic acid for adult males and females i.e., 400 μg DFE. This additional amount of folic acid (80–110 μg DFE) was considered permissible, considering the loss of folic acid during storage of the powder.
The entrapment or encapsulation efficiency is dependent on the film-forming capacity and plastic behavior of the biopolymer that is mixed in the matrix. The commercially available encapsulating agents have limitations in terms of cost, availability, and potential damage to human health. For example, maltodextrin is a refined carbohydrate that can have a strong effect on blood glucose, insulin, and lipid level in the body post-ingestion.28 In comparison, the protein and carbohydrates present in acid whey and millets are much healthier options to be used as an encapsulant or a wall material. The protein present in acid whey include lactoferrin, β-lactoglobulin, α-lactalbumin, immunoglobulins, bovine serum albumin (BSA), lysozymes etc. The amino acid profile includes primarily lysine, tryptophan, and leucine. Additionally, lactose is the main (4.18% w/v) sugar present in acid whey.29 It has been observed that partial replacement of whey protein with lactose can help in limiting the diffusion of apolar substances through the formed wall.30 Likewise, millets are high-protein (11% in kodo and 17% in proso millet) food with a rich carbohydrate composition of starch, cellulose, free sugar, xylose, fructose, maltose, glucose, sucrose, raffinose, maltotriose, and other oligosaccharides.31
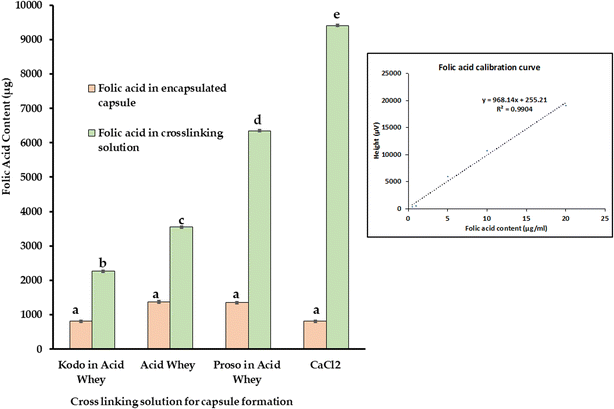
Furthermore, an alternate method consisting of extrusion-based encapsulation was also performed with sodium alginate, acid whey, and millets to form folic acid capsules. Alginate is an anionic polymer derived from brown seaweed that has high biocompatibility and low toxicity. The components of the polymeric chain of alginate include β-D-mannuronic acid (M blocks) and α-L-guluronic acid (G blocks) wherein they are linked by glycosidic linkages.1–4 When the monovalent ion of sodium alginate is exchanged with divalent or trivalent ions, the low viscosity liquid usually changes to a gel-like structure. The overall gel strength depends on the molecular weight, structure, and concentration of the gelling agent. Calcium-dependent gelation is one such technique that is extensively used in Industry. Based on the gelation process, there can be the formation of egg box model like structure, 3/1 or 2/1 helical conformation.32 Various studies have reported that calcium ions lead to dimerization of the polymer chain by forming junction zones that also have further lateral interactions wherein weak inter-dimer associations occur because of electrostatic interactions.33 Acid whey contains minerals as one of its main constituents wherein a considerable amount of calcium, potassium, sodium, zinc etc., can be found.34 It has been reported that the concentration of calcium in acid whey and zinc is three times greater than that of sweet whey.35 Similarly, millets are also rich in minerals such as calcium, copper, iron, potassium, magnesium, etc.36 Consequently, when folic acid mixed with alginate was dropped into the acid whey solution, capsules were formed as shown in Fig. 3. For this product, a significant difference was observed in terms of folic acid in different crosslinking solutions, but no significant difference observed for folic acid encapsulated in capsules as shown in Fig. 5.
The encapsulation efficiency varied from 4.09–6.77% for the capsules and 11.33–47.06% for the cross-linking solution. Fig. 5 shows the folic acid amount obtained from 100 mL of the final product that consisting of capsules as well as the crosslinking solution. In a similar study, Azevedo et al.,37 used alginate/chitosan nanoparticles to encapsulate vitamin B2 wherein an efficiency of about 56% was observed. The study suggested there is a direct relation between encapsulation efficiency and particle size.
3.2 Color analysis
Color is one of the most important sensory properties of a food product as it is an indicator of food quality and flavor. It helps the industry to be consistent and uniform with the food product. Folic acid is available as multivitamins and individual supplements in form of yellow uncoated tablets. Being photosensitive, it is easily degraded and hence, it is important to analyze the color of the form product. When combined with acid whey and millets, the powder had a high lightness value (L) of 97.56 and 96.81 for KAWFP and PAWFP respectively as shown in Table 1. For the gel samples, the lightness (L) value was highest for kodo based sample (KAWF). All the samples except PAWFA had a negative “a” value indicating green color. The positive “b” value of all the samples indicated the yellow color of the powder. The hue of a color is the first color that is perceived indicating the dominant wavelength wherein 0° or 360° describes red color, 90° yellow, 180° indicates green and 270° stands for blue color. The hue value validated that the color of the samples was observed as yellow and green color. Similarly, chroma describes the purity of a particular observed in a product. A high chroma value indicates that the color observed is in its purest form.38 Acid whey had the highest chroma value as compared to other products. Similarly, the whitening index, describes the rating of a white or a near-white surface in terms of distance away from a nominal white coordinate wherein the L value is equivalent to 100 and a, b values are zero.39 Hence, a high WID indicates a high value for whiteness and vice versa. The highest whiteness value was observed for the KAWFP powder sample.| Samples | Color (L) | Color (a) | Color (b) | Hue angle | Chroma | Whiteness index | Moisture content | Water activity |
|---|---|---|---|---|---|---|---|---|
| a Different superscripts indicate significantly different values of mean (p < 0.05) in the same column. | ||||||||
| KAWFP | 97.56 ± 0.0a | −2.93 ± 0.00d | 12.03 ± 0.02e | 103.68 ± 0.03a | 12.38 ± 0.02e | 87.38 ± 0.02a | 4.60 ± 0.98e | 0.30 ± 0.00b |
| PAWFP | 96.81 ± 0.05b | −3.14 ± 0.01e | 15.06 ± 0.02d | 101.77 ± 0.00c | 15.38 ± 0.00d | 84.29 ± 0.00b | 3.91 ± 0.15f | 0.30 ± 0.00b |
| CCF | 81.79 ± 0.04f | −0.84 ± 0.01b | 22.36 ± 0.01c | 92.14 ± 0.01e | 22.38 ± 0.01c | 71.15 ± 0.03d | 96.42 ± 0.49a | 0.95 ± 0.00a |
| AWF | 82.50 ± 0.02e | −2.95 ± 0.02d | 29.94 ± 0.14a | 95.62 ± 0.02d | 30.08 ± 0.14a | 65.19 ± 0.19f | 94.27 ± 0.54b | 0.95 ± 0.00a |
| KAWF | 84.60 ± 0.02c | −2.37 ± 0.00c | 10.17 ± 0.01f | 103.13 ± 0.03b | 10.44 ± 0.01f | 81.39 ± 0.02c | 93.83 ± 0.24c | 0.95 ± 0.00a |
| PAWF | 83.96 ± 0.10d | 0.07 ± 0.03a | 28.23 ± 0.13b | 89.85 ± 0.06f | 28.23 ± 0.13b | 67.53 ± 0.07e | 92.07 ± 0.27d | 0.95 ± 0.00a |
3.3 Moisture content and water activity
Moisture content indicates the amount of water present in a product that can influence its properties. Water activity explains the unbound water in the product that is available for the growth of microorganisms. If the water activity is more than 0.9, there are more chances for the growth of pathogenic bacteria.40 The moisture content and water activity for the capsules were observed to be high as shown in Table 1. However, for the powder sample, the moisture content and water activity were low indicating low microbial growth susceptibility. Moisture also affects the flow of the powder by interacting either with the surface or penetrating the bulk of the solid. It leads to physicochemical changes depending on the extent of the hydrophilic properties of the product. Typically, the target moisture content for the food powder industry ranges between 0.3–4%. Also, if the water activity is around 0.3, the food product is microbiologically safe.3.4 Thermal analysis
The glass transition temperature is an indication that at what temperature the material changes from a rigid to a flexible state. Initially, at room temperature, the particles exhibit an amorphous state wherein there is a random arrangement of the molecule and as the temperature increases, the structure of the molecule changes to become a bit more flexible. In food processing, a lower glass transition temperature indicates that the food is soft and elastic and a higher describes the hardness and brittle properties of food. Similarly, melting temperature, Tm, describes the peak temperature wherein complete melting of organic compounds occurs. Fig. 6 illustrates the thermogram obtained for the samples and Table 2 describes the corresponding glass transition temperature. The glass transition temperature of spray dried powder was higher as compared to the encapsulated capsules. It was observed that there was no difference in-between the encapsulated powders (p > 0.05). Table 2 summarizes all the glass transition and peak degradation temperatures for all the samples. However, since all the developed products are made with ingredients having a complex composition of macro and micronutrients, it is difficult to point at the exact glass transition temperature.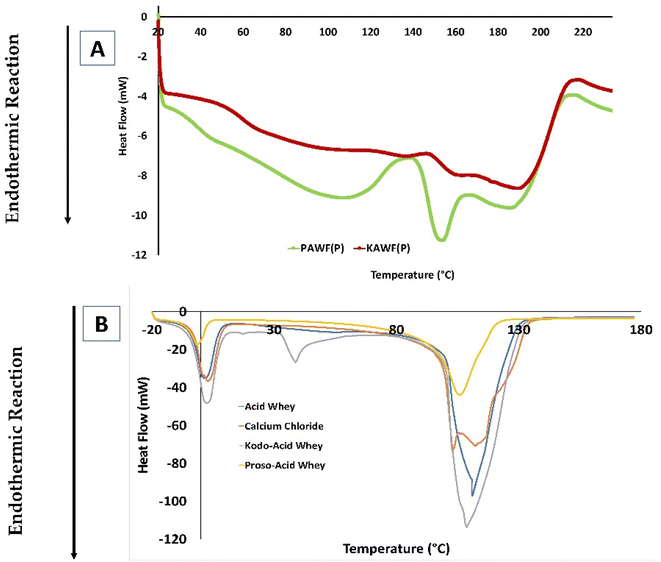 | ||
| Fig. 6 Thermal degradation of powder samples (A) and capsule samples (B) indicating the peak melting temperature for the samples. | ||
| S. no | Samples | Peak degradation temp. (°C) | Glass transition temperature (°C) |
|---|---|---|---|
| 1 | KAWFP | 148.63 ± 1.93 | 152.19 ± 1.36 |
| 2 | PAWFP | 148.83 ± 6.13 | 143.18 ± 5.76 |
| 3 | CCF | 107.68 ± 6.49 | 96.60 ± 3.67 |
| 4 | AWF | 109.17 ± 2.61 | 83.795 ± 5.73 |
| 5 | KAWF | 111.04 ± 3.40 | 100.02 ± 1.51 |
| 6 | PAWF | 107.95 ± 2.95 | 97.3 ± 0.169 |
Water acts as a plasticizer in powder products as it modifies the glass transition temperature. Consequently, the moisture content of a product is a key factor that affects the glass transition temperature wherein as the moisture content increases, there is the decrease in the glass transition temperature.41 It also helps in understanding the shelf stability of a powder as it explains about wettability and solubility of the powder.
3.5 Particle size analysis
The particle size observed for the encapsulated powders was found to be statistically similar (p > 0.05). The distribution curve as shown in Fig. 7 illustrates the intensity distribution of different sizes. The scattering intensity of a particle is proportional to the square of the molecular weight. Table 3 summarizes the characterization of encapsulated powder particles in terms of polydispersity index (PDI), D10, D50, D90, and zeta potential values. The PDI indicates the heterogeneity of the sample obtained by taking the ratio of the average molecular weight of particles and the number of particles. A higher PDI (PDI > 1) indicates that the molecular weight has been distributed over a broader range as observed in the case of PAWFP. The distribution can also be characterized by D10, D50 and D90 values on the distribution curve wherein these values are defined by the point where 10%, 50%, and 90% of the particles fall below the distribution curve respectively as shown in Fig. 7. Likewise, zeta potential helped in estimating the physical stability of the particles. It is the potential difference between the dispersion medium and the layer of dispersed medium attached to the particle that is dispersed. If the zeta potential is high, the particles are more stable as compared to low zeta potential wherein the particles tend to aggregate due to the present van der Waal forces. If the magnitude of zeta potential (mV) lies between 0 to 5, it corresponds to matrix that has rapid coagulation, 10 to 30 describes incipient instability, 30 to 40 stands for moderate, 40 to 60 for good and more than 61 describes excellent stability.42 The zeta potential obtained for both the powders was approximately in the range of incipient instability.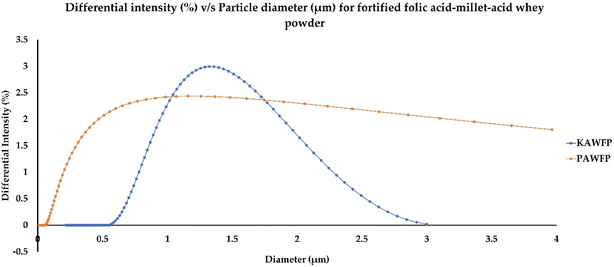 | ||
| Fig. 7 Intensity distribution curve for the spray dried powders KAWFP and PAWFP corresponding to the cumulant diameter of 1.20 ± 0.13 and 1.13 ± 0.02 μm respectively. | ||
| Sample | Polydispersity index | D10 (μm) | D50 (μm) | D90 (μm) | Zeta potential |
|---|---|---|---|---|---|
| a Different superscripts indicate significantly different values of mean (p < 0.05) in the same column. | |||||
| KAWFP | 0.80 ± 0.17a | 0.80 ± 0.08a | 1.22 ± 0.13a | 1.86 ± 0.2a | −9.96 ± 1.30a |
| PAWFP | 1.09 ± 0.62a | 0.21 ± 0.08a | 1.10 ± 0.20a | 6.69 ± 0.27b | −8.44 ± 0.49a |
The size and sphericity of the encapsulated capsules are affected by the flow rate, alginate concentration, size of the needle, and crosslinking solutions.43 The average diameter was found to be significantly different (p < 0.05) wherein capsules by acid whey crosslinking, AWF (0.180 ± 0.01 cm) was observed to be the largest followed by KAWF (0.154 ± 0.01 cm), PAWF (0.145 ± 0.02 cm) and CCF (0.135 ± 0.01 cm) respectively. In terms of sphericity, PAWF (0.882 ± 0.12) was found to have the highest sphericity as compared to CCF (0.755 ± 0.10), AWF (0.768 ± 0.14), and, KAWF (0.753 ± 0.13).
3.6 Surface morphology and elemental analysis
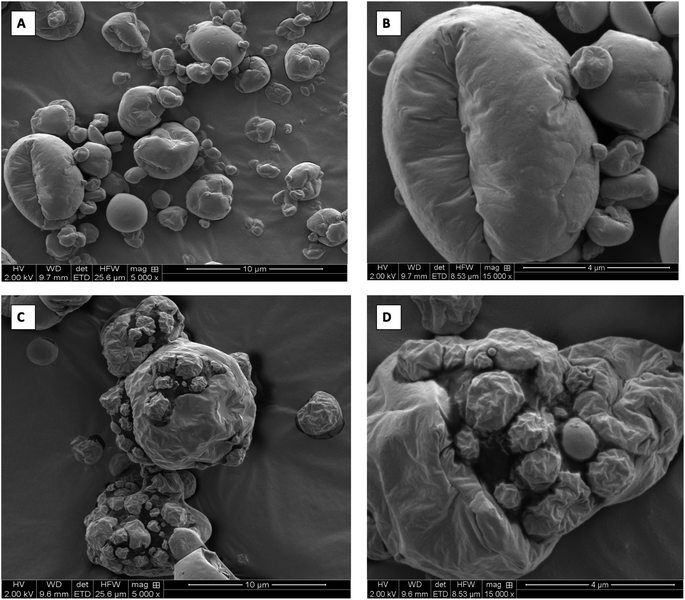
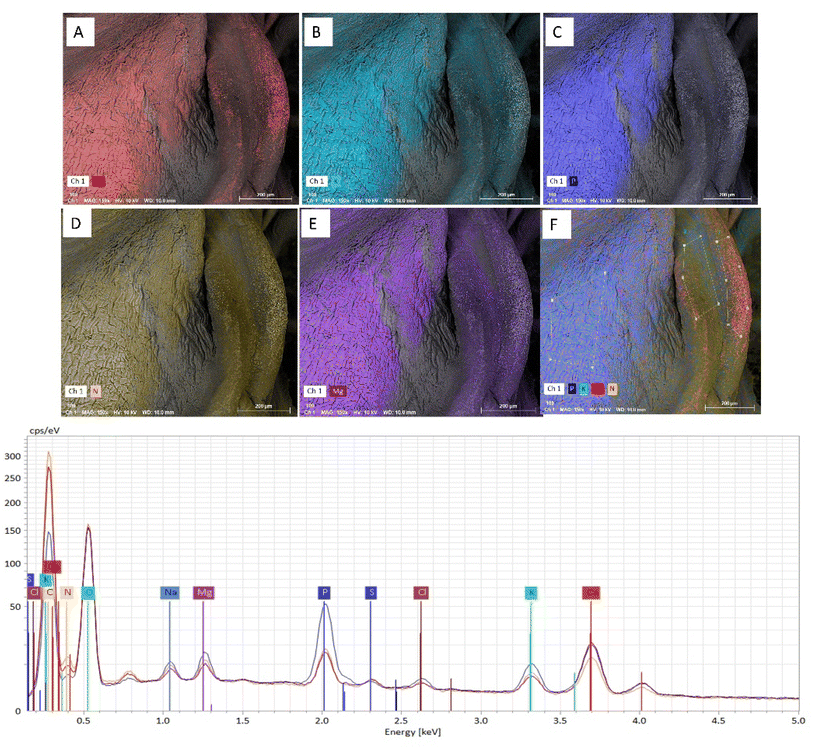
The surface morphology of the encapsulated powder samples showed the formation of some wrinkled, spherical particles of different sizes as shown in Fig. 8. The heterogeneity in different sizes of the formed powder particles can be attributed to different drying histories of the particles that occurs during the spray drying process.44 The smaller particles appeared to adhere to larger particles because of the hygroscopicity of the particles that tends to bring particles in closer proximity and cause coalescence. The morphology of the particles also depends on the processing parameters such as inlet temperature, feed rate, aspiration rate, the viscosity of the feed, nozzle type, etc. Studies have found that by lowering the inlet temperature and outlet humidity, the wrinkling effect can be reduced on the formed particles which subsequently give higher flowability.45 The Fig. 9 shows the SEM-EDS analysis of PAWF samples. The images show the presence of minerals such as calcium, potassium, phosphorous, nitrogen, and magnesium that are identified when the characteristic x-rays are generated from material when an electron beam strikes the sample. These x-rays have discrete energies, and the relative intensities of the mapped elements can be compared through the formed spectra that correlate the concentration of that element.46 The existence of these minerals can be attributed to the millet-acid whey matrix that acts as the cross-linking agent for the formation of these capsules suggesting that they can be potentially used as a source of these micronutrients.3.7 Stability of folic acid capsules
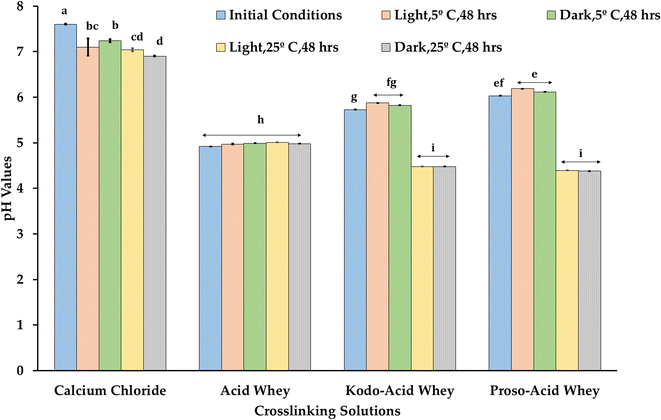
The highest initial pH was observed for calcium chloride (CCF) followed by proso-acid whey (PAWF), kodo acid whey (KAWF) and finally acid whey (AWF) as shown in Fig. 10. Acid whey cross-linking solution and capsules were observed to have no pH change after 48 hours indicating stability. Light conditions did not significantly impact the pH change, but the temperature did influence crosslinking solution including calcium chloride, kodo acid whey and proso acid whey. Various studies support that acid, alkali, and UV conditions affect the degradation of folic acid wherein acidic conditions degrade more than the alkali conditions. It has also been reported that storage of folic acid should be stored in a container that has minimum penetration of UV light.47,48
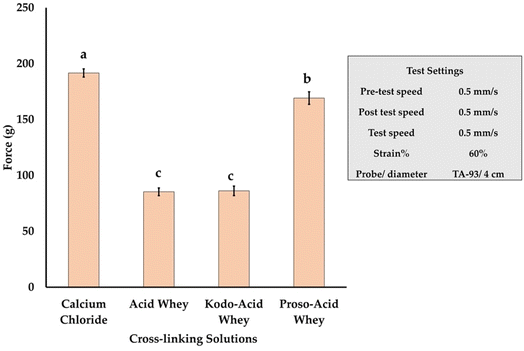
According to the observed hardness value, as shown in Fig. 11, the capsules made from calcium chloride (CCF) crosslinking solution exerted the maximum force followed by proso-acid whey-based capsule (PAWF). The acid whey based (AWF) and kodo acid whey based (KAWF) capsules exerted similar force. The steadiness of an alginate-based capsule depends on the alginate type, concentration, and the type of cation involved in gelling. Proso has a rich mineral profile with 0.23 g/100 g calcium, 0.4 g/100 g phosphorous, 2.24 g/100 g potassium, 0.26 g/100 g magnesium, 25 mg kg−1 iron, 16.3 mg kg−1 copper and 18.5 mg kg−1 zinc.50 These minerals can act as a source of cations (Ca2+, Mg2+, Zn2+etc.) that induce gelling. In addition, these cations can also affect the ionic radii, thickness, tensile strength, and moisture content of the resultant alginate film.51
3.8 Functional properties of spray dried powder
Density of a food powder is an important parameter for the determination of handling and storage conditions. It also affects the flowability and appearance of the powder. Density can be categorized into absolute, bulk, and tap density. Absolute density does not account for the open pores and voids present in the powder while doing the volume measurement. However, the bulk density considers the pore spaces in the volume measurement as the material is made to conform to the irregular contour of the container. Hence, using the values of absolute density and bulk density, the porosity of a material can be determined. Likewise, tap density also accounts for interparticle voids but tends to have optimum packing of particles. For the spray dried powders, a significantly higher absolute density was observed indicating that the material was porous as shown in the Table 4.| Functional property | KAWFP | PAWFP |
|---|---|---|
| a Different superscripts indicate significantly different values of the mean (p < 0.05) in the same row. | ||
| True density (kg m−3) | 2370 ± 16.3a | 1583.33 ± 30.9b |
| Tap density (kg m−3) | 492.06 ± 11.2a | 366.30 ± 12.9b |
| Bulk density (kg m−3) | 468 ± 10.2a | 337.60 ± 14.4b |
| Porosity | 0.80 ± 0.00a | 0.70 ± 0.01b |
| Carr index | 4.60 ± 0.10b | 7.83 ± 1.32a |
| Hausner ratio | 1.05 ± 0.00a | 1.09 ± 0.02a |
| Angle of repose (°) | 23.03 ± 0.91b | 25.60 ± 0.69a |
| Hygroscopicity | 0.26 ± 0.04a | 0.27 ± 0.02a |
| Brix (%) | 11.80 ± 0.0a | 10.35 ± 0.05b |
| Water solubility (%) | 95.00 ± 2.9a | 92.00 ± 2.2a |
| Dispersibility (%) | 97.17 ± 1.3a | 98.59 ± 1.75a |
| Viscosity (mPa s−1) | 1.18 ± 0.02a | 1.22 ± 0.04a |
According to Carr's Index and Hausner ratio, both the powders were in the range of excellent flowability (Hausner ratio 1–1.11 & Carr Index < 10). Flowability can also be determined using the angle of repose wherein if a powder gives a higher value, the powder is then considered to be stickier and has lower flowability. Conversely, if the angle of repose is low, the powder is considered to be free-flowing. For both the powder samples a lower angle of repose was observed as shown in the table validating the flowability of the powder. There was no significant difference observed in the hygroscopicity of both the powders as shown in Table 4. Various factors impact the angle of repose and hygroscopicity of a spray dried powder specifically the inlet temperature of the spray dryer that further determines the moisture content of the powder.52 If the inlet temperature is too high, the lower amount of moisture content results in to the powder that further increases the tendency of the powder to gain moisture present in the air.53
A powdered drink mix should not take time for dissolving and agglomerate when coming in contact with water. Henceforth, in terms of reconstitution properties, it was observed that both the powders were highly soluble and dispersible in water. Reconstitution properties determines the quality of a food product and depends on the composition of the product, particle size, charge, density, on processing conditions. For example, the presence of hydrophilic components such as sucrose increases the solubility and dissolution rate.54 Similarly, when the treatment temperature is too high, the denaturation of proteins decreases the solubility.55 Considering folic acid is sparingly soluble under neutral pH water conditions, mixing in millets and acid whey helped in its viability as a commercial product that can be used as the folic acid source.
Similarly, rheological analysis helps in validating the processing parameters and consequently in their improvement. It factors in when the processing requires steps such as mixing, dispensing, pumping, cleaning, etc. wherein it can determine the volumetric flow rates, pump selection, heat transfer coefficients, etc.56 Viscosity explains a fluid's resistance to flow that impacts the flow and texture of a product.57 It has also been found that it has a strong association with satiety. The viscosity of the reconstituted samples was found to be similar to water (1 mPa s−1 at 20 °C) and fruit juices (1.53–300 mPa s−1).58 Hence, according to the obtained data, Newtonian flow behavior was observed wherein shear stress (σ) was observed to be in direct proportion to strain rate (s−1). Furthermore, there is a linear relationship between viscosity and refractive index.59 The Brix percentage corresponds to the sugar content in the product that must be regulated for maintaining consistency. The refractive index changes with concentration, temperature, and different pressure conditions.60 In between the powders KAWFP and PAWFP, there was a significant difference (p < 0.5) obtained in terms of the refractive index wherein kodo based formulation had the higher value. The dissimilarity can be attributed to the difference in the sugar profile in the millets and the extent of absorption of millets in the acid whey.
3.9 In vitro digestibility of samples
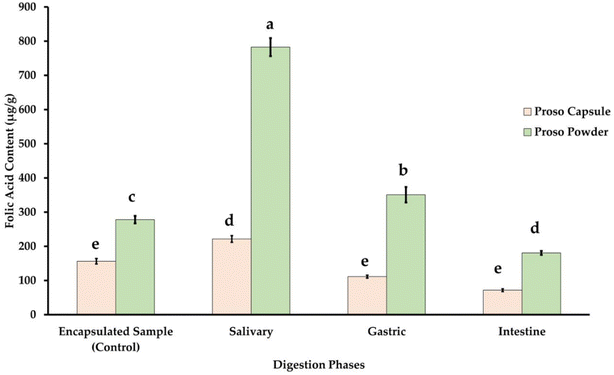
The in vitro digestion analysis helps in the determination of the amount of folic acid that will be absorbed in blood after it goes through the digestion process. The digestion process mainly consists of the mouth, stomach, and intestine wherein α-amylase, trypsin, pepsin and lipase are the major digestive enzymes acting on the folic acid. Proso based encapsulated capsules (PAWF) and encapsulated powder were used for analyzing the in vitro digestion. Pure proso millet contains a significant amount of vitamins such as niacin, B-complex vitamin, and folic acid. The folic acid content corresponds to 85 mg/100.61 The powder samples had a higher bioaccessibility % as compared to the capsule, wherein 45.86% was observed for PAWF and 64.99% was observed for PAWFP. It was observed that in both cases, the salivary phase had maximum release followed by the gastric and intestinal phase. The folic acid release from the powder sample was found to be significantly higher as compared to the capsules (p < 0.05) as shown in Fig. 12.Bioaccessibility describes the release of the ingested nutrient from the food matrix that is available for absorption and is dependent on the digestion phases. For natural food-based folates, factors such as stability before ingestion, during digestion, and the presence of other compounds that might hinder the stability of the vitamin affect the absorption. The absorption occurs when it is converted into monoglutamate by the enzyme pteroylglutamate hydrolase. The presence of organic acids can lead to inhibition of this enzyme. Similarly, folate binding protein can also affect the bioaccessibility of the vitamin based on the pH conditions wherein there is lower binding affinity at pH 5–7.4.62
Various studies have confirmed that folic acid is highly stability after in vitro digestion. For example, Neves et al.,63 investigated the thermal and in vitro stability of folic acid in bread, the results indicated that 100% folic acid is free for absorption in the small intestine. Shi et al.,64 suggested that folic acid affects the activity of the digestive enzyme α-amylase, pepsin, and trypsin by forming multi non-covalent bonds. It was observed that there is a formation of a complex that consists of folic acid and the enzyme that inhibits the activity of the enzyme wherein α-amylase activity is affected the most and trypsin activity is affected the least.
4 Conclusion
With the prevalence of folate deficiency specifically among women because of insufficient dietary intake, it is important to develop food products that can act as a source. Fortified food as compared to supplements can provide a large variety of macro-micronutrients fulfilling the daily calorie need as well. The products developed in the study were able to encapsulate the daily required amount of folic acid as suggested by the National Institute of Health (NIH) Office of Dietary Supplements. However, the encapsulation efficiency for the development of the process was found to be low. For improvement in encapsulation efficiency, while upscaling the spray drying process, drying aids could be utilized. Adding millets to acid whey led to a high yield percentage of the powder. According to Carr Index and Hausner ratio values, the obtained powder was free flowing in nature. The high-water solubility and high dispersibility percentage indicated improvement in the limited aqueous solubility of folic acid that can help in commercial viability. The encapsulated capsules were found to be shelf-stable at refrigerated temperature. Proso-acid whey crosslinking solution was able to form the capsule with the highest hardness value. The in vitro digestibility model also validated that powder mix and alginate capsules were an efficient delivery system for folic acid.Data availability
The data supporting the results of this study are available from the corresponding author, Kiruba Krishnaswamy.Author contributions
Sargun Malik: methodology, investigation, writing-original draft, visualization, software. Mohamed B. Bayati: methodology, investigation, writing-review & editing, software. Chung-Ho Lin: methodology, resources, writing-review & editing, supervision. Kiruba Krishnaswamy: conceptualization, methodology, resources, visualization, software, writing-review & editing, supervision, project administration, funding acquisition.Conflicts of interest
There are no conflicts to declare.Acknowledgements
We are thankful for the University of Missouri Startup funds to the Food Engineering and Sustainable Technologies (FEAST) program. Biorender was used to make graphical abstract.References
- WHO, Anaemia in women and children, 2021, available from: https://www.who.int/data/maternal-newborn-child-adolescent-ageing/advisory-groups/gama/gama-related-resources/gho Search PubMed.
- B. A. Campbell, Megaloblastic Anemia in Pregnancy, Clin. Obstet. Gynecol., 1995, 38(3), 455 CrossRef CAS PubMed . Available from: https://journals.lww.com/clinicalobgyn/Fulltext/1995/09000/Megaloblastic_Anemia_in_Pregnancy.5.aspx.
- CDC, Folic Acid. Centers for Disease Control and Prevention, 2021, available from: https://www.cdc.gov/ncbddd/folicacid/about.html Search PubMed.
- NIH, Office of Dietary Supplements, Folate – Health Professional Fact Sheet, 2020, available from: https://ods.od.nih.gov/factsheets/Folate-HealthProfessional/ Search PubMed.
- M. V. de M. Ribeiro, I. da S. Melo, F. das C. Lopes and G. C. Moita, Development and validation of a method for the determination of folic acid in different pharmaceutical formulations using derivative spectrophotometry, Braz. J. Pharm. Sci., 2016, 52(4), 741–750 CrossRef CAS . Available from: https://www.scielo.br/scielo.php?script=sci_arttext%26pid=S1984-82502016000400741%26lng=en%26tlng=en.
- M. R. I. Shishir, L. Xie, C. Sun, X. Zheng and W. Chen, Advances in micro and nano-encapsulation of bioactive compounds using biopolymer and lipid-based transporters, Trends Food Sci. Technol., 2018, 78, 34–60 CrossRef CAS . Available from: https://linkinghub.elsevier.com/retrieve/pii/S092422441730777X.
- R. Pérez-Masiá, R. López-Nicolás, M. J. Periago, G. Ros, J. M. Lagaron and A. López-Rubio, Encapsulation of folic acid in food hydrocolloids through nanospray drying and electrospraying for nutraceutical applications, Food Chem., 2015, 168, 124–133 CrossRef PubMed . Available from: https://linkinghub.elsevier.com/retrieve/pii/S030881461401084X.
- K. S. Ravichandran and K. Krishnaswamy, Sustainable food processing of selected North American native berries to support agroforestry, Crit. Rev. Food Sci. Nutr., 2021, 1–26 CrossRef PubMed . Available from: https://www.tandfonline.com/doi/full/10.1080/10408398.2021.1999901.
- C. Anandharamakrishnan and S. P. Ishwarya, Spray Drying Techniques for Food Ingredient Encapsulation: Anandharamakrishnan/Spray Drying Techniques for Food Ingredient Encapsulation, John Wiley & Sons, Ltd, Chichester, UK, 2015, available from: https://doi.wiley.com/10.1002/9781118863985 Search PubMed.
- D. Li, Z. Wei and C. Xue, Alginate-based delivery systems for food bioactive ingredients: An overview of recent advances and future trends, Compr. Rev. Food Sci. Food Saf., 2021, 20(6), 5345–5369 CrossRef CAS PubMed . Available from: https://onlinelibrary.wiley.com/doi/10.1111/1541-4337.12840.
- K. Y. Lee and D. J. Mooney, Alginate: Properties and biomedical applications, Prog. Polym. Sci., 2012, 37(1), 106–126 CrossRef CAS PubMed . Available from: https://linkinghub.elsevier.com/retrieve/pii/S0079670011000918.
- R. A. Neff, R. Kanter and S. Vandevijvere, Reducing Food Loss And Waste While Improving The Public's Health, Health Affairs, 2015, 34(11), 1821–1829 CrossRef PubMed . Available from: https://www.healthaffairs.org/doi/10.1377/hlthaff.2015.0647.
- A. Brandelli, D. J. Daroit and A. P. F. Corrêa, Whey as a source of peptides with remarkable biological activities, Food Res. Int., 2015, 73, 149–161 CrossRef CAS . Available from: https://linkinghub.elsevier.com/retrieve/pii/S0963996915000319.
- E. Singh and A. Sarita, Nutraceutical and food processing properties of millets: a review, Austin Journal of Nutrition and Food Sciences, 2016, 4, 1077 Search PubMed.
- D. M. W. D. Divisekera, J. K. R. R. Samarasekera, C. Hettiarachchi, J. Gooneratne, M. I. Choudhary and S. Gopalakrishnan, et al., Lactic acid bacteria isolated from fermented flour of finger millet, its probiotic attributes and bioactive properties, Ann. Microbiol., 2019, 69(2), 79–92, DOI:10.1007/s13213-018-1399-y.
- S. Malik, K. Krishnaswamy and A. Mustapha, Physical properties of complementary food powder obtained from upcycling of Greek yogurt acid whey with kodo and proso millets, J. Food Process Eng., 2021, 44(11) CAS . Available from: https://onlinelibrary.wiley.com/doi/10.1111/jfpe.13878.
- K. Skryplonek, I. Dmytrów and A. Mituniewicz-Małek, Probiotic fermented beverages based on acid whey, J. Dairy Sci., 2019, 102(9), 7773–7780 CrossRef CAS PubMed . Available from: https://linkinghub.elsevier.com/retrieve/pii/S0022030219305995.
- D. Rajmohan and D. Bellmer, Characterization of Spirulina-Alginate Beads Formed Using Ionic Gelation, Int. J. Food Sci., 2019, 7101279 CAS . Available from: https://pubmed.ncbi.nlm.nih.gov/31058183.
- P. Micha, Physical Properties of Food Powders, Food Engineering Westport, AVI Publishing, 1983, pp. 293–324 Search PubMed.
- J. Fitzpatrick, Powder properties in food production systems, in Handbook of Food Powders, Elsevier, 2013, pp. 285–308. Available from: https://linkinghub.elsevier.com/retrieve/pii/B9780857095138500121 Search PubMed.
- E. Juarez-Enriquez, G. I. Olivas, E. Ortega-Rivas, P. B. Zamudio-Flores, S. Perez-Vega and D. R. Sepulveda, Water activity, not moisture content, explains the influence of water on powder flowability, LWT, 2019, 100, 35–39 CrossRef CAS . Available from: https://linkinghub.elsevier.com/retrieve/pii/S0023643818308892.
- N. Jinapong, M. Suphantharika and P. Jamnong, Production of instant soymilk powders by ultrafiltration, spray drying and fluidized bed agglomeration, J. Food Eng., 2008, 84(2), 194–205 CrossRef . Available from: https://linkinghub.elsevier.com/retrieve/pii/S0260877407002853.
- M. Minekus, M. Alminger, P. Alvito, S. Ballance, T. Bohn and C. Bourlieu, et al., A standardised static in vitro digestion method suitable for food – an international consensus, Food Funct., 2014, 5(6), 1113–1124 RSC . Available from: https://xlink.rsc.org/?DOI=C3FO60702J.
- I. I. Muhamad, N. D. Hassan, S. N. H. Mamat, N. M. Nawi, W. A. Rashid and N. A. Tan, Extraction Technologies and Solvents of Phytocompounds From Plant Materials : Physicochemical Characterization and Identification of Ingredients and Bioactive Compounds From Plant Extract Using Various Instrumentations, in Ingredients Extraction by Physicochemical Methods in Food, Elsevier, 2017, pp. 523–560, available from: https://linkinghub.elsevier.com/retrieve/pii/B9780128115213000144 Search PubMed.
- B. Fox, G. Bellini and L. Pellegrini, Drying, in Fermentation and Biochemical Engineering Handbook, Elsevier, 2014, pp. 283–305, available from: https://linkinghub.elsevier.com/retrieve/pii/B9781455725533000143 Search PubMed.
- S. Malik, K. Krishnaswamy and A. Mustapha, Development and functional characterization of complementary food using kodo and proso millet with acid whey from Greek yogurt processing, J. Food Process. Preserv., 2021, 46(9) Search PubMed , available from: https://onlinelibrary.wiley.com/doi/10.1111/jfpp.16051.
- X. S. Liang, F. Q. Zhao and L. X. Hao, Research on Stability of Synthetic Folic Acid, Adv. Mater. Res., 2013, 781–784, 1215–1218 Search PubMed . Available from: https://www.scientific.net/AMR.781-784.1215.
- D. L. Hofman, V. J. van Buul and F. J. P. H. Brouns, Nutrition, Health, and Regulatory Aspects of Digestible Maltodextrins, Crit. Rev. Food Sci. Nutr., 2016, 56(12), 2091–2100 CrossRef CAS PubMed . Available from: https://www.tandfonline.com/doi/full/10.1080/10408398.2014.940415.
- D. Rocha-Mendoza, E. Kosmerl, A. Krentz, L. Zhang, S. Badiger and G. Miyagusuku-Cruzado, et al., Invited review: Acid whey trends and health benefits, J. Dairy Sci., 2021, 104(2), 1262–1275 CrossRef CAS PubMed . Available from: https://linkinghub.elsevier.com/retrieve/pii/S0022030220310559.
- A. Gharsallaoui, G. Roudaut, O. Chambin, A. Voilley and R. Saurel, Applications of spray-drying in microencapsulation of food ingredients: an overview, Food Res. Int., 2007, 40(9), 1107–1121 CrossRef CAS . Available from: https://linkinghub.elsevier.com/retrieve/pii/S0963996907001238.
- D. B. Wankhede, A. Shehnaj and M. R. Raghavendra Rao, Carbohydrate composition of finger millet (Eleusine coracana) and foxtail millet (Setaria italica), Plant Foods Hum. Nutr., 1979, 28(4), 293–303 CrossRef CAS . Available from: https://link.springer.com/10.1007/BF01095511.
- H. Wang, D. Li, C. Wan, Y. Luo, Q. Yang and X. Gao, et al., Improving the Functionality of Proso Millet Protein and Its Potential as a Functional Food Ingredient by Applying Nitrogen Fertiliser, Foods, 2021, 10(6), 1332 CrossRef CAS PubMed . Available from: https://www.mdpi.com/2304-8158/10/6/1332.
- H. Wang, Y. Wan, W. Wang, W. Li and J. Zhu, Effect of calcium ions on the III steps of self-assembly of SA investigated with atomic force microscopy, Int. J. Food Prop., 2018, 21(1), 1995–2006 CrossRef CAS . Available from: https://www.tandfonline.com/doi/full/10.1080/10942912.2018.1494200.
- J. Chandrapala, M. C. Duke, S. R. Gray, B. Zisu, M. Weeks and M. Palmer, et al., Properties of acid whey as a function of pH and temperature, J. Dairy Sci., 2015, 98(7), 4352–4363 CrossRef CAS PubMed . Available from: https://linkinghub.elsevier.com/retrieve/pii/S0022030215003094.
- N. P. Wong, D. E. LaCroix and F. E. McDonough, Minerals in Whey and Whey Fractions, J. Dairy Sci., 1978, 61(12), 1700–1703 CrossRef CAS PubMed . Available from: https://linkinghub.elsevier.com/retrieve/pii/S0022030278837904.
- A. Vinoth and R. Ravindhran, Biofortification in Millets: A Sustainable Approach for Nutritional Security, Front. Plant Sci., 2017, 8 CAS . Available from: https://journal.frontiersin.org/article/10.3389/fpls.2017.00029/full.
- M. A. Azevedo, A. I. Bourbon, A. A. Vicente and M. A. Cerqueira, Alginate/chitosan nanoparticles for encapsulation and controlled release of vitamin B2, Int. J. Biol. Macromol., 2014, 71, 141–146 CrossRef CAS PubMed . Available from: https://linkinghub.elsevier.com/retrieve/pii/S0141813014003328.
- F. G. Cooper, The Munsell Book of Color 1929: Hue, Value & Chroma. Munsell Color System; Color Matching from Munsell Color Company, 2016, available from: https://munsell.com/color-blog/munsell-book-of-color-1929-hue-value-chroma/ Search PubMed.
- M. del M. Pérez, R. Ghinea, M. J. Rivas, A. Yebra, A. M. Ionescu and R. D. Paravina, et al., Development of a customized whiteness index for dentistry based on CIELAB color space, Dent. Mater., 2016, 32(3), 461–467 CrossRef PubMed . Available from: https://linkinghub.elsevier.com/retrieve/pii/S0109564115005114.
- N. H. Mermelstein, Measuring Moisture Content & Water Activity - IFT.org, 2009, available from: https://www.ift.org/news-and-publications/food-technology-magazine/issues/2009/november/columns/laboratory Search PubMed.
- Y. Wang and T. Truong, Glass Transition and Crystallization in Foods, in Non-Equilibrium States and Glass Transitions in Foods, Elsevier, 2017, pp. 153–172, available from: https://linkinghub.elsevier.com/retrieve/pii/B9780081003091000079 Search PubMed.
- A. Kumar and C. K. Dixit, Methods for characterization of nanoparticles, in Advances in Nanomedicine for the Delivery of Therapeutic Nucleic Acids, Elsevier, 2017, pp. 43–58, available from: https://linkinghub.elsevier.com/retrieve/pii/B9780081005576000031 Search PubMed.
- A. Partovinia and E. Vatankhah, Experimental investigation into size and sphericity of alginate micro-beads produced by electrospraying technique: Operational condition optimization, Carbohydr. Polym., 2019, 209, 389–399 CrossRef CAS PubMed . Available from: https://linkinghub.elsevier.com/retrieve/pii/S0144861719300190.
- D. E. Walton, The morphology of spray-dried particles a qualitative view, Drying Technol., 2000, 18(9), 1943–1986 CrossRef CAS . Available from: https://www.tandfonline.com/doi/abs/10.1080/07373930008917822.
- E. M. Both, R. M. Boom and M. A. I. Schutyser, Particle morphology and powder properties during spray drying of maltodextrin and whey protein mixtures, Powder Technol., 2020, 363, 519–524 CrossRef CAS . Available from: https://linkinghub.elsevier.com/retrieve/pii/S0032591020300012.
- J. Heath and N. Taylor, Energy Dispersive Spectroscopy, The Atrium, Southern Gate, John Wiley & Sons, Ltd, Chichester, West Sussex, PO19 8SQ, 2015 Search PubMed.
- G. Pamunuwa, N. Anjalee, D. Kukulewa, C. Edirisinghe, F. Shakoor and D. N. Karunaratne, Tailoring of release properties of folic acid encapsulated nanoparticles via changing alginate and pectin composition in the matrix, Carbohydr. Polym. Technol. Appl., 2020, 1, 100008 Search PubMed . Available from: https://linkinghub.elsevier.com/retrieve/pii/S2666893920300086.
- S. Yakubu and J. Muazu, Effects of variables on degradation of folic acid, J. Pharm. Sci., 2010, 4, 55–58 Search PubMed.
- S. V. Bhujbal, G. A. Paredes-Juarez, S. P. Niclou and P. de Vos, Factors influencing the mechanical stability of alginate beads applicable for immunoisolation of mammalian cells, J. Mech. Behav. Biomed. Mater., 2014, 37, 196–208 CrossRef CAS PubMed . Available from: https://linkinghub.elsevier.com/retrieve/pii/S1751616114001532.
- J. Kalinová, Nutritionally Important Components of Proso Millet (Panicum miliaceum L.), Food Global Science Book, 2006, vol. 10, pp. 91–100 Search PubMed.
- B. A. Harper, S. Barbut, L. T. Lim and M. F. Marcone, Effect of Various Gelling Cations on the Physical Properties of “Wet” Alginate Films: Effect of various gelling cations on, J. Food Sci., 2014, 79(4), E562–E567 CrossRef CAS PubMed . Available from: https://onlinelibrary.wiley.com/doi/10.1111/1750-3841.12376.
- D. W. Dadi, S. A. Emire, A. D. Hagos and J. B. Eun, Effects of spray drying process parameters on the physical properties and digestibility of the microencapsulated product from Moringa stenopetala leaves extract, Cogent Food Agric., 2019, 5(1), 1690316 CrossRef . Available from: https://www.tandfonline.com/doi/full/10.1080/23311932.2019.1690316.
- A. Manickavasagan, K. Thangavel, S. R. S. Dev, D. S. A. Delfiya, E. Nambi and V. Orsat, et al., Physicochemical Characteristics of Date Powder Produced in a Pilot-Scale Spray Dryer, Drying Technol., 2015, 33(9), 1114–1123 CrossRef CAS . Available from: https://www.tandfonline.com/doi/full/10.1080/07373937.2015.1014045.
- D. Seth, H. N. Mishra and S. C. Deka, Functional and reconstitution properties of spray-dried sweetened yogurt powder as influenced by processing conditions, International Journal of Food Properties, 2017, 20(7), 1603–1611 CrossRef CAS . Available from: https://www.tandfonline.com/doi/full/10.1080/10942912.2016.1214965.
- M. B. Perez-gago and J. M. Krochta, Denaturation Time and Temperature Effects on Solubility, Tensile Properties, and Oxygen Permeability of Whey Protein Edible Films, J. Food Sci., 2001, 66(5), 705–710 CrossRef CAS . Available from: https://onlinelibrary.wiley.com/doi/10.1111/j.1365-2621.2001.tb04625.x.
- C. I. Nindo, J. Tang, J. R. Powers and P. Singh, Viscosity of blueberry and raspberry juices for processing applications, J. Food Eng., 2005, 69(3), 343–350 CrossRef . Available from: https://linkinghub.elsevier.com/retrieve/pii/S0260877404003826.
- K. McCrickerd, L. Chambers, J. M. Brunstrom and M. R. Yeomans, Subtle changes in the flavour and texture of a drink enhance expectations of satiety, Flavour., 2012, 1(1), 20 CrossRef . Available from: https://flavourjournal.biomedcentral.com/articles/10.1186/2044-7248-1-20.
- P. Rai, G. C. Majumdar, S. DasGupta and S. De, Prediction of the viscosity of clarified fruit juice using artificial neural network: a combined effect of concentration and temperature, J. Food Eng., 2005, 68(4), 527–533 CrossRef . Available from: https://linkinghub.elsevier.com/retrieve/pii/S0260877404003152.
- R. T. Lagemann, A Relation between Viscosity and Refractive Index, J. Am. Chem. Soc., 1945, 67(3), 498–499, DOI:10.1021/ja01219a509.
- A. Belay and G. Assefa, Concentration, Wavelength and Temperature Dependent Refractive Index of Sugar Solutions and Methods of Determination Contents of Sugar in Soft Drink Beverages using Laser Lights, J. Laser Opt. Photonics, 2018, 5(2) DOI:10.4172/2469-410X.1000187.
- D. K. Santra and D. J. Rose, Alternative Uses of Proso Millet, The board of Regents of the University of Nebraska, 2013, vol. 4 Search PubMed.
- P. Etcheverry, M. A. Grusak and L. E. Fleige, Application of in vitro bioaccessibility and bioavailability methods for calcium, carotenoids, folate, iron, magnesium, polyphenols, zinc, and vitamins B6, B12, D, and E, Front Physio., 2012, 3, 317 CAS . Available from: https://journal.frontiersin.org/article/10.3389/fphys.2012.00317/abstract.
- D. A. Neves, K. B. d. S. Lobato, R. S. Angelica, J. Teixeira Filho, G. P. R. d. Oliveira and H. T. Godoy, Thermal and in vitro digestion stability of folic acid in bread, J. Food Compos. Anal., 2019, 84, 103311 CrossRef CAS . Available from: https://linkinghub.elsevier.com/retrieve/pii/S0889157519306192.
- W. Shi, Y. Wang, H. Zhang, Z. Liu and Z. Fei, Probing deep into the binding mechanisms of folic acid with α-amylase, pepsin and trypsin: An experimental and computational study, Food Chem., 2017, 226, 128–134 CrossRef CAS PubMed . Available from: https://linkinghub.elsevier.com/retrieve/pii/S0308814617300547.
| This journal is © The Royal Society of Chemistry 2023 |

