 Open Access Article
Determination of moisture loss of pomegranate cultivars under cold and shelf storage conditions and control strategies
Robert
Lufu
ab,
Alemayehu
Ambaw
 b and
Umezuruike Linus
Opara
*bc
aDepartment of Food Science, Faculty of AgriSciences, Stellenbosch University, Private Bag X1, Stellenbosch, 7602, South Africa
bAfrica Institute for Postharvest Technology, Postharvest Technology Research Laboratory, South African Research Chair in Postharvest Technology, Faculty of AgriSciences, Stellenbosch University, Private Bag X1, Stellenbosch, 7602, South Africa
cUNESCO International Centre for Biotechnology, Nsukka 410001, Enugu State, Nigeria. E-mail: unesco.icb.nigeria@gmail.com
First published on 29th November 2022
Abstract
Pomegranates are prone to moisture loss, despite having a thick rind. This study aimed to characterise the moisture loss in the three most exported pomegranate cultivars (‘Acco’, ‘Herskawitz’ and ‘Wonderful’) of South Africa during cold and shelf storage. The contribution and susceptibility of the different parts of the fruit to moisture loss were measured and characterized. Furthermore, water loss control strategies (liner packaging, shrink wrapping and surface waxing) were investigated. Sample pomegranates were stored for 42 d at 7 °C and 90% relative humidity (RH) and thereafter transferred to shelf conditions of 23 °C and 58% RH. Another group of pomegranates were directly stored at 23 °C and 58% RH for 16 d to simulate prolonged shelf conditions. The fruits were examined for the moisture loss, transpiration rate (TR), respiration rate (RR), fraction of peels and arils, moisture content of the fractions, peel thickness and chemical attributes of the fruit juice. Moisture loss in pomegranates significantly varies among cultivars, especially during shelf storage as compared to cold storage and is significantly influenced by the size, RR, peel and aril fraction, moisture content, and peel thickness. Medium-sized fruit (‘Herskawitz’ and ‘Wonderful’) had a significantly higher moisture loss of 0.32 ± 0.01 g cm−2 (TR = 0.16 mg kg−1 s−1) than the small-sized fruit (‘Acco’) which had a moisture loss of 0.25 ± 0.01 g cm−2 (TR = 0.14 mg kg−1 s−1) at a vapour pressure deficit (VPD) of 1.176 kPa during the prolonged 16 d of shelf storage. The maximum moisture loss (24.2%) observed under the tested conditions was almost entirely from the peel portion of the fruit. Liner packing (2.1%), shrink wrapping (0.8%) and surface waxing (4.0%) significantly (P < 0.0001) minimised the moisture loss of the un-treated (7.7%) fruit during cold storage. In addition, waxing, liner packaging and shrink wrapping greatly increased the critical time Ct (time to reach a moisture loss of 5%) of un-treated ‘Wonderful’ fruit under cold storage from 26.1 d to 52.9, 98.0 and 251.6 d, respectively.
Introduction
Pomegranate fruit (Punica granatum L.) is a fruit of old, native to the region between Iran and the Himalayas in northern India and has over 500 cultivars.1,2 Global production is estimated to be three million tons annually.3 The wide knowledge and increasing public awareness about the health benefits associated with pomegranates have tremendously increased its consumption4,5 especially in the western part of the world. Particularly, there has been a growing demand for high quality, healthy and exotic fruit both for fresh use and local processing into juices and other products.6,7 Therefore, there is increasing research interest focusing on maintaining pomegranate fruit quality throughout the supply chain: harvesting, packaging, transportation, storage and marketing.8,9Pomegranates are highly perishable fruit despite having a relatively lower respiration rate.10 Particularly, pomegranate fruits are prone to moisture loss due to the plentiful micro-pores and slits in the skin, despite having a thick rind.11–14 Research showed that cultivars such as ‘Bhagwa’, ‘Ruby’ and ‘Wonderful’ can lose 20–25% of the initial fruit weight within 4 weeks at a temperature and relative humidity of 22 °C and 65%.12,15 During prolonged cold storage, the fruit ‘Bhagwa’, ‘Ruby’ and ‘Wonderful’ lose between 10 and 16% of their weight within 12 weeks at 5–7 °C and 90–95% RH.12,15–17 A weight loss above 5% causes shrivelling and reduces the marketability of the commodity.8,18 Even in the absence of any visible shrivelling, moisture loss can undesirably affect the visual appearance, flavour and textural properties of the fruit.19 Excessive moisture loss results into browning of the peel and arils and hardening of the rind.20,21 It is important to note that pomegranates are luxurious fruit that sell well in the higher market segment.7 Therefore moisture loss can easily cause a huge financial loss to the industry through direct loss of marketable fresh weight and the associated diminished commercial value of affected fruit.21
Common moisture loss control techniques have been investigated by many researchers such as temperature and relative humidity management,15,22 plastic liners (modified atmosphere packaging)8,16,23,24 and individual shrink wrapping with plastic films.17,25,26 However, several studies demonstrated increased fruit decay with plastic liners due to moisture condensation.8,16 Plastic liners also block the airflow path (increases airflow resistance) and hence increase the time and energy usage of cooling operations.27 In addition, plastic food packaging poses innumerable environmental and public health risks so biodegradable and sustainable alternatives such as surface waxing/coating have been investigated.9,28,29 Before choosing an appropriate technology for strategic optimal moisture loss control, there is a need to understand the moisture loss characteristics of a commodity. Given its relatively unique and complex structure, there is a knowledge gap on the dynamics of moisture loss regrading pomegranate fruit.13
This study aimed to investigate the moisture loss dynamics and physio-chemical attributes of pomegranate fruit. Secondly, the contribution and susceptibility of the different parts of the fruit to moisture loss were measured and characterized. The study assesses three commercially important pomegranate cultivars (‘Acco’, ‘Herskawitz’ and ‘Wonderful’) of South Africa, under cold storage and shelf conditions. Furthermore, water loss control strategies were investigated.
Materials and methods
Fruit acquisition
Pomegranate fruits (Punica granatum L.) of cultivars ‘Acco’, ‘Herskawitz’ and ‘Wonderful’ were harvested at commercial maturity (early morning harvest) from a commercial orchard in Porterville, Wellington (33° 38′ S, 19° 00′ E), Western Cape Province, South Africa. At commercial maturity the fruits have attained a desired maturity-ripeness stage, assessed based on the fruit mass, aril colour, total soluble solids (TSS) and titratable acidity (TA) of the aril juice. These three cultivars are of the most economic importance in terms of production and export. The fruits were packed in a corrugated fibreboard carton (CFC) and transported using an air-conditioned refrigerated truck to the postharvest research laboratory at Stellenbosch University, and were sorted for size and colour uniformity, and defect-free appearance.Experimental design
Group 2 was directly stored under shelf conditions of 23 °C and 58% RH.13 Twelve pomegranates were reserved for size monitoring, while 12 fruits were sampled for quality assessment at 8 d, and again at 16 d of shelf storage. This procedure mimics fruits that are placed directly on open shelves for marketing.
Moisture loss control
Packaging and waxing methods were investigated on one of the three pomegranate cultivars (‘Wonderful’). The selection of the cultivar was based on economic importance. Three different groups of 48 fruits were assigned to three different treatments: modified atmosphere packaging using micro-perforated plastic liners (Xtend®, item code 815-PG28/m, patent no. 6190710, StePac L.A. Ltd, Israel), individual-fruit surface wrapping using heat shrinkable co-extruded polyolefin plastic films (Vector shrink film-19micron Polyolefin (POF) centrefold 1067 m, MIPAQ, Durban, South Africa) and surface coating by dipping fruit in lac-resin based wax (Endura-Fresh TM 6100, John Bean Technologies Corporation, Cape Town, South Africa) for 5 s and air drying at 23 °C for 12 h. All the treated fruits including the un-treated lot (control) were placed inside open top cartons in dozens and subjected to the same storage conditions and duration as group 1. Plastic liners and shrink wraps were removed before the fruits were transferred to shelf storage.Measurements
The three linear dimensions of the fruit were measured using a digital Vernier calliper (Mitutoyo, Kawasaki, Japan, ± 0.01 mm). The fruit length (L) measures the longitudinal dimension (excluding the fruit calyx), while the width (W) and thickness (T) measure the dimensions on the equator (cheeks) of the fruit. The fruit weight was determined using an electronic scientific scale (Mettler Toledo, model ML3002E, Nanikon, Zurich, Switzerland, 0.0001 g accuracy).
A different set of randomly sampled fruit were cut open by hand with the aid of a sharp knife and the arils (edible portion) were separated from the peel. The peel thickness was measured using a pair of digital Vernier callipers (Mitutoyo, model CD-6 CX, Kawasaki, Japan, ±0.01 mm) of accuracy 0.01 mm. Opposite peel segments of the fruit were obtained using sharp blades. Measurements were then taken at the opposite equatorial positions of each segment, obtaining four readings from each of the 12 sampled fruits. The weight of the arils and peels from each fruit was measured using an electronic scientific scale (Mettler Toledo, model ML3002E, Switzerland, 0.0001 g accuracy) to determine their proportions.
Fresh juice was extracted from the arils using a blender (Mellerware, Liquafresh Juice Extractor III 26300B, Cape Town, South Africa) with a pre-fitted screen for filtering. The total soluble solids (TSS) of the fruit juice were measured using a digital refractometer (Atago, Tokyo, Japan). Titratable acidity (TA) was determined potentiometrically, where 2 mL of pomegranate juice (PJ) in 70 mL of distilled water was titrated with 0.1 N NaOH to an endpoint of pH 8.2 using a compact auto titrosampler (Metrohm 862, Herisau, Switzerland). Titratable acidity was expressed in milligrams of citric acid (CA) per a hundred millilitres of juice.
Calculations
| A = π(Dg)2 | (1) |
| Dg = (LWT)1/3 | (2) |
 | (3) |
 | (4) |
| VPD = Psat × (aw − RH/100) | (5) |
 | (6) |
 | (7) |
Statistical analysis
The measured and calculated data on fruit physical and physio-chemical attributes were analysed using Statistica software (Statistica 13.6, 2019 Statsoft, USA). The data were also subjected to analysis of variance (ANOVA) to assess the main effects of cultivars and storage duration. Duncan's multiple range test was carried out to test for statistical significance at p < 0.05. Principal component analysis (PCA) and the Pearson correlation test were carried out using XLSTAT software (version 2019.1, Addinsoft, Paris, France) to assess the variability and to establish relationships among quality parameters.Results and discussion
Fruit size difference
The three cultivars differed in fruit size and weight (Table 1). Generally, ‘Acco’ was the smallest in size with a mass of 185.7 g and geometric mean diameter of 67.9 cm compared to ‘Herskawitz’ (302.2 g and 82.5 cm) and ‘Wonderful’ (336.3 g and 86.8 cm). ‘Wonderful’ fruits are naturally bigger in size and larger in surface area compared to ‘Herskawitz’ and ‘Acco’.33| Fruit cultivar | Mass (g) | W (cm) | T (cm) | L (cm) | D g (cm) |
|---|---|---|---|---|---|
| Acco | 185.71 ± 12.99 | 73.36 ± 3.18 | 72.62 ± 3.25 | 58.67 ± 3.65 | 67.86 ± 2.94 |
| Herskawitz | 302.17 ± 45.36 | 86.54 ± 7.34 | 81.33 ± 5.55 | 76.82 ± 6.51 | 82.54 ± 5.11 |
| Wonderful | 336.32 ± 31.10 | 90.03 ± 4.24 | 89.67 ± 4.32 | 80.91 ± 4.90 | 86.77 ± 4.20 |
Fruit moisture loss
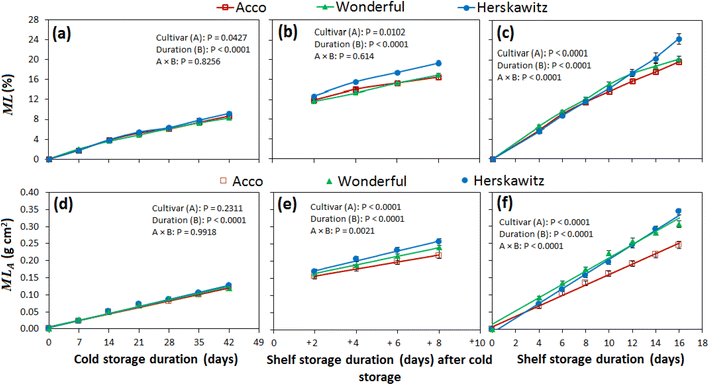
The moisture loss profiles of the three pomegranate fruit cultivars are presented in Fig. 1. During the 42 d cold storage (Fig. 1a and d), only the storage duration showed a significant effect (P < 0.0001) on fruit moisture loss (especially MLA). However, the additional 8 d of shelf storage (Fig. 1b and e) showed that both storage duration and cultivar effects significantly influenced fruit moisture loss, with ‘Herskawitz’ (19.3% and 0.26 g cm−2) and ‘Wonderful’ (17.0% and 0.24 g cm−2) exhibiting higher losses than ‘Acco’ (16.5% and 0.22 g cm−2). This observation is well elaborate in MLA (Fig. 1e), where the combined effect of the storage duration and cultivar difference significantly influenced moisture loss compared to ML (Fig. 1b).Under the prolonged 16 d shelf storage, all tested conditions and their interaction significantly (P < 0.0001) influenced moisture loss with higher losses in ‘Herskawitz’ (24.2% and 0.34 g cm−2) and ‘Wonderful’ (20.2% and 0.31 g cm−2) than ‘Acco’ (19.6% and 0.25 g cm−2). Furthermore, moisture loss among cultivars was more elaborate at the end of the storage regime than at the start. Generally, the results presented above showed that the difference in moisture loss among fruit cultivars was more evident under shelf conditions than cold storage conditions. Moisture loss was observed to be cultivar indifferent34 between ‘Taeifi’, ‘Banati’ and ‘Manfaloti’ cultivars of pomegranate throughout the cold storage at different temperatures. Furthermore,12 it was observed that the weight loss in ‘Ruby’ was relatively similar (20–25%) to that in ‘Bhagwa’ cultivars of pomegranate fruit after 28 d of shelf storage at 22 °C and 65% RH.
Respiration rate (RR)
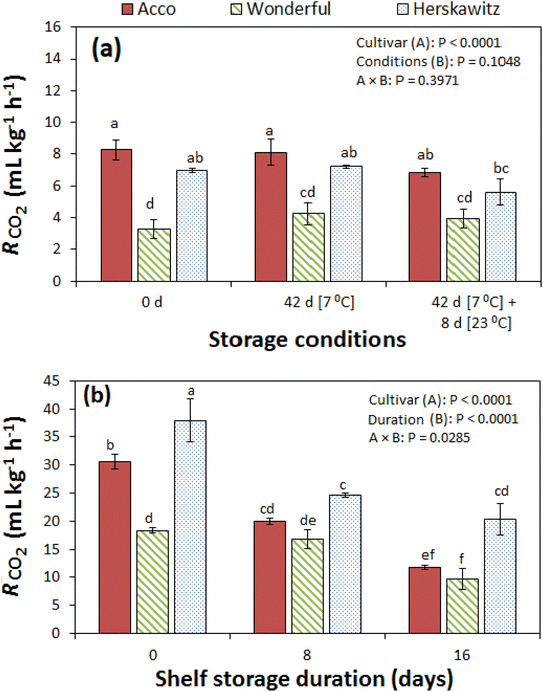
Fig. 2 summarises the results on RR across all tested conditions. Before storage at low 7 °C, a significantly higher RR was observed in ‘Acco’ (8.3 mL kg−1 h−1) and ‘Herskawitz’ (6.9 mL kg−1 h−1) than in ‘Wonderful’ (3.3 mL kg−1 h−1) fruit (Fig. 2a). The change in RR was insignificant after 42 d of cold storage and after the subsequent 8 d shelf storage. During the direct shelf storage period of 16 d (Fig. 2b), the effects of the cultivar, storage duration and their interaction significantly influenced RR, with higher RR in ‘Herskawitz’ than in ‘Wonderful’ and ‘Acco’. Therefore, the fruit cultivars with higher moisture loss also had the highest RR and vice versa. RR decreased from the initial 18.4, 37.9 and 30.6 mL kg−1 h−1 to 9.7, 20.3 and 11.7 mL kg−1 h−1 at the end of storage for ‘Wonderful’, ‘Herskawitz’ and ‘Acco’, respectively. Other studies have also reported decreasing RR of pomegranate fruit with the storage duration.25,26 A similar situation was observed in climacteric fruit (pear) stored under different temperature and relative humidity combinations.35 In contrast, an increase of RR with the storage duration has been reported in pomegranate uncoated and coated fruit.28 Generally, the RR of pomegranates increases to a peak and then decreases with time during storage.9,36 The increase in RR could be a respiratory based physiological disorder in response to sudden change in the environment from ambient conditions before storage to cold storage conditions of 7 °C. The decrease in RR could be a sign of senescence with a reduction in the quantity of living cells with time.26Proportion of fruit fractions
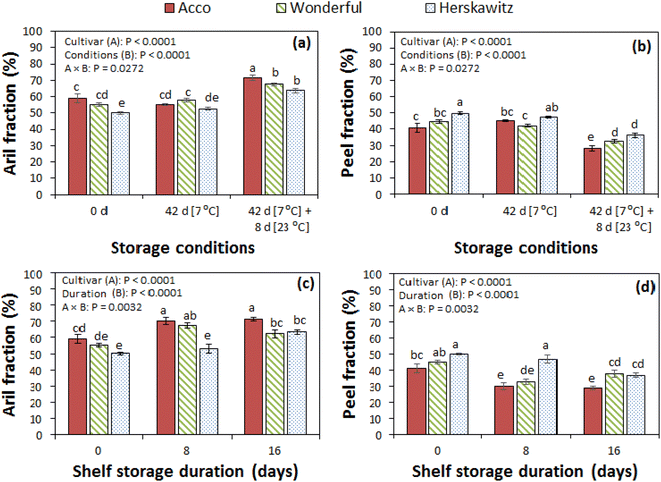
The cultivar, storage duration and their interaction significantly influenced the proportion of fruit fractions across all tested conditions. The three cultivars differed in the proportions of arils and peel as summarized in Fig. 3: 59.0 and 41.0% in ‘Acco’, 50.1 and 49.9% in ‘Herskawitz’ and 55.4 and 44.6% in ‘Wonderful’, respectively, before storage. These results are in close range with 50.8–58.3% arils and 41.7–49.2% peels reported for other cultivars grown in Oman.31 Furthermore, the aril proportions in the current study are comparable with the 55.6% in the ‘Ruby’ cultivar grown in Morocco,37 58% in ‘Ruby’,38 and 48.5% in ‘Wonderful’39 cultivars grown in South Africa.Generally, there was no significant increase in the proportion of arils and decrease in the peel fractions during the 42 d of cold storage (Fig. 3a and b). However, by the end of the additional 8 d of shelf life, the proportion of arils significantly increased with a decrease in the peel proportion. A quite similar scenario was observed during the 16 d of direct shelf life storage, with a higher peel proportion in ‘Herskawitz’ than in other cultivars (Fig. 3c and d). Secondly, the fruit peel proportion decreased with storage time.
Despite having tough thick rind, pomegranate fruit is reported to be more susceptible to weight loss due to the numerous micro-pores on the outer peel.40,41 The findings of the current study further suggest that moisture loss in pomegranate fruit is primarily and mainly from the peel fraction. The fruit of the ‘Herskawitz’ cultivar had the highest percentage of peel fraction and therefore the highest moisture loss by the end of each storage regime under the tested conditions. These findings are in agreement with previous research12,15,25 and are further supported by the results from peel thickness and moisture content analysis reported in the following sections.
Peel thickness
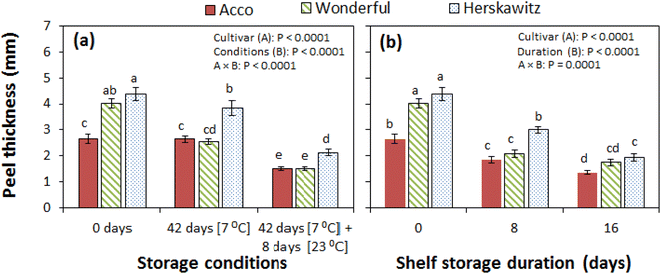
Under cold storage and the additional 8 d of shelf storage, the peel thickness was significantly (P < 0.0001) influenced by the cultivar difference, storage conditions and their combined effect (Fig. 4a). Peel thickness measurements initially ranged from 2.76 to 4.38 mm and these values are in the range (2.68–4.70 mm) reported by Al-Said et al.31 on four pomegranate cultivars grown in Oman. Before storage, the peel thickness varied significantly among cultivars, being greatest in ‘Herskawitz’ (4.38 mm), followed by ‘Wonderful’ (4.03 mm) and least in ‘Acco’ (2.66 mm). Thereafter, the peel thickness decreased with the storage duration to 2.13, 1.51 and 1.51 mm, respectively, at the end of the 42 d of cold storage and the additional 8 d of shelf storage (Fig. 4a).Similarly, during the prolonged shelf storage period of 16 d (Fig. 4b), the peel thickness was significantly (P < 0.0001) influenced by the cultivar difference, storage conditions and the combined effect of both factors (Fig. 4a). The peel thickness reduced from 4.38, 4.03 and 2.66 mm to 1.93, 1.74 and 1.35 mm in ‘Herskawitz’, ‘Wonderful’ and ‘Acco’, respectively. Generally, the peel thickness was greatest in ‘Herskawitz’ and lowest in ‘Acco’. The thinning of the peel in time shows that moisture loss in pomegranate fruit comes to a great degree from the peel fraction.
Arils and peel moisture content
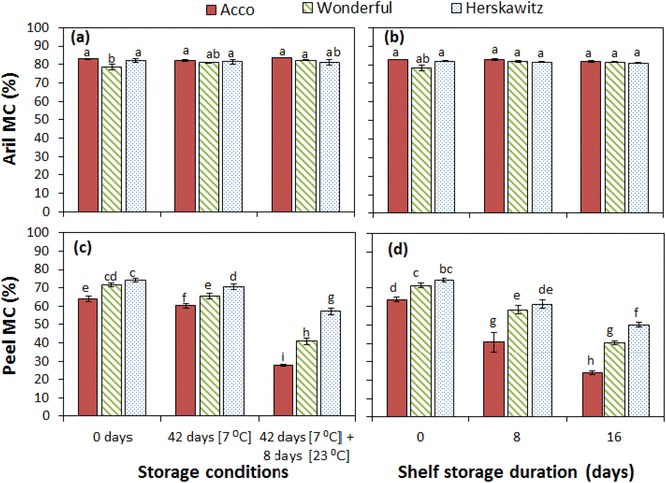
Results on aril and peel moisture contents are summarised in Fig. 5a–d. The aril moisture content of the three cultivars was similar (81.66 ± 0.99%) across all conditions of storage, while the peel moisture content decreased with storage time (Fig. 5a and b). Similar to our results, Arendse et al.15 reported aril moisture contents in the range of 79.74–85.11% with no significant change, for pomegranate fruit (cv. Wonderful) grown in South Africa and under prolonged storage for 28 d at 21 °C and 140 d at 10, 7.5 and 5 °C. However, slightly lower aril moisture contents (76.01–79.09%) were observed in other cultivars grown in Oman.31 These differences could be attributed to cultivar and geographical variation.On the other hand, the cultivar and storage duration and their interaction significantly influenced the peel moisture content (Fig. 5c and d). Initially, the peel moisture content was greatest in ‘Herskawitz’ (74.29%), followed by ‘Wonderful’ (71.46%) and least in ‘Acco’ (63.91%). Furthermore, the peel moisture content decreased with storage time during cold storage and shelf storage. By the end of the 42 d of cold storage plus 8 d of shelf life, the peel moisture content had reduced to 17.18, 30.65, and 36.36% in ‘Herskawitz’, ‘Wonderful’ and ‘Acco’, respectively. The constant moisture content observed in the arils as opposed to the decreasing moisture content in the peels during storage indicates that the peel was the main contributor to the moisture loss of the fruit in the range of the tested conditions. Therefore, the level of moisture loss observed in this study (Fig. 1) was not enough to induct any change in the aril moisture content and consequently the aril weight. Furthermore, the observed increase in the proportion of arils in the fruit is due to the reduction in the proportion of the peels.
Soluble solids and acidity of fruit juice
The chemical attributes of TSS and TA are important in describing the sweetness and sourness of fruit juice taste, respectively.31,42 The changes in the chemical attributes of the fruit juice with storage time are presented in Tables 2 and 3. Generally, TSS significantly varied among cultivars and was higher in ‘Wonderful’ (16.50 °Brix) than in ‘Acco’ (14.67 °Brix) and ‘Herskawitz’ (14.82 °Brix). A non-significant increase of TSS was observed at the end of the 42 d of cold storage and the end of the additional eight days of shelf storage (Table 2). On the other hand, the storage duration had a significant influence on the increase in TSS for batch 2 fruit stored immediately under shelf conditions (Table 3). The results are comparable with the findings of Mukama et al.43 who observed a non-significant change in TSS for fruit stored under low RH (65%) and a significant increase for fruit under high RH (95%) at 20 °C for 30 d. This is often attributed to the increase in the concentration of soluble sugars due to moisture loss; however, in the current study no significant change in the aril moisture content was observed. Therefore, we attribute the increase in TSS to the hydrolysis of starch and polysaccharides into soluble sugar substrates that are required for supporting the respiration process.44,45| Storage conditions | Cultivar | TSS (°Brix) | TA (mg 100 mL−1) |
|---|---|---|---|
| a Results are presented as means ± standard error of the mean (n = 12). Means with different superscript letters are significantly different (P < 0.05) and the numerical values of A and B are p-values. | |||
| 0 d | Acco | 14.67 ± 0.41b | 0.25 ± 0.02f |
| Wonderful | 16.50 ± 0.21a | 1.62 ± 0.04b | |
| Herskawitz | 14.82 ± 0.37b | 1.16 ± 0.04c | |
| 42 d [7 °C] | Acco | 14.99 ± 0.17b | 0.58 ± 0.03e |
| Wonderful | 16.75 ± 0.23a | 1.05 ± 0.05c | |
| Herskawitz | 14.84 ± 0.27b | 1.81 ± 0.10a | |
| 42 d [7 °C] + 8 d [23 °C] | Acco | 15.12 ± 0.20b | 0.48 ± 0.01e |
| Wonderful | 16.49 ± 0.15a | 0.91 ± 0.05d | |
| Herskawitz | 15.30 ± 0.15b | 1.56 ± 0.05b | |
| P-Values | Cultivar (A) | <0.0001 | <0.0001 |
| Storage duration (B) | 0.3021 | <0.0001 | |
| A × B | 0.6294 | <0.0001 | |
| Storage conditions | Cultivar | TSS (°Brix) | TA (mg 100 mL−1) |
|---|---|---|---|
| a Results are presented as means ± standard error of the mean (n = 12). Means with different superscript letters are significantly different (P < 0.05) and the numerical values of A and B are p-values. | |||
| 0 d | Acco | 14.67 ± 0.41c | 0.25 ± 0.02e |
| Wonderful | 16.50 ± 0.21b | 1.62 ± 0.04b | |
| Herskawitz | 14.82 ± 0.37c | 1.16 ± 0.04c | |
| 8 d [23 °C] | Acco | 15.89 ± 0.21b | 0.28 ± 0.01e |
| Wonderful | 17.71 ± 0.18a | 1.91 ± 0.17a | |
| Herskawitz | 15.90 ± 0.39b | 1.26 ± 0.11c | |
| 16 d [23 °C] | Acco | 16.26 ± 0.12b | 0.69 ± 0.08d |
| Wonderful | 17.47 ± 0.19a | 1.25 ± 0.10c | |
| Herskawitz | 16.41 ± 0.23b | 1.20 ± 0.08c | |
| P-Values | Cultivar (A) | <0.0001 | <0.0001 |
| Storage duration (B) | <0.0001 | 0.1685 | |
| A × B | 0.5465 | <0.0001 | |
Titratable acidity (TA) was significantly influenced by the cultivar effect and the interaction between the cultivar and storage time. Before storage TA was lower in ‘Acco’ (0.25 mg 100 mL−1) than in ‘Herskawitz’ (1.15 mg 100 mL−1) and ‘Wonderful’ (1.62 mg 100 mL−1). TA increased at 42 d of cold storage, followed by a decline with the additional 8 d of shelf storage, except in ‘Wonderful’ where a consistent decline was observed (Table 2). It is important to note that TA was significantly lower in ‘Acco’ than in ‘Wonderful’ and ‘Herskawitz’ across all tested conditions. ‘Acco’ is generally considered as a sweet cultivar as compared to ‘Wonderful’ and ‘Herskawitz’ in the sweet-sour to the sour range.46 The TA of 1.16, 1.62 and 0.25 mg 100 mL−1 before batch 2 fruit storage remained stable in ‘Herskawitz’ (1.20 mg, 100 mL−1) compared to a decrease in ‘Wonderful’ (1.25 mg, 100 mL−1) and an increase in ‘Acco’ (0.69 mg, 100 mL−1), at the end of the storage period (Table 3). Therefore, the different cultivars of the fruit responded differently to the storage conditions. Comparably, a decrease in TA has been reported in different cultivars of pomegranates including ‘Wonderful’, ‘Hicrannar’ and ‘Hicaznar’15,47,48 under different storage conditions, attributed to the utilization of organic acids in metabolic processes.
Pearson correlation
The Pearson correlation test was performed to establish the relationships among the physical and physio-chemical attributes of pomegranate fruit, across all the tested storage conditions (Table 4). Significant (P < 0.05) correlations were observed among most of the analysed quality attributes of the pomegranate fruit (Table 4). Fruit moisture loss per unit fruit mass ML exhibited strong positive correlations with moisture loss per unit surface area MLA (r = 0.981) as well as strong negative correlations with peel thickness PT (r = −0.647). This implies that fruits such as ‘Herskawitz’ with high MLA and with thicker peels are more susceptible to moisture loss compared to ‘Acco’ with lower MLA and with thinner peels (Fig. 5b). The negative sign in this case is due to the decreasing peel thickness with the storage duration, as data across all treatments were used in the analysis. Furthermore, a highly significant interaction effect was noticed between cultivar and storage duration effects.| Variables | WL | WLA | Arils (%) | Peel (%) | MC_Arils | MC_Peel | PT | RR | TSS | TA |
|---|---|---|---|---|---|---|---|---|---|---|
| a WL and WLA, weight loss per unit mass and unit surface area, respectively; MC_Arils, moisture content (wet basis) of arils; MC_peel, moisture content (wet basis) of peel; PT, peel thickness; TSS, total soluble solids; TA, titratable acidity; RR, respiration rate. Values in bold are different from 0 with a significance level alpha = 0.95. | ||||||||||
| WL | 1 | |||||||||
| WLA | 0.981 | 1 | ||||||||
| Arils (%) | 0.508 | 0.418 | 1 | |||||||
| Peel (%) | −0.508 | −0.418 | −1.000 | 1 | ||||||
| MC_Arils | −0.066 | −0.161 | 0.574 | −0.574 | 1 | |||||
| MC_Peel | −0.585 | −0.494 | −0.839 | 0.839 | −0.637 | 1 | ||||
| PT | −0.647 | −0.596 | −0.892 | 0.892 | −0.415 | 0.862 | 1 | |||
| RR | 0.071 | 0.047 | −0.023 | 0.023 | −0.124 | 0.019 | 0.056 | 1 | ||
| TSS | 0.242 | 0.344 | 0.264 | −0.264 | −0.352 | −0.123 | −0.404 | 0.204 | 1 | |
| TA | −0.003 | 0.096 | −0.408 | 0.408 | −0.678 | 0.618 | 0.486 | 0.018 | 0.271 | 1 |
A significant and moderate negative correlation (r = −0.508) exists between the moisture loss ML and peel proportion across all tested conditions. However, this relationship is specifically very strong (r = −0.823) for fruit under cold storage and subsequent shelf storage. The relationship implies that the peel proportion decreased with time as fruit moisture loss increased. Furthermore, a significant and very strong positive correlation is observed between the peel proportion and peel moisture content (r = 0.839) and thickness (r = 0.892), as observed in ‘Herskawitz’ fruit. As expected, the peel proportion is dependent on the moisture content and thickness of the peels. Other attributes that significantly (P < 0.05) correlated with moisture loss in pomegranates include the respiration rate and TSS. The respiration rate was significantly influenced by the TSS as expected.
Moisture loss control
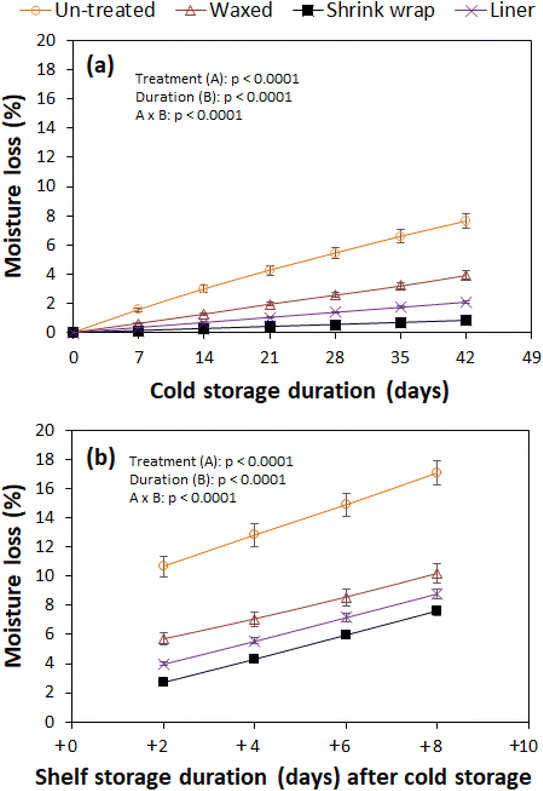
Fig. 6 shows the effect of packaging and waxing treatments on moisture loss in the ‘Wonderful’ cultivar. All treatments significantly (P < 0.0001) minimised moisture loss. Compared to the control (un-treated, 7.7%), liner packaging, shrink wrapping and surface waxing reduced the moisture loss by 3.7, 9.6 and 1.9 times, respectively, at the end of cold storage (Fig. 6a). The added 8 d of shelf storage further increased the moisture loss by 4.0, 7.0, 2.5 and 2.0 times for the liner packaged (8.8%), shrink wrapped (7.6%), waxed (10.2%) and un-treated (17.1%) fruit, respectively (Fig. 6b). The reduced moisture losses were due to the barrier effect of the packaging materials against evaporation from the fruit. The lowest moisture loss was observed for the shrink-wrapped fruit. The positioning of the plastic (the moisture barrier) directly and tightly on the fruit surface by shrink wrapping looks more effective in lowering the moisture loss compared to putting the fruit in plastic bags. Very steep increases in moisture loss were observed for liner packaged and shrink-wrapped fruit during the shelf condition. This is because the plastic liners and shrink-wrapped films were removed prior to shelf storage to avoid moisture condensation, which would initiate fruit decay.8 Previous studies also show that liners and shrink wrapping significantly minimised water loss in pomegranates.8,9,17,29 The waxing of fruit alone was not sufficient to minimise moisture loss compared to plastic liners and shrink-wrapping. These results are supported by findings from a previous study where a microperforated liner performed better than using gum Arabic and maize starch coating alone to minimise the weight loss of pomegranate fruit (cv. Wonderful).9 However, surface waxing is a potential sustainable and environmentally friendly moisture loss control technique that can profit the pomegranate industry.Moisture loss model and transpiration rate
Tables 5 and 6 present results from moisture loss models, vapour pressure deficit and the time to reach 5% moisture loss (the critical time, Ct) for the three fruit cultivars and for the control treatments. The models revealed very strong linear relationships (R2 = 0.96–1.00) between the moisture loss and storage duration for pomegranate fruit, irrespective of the cultivar and moisture loss control treatments under all tested conditions. The Ct under the 42 d cold storage conditions was 22.2, 23.2 and 21.3 d for ‘Acco, ‘Herskawitz’ and ‘Wonderful’, respectively. Table 5 also provides the time to lose an extra moisture loss of 5% after pomegranates were taken out of the 42 d cold storage conditions and placed under shelf conditions. Under the immediate prolonged shelf storage conditions, ‘Acco, ‘Herskawitz’ and ‘Wonderful’ have a Ct of 3.3, 2.9 and 3.6 d, respectively (Table 5). Clearly, shelf conditions exacerbated the moisture loss of the pomegranates. On the other hand, waxing, liner packaging and shrink wrapping greatly reduced the rate of moisture loss and increased the time to reach the critical condition Ct to 52.9, 98.0 and 251.6 d, respectively, for ‘Wonderful’ (Table 6).| Storage conditions | VPD (kPa) | Cultivar | Moisture loss model | R 2 | C t (d) |
|---|---|---|---|---|---|
| a VPD is the vapour pressure deficit, MLR (mg kg−1) is the moisture loss ratio, t (s) is the storage duration, R2 is the coefficient of determination, and Ct is the critical time required to achieve a 5% moisture loss. b These values correspond to the time for 5% moisture loss from pomegranates at 42 d (7 °C/90% RH) as the base point. | |||||
| 42 d (7 °C/90% RH) | 0.995 | Acco | MLR = 0.0235t + 4862.5 | 0.9843 | 22.2 |
| Wonderful | MLR = 0.0223t + 5383.8 | 0.9868 | 23.2 | ||
| Herskawitz | MLR = 0.025t + 4060.7 | 0.9882 | 21.3 | ||
| 8 d (23 °C/58% RH) after 42 d (7 °C/90% RH)b | 1.176 after 0.995 | Acco | MLR = 0.1098t + 7473.1 | 0.9562 | 4.5 |
| Wonderful | MLR = 0.1225t + 6178.9 | 0.9787 | 4.1 | ||
| Herskawitz | MLR = 0.1437t + 6178.3 | 0.9808 | 3.5 | ||
| 16 d (23 °C/58% RH) | 1.176 | Acco | MLR = 0.1402t + 10![[thin space (1/6-em)]](https://www.rsc.org/images/entities/char_2009.gif) 008 008 |
0.9896 | 3.3 |
| Wonderful | MLR = 0.1471t + 13![[thin space (1/6-em)]](https://www.rsc.org/images/entities/char_2009.gif) 019 019 |
0.9812 | 2.9 | ||
| Herskawitz | MLR = 0.1726t − 3063.5 | 0.9983 | 3.6 | ||
| Storage conditions | VPD (kPa) | Treatment | Moisture loss model | R 2 | C t (d) |
|---|---|---|---|---|---|
| a VPD is the vapour pressure deficit, MLR (mg kg−1) is the moisture loss ratio, t (s) is the storage duration, R2 is the coefficient of determination, and Ct is the critical time required to achieve a 5% moisture loss. b These values correspond to the time for 5% moisture loss using fruit weight at 42 d (7 °C/90% RH) as the base point. | |||||
| 42 d (7 °C/90% RH) | 0.995 | Un-treated | MLR = 0.0209t + 2830 | 0.9951 | 26.1 |
| Waxed | MLR = 0.0109t − 172.65 | 0.9997 | 52.9 | ||
| Liner packaged | MLR = 0.0059t − 31.816 | 1.000 | 98.0 | ||
| Shrink wrapped | MLR = 0.0023t + 0.5836 | 1.000 | 251.6 | ||
| 8 d (23 °C/58% RH) after 42 d (7 °C/90% RH)b | 1.176 after 0.995 | Un-treated | MLR = 0.1435t + 3131.2 | 0.9960 | 3.8 |
| Waxed | MLR = 0.0928t + 1104.2 | 0.9982 | 6.1 | ||
| Liner packaged | MLR = 0.0977t + 982.1 | 0.9991 | 5.8 | ||
| Shrink wrapped | MLR = 0.0977t + 983.9 | 0.9991 | 5.8 | ||
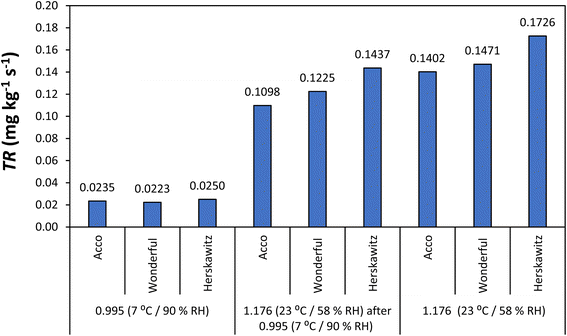
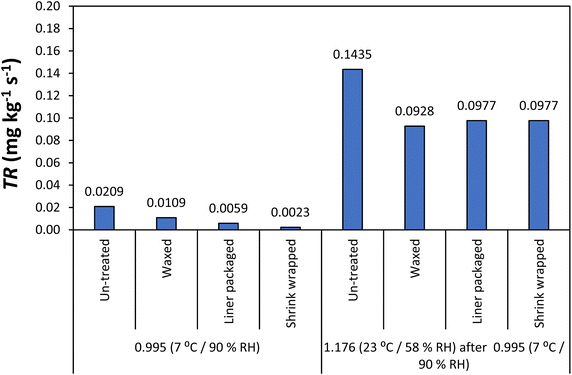
Fig. 7 and 8 show results on TR for the three fruit cultivars and moisture loss control treatments, respectively. TR was quite similar among the three cultivars: 0.0235, 0.0223 and 0.0250 mg kg−1 s−1 for ‘Acco, ‘Herskawitz’ and ‘Wonderful’, respectively, at a VPD of 0.995 kPa during cold storage (Fig. 7). Increasing VPD to 1.176 kPa increased TR to 0.1098, 1.225 and 1.437 mg kg−1 s−1, respectively. Thus, TR was relatively higher for ‘Herskawitz’ followed by ‘Wonderful’ and least in ‘Acco’ as experienced during the additional 8 d of shelf storage. Similar results were observed during the prolonged 16 d shelf storage. TR ranged between 1.402 and 0.1726 mg kg−1 s−1, during the prolonged shelf storage at VPD 1.726 kPa. Waxing, liner packaging and shrink wrapping minimised the TR from 0.0209 mg kg−1 s−1 for the untreated to 0.0109, 0.0059 and 0.0023 mg kg−1 s−1, respectively, at VPD 0.995 kPa. At VPD of 1.176 kPa, waxing, liner packaging and shrink wrapping minimised the TR from 0.1435 mg kg−1 s−1 to 0.0928, 0.0927 and 0.0927 mg kg−1 s−1, respectively (Fig. 8).
Conclusions
The study aimed to characterise the moisture loss susceptibility of pomegranate fruit cultivars (‘Acco’, ‘Wonderful’ and ‘Herskawitz’) based on the fundamental physical and physio-chemical attributes under cold shipping conditions and open shelf market conditions. Furthermore, moisture loss control strategies using liner packaging, shrink wrapping and surface waxing were investigated. Generally, ‘Herskawitz’ and ‘Wonderful’ are characterised by a relatively higher moisture loss than ‘Acco’ during prolonged storage. The study revealed that moisture loss in pomegranate fruit is primarily and mainly from the peel proportion. All moisture loss control treatments using liner packaging, shrink wrapping and surface waxing minimised moisture loss by 3.7, 9.6 and 1.9 times that of the un-treated (7.7%) fruit after 42 days of cold storage. In addition, the moisture-loss-control treatments prolonged the time to reach the critical moisture loss (5%) by more than 26.8, 71.9 and 225.5 d compared to the untreated ‘Wonderful’ fruit, respectively. Though surface waxing alone was not sufficient to minimise fruit moisture loss compared to microperforated plastic liners and shrink wrapping, it is a potential sustainable and environmentally friendly moisture loss control technique that can profit the pomegranate industry. The findings of this study on the dynamics of moisture loss in pomegranate fruit under different storage conditions are very relevant in aiding strategic planning for more efficient and sustainable moisture loss control technologies, including biodegradable packaging films, surface wax application, modelling and design studies, and plant breeding operations.Author contributions
Lufu R carried out the experiment and wrote the manuscript. Opara UL and Ambaw A conceptualised and designed the research study and edited the manuscript.Conflicts of interest
The authors declare no competing interests.Acknowledgements
This work is based on the research supported wholly/in part by the National Research Foundation of South Africa (Grant Numbers: 64813). The opinions, findings and conclusions or recommendations expressed are those of the author(s) alone, and the NRF accepts no liability whatsoever in this regard. We acknowledge bursary support by Agri-Edge Ltd funded by the Department of Trade and Industry (DTI) through the Technology and Human Resources for Industry Programme (THRIP). Research reported in this publication was supported in part by the Foundation for Food and Agriculture Research under award number – Grant ID: DFs-18-0000000008.Notes and references
- R. Chandra, D. K. Babu, V. T. Jadhav and J. A. Teixeira da Silva, Fruit, Veg. Cereal Sci. Biotech., 2010, 4, 1–6 Search PubMed.
- I. A. T. M. Meerts, C. M. Verspeek-Rip, C. A. F. Buskens, H. G. Keizer, J. Bassaganya-Riera, Z. E. Jouni, A. H. B. M. van Huygevoort, F. M. van Otterdijk and E. J. van de Waart, Food Chem. Toxicol., 2009, 47, 1085–1092 CrossRef CAS PubMed.
- M. Erkan and A. Dogan, in Exotic Fruits, Academic Press, 2018, pp. 355–361 Search PubMed.
- A. H. Rahmani, M. A. Alsahli and S. A. Almatroodi, Pharmacogn. J., 2017, 9, 689–695 CrossRef CAS.
- O. A. Fawole, U. L. Opara and K. I. Theron, Food Bioprocess Technol., 2012, 5, 2934–2940 CrossRef CAS.
- N. P. Seeram, R. N. Schulman and D. Heber, Pomegranates Ancient Roots to Modern Medicine, CRC/Taylor & Francis, Boca Raton, 2006 Search PubMed.
- CBI, Exporting Fresh Pomegranates to Europe, https://www.cbi.eu/market-information/fresh-fruit-vegetables/pomegranates/europe/, accessed 8 June 2019 Search PubMed.
- R. Lufu, A. Ambaw and U. L. Opara, Foods, 2021, 10, 1388 CrossRef CAS PubMed.
- T. G. Kawhena, U. L. Opara and O. A. Fawole, Processes, 2022, 10, 164 CrossRef CAS.
- K. Barman, R. Asrey and R. K. Pal, Sci. Hortic., 2011, 130, 795–800 CrossRef CAS.
- K. M. Maguire, N. H. Banks and U. L. Opara, in Horticultural Reviews, John Wiley & Sons, Inc., Oxford, UK, 2010, pp. 197–234 Search PubMed.
- O. A. Fawole and U. L. Opara, Ind. Crops Prod., 2013, 47, 300–309 CrossRef CAS.
- R. Lufu, A. Ambaw and U. L. Opara, Postharvest Biol. Technol., 2021, 178, 111539 CrossRef CAS.
- R. Lufu, A. Ambaw and U. L. Opara, Sci. Hortic., 2020, 272, 109519 CrossRef.
- E. Arendse, O. A. Fawole and U. L. Opara, CyTA--J. Food, 2014, 12, 389–398 CrossRef CAS.
- R. Lufu, T. M. Berry, A. Ambaw and U. L. Opara, Acta Hortic., 2018, 1201, 259–263 CrossRef.
- R. R. Mphahlele, O. A. Fawole and U. L. Opara, Sci. Hortic., 2016, 211, 140–151 CrossRef CAS.
- A. A. Kader, A. Chordas and S. Elyatem, Calif. Agric., 1984, 14–15 Search PubMed.
- S. Pareek, D. Valero and M. Serrano, J. Sci. Food Agric., 2015, 95, 2360–2379 CrossRef CAS PubMed.
- F. Artés, R. Villaescusa and A. J. Tudela, J. Food Sci., 2000, 65, 1112–1116 CrossRef.
- P. B. Pathare, U. L. Opara and F. A.-J. Al-Said, Food Bioprocess Technol., 2013, 6, 36–60 CrossRef CAS.
- R. Lufu, A. Ambaw and U. L. Opara, Postharvest Biol. Technol., 2019, 157, 110982 CrossRef.
- Z. A. Belay, O. J. Caleb, P. V. Mahajan and U. L. Opara, Food Bioprocess Technol., 2018, 11, 1478–1494 CrossRef CAS.
- K. Banda, O. J. Caleb, K. Jacobs and U. L. Opara, Postharvest Biol. Technol., 2015, 109, 97–105 CrossRef.
- S. Nanda, D. V. Sudhakar Rao and S. Krishnamurthy, Postharvest Biol. Technol., 2001, 22, 61–69 CrossRef.
- S. D'Aquino, A. Palma, M. Schirra, A. Continella, E. Tribulato and S. La Malfa, Postharvest Biol. Technol., 2010, 55, 121–128 CrossRef.
- R. Lufu, A. Ambaw, T. M. Berry and U. L. Opara, Food Packag. Shelf Life, 2020, 26, 100585 CrossRef.
- H. Meighani, M. Ghasemnezhad and D. Bakhshi, J. Food Sci. Technol., 2014, 52, 4507–4514 CrossRef PubMed.
- D. V. S. Rao, J. Food Sci. Technol., 2018, 55, 351–365 CrossRef PubMed.
- O. J. Caleb, P. V. Mahajan, U. L. Opara and C. R. Witthuhn, Postharvest Biol. Technol., 2012, 64, 49–54 CrossRef.
- F. A. Al-Said, L. U. Opara and R. A. Al-Yahyai, J. Food Eng., 2009, 90, 129–134 CrossRef.
- V. Dhineshkumar, D. Ramasamy and K. Sudha, Int. J. Farm Sci., 2015, 5, 89–97 Search PubMed.
- I. K. Opara, O. A. Fawole, C. Kelly and U. L. Opara, Sustainability, 2021, 13, 5168 CrossRef CAS.
- M. A. Al-mughrabi, M. A. Bacha and A. O. Abdelrahman, J. King Saud Univ., Sci., 1995, 7, 239–248 Search PubMed.
- G. T. Xanthopoulos, C. G. Templalexis, N. P. Aleiferis and D. I. Lentzou, Biosyst. Eng., 2017, 158, 76–85 CrossRef.
- J. Atukuri, O. A. Fawole and U. L. Opara, J. Food Meas. Charact., 2017, 11, 1081–1093 CrossRef.
- J. J. Martínez, F. Hernández, H. Abdelmajid, P. Legua, R. Martínez, A. El Amine and P. Melgarejo, Sci. Hortic., 2012, 140, 100–106 CrossRef.
- O. A. Fawole and U. L. Opara, Sci. Hortic., 2013, 150, 37–46 CrossRef CAS.
- E. Arendse, O. A. Fawole, L. S. Magwaza and U. L. Opara, J. Food Eng., 2016, 186, 42–49 CrossRef.
- S. M. Elyatem and A. A. Kader, Sci. Hortic., 1984, 24, 287–298 CrossRef.
- U. L. Opara and M. R. Al-Ani, Br. Food J., 2010, 112, 797–810 CrossRef.
- K. S. Tandon, E. a Baldwin, J. W. Scott and R. L. Shewfelt, J. Food Sci., 2003, 68, 2366–2371 CrossRef CAS.
- M. Mukama, A. Ambaw, T. M. Berry and U. L. Opara, J. Food Eng., 2019, 245, 166–173 CrossRef.
- D. Valero and M. Serrano, Postharvest Biology and Technology for Preserving Fruit Quality, CRC Press, Boca Raton, USA, 1st edn, 2010 Search PubMed.
- H. M. Díaz-Mula, P. J. Zapata, F. Guillén, D. Martínez-Romero, S. Castillo, M. Serrano and D. Valero, Postharvest Biol. Technol., 2009, 51, 354–363 CrossRef.
- S. Usanmaz, İ. Kahramanoğlu and N. Yılmaz, Am. J. Agric. For., 2014, 2, 61–65 Search PubMed.
- N. Selcuk and M. Erkan, Postharvest Biol. Technol., 2014, 92, 29–36 CrossRef CAS.
- N. Selcuk and M. Erkan, Postharvest Biol. Technol., 2015, 109, 30–39 CrossRef CAS.
| This journal is © The Royal Society of Chemistry 2023 |

