
 Open Access Article
 This Open Access Article is licensed under a Creative Commons Attribution-Non Commercial 3.0 Unported Licence
Phase shuttling-enhanced electrochemical ozone production†
Jia
Liu‡
a,
Shibin
Wang‡
a,
Zhangnv
Yang‡
e,
Chencheng
Dai‡
b,
Ge
Feng
a,
Beibei
Wu
e,
Wenwen
Li
a,
Lu
Shu
a,
Kamal
Elouarzaki
bcd,
Xiao
Hu
 bd,
Xiaonian
Li
a,
Hui
Wang
f,
Zhen
Wang
*e,
Xing
Zhong
*a,
Zhichuan J.
Xu
*bc and
Jianguo
Wang
*a
bd,
Xiaonian
Li
a,
Hui
Wang
f,
Zhen
Wang
*e,
Xing
Zhong
*a,
Zhichuan J.
Xu
*bc and
Jianguo
Wang
*a
aInstitute of Industrial Catalysis, State Key Laboratory Breeding Base of Green-Chemical Synthesis Technology, College of Chemical Engineering, Zhejiang University of Technology, Hangzhou, 310032, P. R. China. E-mail: zhongx@zjut.edu.cn; jgw@zjut.edu.cn
bSchool of Materials Science and Engineering, Nanyang Technological University, 50 Nanyang Avenue, Singapore 639798, Singapore. E-mail: xuzc@ntu.edu.sg
cCenter for Advanced Catalysis Science and Technology, Nanyang Technological University, 50 Nanyang Avenue, Singapore 639798, Singapore
dNanyang Environment and Water Research Institute (NEWRI), Nanyang Technological University, 1 Cleantech Loop, CleanTech One, 637141, Singapore
eKey Lab of Vaccine, Prevention and Control of Infectious Disease of Zhejiang Province, Zhejiang Provincial Center for Disease Control and Prevention, Hangzhou 310015, China. E-mail: wangzhen@cdc.zj.cn
fWomen's Hospital, School of Medicine, Zhejiang University, Hangzhou, Zhejiang, China
First published on 13th March 2023
Abstract
Ozone can be produced by the electrochemical oxidation of water, which provides a technical solution to on-demand ozone production for disinfection and sterilization. Lead oxides have been found to be unique in catalyzing such a process. However, the fundamental understanding of these catalysts’ mechanisms remains limited, hindering the development of high-performance catalysts for electrochemical ozone production (EOP). Herein, the effect of phase shuttling on the reactivity of Pb3O4 was systematically investigated during the EOP process by in situ/ex situ characterizations. It was found that Pb3O4 undergoes a phase shuttle towards β-PbO2via the lattice oxygen oxidation mechanism (LOM) pathway, and the reconstructed β-PbO2 shows enhanced EOP activity and stability compared to commercial β-PbO2. The ex situ characterization of materials combined with theoretical calculations reveals that the performance enhancement is mainly attributed to the stable presence of (101) and (110) surfaces in the reconstructed β-PbO2 with undercoordinated Pb–O. Pourbaix diagrams of lead oxides calculated by DFT demonstrate that the phase shuttling to β-PbO2 is thermodynamically favorable under EOP conditions. Surface Pourbaix diagrams of β-PbO2(101) and Pb3O4(110) further reveal the adsorption behavior of O*/OH* intermediates and explain the observed change of EOP kinetics at ∼1.6 V vs. RHE. The catalyst is integrated and assembled in a membrane electrode assembly (MEA) electrolyzer, and the produced ozonated water successfully inactivated severe acute respiratory syndrome coronavirus 2 (SARS-CoV-2). This work provides a new insight into EOP catalysts and demonstrates the possibilities of further optimization of electrochemical approaches for on-demand ozone generation.
Broader contextElectrification is one of the key trends shaping the current global energy transition in the context of climate change. Due to recent geopolitical developments, favorable economics, and the urgent demand for decarbonization, this trend is accelerating steadily. Alongside climate targets, the COVID-19 pandemic has demanded more radical change but also new opportunities with a sense of urgency. One of the immediate impacts has been elevating emphasis on sanitizing and disinfecting chemicals. Surging demand for these products requires developing advanced, climate-neutral technologies to support this sector's growth. Here, we report a breakthrough in fundamental and applied research for electrochemical ozone production (EOP). Ozone is the most effective, safe, and cost-effective solution for disinfection and sanitization that breaks down into benign components. EOP is a promising way to produce it in a sustainable manner. To date, achieving long-term operation of EOP at industrial current density in ultrapure water remains one of the biggest challenges. In this paper, we report that using a pre-catalyst can significantly promote the EOP performance. We found that the pre-catalyst Pb3O4 undergoes phase shuttling to β-PbO2 during the EOP process. The reconstructed β-PbO2 exhibited improved EOP activity and stability compared to commercial β-PbO2. This work provides fundamental insights into the lead oxides under EOP conditions and paves a new way to design high-performance EOP catalysts for potential industrial applications. |
Introduction
Electrification is one of the key trends shaping the current global energy transition in the context of climate change. Due to recent geopolitical developments, favorable economics, and the urgent demand for decarbonization, this trend is accelerating steadily. Alongside climate targets, the pandemic has demanded more radical change but also new opportunities with a sense of urgency. One of the immediate impacts has been elevating emphasis on sanitizing and disinfecting chemicals. Surging demand for these products requires developing advanced, climate-neutral technologies to support this sector's growth. New green technologies could emerge, considering breakthroughs in fundamental and applied research in electrochemistry.In this context, ozone has proven to be one of the most effective, safe, and cost-effective solutions for disinfection and sanitization that breaks down into benign components.1 Its main applications range from water purification to industrial exhaust treatment, public health management, food processing, aquaculture disinfection, and value-added compound production (Scheme 1a). Compared with the standard ozone production methods (ultraviolet excitation and electric discharge (corona)) (Scheme 1b), electrochemical ozone production (EOP) from water electrolysis is promising in both high-end applications of ozonation2,3 and advanced oxidation processes (AOPs).4 Furthermore, considering the instability of ozone, EOP is highly suitable for decentralized, on-demand, and on-site ozone generation, thereby eliminating transportation and safety risks as well as storage costs (Scheme 1c).
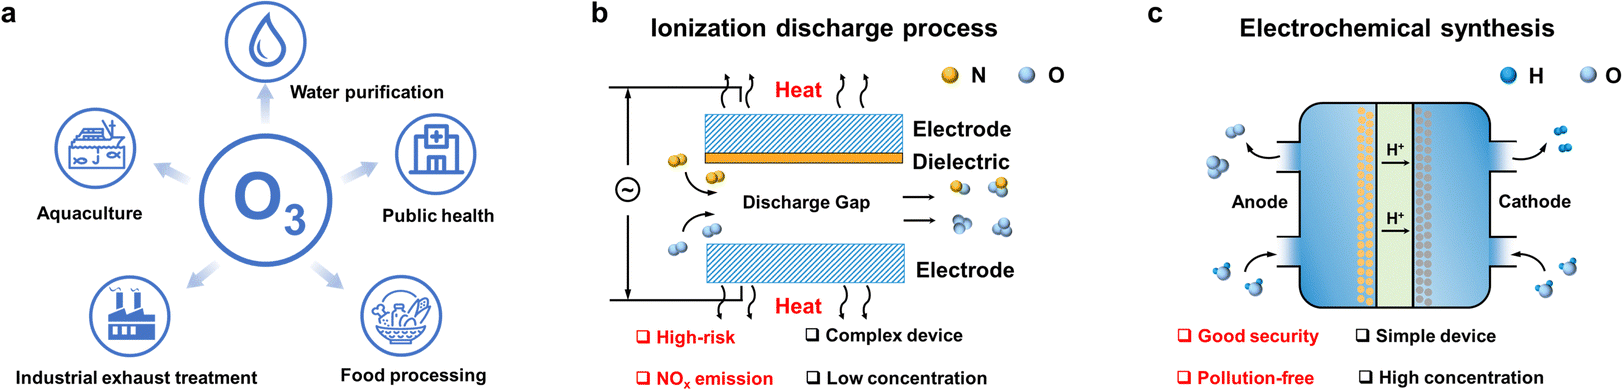 | ||
| Scheme 1 Applications and preparation methods of ozone. (a) Applications of ozone in various industries. (b) Ozone preparation through the ionization discharge process. (c) Ozone preparation by the electrochemical oxidation of water. | ||
EOP is a six-electron reaction process competing with the oxygen evolution reaction (OER). These two anodic reactions can be expressed in eqn (1) and (2).
| 2H2O → O2 + 4H+ + 4e−, Eθ = 1.23 V vs. RHE | (1) |
| 3H2O → O3 + 6H+ + 6e−, Eθ = 1.51 V vs. RHE | (2) |
Thermodynamically, the EOP takes place at a potential higher than 1.51 V vs. RHE, while the OER starts from 1.23 V vs. RHE, which clearly indicates that the distinguishability between these two reactions is the key challenge.
To date, lead oxides have been found to be unique in catalyzing the EOP in water oxidation, and β-PbO2 has been the state-of-the-art catalyst in commercial devices. However, challenges remain due to the unsatisfactory stability and activity at high current density.5 Although many strategies have been applied to use lead oxides in some works, significant gaps still exist, especially in the underlying mechanisms that are not well understood. The experimental conditions used to perform water oxidation are harsh for the catalysts for both OER and EOP. As a result, most catalysts change their surface chemistry to adapt to the working environment. It has been widely reported that most OER electrocatalysts change their surface phase under the OER process, in which more active surfaces are formed.6 The inherent reason for this change can be attributed to the relatively unstable bulk chemistry and the strong interactions between the surface oxygen-containing adsorbate and the exposed surface. In addition, the structural phase change of the OER catalysts depends on the applied potential,7,8 which electrically drives the surface oxidation/reduction of pre-catalysts to switch to the new surfaces.9,10 Despite many insights revealed for the OER, little has been known regarding the phase and surface stability of EOP catalysts, which is crucial in understanding the active phase and developing efficient EOP catalysts.
Here, we report a systematic study of lead oxides during the EOP process. We proved that using the pre-catalyst Pb3O4 as a catalyst provides a remarkable enhancement of the EOP compared to the commercial β-PbO2. The phase shuttling of Pb3O4 under EOP conditions leads to in situ formation of β-PbO2, which is rich in (101) and (110) surfaces with undercoordinated Pb–O. The Pb3O4-reconstructed β-PbO2 shows better stability than commercial β-PbO2 at the industry-level current density of 1 A cm−2 for more than 900 h. The significance of these findings is strengthened by in situ differential electrochemical mass spectrometry (DEMS) experiments, which also show that Pb3O4 gradually reconstructs to β-PbO2 by exchange of lattice oxygen with water, and the EOP happens through a lattice oxygen-involved mechanism (LOM).
Results and discussion
EOP performance of the catalysts
The electrochemical water oxidation properties of the commercial Pb3O4 and β-PbO2 were first evaluated and compared using linear sweep voltammetry (LSV) tests in a saturated K2SO4 solution (pH = 7.0) at room temperature (Fig. S1, ESI†). The LSV curves in Fig. 1a show that a higher overpotential is required for Pb3O4 to achieve the same current density of 10 mA cm−2 compared to β-PbO2 (2.73 and 2.51 V vs. RHE for Pb3O4 and β-PbO2, respectively). Taking into account the electrochemical active surface area (ESCA) values (shown in Fig. S2 and S3, ESI†), these results suggest the superior overall water oxidation activity of β-PbO2. The electrochemical water oxidation kinetics were further investigated by calculating the Tafel slopes. Fig. 1b compares the Tafel slopes of the Pb3O4 and β-PbO2 electrocatalysts, where two apparent linear segments can be found for both cases. The Tafel slopes of β-PbO2 and Pb3O4 were calculated to be 441 mV dec−1 and 434 mV dec−1, respectively, at the potential region below ca. 1.6 V vs. RHE. At the higher potential range, a similar trend of Tafel slope increase was observed for both electrocatalysts, where the Tafel slopes of β-PbO2 and Pb3O4 are 825 mV dec−1 and 681 mV dec−1, respectively. Similar findings have been reported in EOP-related literature (Table S1, ESI†). The inflection in the Tafel slopes implies a change in the water oxidation kinetics, which could be originated from continual alteration of electrode surfaces and interface structures in different potential regions.11,12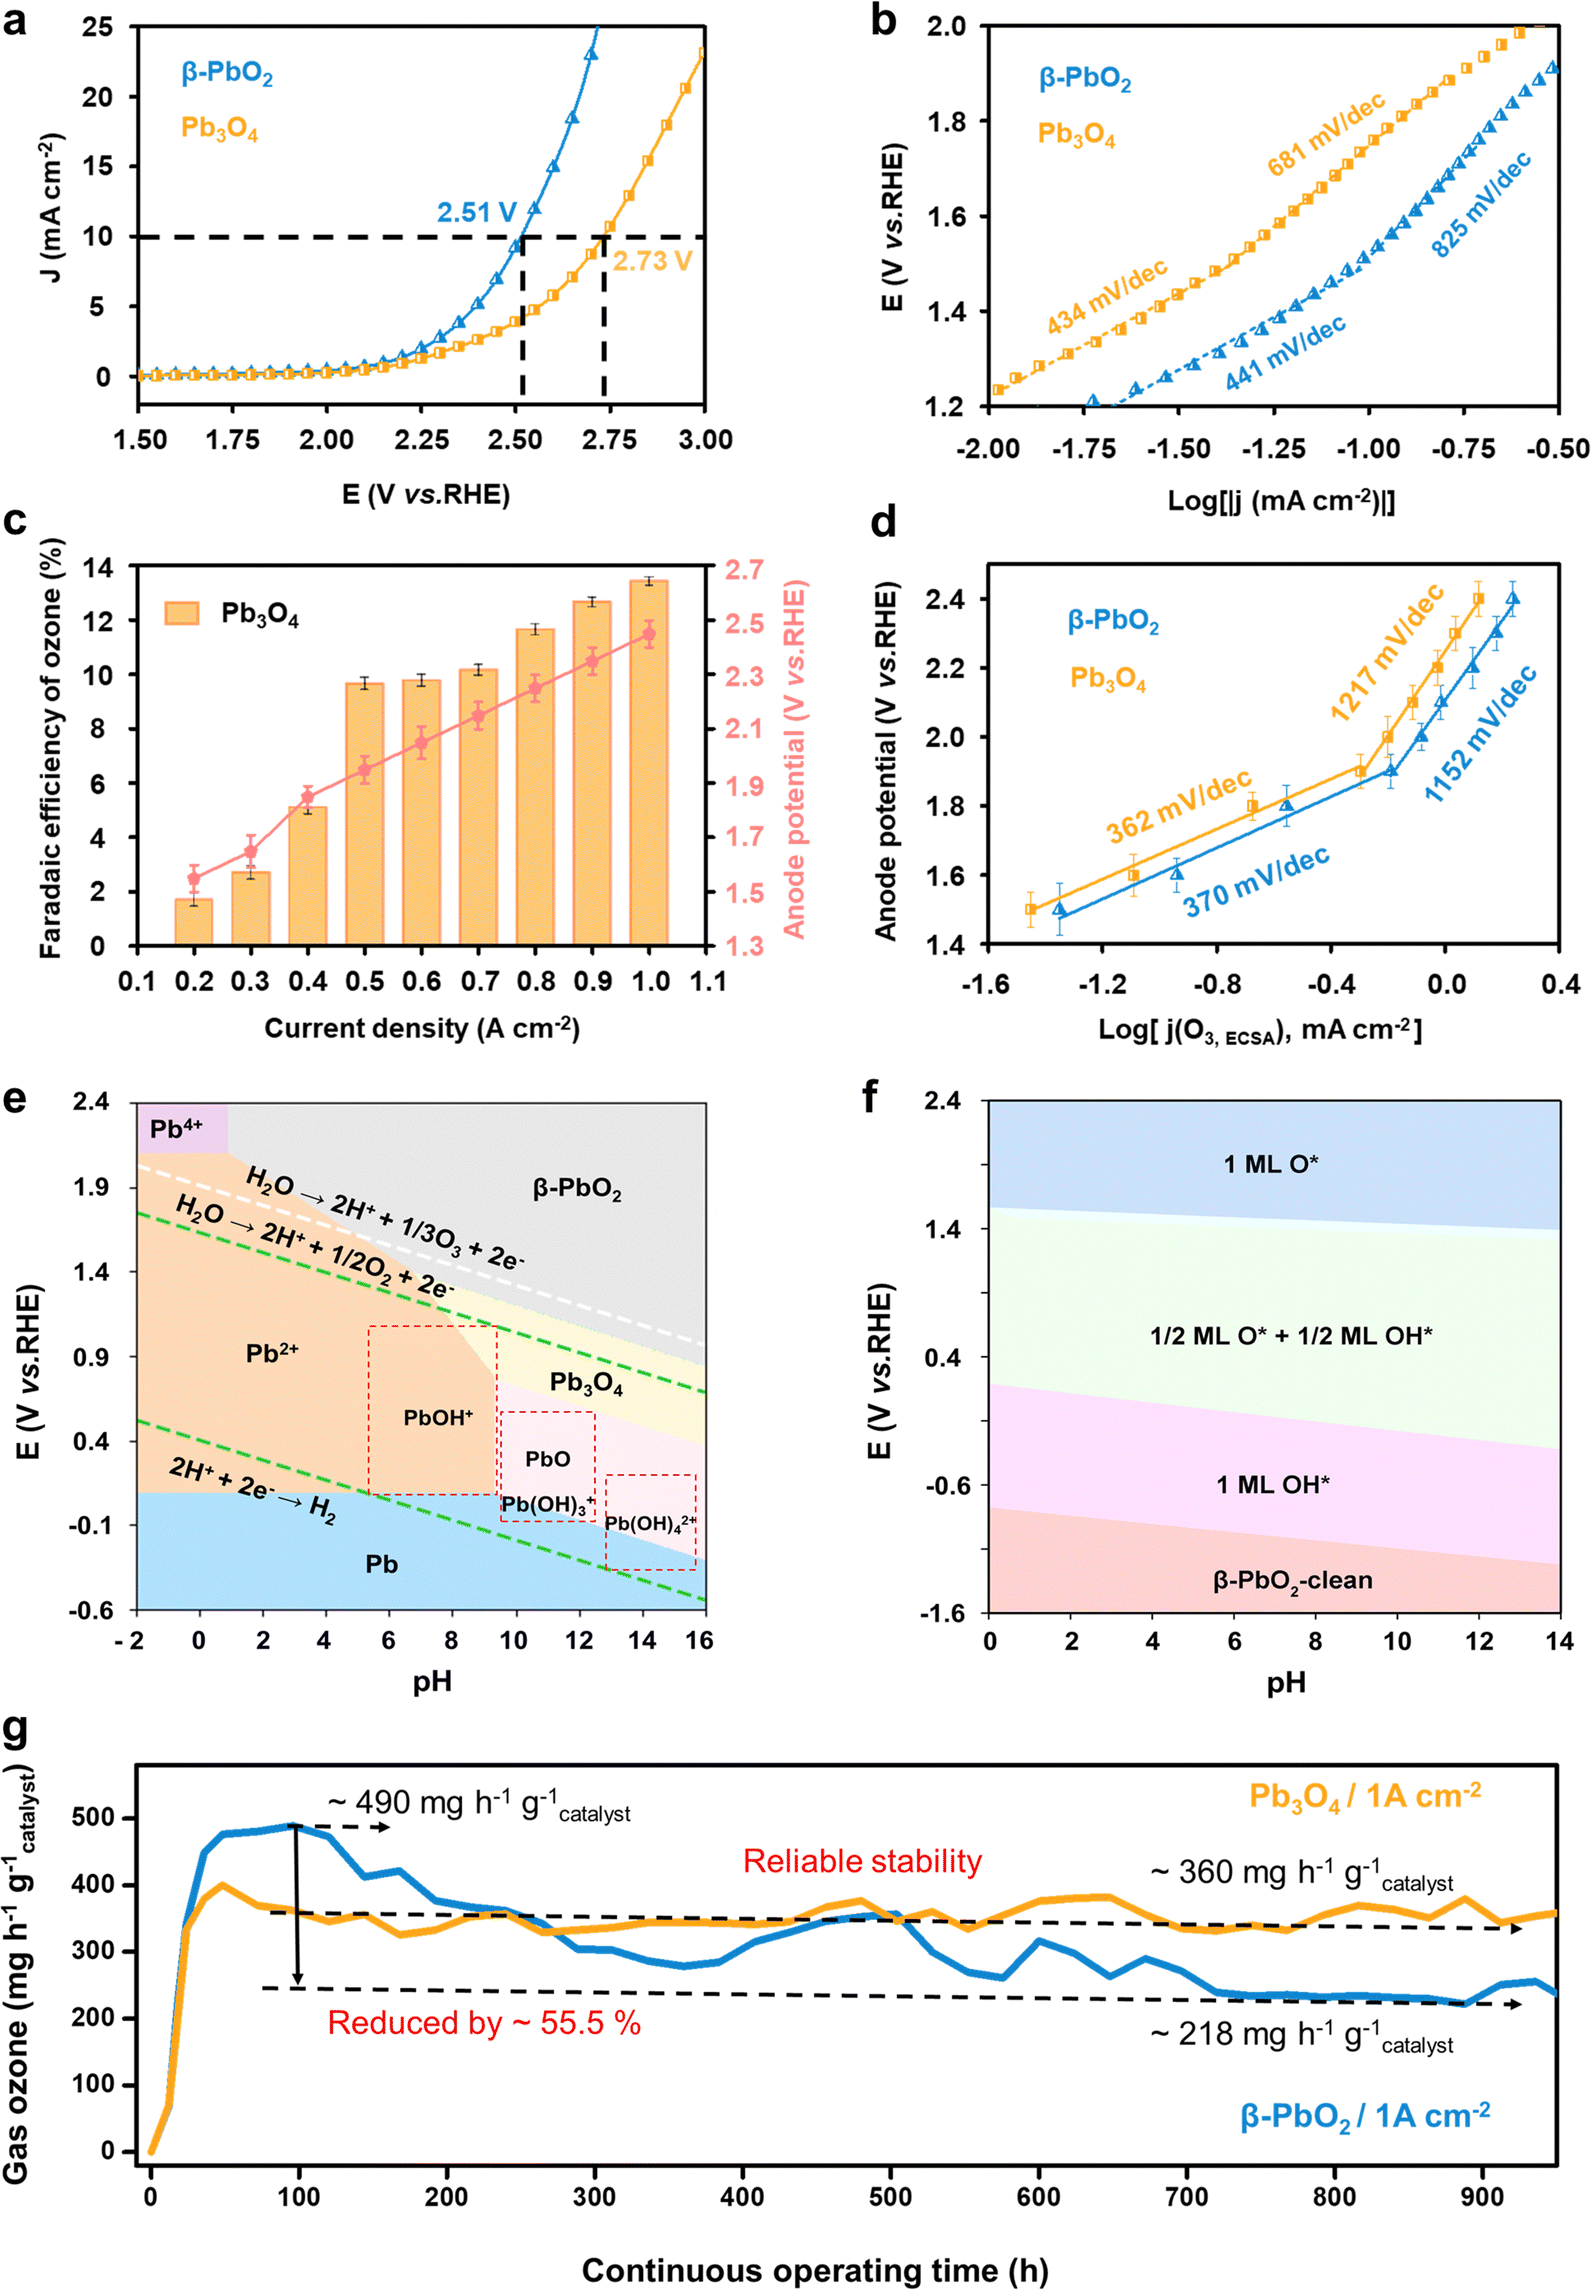 | ||
| Fig. 1 Electrochemical ozone production (EOP) performance of commercial Pb3O4 in the neutral electrolytes. (a and b) The linear sweep voltammetry curves and corresponding Tafel slopes of β-PbO2 and Pb3O4 in saturated K2SO4 solution (pH = 7.0). (c) The faradaic efficiency towards ozone generation for the Pb3O4 at different applied current densities using the EOP MEA electrolyzer. (d) Tafel plot of the partial O3 current densities normalized by electrochemically active surface area of the Pb3O4. (e) Pourbaix diagram of the lead oxide phases at the different electric fields and pH conditions. (f) DFT calculated pH-potential phase diagram of the β-PbO2(101) surface. The phase diagram is constructed for the lead oxide surfaces with total OH*/O* occupation. (g) Comparison of the EOP performances of Pb3O4 and β-PbO2 for more than 900 h at the constant current condition of 1 A cm−2 (ultrapure water is used in the EOP MEA electrolyzer as the electrolyte (c–e)). | ||
The EOP performance of the Pb3O4 electrocatalyst was then evaluated by incorporating and assembling the catalyst into a membrane electrode-assembly (MEA) based EOP electrolyzer (Fig. S4, ESI†). The MEA consists of a Nafion 117 membrane coated with Pb3O4 and 20% Pt/C on each side as the anode and cathode catalysts, respectively. Fig. 1c and Fig. S5, S6 (ESI†) show the Faraday efficiencies (FE) and yield rate towards ozone production using Pb3O4 as a catalyst at various current densities. From Fig. S5 (ESI†), it is apparent that an increase in the current density increases the FE(O3) of the Pb3O4 electrocatalyst and reaches a maximum value of 13.4% at 1.0 A cm−2, where the responsive potential is ∼2.6 V vs. RHE. However, the FE(O3) slightly drops with further current density increment. A similar trend can also be observed for β-PbO2 (Fig. S7 and S8, ESI†), where the maximum FE(O3) of 16.4% is also obtained at the current density of 1.0 A cm−2. Additionally, when the current density was lower than 0.5 A cm−2, the FE(O3) rises rapidly with the current density increment for both cases, where the anode potential corresponded to ∼1.5–1.9 V vs. RHE. Moreover, the corresponding Tafel plot obtained from the FE(O3) and the LSV current densities (Fig. 1d) exhibits an inflection at ∼1.9 V vs. RHE, where the Tafel slope value increases from 367 to 1065 mV dec−1. These results indicate that the EOP process's kinetics becomes slower when the current density reaches 0.5 mA cm−2. Similarly, the Tafel plot of OER current density also shows a slope increment, but at 1.6 V vs. RHE, the same as the overall water oxidation reaction mentioned above (Fig. S9, ESI†).
To further investigate the mechanisms responsible for the kinetic change, the Pourbaix diagram of lead oxide phases and the pH-potential phase diagram of lead oxide surfaces are calculated. Fig. 1e shows that the PbO2 phase exhibits higher stability under potential higher than 1.5 V vs. RHE in pH 7 electrolyte. These results suggest that the Pb3O4 surface is thermodynamically favored to be reconstructed to PbO2 under the tested potential range, which explains the similarity of the Tafel plots obtained for the Pb3O4 and PbO2 catalysts. Meanwhile, Fig. 1f suggests that the process 1/2 ML O*/OH* phase is transferred to 1ML O* at the potential of ∼1.6 V vs. RHE at pH 7, which is very close to the potential of the Tafel plot inflection points for overall water oxidation and OER. This observation indicates that the 1/2 ML O*/OH* surface adsorbates are kinetically more favorable for the OER than 1ML O*. Moreover, the EOP starts with the transformation into 1ML O*, implying the important role of 1ML O* surface adsorbates in facilitating EOP and hindering the OER.
On the basis of this analysis, the long-term operation of Pb3O4 in the EOP electrolyzer was evaluated at high current densities in ultrapure water instead of K2SO4 electrolyte to investigate the feasibility of potential industrial applications (Fig. 1g) and to avoid serious corrosion problems.7 Impressively, the Pb3O4 anode-based electrolyzer could stably drive EOP at a high current density of 1 A cm−2 for more than 900 hours of continuous operation. Our strategy substantially outperforms other reported EOP electrocatalysts in current density, product generation rate, and reported operation time while maintaining high faradaic efficiency (Fig. S10 and Table S2, ESI†). Furthermore, during the entire test, the corresponding anode potential is stabilized in the range of 2.40 to 2.45 V vs. RHE, and FE was maintained at 12.0%. For the sake of comparison, the β-PbO2 anode exhibits reduced activity during the over-900 hour-test under similar conditions (Fig. 1e and Fig. S11, ESI†). In detail, the optimal EOP activity by β-PbO2 is reached with an ozone yield rate of ∼490 mg h−1 g−1catalyst and a corresponding FE of 16.4% after 100 h of EOP operation. After that, the ozone production rate of β-PbO2 drops to ∼218 mg h−1 g−1catalyst after operating over 900 h, while the FE falls to 7.5%. Although β-PbO2 exhibits higher EOP activity at the initial stage, these results suggest lower overall stability of β-PbO2 compared to Pb3O4. Therefore, the inherent reason for the excellent stability of Pb3O4 during the long-term EOP process was further analyzed.
Structural changes during EOP
Extensive characterization techniques were employed to study the change in the catalyst's structure during the EOP process, aiming to elucidate activity and stability enhancement mechanisms. To confirm the structural changes of Pb3O4 and β-PbO2 during the EOP process, the microstructure of the electrocatalyst was monitored at different activation times. It is interesting to note that after 100 h of continuous operation at 1 A cm−2 (∼2.4–2.45 V vs. RHE), the EOP electrocatalyst turns dark brown, indicating possible structural changes of Pb3O4 during the EOP process (Fig. S12 and S13, ESI†). Furthermore, ex situ HRTEM was employed to clarify the time-dependent structure transformation with respect to reaction time (Fig. 2a and Fig. S14, ESI†). As shown in Fig. S15 (ESI†), a newly formed species with a lattice distance of 0.35 nm was detected after 15 h EOP reactions, corresponding to the (110) plane of β-PbO2 (PDF#41-1492. Moreover, the exposed interplanar spacings of 0.185 and 0.279 can be assigned to the (211) and (101) surfaces of β-PbO2 after a 50 h EOP process,13,14 indicating that the structural reconstruction of Pb3O4 to β-PbO2 was essentially completed after 50 h of EOP operation. Furthermore, Fig. S16 and S17 (ESI†) show the decrease in the Pb3O4 particle size, reflecting the transformation that occurred during the EOP process. In contrast, no phase or morphological change was observed for β-PbO2 (Fig. 2b and Fig. S18, ESI†). These observations agree well with the Pourbaix diagram calculated previously, which reveals that the β-PbO2 is more thermodynamically stable under the EOP operating conditions.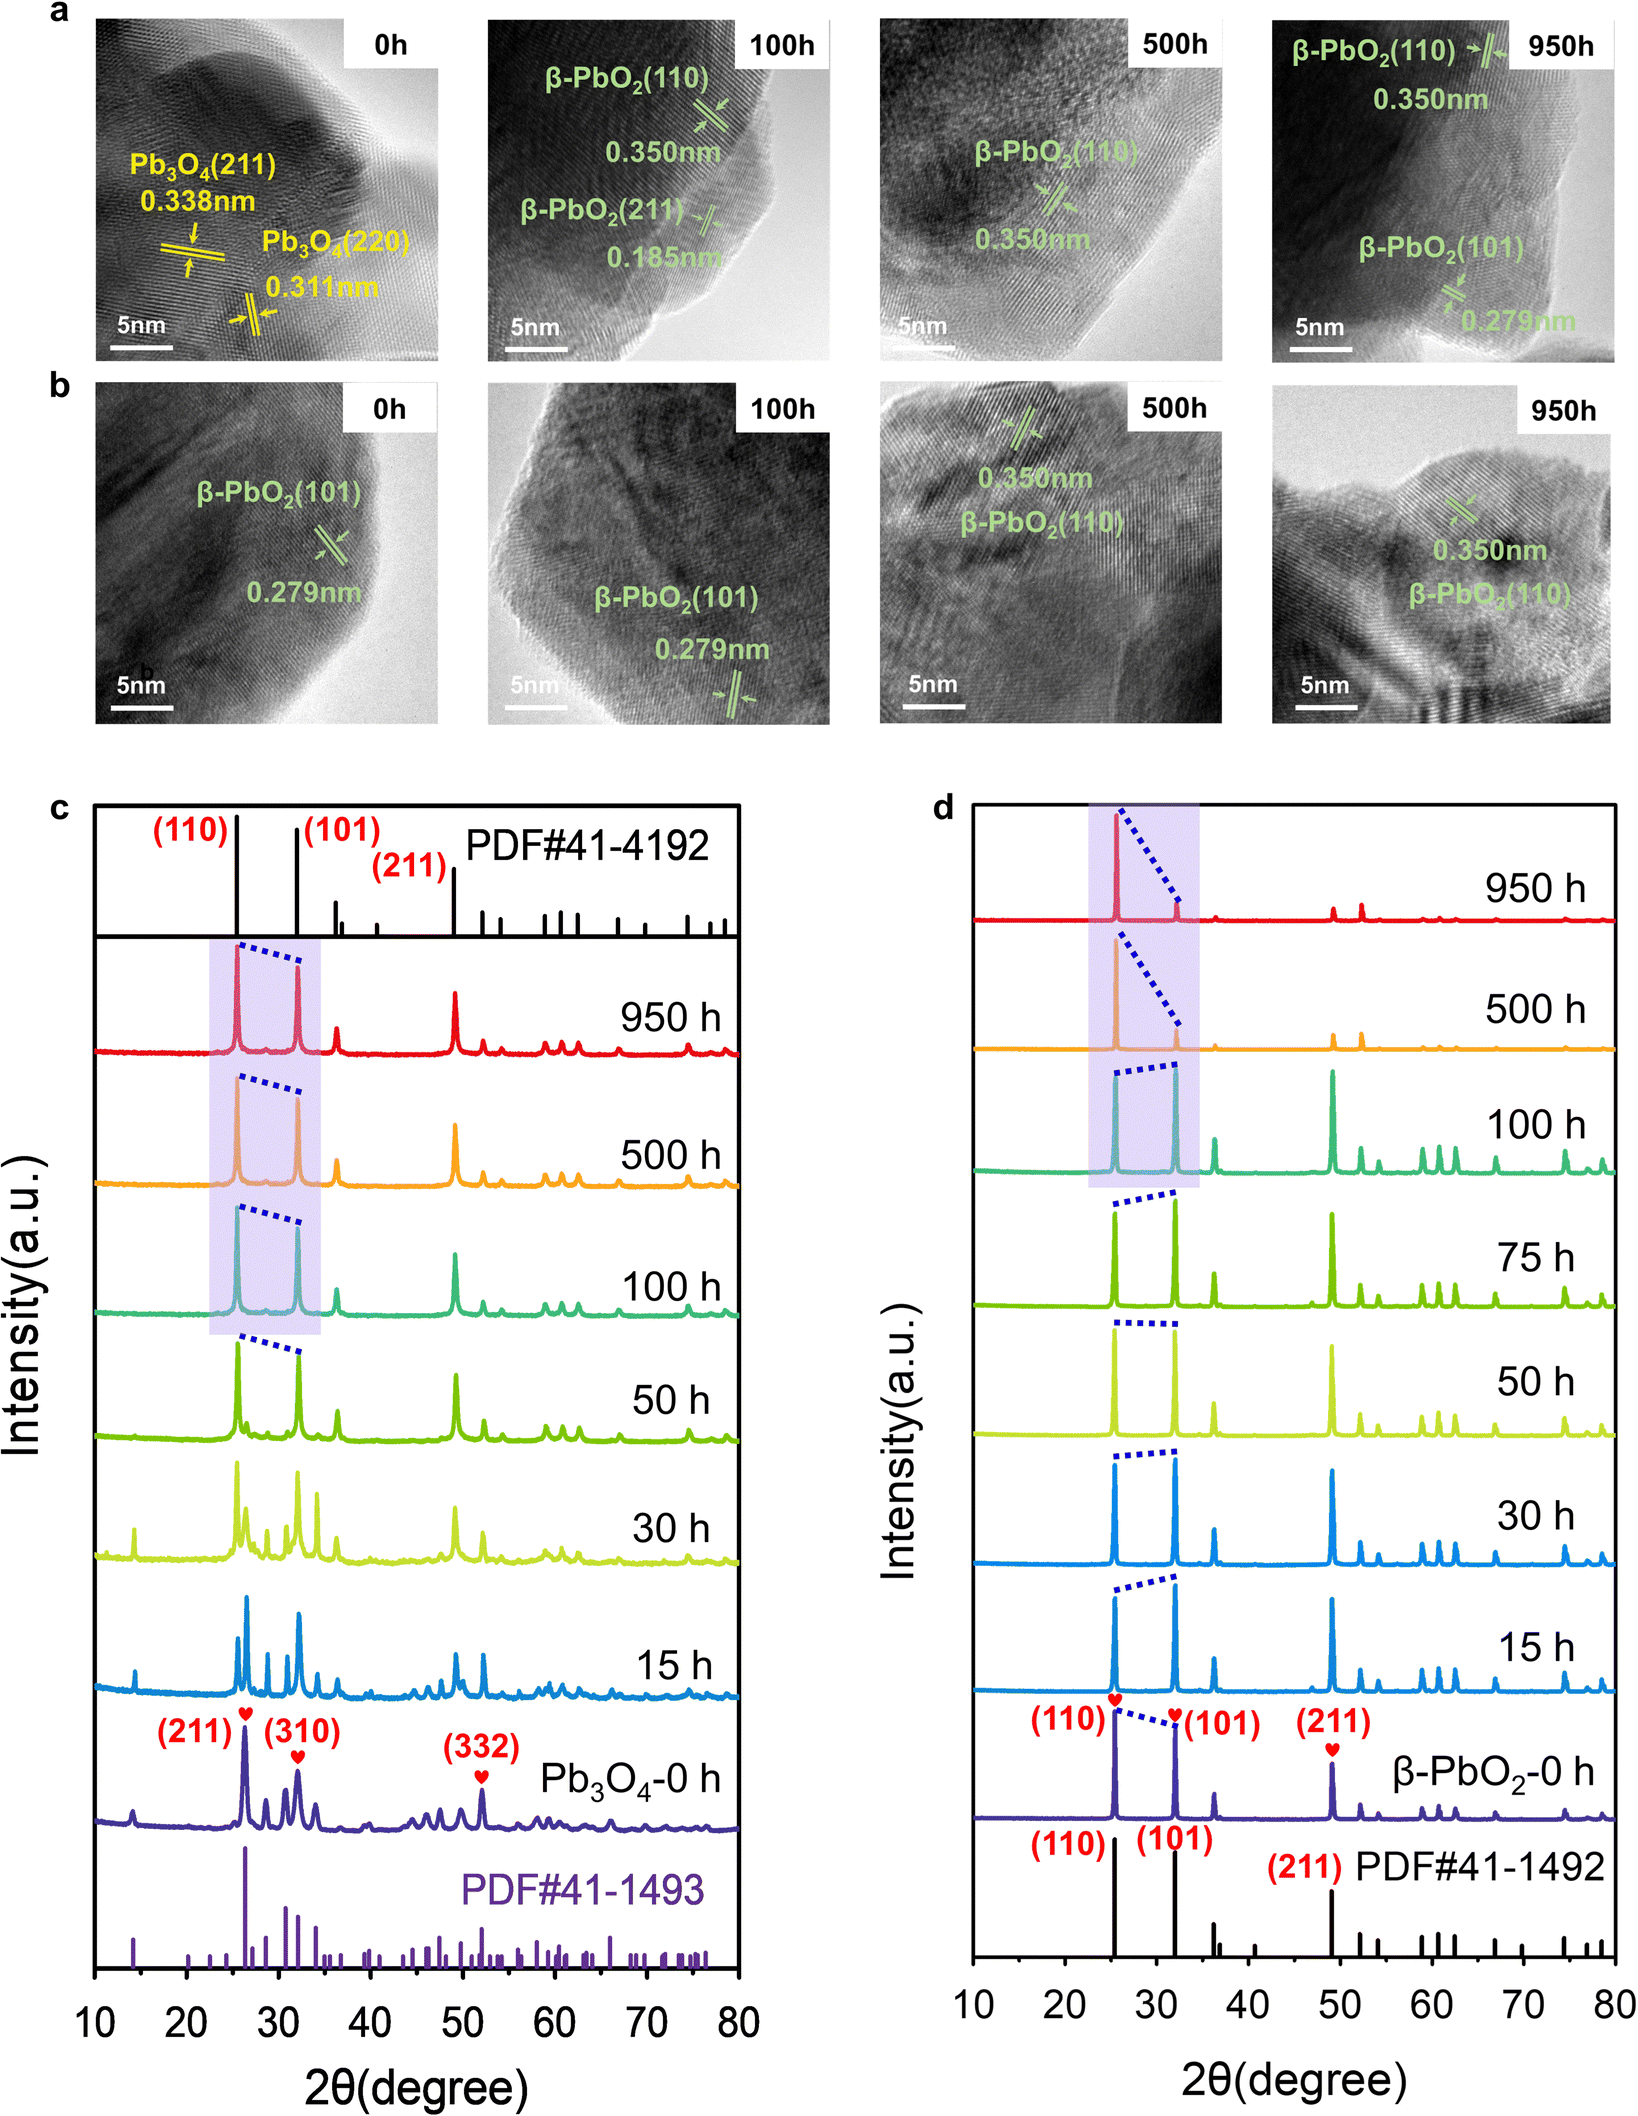 | ||
| Fig. 2 Structural characterization of Pb3O4 and β-PbO2 in MEA under different EOP durations. (a and b) HRTEM images and (c and d) ex situ XRD patterns of Pb3O4 and β-PbO2 before and after EOP treatment in EOP electrolyzer at a high current of 1 A cm−2. | ||
The X-ray diffraction (XRD) technique was also used to get more insight into structural changes of Pb3O4 and β-PbO2 during the EOP operation. Fig. 2c and Fig. S19a (ESI†) demonstrate that the XRD pattern of the Pb3O4 structure showed a pronounced sharp peak at around 26.3°, which is attributed to the (211) plane of Pb3O4 (PDF#41-1493, Fig. S20, ESI†). Other characteristic peaks of (110), (220), (112), (310), (202), and (332), appeared at 2θ = 14.2°,28.6°, 30.7°, 32.0°, 34.0°, and 52.0°, respectively, which are well consistent with standard peaks of Pb3O4. A notable peak at 2θ = 49.8° attributed to the (402) plane significantly becomes weak after 10 h of EOP operation, and no notable peak shift is observed, which indicates an inconspicuous phase change degree at this stage. A new peak at ∼25.4° assigned to the (110) of β-PbO2 starts to appear after 15 h, which is consistent with the HRTEM results mentioned above. Meanwhile, the characteristic peaks of β-PbO2 at 31.9° (101), and 49.0° (211) appear and gradually intensify as the EOP test continues. Meanwhile, the diffraction peak at 26.3° becomes broadened and weakened, which can be attributed to the phase change of the Pb3O4 samples after 25 h. After 50 hours, the peak assigned to the Pb3O4 phase disappeared. At the same time, new diffraction peaks located at 2θ = 25.4°, 31.9°, 36.2°, 49.0°, and 52.1° appeared, which can be assigned as the (110), (101), (200), (211), and (220) facets of β-PbO2, respectively. Moreover, these diffraction peaks remain steady even after 100 h, indicating that Pb3O4 has been completely converted to β-PbO2.
To further probe the time-resolved evolution of Pb3O4 during EOP at anodic potentials at around 2.4 to 2.45 V vs. RHE, the ex situ Raman characterization was performed (Fig. S19b, ESI†). The Raman spectrum of the initial sample shows peaks at 122, 152, 224, 314, 390, 480, and 550 cm−1, which are attributed to the feature of Pb3O4 (Fig. S21, ESI†).15,16 Note that at the initial stage (<10 h), all the main peaks of Pb3O4 remain unchanged. The peak at 142 cm−1 appears after 15 h of operation, demonstrating the formation of new species. Two new peaks at 140 and 277 cm−1 are detected after 25 h of EOP operation. Then, another two peaks at 136 and 270 cm−1 are gradually formed after 50 h, which demonstrates the complete transformation of Pb3O4 to β-PbO216 (Fig. S22, ESI†). These results confirm that the electrocatalyst reaches a stable state after an activation stage of 50 h, which agrees with the XRD results. In contrast, the commercial β-PbO2 does not undergo phase change during long-term EOP operation, which is confirmed by the ex situ XRD and ex situ Raman results (Fig. 2d and Fig. S23 and S24, ESI†).
As β-PbO2 is thermodynamically more stable, the phase shuttling from Pb3O4 to β-PbO2 observed in the XRD and Raman characterizations can be explained by the Pourbaix diagram mentioned above. However, the mechanism underneath the fact that the Pb3O4-reconstructed β-PbO2 is more active and stable during the long-term test is still unclear. In our previous work, the (101) and (110) facets of β-PbO2 are confirmed to contribute to the high activity of EOP. Notably, the XRD patterns show that the Pb3O4-reconstructed β-PbO2 has significantly different crystalline plane ratios than the commercial β-PbO2 during the EOP period of 500 h to 950 h. Nevertheless, the Pb3O4-reconstructed β-PbO2 remains stable in the ratio of (101) to (110) facet, as shown in Fig. 2c, d and Fig. S25 (ESI†), while the commercial β-PbO2 exhibited a remarkable decrease in the ratio of (101) to (110) facet, which can explain its difficulty in maintaining EOP activity.
Electronic property changes during EOP
The O 1s X-ray photoelectron spectra (XPS) were employed to analyze the surface oxygen vacancies of the Pb3O4 and β-PbO2 electrocatalysts during the long-term EOP tests (Fig. 3a–c). The formation of adsorbed oxygen species at about 531.0 eV is closely related to the existence of surface oxygen vacancies (VO).17,18 The content of VO on the surface of the β-PbO2 catalyst increases by ca. 50% after 950 h of EOP operation, while slight increases in VO content are observed for the Pb3O4 catalyst during the reconstitution process. Besides, the surface lattice oxygen ratio of Pb3O4 declines slightly during the reconstruction process (Fig. S26 and Tables S3 and S4, ESI†), which indicates that the Pb3O4-reconstructed possesses a more stable surface crystal structure during the EOP process. Furthermore, the XPS on Pb element valence state was also conducted. The valence states of Pb elements in the Pb3O4 exhibit slight variation during the reconstruction, while there is a significant decrease in the Pb4+ proportion in β-PbO2 during the same period, which is consistent with the decrease in the proportion of its lattice oxygen (Fig. S27 and Tables S5 and S6, ESI†). These results declare that the Pb3O4-reconstructed β-PbO2 has more stable surface structures during the EOP process.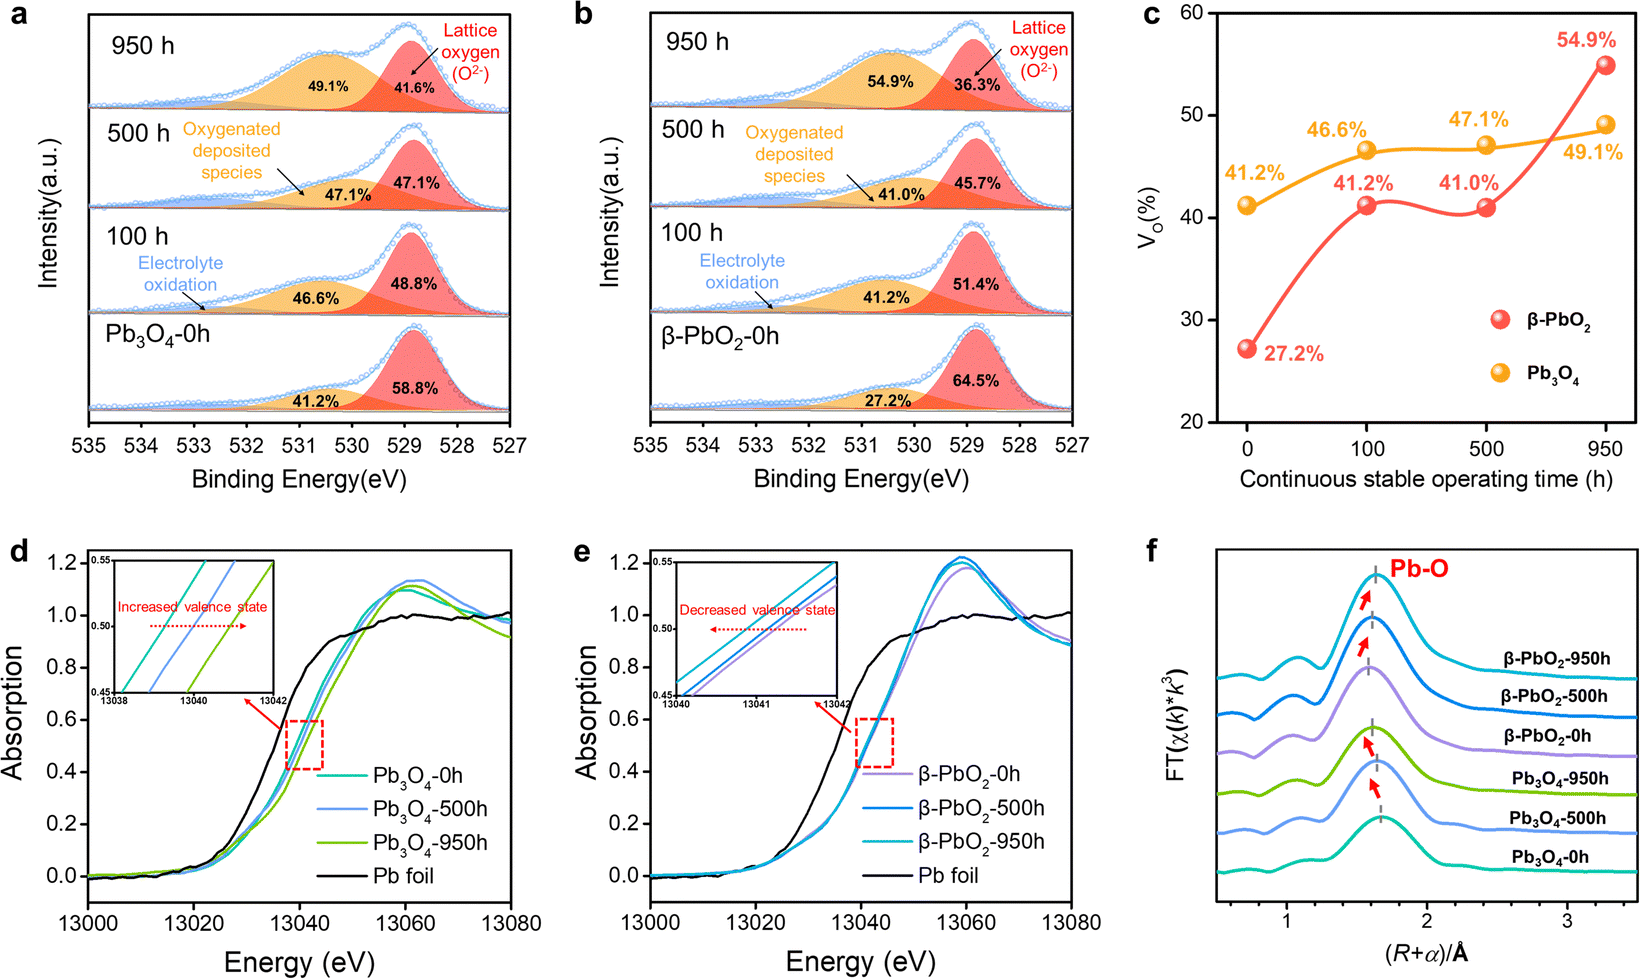 | ||
| Fig. 3 Structural characterization and stability investigations of Pb3O4 and β-PbO2 during the EOP process. (a and b) O1s spectra of Pb3O4 and β-PbO2 before and after EOP treatment in EOP electrolyzer at a high current of 1.0 A cm−2. (c) Changes in surface oxygen vacancy ratios (VO%) of Pb3O4 and β-PbO2 during the EOP process corresponding to a and b. (d–f) XAFS analysis of Pb3O4 and β-PbO2 under different EOP durations. The XANES Pb L3-edge spectra (d and e), and Pb L3-edge curve fits (lines) of Pb3O4 and β-PbO2, shown in R-space (f). | ||
To further elucidate the stability of the exposed lead oxide surfaces, COHP for the exposed Pb–O covalent bonds over the β-PbO2101), β-PbO2(110), Pb3O4(110), and Pb3O4(211) surface was calculated (Fig. S28, ESI†). The COHP results show that the Pb–O covalent interaction is mainly dominated by the interaction between Pb-2s/2p and O-2p orbital; the Pb-5d orbital is fulfilled and not responsible for the Pb–O covalent interaction. Such Pb–O covalent interaction is different from most transition metal oxides (TiO2, Al2O3, etc.), in which the interaction is dominated by the d orbital and O-2p orbital.19 The weak Pb–O bond strength could result in the migration of lattice oxygen, which also explains the reconstruction of lead oxides during the EOP process. The integrated COHP (ICOHP) values are calculated to be 4.26 and 3.54 for β-PbO2(101), and Pb3O4(110), respectively. By comparing the ICOHP values of the Pb–O bond over different surfaces, it can be concluded that the Pb–O covalent interaction on different surfaces follows the order of PbO2(101) > Pb3O4(110). These results again prove that the β-PbO2(101) possesses higher surface stability, which also explains why the β-PbO2 with a high ratio of (101) facets obtained by Pb3O4 phase shuttling represents excellent long-term EOP stability compared to that of commercial β-PbO2.
Moreover, the X-ray absorption spectroscopy (XAS) tests of the Pb L3-edge were carried out to track the evolution process of the atomic structures of Pb3O4 and β-PbO2 during the long-term EOP operation.20,21 As depicted in the X-ray absorption near edge structure (XANES) spectra (Fig. 3d), the positive shift in energy absorption of the white line by the Pb3O4 pre-catalyst can be found (red arrow direction) after the EOP operation (Fig. 3d), which demonstrates that the valence states of Pb gradually rise during the whole process. Moreover, the negative shift in energy absorption of the white line of the β-PbO2 pre-catalyst is displayed with time (Fig. 3e), which implies the continuous decrease in the valence state of Pb during the EOP process (Table S7, ESI†). It should be noted that the curves have a bond-length compensation in Fig. 3f. The curve-fitting analysis of the extended X-ray absorption fine structure (EXAFS) spectrum (Fig. S29, S30 and Table S8, ESI†) indicates that the coordination number of the Pb3O4 sample is 4.0 at 0 h, and then increases to 4.1 at 500 h and 4.3 at 950 h. The coordination number of the Pb–O bond keeps increasing during the EOP process, revealing that O atoms are continuously filled into the lattice structure during the reconstruction of Pb3O4, which can lead to the decrease of the Pb–O bond length and the increase of the Pb oxidation state. Such interpretation is also consistent with the XANES results. In addition, the fitting results also exhibit that the coordination number of the Pb–O bond of β-PbO2 decreases from 6 at 0 h to 5.0 at 950 h, which are higher than the Pb–O coordination numbers of Pb3O4-reconstructed β-PbO2 at the same time. The lower coordination number of Pb–O bonds signifies that the structure of Pb3O4-reconstituted β-PbO2 contains abundant Vo, which can affect the electronic structure of the catalyst hosts.22 This electronic regulation facilitates lattice oxygen release during EOP, which can eventually lead to activity enhancement.23
Phase shuttle mechanism
To achieve an in-depth understanding of the origin of the phase shuttling of Pb3O4 during the EOP process, the mechanism of the Pb3O4 electrocatalyst was investigated in neutral media using 18O-labeling combined with DEMS (Fig. S31 and S32, ESI†).24,25 The controlled potential electrolysis was carried out at 2.4 V vs. RHE in saturated K2SO4 prepared with 98% H218O. Fig. 4a and b show the occurrence of both OER and EOP processes simultaneously, and the EOP FE reaches ∼17.4%. Meanwhile, the signal strength of O3 (16O16O16O) with a mass-to-charge ratio of 48 is the greatest (Fig. 4c), which is approximately 500 times higher than that of other O3 signals. This result suggests that ∼99.8% of the O3 signal comes from the 48O3 (16O16O16O) signal (Table S9 and Fig. S33, ESI†). The above results indicate that the product of the EOP process using Pb3O4 is mainly composed of three lattice oxygen atoms coupling with each other to generate 48O3, associated with the participation of lattice oxygen.26–28 Meanwhile, the dominating signal (∼80.6%) of the oxygen generated during the electrocatalytic process comes from 36O2 (18O18O) (Fig. S33, ESI†). Unlike the EOP process, the OER process undergoes both the adsorbate evolution mechanism (AEM) and LOM pathways,29,30 and the AEM pathway played a significant role in the OER process. | ||
| Fig. 4 DEMS and theoretical calculation results. (a) DEMS signals of O2 and O3 from the reaction products cycled in saturated K2SO4 (H218O) by in situ DEMS of Pb3O4 at 2.4 V vs. RHE. (b) DEMS signals of 32O2, 34O2, 36O2, 48O, 50O3, 52O3 and 54O3 on Pb3O4 during the OER and EOP process at 2.4 V vs. RHE. (c) Constituent content of 16O16O16O (m/z = 48), 16O18O16O (m/z = 50), 18O18O16O (m/z = 52) and 18O18O18O (m/z = 54) through DEMS measurements. (d) DFT calculated potential energy diagrams of AEM and LOM reaction pathways under the conditions of U = 0.0 V,31 (e) DFT calculated potential energy diagrams of AEM and LOM reaction pathways under the equilibrium potential condition (U = 1.51 V vs. SHE).31 (f) Applied potential effect on O2/O3 adsorption energies of the PbO2(101) surface. | ||
To investigate the underlying mechanism for the phase shuttling of Pb3O4 to β-PbO2 during the EOP process, two sets of 18O isotope labeling experiments (series A and B) were performed. In experiment set A, the oxygen atoms of Pb3O4 were labeled with 18O in K2SO4 electrolyte prepared with H218O at constant voltage for 20 min (Fig. S34 and S35, ESI†). Since the isotope content of the Pb318O4 is identical to the isotope content of the electrolyte, no change in the isotope content has been observed. Afterward, 18O-labeled electrodes were rinsed with H216O five times to remove the remaining H218O. In experiment set B, the prelabeled oxide was then used to evolve O2 and O3 in H216O-containing electrolytes. Even though the measurement was conducted in H216O-containing electrolytes, the spectra showed that 34O2, 36O2, 50O3, 52O3, and 54O3 were formed at potentials for EOP (Fig. S36 and S37, ESI†). Therefore, the Pb3O4 can be gradually reconstructed into β-PbO2 during the EOP process through oxygen exchange between the electrocatalyst and locally adsorbed water molecules on the electrocatalyst surface. Furthermore, our previous work has comprehensively investigated the possible reaction pathways of β-PbO2 during the EOP process, of which the results reveal that the LOM pathway dominated the O3 formation on the anode, as shown in Fig. 4d and e.31 Meanwhile, the LOM-2 reaction path (three oxygen atoms originating from the lattice oxygen) is more favorable and consistent with the above DEMS results. Based on the lattice oxygen mechanism (LOM), the O3* is generated via the coupling of the adsorbed O2* intermediate and one surface lattice oxygen atom. Thus, the key descriptor for O2/O3 selectivity could be attributed to the adsorption energies of O2 and O3, and Fig. 4f shows the calculated O2/O3 adsorption energies of the PbO2(101) surface. With the increase of the applied potential, both the O2 + 2Ov (Oxygen vacancy) and O3 + 3Ov formation energies on the β-PbO2(101) surface become more negative, indicating the facile migration and coupling of surface lattice oxygens to O2/O3. Additionally, the energies of O3 + 3Ov drop more dramatically, indicating the increasing selectivity of O3 on the β-PbO2(101) surface. These results further explain why the Pb3O4-reconstructed β-PbO2 with the stable presence of (101) active surfaces exhibits a more stable EOP activity than the β-PbO2.
From the above experimental and theoretical results, the concept of “phase shuttling” during the EOP process is proposed. As shown in Scheme 2, the phase shuttling originating from the external electric field can promote the process of surface lattice oxygen diffusion and reconstruction of the Pb3O4 phase to the more stable β-PbO2 phase (Fig. S38, ESI†), in which the weak covalent interaction of Pb–O most likely results in the phase shuttling of Pb3O4. In spite of the potential enhancement of the reaction activity through the LOM process, the participation of the lattice oxygen can also lead to catalyst instability from thermodynamic considerations.32 In this work, the Pb3O4-reconstructed β-PbO2 maintains excellent EOP activity and stability during the long-term EOP test, which can be attributed to its lower coordination structure of Pb–O bonds and the stable presence of (101) and (110) active surfaces.
 | ||
| Scheme 2 Schematic illustration of phase shuttling of Pb3O4 by the applied electric field. | ||
EOP electrolyzer for SARS-CoV-2 disinfection
As a representative demonstration of on-site on-demand application, we used the as-synthesized ozone from our device for disinfection against SARS-CoV-2. Ozone has been demonstrated to be effective in diminishing bacteria, spores, and viruses. However, few reports have focused on using ozonated water for virus inactivation.33,34 The Pb3O4-based EOP electrolyzer was used to generate ozonated water for inactivating SARS-CoV-2 (Fig. 5a). Fig. 5b shows that after injecting ozone gas into quantitative normal saline for 40 min, the concentration of ozonated water reaches the peak and remains stable for 60 min at ca. 2.12 mg L−1 (Fig. S39 and S40, ESI†). The results show that the virus titer is significantly reduced along with a contact time over 30 s to 10 min by the ozonated water. Within 30 s, more than 99.99% of the viruses can be inactivated, and the inactivation efficiency can rise to 100.00% when the contact time increases to 5 min (Fig. 5c). Fig. 5d shows Vero cells as a negative control (with ozonated water treatment) and infected Vero cells (without ozonated water treatment) under a 400× microscope, which clearly demonstrates the excellent inactivation effect of ozonated water on SARS-CoV-2. It is generally considered that ozone could inactivate viruses by diffusing through the protein coat into the nucleic acid core, damaging the viral RNA, and disrupting the exterior protein layer by oxidation.35 All of these results demonstrate the efficiency of EOP-generated ozone on SARS-CoV-2 inactivation, making our design economically and environmentally appealing for practical use when scaled up, which provides a solution to help contain the spread of SARS-CoV-2. | ||
| Fig. 5 Inactivation of SARS-CoV-2 by ozonated water. (a) Schematic diagram of the electrochemical inactivation process. (b) The concentration of ozonated water collected in 15 mL of normal saline under normal temperature and pressure (Inset: The qualitative result of ozonated water concentration). (c) SARS-CoV-2 inactivation ratio by ozonated water. (d) Microscopic pictures of negative control and infected cells by SARS-CoV-2 (400× magnification). | ||
Conclusions
In summary, the phase shuttle effect on the EOP performance of Pb3O4 has been comprehensively investigated by in situ/ex situ approaches. The transformation from Pb3O4 to β-PbO2 was observed during the EOP test, and the as-reconstructed β-PbO2 exhibits enhanced EOP activity and stability compared to the commercial β-PbO2. The calculated Pourbaix diagrams of lead oxides prove that the phase shuttling to β-PbO2 is thermodynamically favorable under the EOP operating conditions. The ex situ XRD and XAS characterizations suggest the excellent performance mainly attributed to the stable presence of (101) and (110) surfaces and the low Pb–O coordination number of the reconstructed β-PbO2. The in situ DEMS tests reveal that the phase shuttling from Pb3O4 to β-PbO2 undergoes the LOM pathway. In addition, the ozonated water prepared by the Pb3O4-based EOP MEA electrolyzer can inactivate SARS-CoV-2 efficiently and rapidly. This work provides fundamental insights into the lead oxides under EOP conditions and paves a new way to design high-performance EOP catalysts for potential industrial applications.Author contributions
X. Z., Z. W., Z. J. X., and J. G. W. conceived and supervised the study. J. L. performed most of the experiments, carried out the analysis, and produced the figures with the support of X. Z. L. S. and X. H. helped to characterize the samples. G. F. and W. W. L. contributed to the theoretical calculation with the support of J. G. W. and S. B. W. Z. N. Y. and B. B. W. and H. W. performed experiments for the inactivation of SARS-CoV-2. L. J. and S. B. W. analyzed the data and constructed the discussion. J. L., S. B. W., C. C. D. and Kamal wrote the manuscript. All authors participated in manuscript editing and approved the manuscript.Conflicts of interest
The authors declare no competing interests.Acknowledgements
The authors acknowledge the financial support from Zhejiang Provincial Natural Science Foundation (No. LR22B060003), Key Research&Development Program of Zhejiang (2022C03120), National Health Commission Scientific Research Projects (WKJ-ZJ-2113, WKJ-ZJ-2220) and the National Natural Science Foundation of China (NSFC-22078293, 21625604, 2017R5203, and 91934302). We greatly thank the Research Center of Analysis and Measurement, Zhejiang University of Technology, for using their XRD equipment. We also thank Prof. R. R. Li. and Dr X. L. Chen. (Engineering Research Centre of Recycling & Comprehensive Utilization of Pharmaceutical and Chemical Waste of Zhejiang Province, Taizhou University) for help with the ex situ Raman characterizations. This work is partially supported by the Singapore MOE Tier 1 grant (RG62/21) and the Singapore National Research Foundation under its Campus for Research Excellence and Technological Enterprise (CREATE) programme.References
- J. Wang and H. Chen, Sci. Total Environ., 2020, 704, 135249 CrossRef CAS PubMed.
- K. Lee, H. Lin and K. F. Jensen, React. Chem. Eng., 2017, 2, 696–702 RSC.
- S. G. Van Ornum, R. M. Champeau and R. Pariza, Chem. Rev., 2006, 106, 2990–3001 CrossRef CAS PubMed.
- C. G. Joseph, Y. Y. Farm, Y. H. Taufiq-Yap, C. K. Pang, J. L. H. Nga and G. Li Puma, J. Environ. Chem. Eng., 2021, 9, 106099 CrossRef CAS.
- V. Naresh, L. Elias, S. A. Gaffoor and S. K. Martha, J. Electrochem. Soc., 2019, 166, A74–A81 CrossRef CAS.
- Y. Zeng, M. Zhao, Z. Huang, W. Zhu, J. Zheng, Q. Jiang, Z. Wang and H. Liang, Adv. Energy Mater., 2022, 12, 2201713 CrossRef CAS.
- F.-Y. Chen, Z.-Y. Wu, Z. Adler and H. Wang, Joule, 2021, 5, 1704–1731 CrossRef CAS.
- X. Liu, J. Meng, J. Zhu, M. Huang, B. Wen, R. Guo and L. Mai, Adv. Mater., 2021, 33, e2007344 CrossRef PubMed.
- S. Jin, ACS Energy Lett., 2017, 2, 1937–1938 CrossRef CAS.
- S. Zhao, J. Huang, Y. Liu, J. Shen, H. Wang, X. Yang, Y. Zhu and C. Li, J. Mater. Chem. A, 2017, 5, 4207–4214 RSC.
- R. Amadelli, L. Armelao, A. Velichenko, N. Nikolenko, D. Girenko, S. Kovalyov and F. Danilov, Electrochim. Acta, 1999, 45, 713–720 CrossRef CAS.
- A. Babak, R. Amadelli, A. De Battisti and V. Fateev, Electrochim. Acta, 1994, 39, 1597–1602 CrossRef CAS.
- Y. Yan, Y. Gao, H. Zheng, B. Yuan, Q. Zhang, Y. Gu, G. Zhuang, Z. Wei, Z. Yao, X. Zhong, X. Li and J. Wang, Appl. Catal., B, 2020, 266, 118632 CrossRef CAS.
- J. D. McGettrick, K. Hooper, A. Pockett, J. Baker, J. Troughton, M. Carnie and T. Watson, Mater. Lett., 2019, 251, 98–101 CrossRef CAS.
- I. Costantini, P. P. Lottici, K. Castro and J. M. Madariaga, Minerals, 2020, 10(5), 468 CrossRef CAS.
- D. Guo, C. Robinson and J. E. Herrera, Corros. Sci., 2016, 103, 42–49 CrossRef CAS.
- C. Zhao, N. Li, R. Zhang, Z. Zhu, J. Lin, K. Zhang and C. Zhao, ACS Appl. Mater. Interfaces, 2019, 11, 47858–47867 CrossRef CAS PubMed.
- X. Duan, W. Wang, Q. Wang, X. Sui, N. Li and L. Chang, Chemosphere, 2020, 260, 127587 CrossRef CAS PubMed.
- N. J. O’Connor, A. S. M. Jonayat, M. J. Janik and T. P. Senftle, Nat. Catal., 2018, 1, 531–539 CrossRef.
- W. Qu, S. Niu, D. Sun, H. Gao, Y. Wu, Z. Yuan, X. Chen, Y. Wang, T. An, G. Wang and F. Zhao, Adv. Sci., 2021, 8, 2002889 CrossRef CAS PubMed.
- D. G. Nevidomskaya, T. M. Minkina, A. V. Soldatov, V. A. Shuvaeva, Y. V. Zubavichus and Y. S. Podkovyrina, J. Soils Sediments, 2015, 16, 1183–1192 CrossRef.
- Y. Tian, S. Wang, E. Velasco, Y. Yang, L. Cao, L. Zhang, X. Li, Y. Lin, Q. Zhang and L. Chen, iScience, 2020, 23, 100756 CrossRef CAS PubMed.
- H. Liu, X. Li, C. Peng, L. Zhu, Y. Zhang, H. Cheng, J. Cui, Q. Wu, Y. Zhang, Z. Chen, W. Zou, W. Gu, H. Huang, J. Wang, B. Ye, Z. Fu and Y. Lu, J. Mater. Chem. A, 2020, 8, 13150–13159 RSC.
- A. Grimaud, O. Diaz-Morales, B. Han, W. T. Hong, Y. L. Lee, L. Giordano, K. A. Stoerzinger, M. T. M. Koper and Y. Shao-Horn, Nat. Chem., 2017, 9, 457–465 CrossRef CAS PubMed.
- N. Zhang and Y. Chai, Energy Environ. Sci., 2021, 14, 4647–4671 RSC.
- A. Grimaud, W. T. Hong, Y. Shao-Horn and J. M. Tarascon, Nat. Mater., 2016, 15, 121–126 CrossRef CAS PubMed.
- N. Zhang, X. Feng, D. Rao, X. Deng, L. Cai, B. Qiu, R. Long, Y. Xiong, Y. Lu and Y. Chai, Nat. Commun., 2020, 11, 4066 CrossRef CAS PubMed.
- Z.-F. Huang, J. Song, Y. Du, S. Xi, S. Dou, J. M. V. Nsanzimana, C. Wang, Z. J. Xu and X. Wang, Nat. Energy, 2019, 4, 329–338 CrossRef CAS.
- J. T. Mefford, X. Rong, A. M. Abakumov, W. G. Hardin, S. Dai, A. M. Kolpak, K. P. Johnston and K. J. Stevenson, Nat. Commun., 2016, 7, 11053 CrossRef CAS PubMed.
- Y. Pan, X. Xu, Y. Zhong, L. Ge, Y. Chen, J. M. Veder, D. Guan, R. O’Hayre, M. Li, G. Wang, H. Wang, W. Zhou and Z. Shao, Nat. Commun., 2020, 11, 2002 CrossRef CAS PubMed.
- W. Li, G. Feng, S. Wang, J. Liu, X. Zhong, Z. Yao, S. Deng and J. Wang, J. Phys. Chem. C, 2022, 126, 8627–8636 CrossRef CAS.
- T. Binninger, R. Mohamed, K. Waltar, E. Fabbri, P. Levecque, R. Kotz and T. J. Schmidt, Sci. Rep., 2015, 5, 12167 CrossRef CAS PubMed.
- A. Blanco, F. B. Ojembarrena, B. Clavo and C. Negro, Environ. Sci. Pollut. Res. Int., 2021, 28, 16517–16531 CrossRef CAS PubMed.
- C. Tizaoui, R. Stanton, E. Statkute, A. Rubina, E. Lester-Card, A. Lewis, P. Holliman and D. Worsley, J. Hazard. Mater., 2022, 428, 128251 CrossRef CAS PubMed.
- C. Tizaoui, Ozone: Sci. Eng., 2020, 42, 378–385 CrossRef CAS.
Footnotes |
| † Electronic supplementary information (ESI) available. See DOI: https://doi.org/10.1039/d3ey00015j |
| ‡ Equal contribution. |
| This journal is © The Royal Society of Chemistry 2023 |