 Open Access Article
Creative Commons Attribution 3.0 Unported Licence
Interfacial interactions of humic acids with polystyrene nano-plastics in aqueous/ionic environments: a molecular dynamics exploration†
Prasad
Rama
 *a,
Julián A.
Gallego-Urrea
 b and
Zareen
Abbas
 a
a
aDepartment of Chemistry and Molecular Biology, University of Gothenburg, Gothenburg – 40530, Sweden. E-mail: prasad.rama@gu.se
bDepartment of Marine Science, University of Gothenburg, Gothenburg – 40530, Sweden
First published on 13th March 2023
Abstract
Plastics pose a serious threat to both marine and freshwater life after being discarded and broken down into smaller particles such as micro and nano-plastic particles. The nano-sized plastic particles are small enough in size and similar to surfaces of biological molecules, thereby potentially altering the intra-cellular interactions and their biological fate. In order to increase our understanding of the interactions among the molecules of natural organic matter and carboxylate functionalized polystyrene nano-plastics, we have performed a modelling study of the aquatic environment at different pH conditions using molecular dynamics (MD) simulations at an atomistic scale. Humic acids (HAs) are the most common constituents of natural organic matter, usually found in soil, water, and its sediments. As a proxy for humic acids, we have used Temple-Northeastern-Birmingham (TNB), an equivalent molecule to HA in its composition. We show that TNB molecules exhibit strong interactions with polystyrene (PS) nano-plastic particles at pH-4 but weak interaction at pH-7, whereas moderate interaction at pH-9 both in fresh and saltwater. The interaction between carboxylated polystyrene particles and TNB molecules is found to be counter-ion mediated and is enhanced in the presence of saltwater, i.e., at 0.5 M NaCl electrolyte. An enhanced condensation of Na+ counter-ions onto the surface of nano-plastics brings more water molecules to its interface, hence, enriching the hydrophilicity of nano-plastics. An ordered network structure of water molecules has also been observed at the interface of the PS-slab with an increase in pH of the aquatic environment, leading to a preferential alignment of water molecules, resulting in a strong hydration layer. This strong hydration layer also keeps the TNB molecules away from the vicinity of the PS-slab interface. The surface potential trends obtained from the MD simulations are in agreement with the measured zeta potential values showing that the surface charge density of PS nano-plastics increases with an increase in the pH of aquatic solutions. Hence, our simulations provide molecular-level insights into the phenomenon associated with the adsorption/accumulation of molecules of natural organic matter towards the nano-plastics and are helpful in understanding the formation of eco-corona on plastic nanoparticles.
Environmental significancePolystyrene is a widely used thermoplastic that ends up as plastic waste after being discarded and is carried to lakes/oceans, where they degrade into micro/nano-sized particles. The nano-sized plastic particles are small enough and similar to surfaces of biological molecules, thereby potentially altering intra-cellular interactions and their biological fate. The dissolved organic matter present in the lakes/oceans interacts with these nano-plastics and forms an eco-corona. The formation of eco-corona around the nano-plastics mainly occurs through hydrogen bonding, van der Waals forces, and hydrophobic and electrostatic interactions. Based on detailed atomistic level information gained by molecular dynamics, we have highlighted the fundamental mechanisms governing the interactions of organic molecules with PS-slab in pure and saltwater conditions at different pH values. The study highlights the influence of surface charge density of the nano-plastic in various aquatic conditions on its surface potential and surface hydration, which in turn affect the adsorption behaviour of humic acids (TNB molecules) onto its interface. Our simulation results can be very helpful in understanding the corona formation and plays a vital part in the ecotoxicity of these nano-plastics. |
1. Introduction
Polystyrene (PS) is a widely used plastic material as a result of its many applications, excellent physiochemical properties, as well as its low cost of production.1 The applications of PS are numerous, ranging from plastic cups to additives in paints and cosmetics, which has led to PS of different sizes being widely spread as waste in the environment. Polystyrene nano-plastics can be functionalized with different functional groups to tailor their properties. Such properties include, for example, changes in electroactivity, adsorption to different materials, biological activity, light emission, and absorption.2 With an increase in the wide usage of these plastic products globally, they eventually end up as plastic waste after being used and disposed into the environment. Lakes, streams, and rivers can act as receivers, sinks, and transporters of plastic pollution,3 which finally ends up in the ocean. In an aqueous environment, the plastic material further breaks down into smaller pieces and eventually into nano-plastics (<100 nm in diameter)4,5 due to their exposure to sunlight, oceanic waves, and living organisms present in water and the water itself.6,7 Due to their unique surface-to-volume ratio, such nano-sized plastics exhibit potential biological impacts on aquatic living organisms.8 Assessments of surface lake water report microplastic concentrations ranging from 0.21 to 34![[thin space (1/6-em)]](https://www.rsc.org/images/entities/char_2009.gif) 000 particles per m3.9 Note that those are micro-plastic concentrations since quantifying NP in complex environmental matrices is still analytically challenging.
000 particles per m3.9 Note that those are micro-plastic concentrations since quantifying NP in complex environmental matrices is still analytically challenging.
Natural organic matter (NOM) is a complex mixture of organic molecules that are usually found in water, soil, and sediments,10,11 in the form of extracellular polymeric substances (DNA, proteins, carbohydrates, etc.) and humic substances (e.g., humic and fulvic acids). These biomolecules interact with nano-plastics and encapsulate them to form a unique layered structure termed eco-corona, which can alter the physicochemical characteristics, interaction, fate, and effects of these plastic nanoparticles in the ecosystem.12,13
The interaction of nano-plastics in an aqueous environment with the biological fate of organisms depends on their size, shape, surface charge, and other properties.8 The organic molecules of NOM may interact with the nano-plastic surface to form an eco-corona that can potentially modify the nature of nano-plastic interactions with the cell and organism surfaces and thereby its toxicity to aquatic life. The formation of eco-corona around the nano-plastics mainly occurs through hydrogen bonding, van der Waals forces, and hydrophobic and electrostatic interactions. There are numerous experimental studies reported in the literature on the interactions of nano-plastics with NOM in aquatic environments. For example, Shams et al.,14 reported that polyethylene and polystyrene nano-plastics exhibit stronger interactions with NOM-coated surfaces in aquatic environments of monovalent and divalent salts, indicating that the fate and mobility of nano-plastics are governed by the interactions with NOM. Moreover, Saavedra et al.15 demonstrated a study showing that the surface charge of nano-plastic can influence the formation of eco-corona and thereby its toxicity to zooplankton. Schultz et al.16 studied the toxicity of 50 and 60 nm polystyrene nano-plastics with respect to the amine and carboxylated functionalized groups, elucidating that surface functionalization may change the nature of nano-plastic interactions with membranes and organelles, leading to variations in toxicity. In a recent study, it was demonstrated that the formation of a humic acid corona on polystyrene nano-plastic particles17 alleviates the toxicity of nano-plastic particles to the aquatic crustacean Daphnia magna.
In this study, molecular dynamics (MD) simulations are performed to investigate the surface interactions between NOM molecules and PS nano-plastics in an aqueous environment of both fresh and saltwater. The pH of water in rivers and lakes generally ranges between 5 and 9, whereas ocean water18 averages closer to 8.2. Hence, the simulations are considered at three different pH ranges: acidic (pH 4), neutral (pH 7), and basic (pH 9) aqueous environments. Humic acids are the main constituents of NOM, and the Temple-Northeastern-Birmingham (TNB) model has been utilized to mimic NOM in our simulations due to its similarity in composition to humic acid.19–21 Our main aim has been to elucidate the processes at the atomistic level that govern the interactions of NOM molecules with the charged nano-plastic surfaces, hence providing insight into the binding affinities and surface complexation with the nano-plastics. This is crucial in understanding the formation of eco-corona and its stability in different aqueous environments.
2. Materials and methods
2.1 Experimental
2.2 Simulations
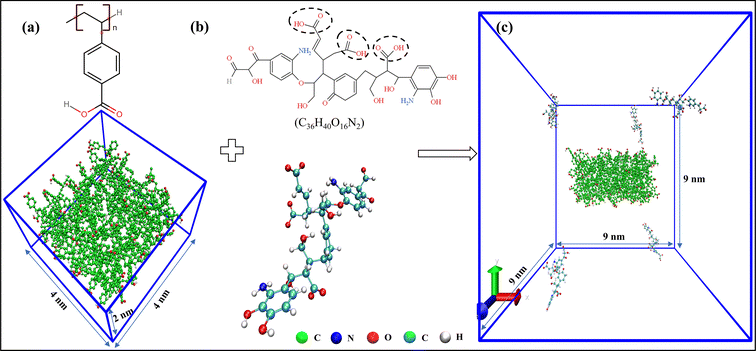
Five such molecules of TNB were distributed randomly over the simulation box of size 9 × 9 × 9 nm3, with the PS-slab being at its center, as shown in Fig. 1. The simulation box was then filled with the water molecules using the TIP4P model explicitly. In total, six different systems were prepared for pH 4, 7, and 9 at 0 M and 0.5 M NaCl concentrations. The pH 4 system resembled the case in which 15% of the carboxylate groups of the PS-slab are deprotonated (11 COO−), pH 7 was the one with 60% (42 COO−), and pH 9 with 98% (69 COO−), respectively.26 In all these systems, the carboxylate groups of the TNB molecules were deprotonated (3 COO−), whereas the amines (–NH2) and phenolic groups (–OH) always remain electrically neutral in the pH range of 4–9.27 The required number of sodium ions was added to the box wherever necessary by replacing the solvent molecules to maintain the charge neutrality of the simulation box.
3. Results and discussion
3.1 Interactions among TNB molecules and polystyrene nano-plastic
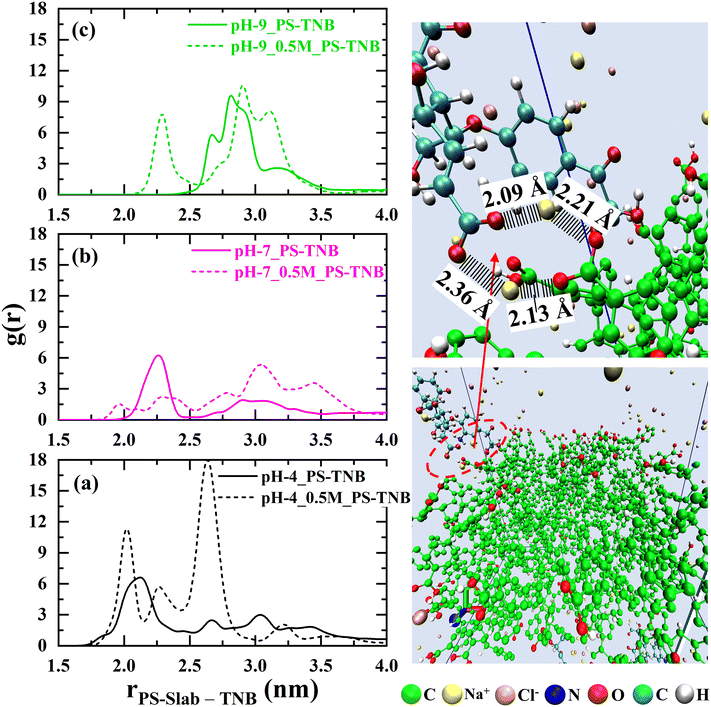
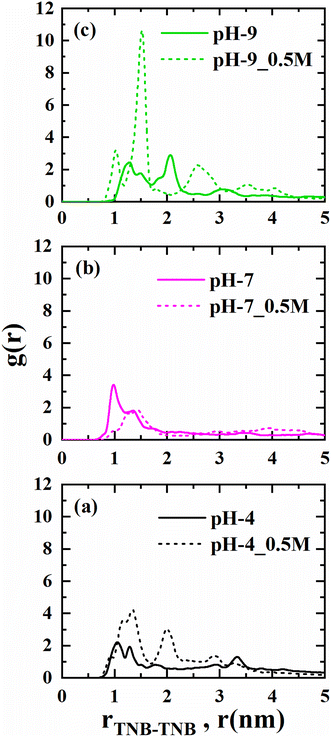
To investigate the interactions between the TNB molecules and nano-plastic (PS-slab), the radial distribution function (RDF) was calculated as a function of TNB molecules, as displayed in Fig. 2. This gives us an insight into the behaviour of natural organic matter near the surface of nano-plastics under different aquatic conditions. A significant difference in interactions of the TNB molecules with the PS-slab is observed for the systems at pH values of 4, 7, and 9 in fresh as well as in saltwater.
From Fig. 2(a), there is a clear trend exhibiting that the system with pH 4 has a higher probability of TNB molecules remaining close (1.5 nm) to the surface of the PS-slab as compared to other systems considered in this study. This is due to the van der Waals attractive force induced among the aromatic rings that are present in both PS-slab and the TNB molecules. Although coulombic repulsive interactions exist between the TNB molecules and PS-slab due to the negatively charged carboxylic groups, the contribution of van der Waals forces becomes large due to the significant number of aromatic rings present in both TNB and PS-slab as compared to the number of negatively charged carboxylic groups. With the addition of 0.5 M of NaCl electrolyte, the accumulation of TNB molecules increased in the vicinity of the PS-slab. This enhanced accumulation can be inferred from the counter-ion (Na+) induced attractive interaction between the negatively charged carboxylate groups of TNB molecules and PS-slab, bringing the TNB molecules closer to the surface of the PS-slab.
At pH 7 (Fig. 2(b)), TNB molecules exhibited a relatively weak interaction as to all other systems studied. A shift in the peak (≈ 2 nm) was observed for the distribution of TNB molecules elucidating the coulombic repulsive interactions arising among the negatively charged carboxylate groups. Hence, the molecules are pushed away from the surface of the PS-slab as compared to the system at pH 4. However, with the addition of 0.5 M NaCl electrolyte, a close shift (≈ 1.5 nm) in the distribution is observed, exhibiting a counter-ion-induced relatively weak attractive interaction.
At pH 9 (Fig. 2(c)), the TNB molecules exhibit a moderate interaction with the PS-slab as to the systems studied at pH 4 & 7. The TNB molecules are further pushed away (≈ 2.5 nm) from the surface of the PS-slab as to the systems at pH 4 & 7. This is due to an increase in the coulombic repulsive interactions between TNB molecules and PS-slab as the number of charged carboxylate groups increases with an increase in pH. However, in saltwater, counter-ion-induced attractive interactions bring the TNB molecules closer (≈ 2 nm) to the surface of the PS-slab.
From these interaction profiles, it can be inferred that TNB molecules are less likely to adsorb onto the PS-slab at high pH conditions, i.e., if it carries a higher surface charge density. The coulombic repulsive interactions among the deprotonated carboxylate groups take precedence over the van der Waals attractive interactions with the aromatic rings of PS and TNB molecules, leading to less adsorptivity. Also, Na+ ion bridging takes place as the ions interact with negatively charged carboxylate groups of TNB and PS-slab, thereby bringing TNB molecules closer to the interface of nano-plastics in saltwater.
3.2 Counter-ion condensation
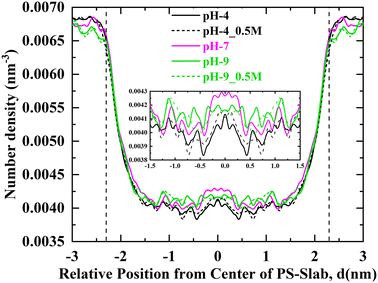
To investigate the affinity of Na+ ions in relation to the surface charge density of the PS-slab in various aquatic environments, the number density distribution of Na+ ions starting radially outward from the center of the PS-slab with a bin width of 0.05 nm is calculated and plotted as shown in Fig. 4. Comparing the RDF plots, the Na+ ions show stronger interaction with the PS-slab with an increase in the pH of the aqueous solution. The density of Na+ ions is lower at the interface of the PS-slab at pH 4 and increases with an increase in its surface charge density34 at pH 7 & 9. The increase in the condensation of Na+ ions is due to counterbalancing the negative charge of the deprotonated carboxylate groups at increasing pH conditions of aquatic solution.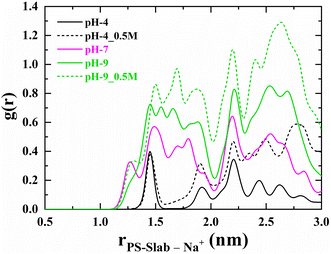 | ||
| Fig. 4 Radial number density distribution profiles for sodium ions adsorbed on the interface of PS-slab at pH-4, pH-4_0.5 M, pH-7, pH-9 & pH-9_0.5 M. | ||
3.3 Dynamic properties of water
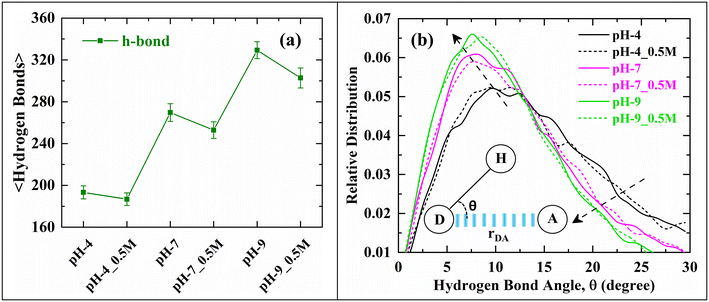
Fig. 6(a) represents the average number of hydrogen bonds (h-bonds) formed at the interface of the PS-slab between the carboxylate groups of polystyrene and the surrounding water molecules. The number of h-bonds increased with an increase in the pH of the aqueous solution. This can be ascribed to the polarizability of water molecules35,36 induced by the negatively charged carboxylate groups on the surface of the PS-slab. However, with the addition of 0.5 M NaCl electrolyte, a reduction in the number of h-bonds was observed, which can be inferred as the distortion in the structure of the h-bonds37 between the carboxylate groups and the surrounding water molecules due to the Na+ ions.
Fig. 6(b) represents the strength of the h-bond interactions existing between the carboxylate groups of PS and water molecules. We observed that with an increase in the pH of the aqueous solution, the strength of the h-bonds increased, and the peak shifted to lower angles. The relative distribution representing the distance between the donor (OCarboxylate) and acceptor (HWater) distance is reported in Fig. S2 of ESI.† This increase in strength is due to the high surface charge associated with the PS-slab, which in turn polarises more surrounding water molecules resulting in the alignment of water molecules leading to a more structured network of water molecules at the geometric interface of the PS-slab with an increase in pH of the aqueous environment. An ordered network structure of water molecules leads to the accommodation of a higher number of water molecules at the interface of PS-slab and hence the observed increase in their density (Fig. 5) at the interface resulting in a strong hydration layer.
3.4 Electrostatic potential distribution
The surface charge on nano-plastics plays a major role in driving the adsorptivity of organic matter molecules onto their surface. Surface potential is a measure of quantifying the surface charge on the nano-plastics at different aquatic conditions. Hence, the surface potential of the PS-slab was analyzed for the systems at different pH intervals considered in this study, as shown in Fig. 7. The electrostatic potential is calculated by integrating the charge density on YZ-plane across the simulation box along the X-direction. The electrostatic potential is observed to be negative with increasing pH of the surrounding aquatic environment of PS-slab. The surface potential is large and negative at pH 9 (1 V), which can be attributed to the greater number of deprotonated carboxylate groups of PS-slab contributing to its negative charge. However, with the addition of 0.5 M NaCl electrolyte, the potential has been reduced considerably to 0.6 V. This significant reduction in the negative potential is due to the screening of its surface charge by Na+ ions that are adsorbed onto the interface of PS-slab (Fig. 4). The observed inferences are consistent with the idea of screening of surface charge with enhanced condensation of Na+ ions,35,38,39 and consequently a decrease in Debye screening length. A similar trend is observed for the surface potentials calculated for PS-slab at pH-4 and pH-7 at 0 M and 0.5 M NaCl.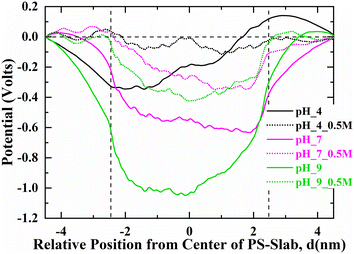 | ||
| Fig. 7 Electrostatic potential profiles for the PS-slab at different pH (4, 7, and 9) values. The dashed lines represent the interface of PS-slab in the X-direction. | ||
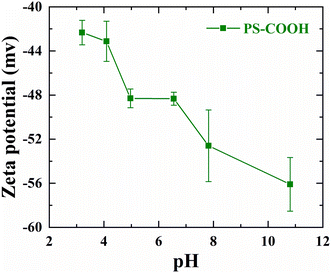 | ||
| Fig. 8 The zeta potentials corresponding to the carboxylated polystyrene latex nanoparticles at different pH conditions of the aquatic environment. | ||
The zeta potentials inferred from the experiments correlate well with the trends of the surface potentials (Fig. 7, pH 4, 7 & 9) measured from the simulations qualitatively, thus depicting negative surface potential as a result of increased surface charge density of PS–COOH due to the ionized carboxylate groups of its surface with an increase in pH of the aqueous environment.
4. Conclusions
In conclusion, the simulations have given us an insight into the charge of PS-slab playing a major role in influencing the adsorption behaviour of TNB molecules, Na+ ions, and water molecules onto its interface. We show that the development of eco-corona at the interface of PS-slab is higher in a system at pH-4 with 0.5 M NaCl electrolyte and lower at pH-7 with 0.5 M NaCl. We also show that Na+ ions exhibit a strong affinity towards the interface of PS-slab with an increase in pH of the aquatic solution both in fresh and saltwater, which in turn affects the hydrophilicity of PS nano-plastic. A structured network of water molecules has also been observed with an increase in pH of the aqueous solution, thereby accumulating a greater number of water molecules at the interface of PS-slab, resulting in a strong hydration layer, keeping the TNB molecules away from the vicinity of its interface. The trends in the surface potentials calculated over different charge densities of the PS-slab at different aquatic conditions are validated with the zeta potential measurements of samples from wetland mesocosms.Therefore, these interactions provide an insight into the fate of nano-plastics in controlling the binding/adsorption/accumulation of organic molecules/ions/water molecules on the surface of nano-plastics in various aquatic conditions. Therefore, the results of this study are useful for providing, at a molecular level, a detailed understanding of eco-corona development around the nano-plastics in an ecosystem. Although our simulation results do not illustrate toxicity, however, the binding mechanisms leading to eco-corona around the nano-plastic at different pH conditions of the aquatic environment are relevant for evaluating and understanding the toxicity of these nano-plastics to living organisms. The interactions between carboxylated nano-plastics and dissolved organic matter can be complex and depend on factors, such as ionic strength, temperature, salinity, and the concentration of the organic matter, in addition to the pH of the aquatic environment. The interactions between the PS-slab and TNB can also be affected by the presence of other molecules, ions, or inorganic colloids in the solution. However, the representative model used in this study can simplify the understanding of the interactions governing the development of eco-corona. The future investigations of this study can further be extended by including different salts and inorganic colloids in aquatic environments.
Conflicts of interest
There are no conflicts of interest to declare.Acknowledgements
The authors would like to acknowledge Mistra (The Swedish Foundation for Strategic Environmental Research) for funding (DIA 2013/48) of this work under the Mistra Environmental Nanosafety project. We are grateful to Dr. Rakesh Vaiwala and Prof. Lars-Anders Hansson, Franca Stabile, and Mikael Ekvall for their helpful inputs regarding the work. We also thank the Swedish National Infrastructure for Computing (SNIC) for providing us with the computational time.References
- R. Mohammad-Rezaei, B. Massoumi, M. Abbasian and M. Jaymand, J. Polym. Res., 2018, 25(4), 1572–8935 CrossRef.
- S. Moulay, Polym.-Plast. Technol. Eng., 2018, 57, 1045–1092 CrossRef CAS.
- F. M. Windsor, I. Durance, A. A. Horton, R. C. Thompson, C. R. Tyler and S. J. Ormerod, Global Change Biol., 2019, 25, 1207–1221 CrossRef PubMed.
- K. Kik, B. Bukowska and P. Sicińska, Environ. Pollut., 2020, 262, 114297 CrossRef CAS PubMed.
- S. Lambert and M. Wagner, Chemosphere, 2016, 145, 265–268 CrossRef CAS PubMed.
- H. K. Imhof, J. Schmid, R. Niessner, N. P. Ivleva and C. Laforsch, Limnol. Oceanogr.: Methods, 2012, 10, 524–537 CrossRef CAS.
- K. Mattsson, E. V. Johnson, A. Malmendal, S. Linse, L. A. Hansson and T. Cedervall, Sci. Rep., 2017, 7, 1–7 CrossRef CAS PubMed.
- K. Mattsson, L. A. Hansson and T. Cedervall, Environ. Sci.: Processes Impacts, 2015, 17, 1712–1721 RSC.
- E. M. F. Kallenbach, E. S. Rødland, N. T. Buenaventura and R. Hurley, Microplastics in Terrestrial and Freshwater Environments, 2022, pp. 87–130 Search PubMed.
- I. Kögel-Knabner, Soil Biol. Biochem., 2002, 34, 139–162 CrossRef.
- Z. Parsi, N. Hartog, T. Górecki and J. Poerschmann, J. Anal. Appl. Pyrolysis, 2007, 79, 9–15 CrossRef CAS.
- R. Frankel, M. T. Ekvall, E. Kelpsiene, L. A. Hansson and T. Cedervall, Environ. Sci.: Nano, 2020, 7, 1518–1524 RSC.
- M. T. Ekvall, J. Hedberg, I. Odnevall Wallinder, A. Malmendal, L. A. Hansson and T. Cedervall, Sci. Rep., 2021, 11, 10784 CrossRef CAS PubMed.
- M. Shams, I. Alam and I. Chowdhury, Water Res., 2021, 197, 117066 CrossRef CAS PubMed.
- J. Saavedra, S. Stoll and V. I. Slaveykova, Environ. Pollut., 2019, 252, 715–722 CrossRef CAS PubMed.
- C. L. Schultz, S. Bart, E. Lahive and D. J. Spurgeon, Environ. Sci. Technol., 2021, 55, 6065–6075 CrossRef CAS PubMed.
- O. O. Fadare, B. Wan, L. H. Guo, Y. Xin, W. Qin and Y. Yang, Environ. Sci.: Nano, 2019, 6, 1466–1477 RSC.
- T. I. Moiseenko, M. I. Dinu, N. A. Gashkina, V. Jones, V. Y. Khoroshavin and T. A. Kremleva, Environ. Res. Lett., 2018, 13, 105007 CrossRef.
- E. Iskrenova-Tchoukova, A. G. Kalinichev and R. James Kirkpatrick, Langmuir, 2020, 26, 15909–15919 CrossRef PubMed.
- A. G. Kalinichev, Pure Appl. Chem., 2013, 85, 149–158 CrossRef CAS.
- A. G. Kalinichev and R. J. Kirkpatrick, Eurasian J. Soil Sci., 2007, 58, 909–917 CrossRef CAS.
- L. Martinez, R. Andrade, E. G. Birgin and J. M. Martínez, J. Comput. Chem., 2009, 30, 2157–2164 CrossRef CAS PubMed.
- M. D. Hanwell, D. E. Curtis, D. C. Lonie, T. Vandermeerschd, E. Zurek and G. R. Hutchison, Aust. J. Chem., 2012, 4, 1–17 Search PubMed.
- X. Wu, Y. Xia, L. Yuan, K. Xia, Y. Jiang, N. Li and X. He, Water, 2020, 12, 3200 CrossRef CAS.
- Y. Ai, C. Zhao, L. Sun, X. Wang and L. Liang, Sci. Total Environ., 2020, 702, 135072 CrossRef CAS PubMed.
- S. F. Schulz, T. Gisler, M. Borkovec and H. Sticher, J. Colloid Interface Sci., 1994, 164, 88–98 CrossRef CAS.
- J. D. Ritchie and E. Michael Perdue, Geochim. Cosmochim. Acta, 2003, 67, 85–96 CrossRef CAS.
- E. L. M. Lundborg, J. Phys. Chem. B, 2015, 3, 810–823 CrossRef PubMed.
- M. J. Abraham, D. van der Spoel, E. Lindahl, B. Hess and the GROMACS development team, DOI:10.5281/ZENODO.5850051.
- W. L. Jorgensen and D. S. Maxwell, J. Am. Chem. Soc., 1996, 118, 11225–11236 CrossRef CAS.
- W. L. Jorgensen, J. Am. Chem. Soc., 1988, 110, 11225–11236 Search PubMed.
- H. J. C. Berendsen, J. P. M. Postma, W. F. Van Gunsteren, A. Dinola and J. R. Haak, J. Chem. Phys., 1984, 81, 3684–3690 CrossRef CAS.
- U. Essmann, L. Perera, M. L. Berkowitz, T. Darden, H. Lee and L. G. Pedersen, J. Chem. Phys., 1995, 103, 8577–8593 CrossRef CAS.
- A. Clavier, F. Carnal and S. Stoll, J. Phys. Chem. B, 2016, 120, 7988–7997 CrossRef CAS PubMed.
- P. Rama and Z. Abbas, Phys. Chem. Chem. Phys., 2022, 24, 3713–3721 RSC.
- S. Ong, X. Zhao and K. B. Eisenthal, Chem. Phys. Lett., 1992, 191, 327–335 CrossRef CAS.
- P. A. Covert, K. C. Jena and D. K. Hore, J. Phys. Chem. Lett., 2014, 5, 143–148 CrossRef CAS PubMed.
- P. Rama, A. R. Bhattacharyya, R. Bandyopadhyaya and A. S. Panwar, J. Phys. Chem. C, 2018, 122, 9619–9631 CrossRef CAS.
- P. Rama, A. R. Bhattacharyya, R. Bandyopadhyaya and A. S. Panwar, J. Phys. Chem. C, 2019, 123, 1974–1986 CrossRef CAS.
Footnote |
| † Electronic supplementary information (ESI) available: Data for radial number density distribution profiles of ion condensation at the interface of PS-slab, Donor–Acceptor distance for h-bonds formed at the PS-slab geometric interface were made available. See DOI: https://doi.org/10.1039/d2en00916a |
| This journal is © The Royal Society of Chemistry 2023 |

