
 Open Access Article
 This Open Access Article is licensed under a Creative Commons Attribution-Non Commercial 3.0 Unported Licence
Canadian high arctic ice core records of organophosphate flame retardants and plasticizers†
Amila O.
De Silva
 *a,
Cora J.
Young
*b,
Christine
Spencer
a,
Derek C. G.
Muir
a,
Martin
Sharp
c,
Igor
Lehnherr
d and
Alison
Criscitiello
c
*a,
Cora J.
Young
*b,
Christine
Spencer
a,
Derek C. G.
Muir
a,
Martin
Sharp
c,
Igor
Lehnherr
d and
Alison
Criscitiello
c
aAquatic Contaminants Research Division, Environment Canada, 867 Lakeshore Road, Burlington, ON L7S 1A1, Canada. E-mail: amila.desilva@ec.gc.ca; Christine.spencer0501@gmail.com; derek.muir@ec.gc.ca
bDepartment of Chemistry, York University, Toronto, ON M3J 1P3, Canada. E-mail: youngcj@yorku.ca
cDepartment of Earth and Atmospheric Sciences, University of Alberta, Edmonton, AB T6G 2R3, Canada. E-mail: crisciti@ualberta.ca; msharp@ualberta.ca
dDepartment of Geography, Geomatics and Environment, University of Toronto Mississauga, Mississauga, Ontario L5L 1C6, Canada. E-mail: igor.lehnherr@utoronto.ca
First published on 18th October 2023
Abstract
Organophosphate esters (OPEs) have been used as flame retardants, plasticizers, and anti-foaming agents over the past several decades. Of particular interest is the long range transport potential of OPEs given their ubiquitous detection in Arctic marine air. Here we report 19 OPE congeners in ice cores drilled on remote icefields and ice caps in the Canadian high Arctic. A multi-decadal temporal profile was constructed in the sectioned ice cores representing a time scale spanning the 1970s to 2014–16. In the Devon Ice Cap record, the annual total OPE (∑OPEs) depositional flux for all of 2014 was 81 μg m−2, with the profile dominated by triphenylphosphate (TPP, 9.4 μg m−2) and tris(2-chloroisopropyl) phosphate (TCPP, 42 μg m−2). Here, many OPEs displayed an exponentially increasing depositional flux including TCPP which had a doubling time of 4.1 ± 0.44 years. At the more northern site on Mt. Oxford icefield, the OPE fluxes were lower. Here, the annual ∑OPEs flux in 2016 was 5.3 μg m−2, dominated by TCPP (1.5 μg m−2) but also tris(2-butoxyethyl) phosphate (1.5 μg m−2 TBOEP). The temporal trend for halogenated OPEs in the Mt. Oxford icefield is bell-shaped, peaking in the mid-2000s. The observation of OPEs in remote Arctic ice cores demonstrates the cryosphere as a repository for these substances, and supports the potential for long-range transport of OPEs, likely associated with aerosol transport.
Environmental significanceIce cores from icefields from high altitude, uninhabited areas in the Canadian high Arctic were used to determine temporal trends of twenty-five organophosphorus flame retardants and plasticizers (OPEs). The depositional flux to the Devon Ice Cap for many OPEs is exponentially increasing over nearly four decades. Some were associated with anthropogenic particles. In the more northern site, annual flux was lower. The cryosphere is a repository for OPEs and may have implications for climate-induced release. |
1 Introduction
Organophosphate esters (OPEs) are used as flame retardants, plasticizers, and anti-foaming agents with production occurring for the past several decades.1 Applications of OPEs vary and include furniture, textiles, electronics, building materials, vehicle, and petroleum industries with OPEs being typically incorporated as additives. Evaluating the environmental fate and transport of OPEs has emerged as a priority.2 The presence of OPEs in indoor and outdoor air, sediment, water,3,4 wastewater,5 and biota6 including human urine7 and breast milk8 is confirmed.OPEs have been detected in the urban atmosphere and precipitation4 but also in polar and other remote areas in fresh snow,9–11 air, and aerosols.12,13 Ocean–atmosphere exchange studies demonstrate marine (aerosol and dissolved) transport of OPEs is also a relevant long range transport pathway with 5 to 20 ng L−1 ∑11OPE in water and 200 to 1000 pg m−3 in the gas phase in paired air samples from the Bering Strait between 65 and 80 °N latitude.14 Recently, OPEs were observed in Lake Hazen and its glacier-fed tributaries on northern Ellesmere Island (Nunavut, Canada), downstream of the Mt. Oxford icefield coring location of this study.15 These observations are suggestive of long range transport potential of OPEs. Their relatively low molecular weight and intermediate polarity may contribute to their atmospheric presence as well as a propensity to deposition. Earlier studies proposed that OPEs were not candidates for long range transport based on empirical and modeled physical properties coupled with low environmental persistence.16,17 Emerging studies suggest that these traditional approaches to evaluating long range transport potential based on gas phase transport are not entirely applicable to OPEs and that aerosol-based transport may be a key mechanism.17,18
While OPEs are widely reported in the abiotic Arctic environment, surveys of OPEs in Arctic marine biota indicate very little accumulation in tissues. For example, monitoring of OPEs in the blubber or adipose tissues from whales, seals, walruses, polar bears and glaucous gulls indicated very low detection frequencies and only sporadic detection of low concentrations of a few OPEs with TCPP having the highest detection frequency of 30–55% and only in two species of whale.19 The limited profile of OPEs in Arctic biota is attributed to their low biopersistence as OPEs undergo both phase I and phase II metabolism.19,20 High dose acute exposure to OPEs induces toxic effects but less is known about environmentally-relevant doses.18,20
The purpose of this research is to evaluate the temporal trends in OPEs deposition to the high Arctic by examining their profile in ice cores. In addition, we sought to evaluate the long range atmospheric transport potential of OPEs as the ice cores were sampled from uninhabited inland regions in the high Arctic. To this end, we report OPEs in ice cores sampled from Devon Ice Cap and Mount Oxford icefield in Arctic Canada (Fig. 1).
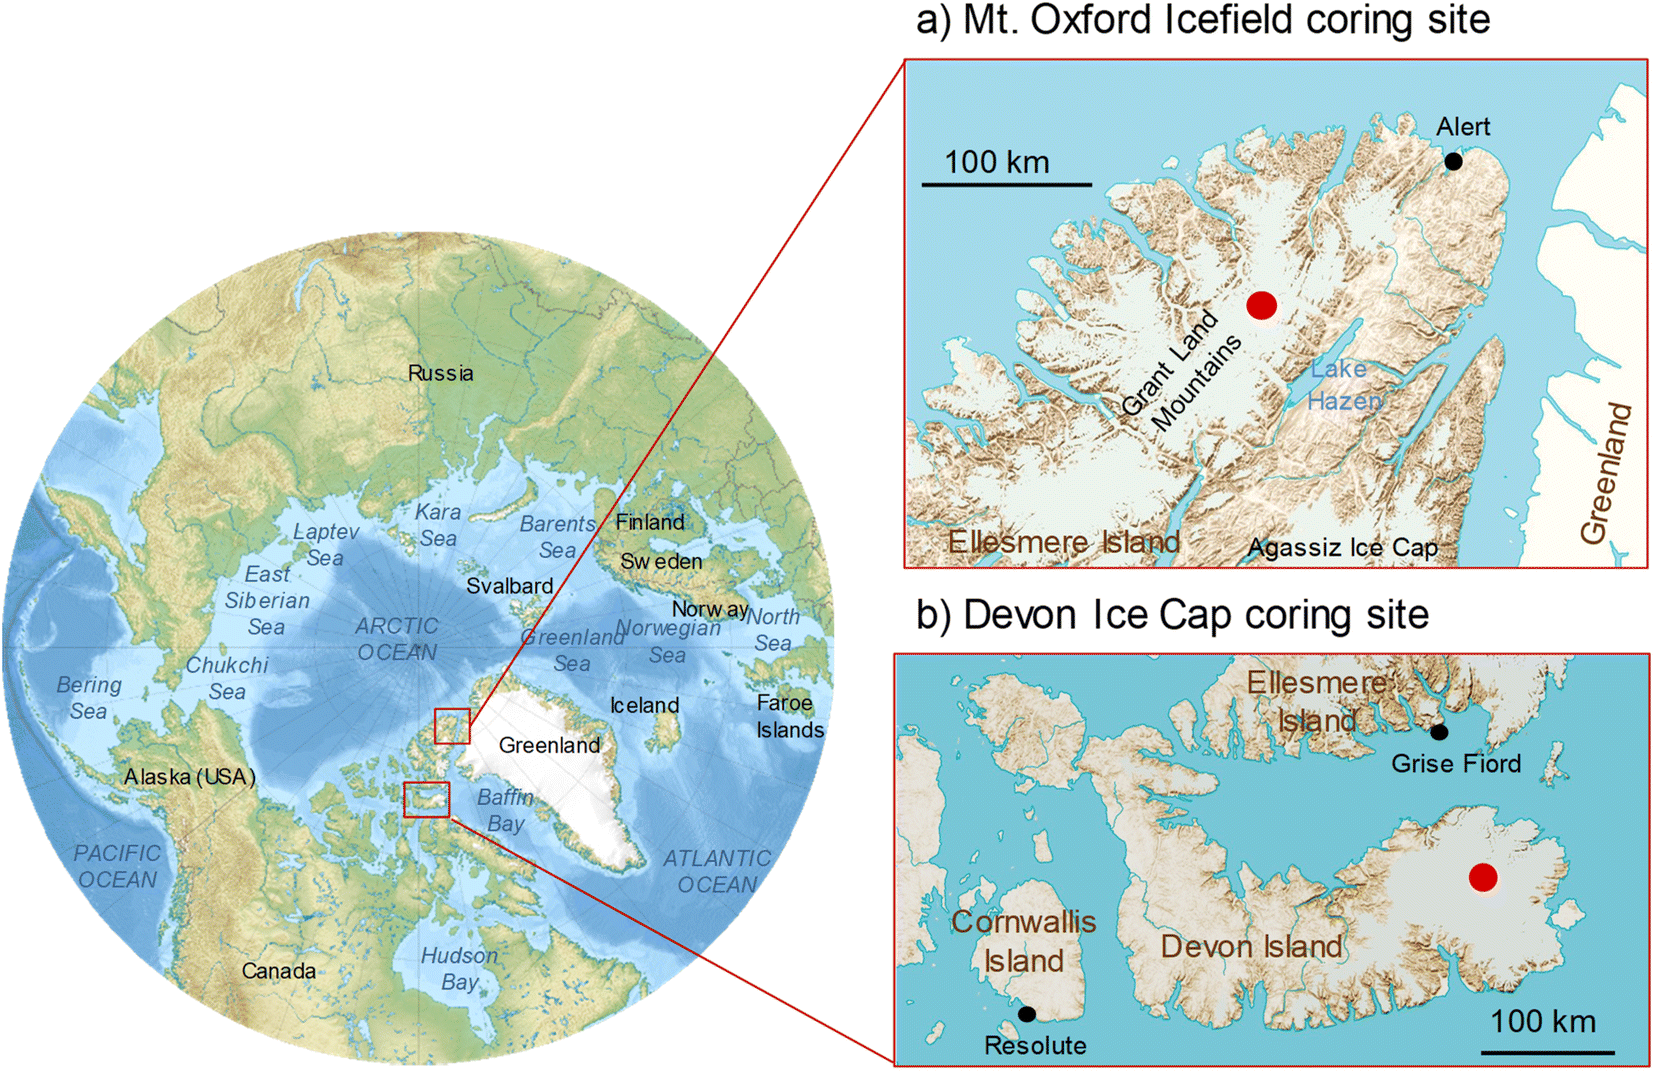 | ||
| Fig. 1 Study area in Arctic Canada. Insets indicate coring sites (red circles) on Ellesmere Island in the Mount Oxford icefield and the Devon Ice Cap on Devon Island. Map from royalty-free and non-exclusive license at atlas.gc.ca, Natural Resources Canada. | ||
Devon Ice Cap is on Devon Island, an uninhabited island in the Arctic archipelago spanning 55![[thin space (1/6-em)]](https://www.rsc.org/images/entities/char_2009.gif) 000 km2. It is at extreme northern latitude (75°N) and the highest point of the ice cap where sampling occurred is at an elevation of 2200 m. The Mt. Oxford icefield is further north at 82°N on Ellesmere Island in the Grant Lands mountain range, and has a peak elevation of 2210 m. We have previously reported temporal deposition of perfluoralkyl substances (PFAS), brominated flame retardants and pesticides in ice from Devon Ice Cap21–25 and more recently, ultra short chain perfluoroalkyl carboxylates from both Devon Ice Cap and Mt. Oxford icefield.26 In addition to the extensive and continuous timescales they capture, ice cores have additional benefits. Active air sampling requires an uninterrupted power supply and therefore limits the remoteness of the feasible sampling locations. In addition, setting up active or passive samplers for multi-year data requires more long-term labour and introduces greater uncertainty between inter-year comparisons.
000 km2. It is at extreme northern latitude (75°N) and the highest point of the ice cap where sampling occurred is at an elevation of 2200 m. The Mt. Oxford icefield is further north at 82°N on Ellesmere Island in the Grant Lands mountain range, and has a peak elevation of 2210 m. We have previously reported temporal deposition of perfluoralkyl substances (PFAS), brominated flame retardants and pesticides in ice from Devon Ice Cap21–25 and more recently, ultra short chain perfluoroalkyl carboxylates from both Devon Ice Cap and Mt. Oxford icefield.26 In addition to the extensive and continuous timescales they capture, ice cores have additional benefits. Active air sampling requires an uninterrupted power supply and therefore limits the remoteness of the feasible sampling locations. In addition, setting up active or passive samplers for multi-year data requires more long-term labour and introduces greater uncertainty between inter-year comparisons.
Contaminants on the Devon Ice Cap and Mt Oxford icefield are expected to be the result of atmospheric deposition due to (1) the low proximity to point sources, (2) distance from the ocean, and (3) high altitude. Here, we examine the temporal deposition of OPEs using the depth profile of OPEs in a dated ice core from the summits of Devon Ice Cap (1979–2015) and Mt. Oxford icefield (1975–2017).
2 Methods
2.1 Study sites and sampling
The Devon Ice Cap has an area of approximately 14000 km2, located on the eastern side of Devon Island (Fig. 1). The accumulation rate at the summit of the ice cap is approximately 30 cm water equivalent/year and mean annual temperature is −23 °C.27 At its deepest point, the ice is 880 m thick. The cores were drilled on May 17, 2015 at the summit of the ice cap (75.3434°N, 82.1290°W) at 2200 m above sea level. Sampling was conducted as previously described using a 9 cm diameter commercially available stainless steel ice core drill (Kovacs Mark II).26 The same drill was used for ice coring in both sites and does not contain any plastic parts that are in contact with the ice core. The entire rind of the core was removed and discarded. Thus, any firn or ice that was touching the inner circumference of the barrel is removed to minimize any contamination.
The Mt. Oxford icefield is located in Quttinirpaaq National Park, northern Ellesmere Island (Fig. 1). The icefield is part of a larger 12000 km2 glaciated area, the Grant Land Mountains.28 The coring site was located at the summit, 82.1790°N, 72.9555°W, and was chosen due to its higher latitude, altitude, and inland location. Mt. Oxford icefield has an annual accumulation rate of approximately 10 cm water equivalent according to the age–depth scale found in this study, consistent with other reports.29,30 Ellesmere Island is mostly uninhabited with the exception of the settlement of Grise Fiord, population 129, at the southern end of the island, as well as two high Arctic weather stations. Approximately 250 km southwest of the coring site is the Eureka weather station (79.9892°N, 85.9339°W). At approximately 164 km northeast of the coring site at 82.5017°N, 62.3481°W, is the high Arctic weather station and Canadian Forces station, Alert, located at sea level. The annual mean temperature at the coring site is likely even lower than that of Eureka which is at 10 m above sea level and has an annual mean temperature of −17 °C (https://climate.weather.gc.ca/historical_data/search_historic_data_e.html). Cores were drilled on May 26, 2017 using a 7.7 cm diameter mechanical drill.
At both sites, additional cores were drilled within 5 m for dating purposes and other contaminant analysis.23 The bottom ages of the cores were determined in the field using a down-hole gamma spectrometer. This technique is based on the horizon markers of 137Cs and 239Pu associated with the global atmospheric fall out of nuclear weapons testing with maximum fallout corresponding to 1963. The development and validation of this technique have been previously described.31,32 The length of the core represented approximately 36 years of deposition (1979 to 2015) in the Devon Ice Cap and 42 years of deposition (1975 to 2017) in the Mt. Oxford icefield. Note: the year of sampling only represents 5.5 months of accumulation and not a full year. Core sections were transferred to polyethylene tubing, secured in insulated ice core boxes, and shipped frozen to the laboratory facility in Burlington, Ontario.
Back trajectory air mass density analysis was calculated using the NOAA Hybrid Single-Particle Lagrangian Integrated Trajectory (HySPLIT) model. Ten-days back trajectories were calculated over an entire year using National Centers for Environmental Protection and Atmospheric Research global atmospheric reanalysis with a focus on low-elevation air masses (0–500 m above terrain) as they are representative of evaporation moisture sources as described previously.33,34 Other time spans have also been used for back trajectories such as 3 and 5 days in other research but 10 days has been used for many years including early work by Kahl et al.35 and more recently.36 Total trajectory endpoints were summed for each equal area pixel and then divided by the zonal distance between the ice coring site and each pixel to remove concentric patterning. The transport density results were scaled to 0–1 for comparison. This approach was developed specifically for interpretation of polar ice core paleoclimate records and has been found to derive more reliable airflow pathways that discriminate between local circulation patterns and regional scale flow features.33 The approach is considered more reliable than single back trajectory analysis regardless of 3, 5, or 10 days back trajectories, which were shown to result in position errors up to 20%.33 The approach was applied to two years, of no particular significance, 2001 and 2013, for each location.
2.2 Glaciochemistry
Studies have shown that despite surface summer melt, seasonal glaciochemical cycles are preserved in the ice, and therefore, core chemistry can be used to interpret interannual variability.37 Dating of the ice cores has been described previously and a brief overview is provided herein.23 The cores designated for dating from Devon Ice Cap and Mt. Oxford icefield were 19 m and 14 m in length, respectively. Cores were analyzed using a continuous flow analysis system in 1 cm intervals with ion chromatography to determine the major ion concentrations (Na+, Cl−, Mg2+, Ca2+, NH4+, K+, NO3−, and SO42−), high resolution inductively coupled plasma mass spectrometry for simultaneous analysis of 30 elements and fluorescence spectroscopy for detection of H2O2 at the Desert Research Institute in Reno, Nevada using previously reported methods.23,34,38 Oxygen (18O) isotope analysis was by cavity ring-down spectroscopy (Picarro, Santa Clara, CA, USA) with precision <0.1% for δ18O. The δ18O depth measurements were used to establish an age–depth relationship and accumulation rates by matching the δ18O firn-core records with summer and winter solstice dates for the core site (linearly interpolating between solstices).39,40 When the δ18O record was ambiguous, the non-sea salt sulfur to sodium ratio summer peak, representing summer solstice, was used to specify the annual maximum δ18O. Annual peaks were confirmed using the remaining major ions, for example as shown in Fig. S1.† A modified Abakus® particle counter system was employed in line with the continuous flow analyzer to discern particle concentrations in size bins corresponding to 1.2 to 2.4 μm, 2.4 to 4.5 μm, and 4.5 to 10 μm diameter particles, as described earlier by Simonsen et al. 2019.41,422.3 Sectioning for OPE analysis
Cores were stored at −30 °C at our walk-in freezer facility in Burlington, Ontario. The ice core was placed on a stainless steel table lined with methanol-cleaned aluminum foil in a −18 °C room where it was further sectioned by hand using a cleaned hack saw. Core sections were transferred to a 4 L pre-cleaned glass bottle for melting. All handlers wore latex gloves and kept direct contact with the core to a minimum. The measured water equivalents, depth of firn core and assigned years are presented in Tables S6 and S7 in the ESI.†2.4 Target OPE analytes
All OPE analytes, abbreviations, full names, and Chemical Abstract Registry Numbers are presented in Table S1 (ESI).† The majority of OPE standards were obtained from Sigma Aldrich: triethyl phosphate (TEP, 99.8%), tris(2-chloro-ethyl) phosphate (TCEP, 97%), triphenylphosphine oxide (TPPO), tripropyl phosphate (TPrP, 99%), tris (2,3-dibromopropyl) phosphate (TDBrPP, 99%), tributyl phosphate (TnBP, 99%), triisobutyl phosphate (TiBP, 99%), tris(2-butoxyethyl) phosphate (TBOEP, 94%), tributylphosphine oxide (TBPO, 95%), dioctylphenyl phosphonate (DOPP, 95%), tris(2-ethylhexyl) phosphate (TEHP, 97%), 2-ethylhexyl diphenyl phosphate (EHDPP, 98%). Tetraethylethylene diphosphonate (TEEDP, 97%) was obtained from Fluka and tris(2-chloroisopropyl) (TCPP, 98%), tris(1,3-dichloroisopropyl) phosphate (TDCPP, 96%) from Reidel. Triphenylphosphate (TPP), trixylyl phosphate (TXP), tris(2-isopropylphenyl) phosphonate (T2IPP), and ortho-, meta-, and para-tolyl phosphate isomers (TOTP) were obtained from Wellington Labs. Bis(tert-butylphenyl) phenyl phosphate (DTBPP, 95%), 4-(tert-butyl)phenyl diphenyl phosphate (TBDPP, 95%), tris(p-tert-Butylphenyl) phosphate (TTBPP, 95%) were from Angene Chemical. Iso-decyl diphenyl phosphate (iDeDPP) was obtained from Accustandard. Diphenyl-isopropylphenyl phosphate (DIPIPP) was added to the analysis of Mt. Oxford ice core. Fourteen isotopically labeled substances were used as internal standards and are listed in Table S2.†2.5 Analysis of OPEs
Extraction of each 500 ml melted annual layer was by solid phase extraction (SPE) using previously published methods.15,43 Samples were not filtered prior to SPE due to the priority of avoiding possible contamination through contact with filter media. The SPE cartridges (1 ml 60 mg HLB, Waters) were conditioned using 2 ml isopropanol (B&J Honeywell), and 5 ml HPLC grade water (Fisher Scientific). Samples were spiked with 30 μl of the internal standard (final 1 ng ml−1 concentration in extract) and then loaded at 1 ml min−1. After loading the cartridge was washed with 3 ml 5% methanol (HPLC grade, Fisher) in water before drying the cartridge under vacuum for 15 minutes. The cartridge was eluted with 5 ml 90/10 methyl tert butyl ether (Omnisolv grade, EMD)/methanol. The final extract was evaporated to just dryness using ultra high purity nitrogen and then reconstituted in 0.5 ml acetonitrile (Optima grade, Fisher) for OPE analysis by ultra high performance liquid chromatography tandem mass spectrometry (UHPLC-MS/MS).Previous analytical methods for OPE was reported15 and described briefly here. The UHPLC-MS/MS system consisting of a Waters Acquity LC coupled to a Waters Xevo TQS tandem mass spectrometer with conditions as previously reported.15 Analytes were separated using a BEH C18 column (1.7 μm, 50 × 1 mm) in a 60 °C thermostatted compartment using a water (A) and methanol (B) mobile phase, both containing 0.1% formic acid, gradient and constant flow rate of 0.3 ml min−1. Further details on the UHPLC-MS/MS parameters can be found in the ESI (Tables S1 and S2).†
Analysis of contaminants in ice cores requires clean handling procedures during sampling, sectioning and extraction. A detailed elaboration of OPE contamination potential during field sampling and laboratory processing as well as the controls that were administered, are presented in the ESI.† Field blanks were based on handling, transport and exposure of laboratory water from the Polar Continental Shelf Program (PCSP) research facility Resolute Bay, NU, Canada to the field sites in comparison to the same water kept in the laboratory at PCSP. We applied laboratory method blanks, consisting of the SPE process without sample. Precision was evaluated based on duplicate extraction and analysis of 12 ice sections that had large enough volume to split into two samples. Recovery was evaluated using extraction efficiency (EE) using a composite of ice core melted water. The composite was prepared by combining subsamples of melted ice sections (i.e. excess sample from each discrete melted sample bottle). To assess EE, one 500 ml aliquot composite sample was spiked native and internal standards prior to extraction (pre-extraction spiked sample). These data were then compared to an unspiked 500 ml composite sample that was extracted to produce a final extract, which was then spiked with native and internal standards just before instrument analysis (i.e. post-extraction spike). Deviation in analyte peak area between the pre-extraction spike and the post-extraction spike would be due to extraction efficiency because both samples have the same matrix (Table S4†). Accuracy was evaluated by comparing the calculated concentrations recovered in spiked samples to the theoretical spike. Quantitation was based on calibration curves using relative response of the native standard to corresponding internal standard. For analytes lacking an analogous isotopically labeled standard, the internal standard with the closest retention time was applied (Table S1†). The calibration curve consisted of 15 levels: 0.05, 0.1, 0.15, 0.25, 0.3, 0.4, 0.65, 0.95, 1.25, 2.0, 3.0, 4.0, 7.0, 9.0, 12 ng ml−1 of native standard and 1 ng ml−1 of internal standard. This research group participated in two international interlaboratory studies for 16 different OPE congeners analysis and yielded excellent accuracy based on zeta-scores corresponding to less than 1.0 as described in our earlier publication15 and report (lab #3, Supporting Information for Stubbings et al.).44 All aspects pertaining to QA/QC (limits of detection, recovery, interlaboratory results) are presented in the ESI (Tables S4 and S5).†
2.6 Statistical analysis
All concentrations are reported in units of nanogram per litre (ng L−1). Owing to unfiltered samples being extracted, all sample concentrations represent bulk water and particles. Descriptive statistical analyses are presented for OPEs in both sites. Detection frequency (DF) for each analyte was expressed as percentage of samples with >MDL concentration per site. Arithmetic mean and standard error were calculated for analytes with >50% DF. For these analytes, <MDL concentrations were substituted using the maximum likelihood estimation approach.45 Given that sampling in both sites occurred in the month of May, concentration and flux calculations in the upper layer does not include the full year of accumulation and only 5.5 months.3 Results
3.1 Concentration profile of OPEs in arctic ice
OPEs were detected in every annual layer from 1979 to 2015 in Devon Ice Cap and 1975 to 2017 in Mt. Oxford icefield. Concentration data for both ice cores are summarized in Table 1 and shown in Tables S6 and S7 in the ESI.† The composition profiles of OPEs can be generalized in 10 year intervals in Fig. 2. In the ice sections representing the few years, 2010–2014 in Devon Ice Cap and 2010–2016 in Mt. Oxford icefield, the major OPEs based on concentration were the chlorinated OPEs, 40–42% TCPP (58 ± 10 ng L−1 in Mt. Oxford and 184 ± 62 ng L−1 in Devon), 4–5% TCEP (7.8 ± 1.9 ng L−1 in Mt. Oxford and 18 ± 3 ng L−1 in Devon), 2–4% TDCPP (5.1 ± 0.8 ng L−1 in Mt. Oxford and 7.7 ± 0.9 ng L−1 in Devon), the alkyl OPEs 4–27% TBOEP (39 ± 7 ng L−1 in Mt. Oxford and 17 ± 2 ng L−1 in Devon), and 4–18% TEP (5.1 ± 1.0 ng L−1 in Mt. Oxford and 18 ± 2 ng L−1 in Devon). The linear tributyl phosphate ester isomer, TnBP, was more prevalent in Devon Ice Cap (5.2 ± 1.6 ng L−1 in Mt. Oxford and 29 ± 3 ng L−1 in Devon) than the isopropyl isomer (TiBP), as was TPP (3.7 ± 0.7 ng L−1 in Mt. Oxford and 155 ± 79 ng L−1 in Devon) (Fig. S2, ESI†). In the Mt. Oxford icefield, TiBP was more prevalent (14 ± 2 ng L−1 in Mt. Oxford and 1.2 ± 0.1 ng L−1 in Devon). The predominance of these OPEs is consistent with international chemical inventory data, such as 2013–2015 inventory in Canada, reporting 1–10 M kg TCPP, 0.1–1 M kg for TEP, TPP, and TDCPP and 104–105 kg for TBOEP in 2013. The US inventory 2020 chemical data reporting (CDR) database is not based on SI units and instead reports quantities in pounds (lbs), however, an approximate conversion to kilograms is provided. The CDR data corresponded to 20–100 × 106 lbs TCPP (approximately 9.1 × 10⁶ kg to 45 × 106 kg), 1–20 × 106 lbs TDCPP (approximately 0.45 × 10⁶ kg to 9.1 × 10⁶ kg), 1–20 × 106 lbs TBOEP, 1–10 × 106 lbs TEP, 1–10 × 106 lbs TPP and 1–10 × 106 lbs TnBP national production volume per year.46,47 In the same database TiBP is also listed but with a national production volume corresponding to <1 × 10⁶ lbs per year (i.e. <450000 kg Table S3†). According to European Regulation on Registration, Evaluation, Authorisation and Restriction of Chemicals (REACH) data in 2013, TEP, TEHP, TBOEP, and TDCPP all had production and import inventories in the range of 1000–104 kg. The predominance of TCPP post-2011 may be due in part that it has been used as a replacement for TCEP since TCEP has been restricted under REACH legislation.48
| TEP | TnBP | TiBP | TPPO | TCEP | TCPP | TDCPP | TEEDP | TPP | EHDPP | TOTP | iDeDPP | TBOEP | TXP | TEHP | DTBPP | T2iPP | TBDPP | DIPIPP | |
|---|---|---|---|---|---|---|---|---|---|---|---|---|---|---|---|---|---|---|---|
| a Detection frequencies were 31% for TBPO (CAS RN 814-29-9) in Devon and 7.0% in Oxford, 0% for TDBrPP (CAS RN 126-72-7) in both locations, 25% for DOPP in Devon and 0% in Oxford and 17% for TTBPP in Devon and 39% in Oxford. b NA – not available; DIPIPP was not a targeted analyte for Devon Ice Cap. c N/A – not applicable. Arithmetic mean and standard error were not calculated for analytes with detection frequency <50%. | |||||||||||||||||||
| CAS RN | 78-40-0 | 126-73-8 | 126-71-6 | 791-28-6 | 115-96-8 | 13674-84-5 |
13674-87-8 |
995-32-4 | 115-86-6 | 1241-94-7 | 1330-78-5 | 29761-21-5 |
78-51-3 | 25155-23-1 |
78-42-2 | 65652-41-7 |
64532-95-2 |
56803-37-3 |
69515-46-4 |
|
|||||||||||||||||||
| Devon ice cap, n = 36 | |||||||||||||||||||
| DFa | 100 | 100 | 100 | 100 | 100 | 100 | 100 | 69 | 100 | 100 | 100 | 100 | 100 | 83 | 47 | 83 | 86 | 12 | NAb |
| MED | 8.2 | 11 | 0.68 | 0.61 | 6.0 | 22 | 3.4 | 0.094 | 12 | 0.38 | 0.10 | 0.26 | 10 | 0.014 | <MDL | 0.045 | 0.099 | <MDL | |
| MEAN | 9.1 | 14 | 0.71 | 0.89 | 8.4 | 73 | 4.1 | 0.17 | 37 | 0.45 | 0.15 | 0.58 | 12 | 0.023 | N/Ac | 0.082 | 0.52 | N/Ac | |
| SE | 0.8 | 1.3 | 0.05 | 0.15 | 0.9 | 20 | 0.4 | 0.03 | 15 | 0.05 | 0.03 | 0.03 | 0.1 | 0.003 | N/Ac | 0.017 | 0.23 | N/Ac | |
| MAX | 28 | 33 | 1.8 | 6.7 | 31 | 633 | 12 | 1.1 | 552 | 1.9 | 1.1 | 2.9 | 46 | 0.11 | 0.11 | 0.74 | 9.8 | 3.6 | NAb |
| MDL | 0.12 | 0.081 | 0.031 | 0.051 | 0.22 | 0.49 | 0.22 | 0.015 | 0.12 | 0.027 | 0.0062 | 0.36 | 0.58 | 0.001 | 0.056 | 0.0031 | 0.0017 | 0.075 | |
|
|||||||||||||||||||
| Oxford icefield, n = 43 | |||||||||||||||||||
| DFa | 95 | 100 | 100 | 81 | 98 | 100 | 100 | 19 | 100 | 100 | 44 | 98 | 100 | 2 | 100 | 100 | 51 | 89 | 98 |
| MED | 3.3 | 3.0 | 7.4 | 0.14 | 3.1 | 34 | 2.6 | <MDL | 1.3 | 1.6 | <MDL | 0.58 | 21 | <MDL | 0.36 | 0.13 | 0.024 | 0.31 | 0.023 |
| MEAN | 3.6 | 3.2 | 8.5 | 0.19 | 3.8 | 38 | 3.5 | N/Ac | 1.9 | 1.9 | N/Ac | 0.71 | 22 | N/Ac | 0.50 | 0.20 | 0.064 | 0.41 | 0.029 |
| SE | 0.3 | 0.3 | 0.8 | 0.03 | 0.5 | 5 | 0.4 | N/Ac | 0.2 | 0.2 | N/Ac | 0.08 | 2 | N/Ac | 0.06 | 0.04 | 0.018 | 0.05 | 0.004 |
| MAX | 11 | 15 | 26 | 1.01 | 20 | 182 | 17 | 0.13 | 6.8 | 5.3 | 12 | 2.3 | 75 | 0.30 | 2.23 | 1.32 | 0.65 | 1.96 | 0.14 |
| MDL | 0.44 | 0.21 | 0.085 | 0.21 | 0.53 | 1.7 | 0.39 | 0.16 | 0.11 | 0.16 | 0.047 | 0.88 | 0.021 | 0.0046 | 0.013 | 0.017 | 0.075 | ||
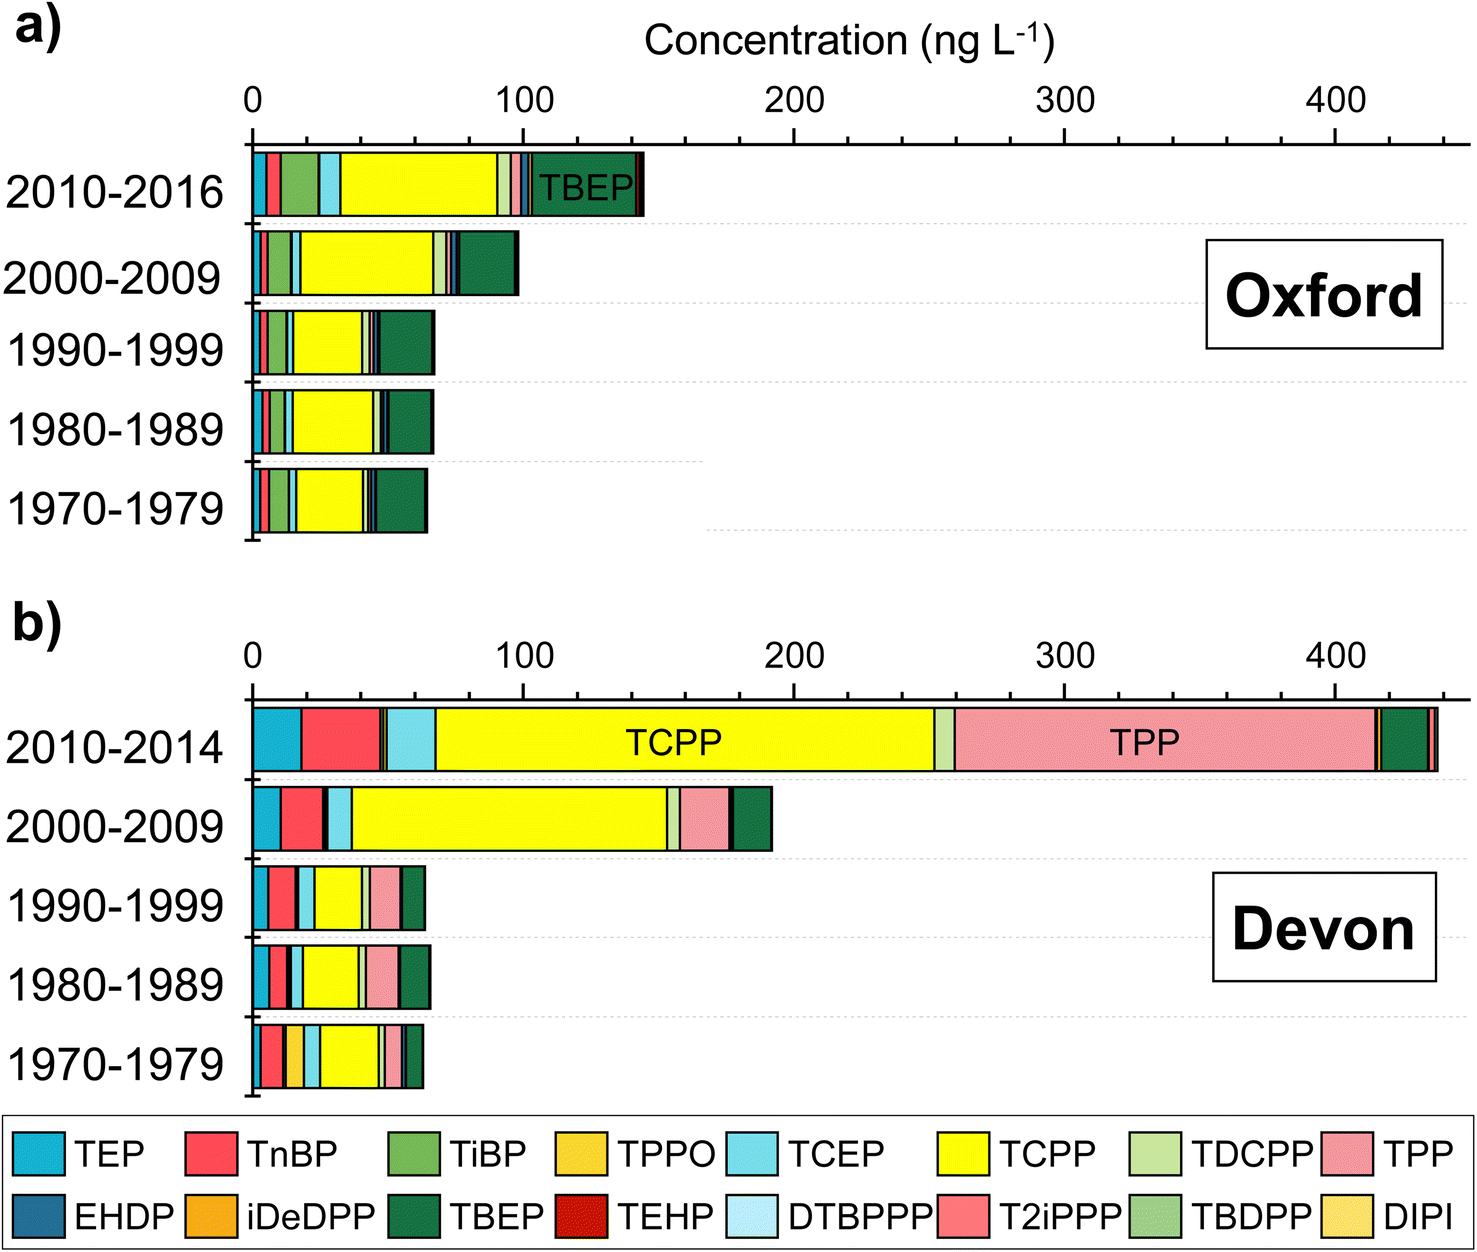 | ||
| Fig. 2 Multi-year binned average OPEs concentrations, ng L−1 in ice cores from (a) Mt. Oxford icefield and (b) Devon Ice Cap. Note that sampling year does not represent annual accumulation for Devon Ice Cap in 2015 and Mt. Oxford icefield in 2017. | ||
We are cognizant of the possibile impact of post-depositional processes on the profile of OPEs detected in ice cores such as melting, percolation, volatilization, and transformation. For example, Prats et al. 2022 interpreted the temperature-dependence gas phase concentrations of OPEs in the Pyrenees mountain range to be suggestive of volatilization from snow to air.49 However, there is uncertainty whether all OPEs are impacted as they observed a statistically-significant inverse temperature dependence on air concentrations for TCEP, TCPP and TPP but not TnBP nor TDCPP.49 In polar regions, consistently low temperatures should limit the occurrence of volatilization and may also limit their transformation, which is further supported by polar air sampling studies reporting OPEs existing primarily in the particle phase as opposed to gas-phase.50
These particular OPEs (TCEP, TCPP, TDCPP, TBOEP, TiBP, TnBP, and TPP) are predominant in other atmospheric samples including precipitation from Frankfurt, Germany4 and Albany, New York.51 Though Albany, NY and Frankfurt, Germany are highly populated and urban at latitudes approximately 33–45° south of Devon Ice Cap, OPE rainwater concentrations are similar to 2015 Devon Ice Cap ice concentrations. For example, median Frankfurt precipitation versus 2015 Devon Island ice corresponded to: 71 vs. 31 ng L−1 TCEP, 403 vs. 158 ng L−1 TCPP, 4 ng L−1vs. 12 ng L−1 TDCPP, and 21 ng L−1vs. 24 ng L−1 TBOEP.4 In precipitation from Albany, mean concentrations were 5.7 ng L−1 TCEP, 62 ng L−1 TCPP, 12 ng L−1 TDCPP, and 41 ng L−1 TBOEP and akin to the Devon Ice Cap, TDBPP and EHDPP were <MDL. In snow of the Laohugou and Hailuogou glaciers in the Tibetan Plateau, the ranked prominence of OPE congeners corresponded to TCEP, TCPP, TDCPP, TPP, TEP, and TnBP and the chlorinated OPEs accounted for 83% of the OPE profile.10 The similarity in OPE compositional profile in precipitation from urban centres may support the hypothesis of long range transport. While the similarity in absolute concentrations is also interesting, depositional flux is preferred for spatial comparisons.
The spatial pattern of OPEs in Arctic air has been developed from research over the last decade. Several studies used passive air samples and report air concentrations representing combined gas and particle phase concentrations. In the eastern Arctic, between Svalbard and East Greenland, ∑8OPEs concentration ranged from 50–100 pg m−3, with 95% of the concentration profile attributed to TCEP and TCPP.52 In air from Longyearbyen on Svalbard, Salamova et al. observed a predominance of TnBP (median 56 pg m−3), TCPP (57 pg m−3), and 63 pg m−3 TBOEP, though it should be noted that the sampling site was on top of the University Centre and cannot be considered a remote site.12 Similarly, in Ny-Ålesund on Svalbard, Li et al. (2022) reported mean air concentrations of 110 pg m−3 TCEP, 55 pg m−3 TCPP and 71 pg m−3 TnBP.53 Sühring et al. detected OPEs in air from the Canadian Arctic that demonstrated higher concentrations of OPEs in air associated with local point sources. For example, near the community of Resolute Bay (population 198) on Cornwallis Island, land-based air samples in 2012 had >2000 pg m−3 TnBP at 74.70°N, 94.83°W whereas in the ship-based air sampling near the same location (74.42°N, 95.07°W), TnBP was less than detection limits.13 Möller et al. also measured OPEs in the air mass above in the Bering and Chukchi Seas, near Alaska and Russia sampled onboard the research ice-breaker Xuelong (Snow Dragon): 85–529 pg m−3 TCPP and 126–585 pg m−3 TCEP as the major OPEs compared to <LOD – 5 pg m−3 TDCPP, 16–35 pg m−3 TiBP, and <LOQ – 36 pg m−3 TnBP.54 A similar cruise was conducted on the Xuelong in the Bering Strait and Chukchi Sea more recently in 2018 confirmed the prevalence of TCEP and TCPP in air samples.14 OPEs are also present in Antarctic air as confirmed recently by Hao et al. who reported the concentration of 7 OPE congeners in XAD-resin based passive air samplers in the Fildes Penninsula, West Antarctica.50 The same OPE congeners reported in this study were also detected in our samples: TnBP, TEHP, EDPP, TPP, TCPP, TDCPP, and TCEP.
In addition to OPE measurements in air samples in the Arctic, there have been a few cruises that also analyzed OPEs in water bodies in the Arctic. For example, McDonough et al. confirmed ocean circulation of OPEs in the Arctic through deployment of passive samplers in various locations in the Canadian Arctic Ocean and deep water in the Fram Strait with median water concentrations corresponding to 26 ng L−1 TnBP, 1200 ng L−1 TCEP, 166 ng L−1 TCPP, 114 ng L−1 TDCPP, 5 ng L−1 TPP and <LOD for TDBPP.55 The detection of OPEs in marine water and air suggest long range transport potential of OPEs.
Very high concentrations of TCPP were measured in the ice section from 2000 in Devon Ice Cap. This sample was extracted and analyzed twice and consistently high concentrations were measured in the duplicates (525–633 ng L−1), representing 84% of the total OPEs for the year 2000. This was an atypical year since TCPP was 58 ng L−1 in 1999 and 67 ng L−1 in 2001. The cause for such a high TCPP concentration in the section corresponding to the year 2000 in the Devon Ice Cap is unknown. For the same time period in the Mt. Oxford icefield ice core, the TCPP concentration was uniform and did not display a maxima based on a mean ± S.E. concentration of 39 ± 7 ng L−1 TCPP from 1999 to 2003. This discounted a common air mass source to both locations. One possibility is the contamination could arise from previous researchers including aircraft activity at the summit as there are field camps there each year. We cannot rule out the possibility of high TCPP levels driven by an episodic influx event, albeit curious that only TCPP and TPP were elevated in this sample and not other OPE congeners.
Iso-decyl diphenylphosphate (iDeDPP) was consistently detected in both locations. Reported uses of iDeDPP are as plasticizers and flame retardants in flexible polyvinyl chloride and minor uses in rubber, polyurethane, textile coatings, paint and pigment. The first environmental measurement of iDeDPP was in 2016 in fish from the Llobregat River in Spain, ranging from not detected to 851 ng g−1 lipid weight.56 Detection of iDeDPP in ice cores, further confirm its emission and propensity for atmospheric transport.
3.2 Flux of OPEs to the Arctic
Similar to contaminant analysis in sediment cores, ice core concentrations must be transformed to flux to ascertain temporal trends due to the inter-annual variation in accumulation. It is also best practice to compare spatial contaminant deposition based on flux and not concentration. Annual flux (F in year x, ng m−2 y−1), was calculated using eqn (1) by multiplying the OPE concentration (COPE, ng L−1) by the accumulation, based on total melted volume of sample (V in Litres) in that year and the radius of the corer (r in metres): | (1) |
Fluxes of OPEs to Devon Ice Cap and Mt. Oxford icefield are presented in Fig. 3. The fluxes are relatively high compared to other contaminant classes. In our previous research, we reported maximum fluxes of >C4 PFAS homologues corresponding to 10–150 ng m−2 y−1 in Devon Ice Cap cores obtained through the same sampling effort. In comparison, we report OPE congener fluxes as high as 100000 ng m−2 y−1. Na et al. estimated daily dry deposition fluxes of 70 ng m−2 d−1 for TCPP and 20 ng m−2 d−1 for TCEP based on their measurements in western Arctic air particulate via ship-based summertime sampling.14 This is consistent with our observations of annual OPEs flux on the order of μg m−2.
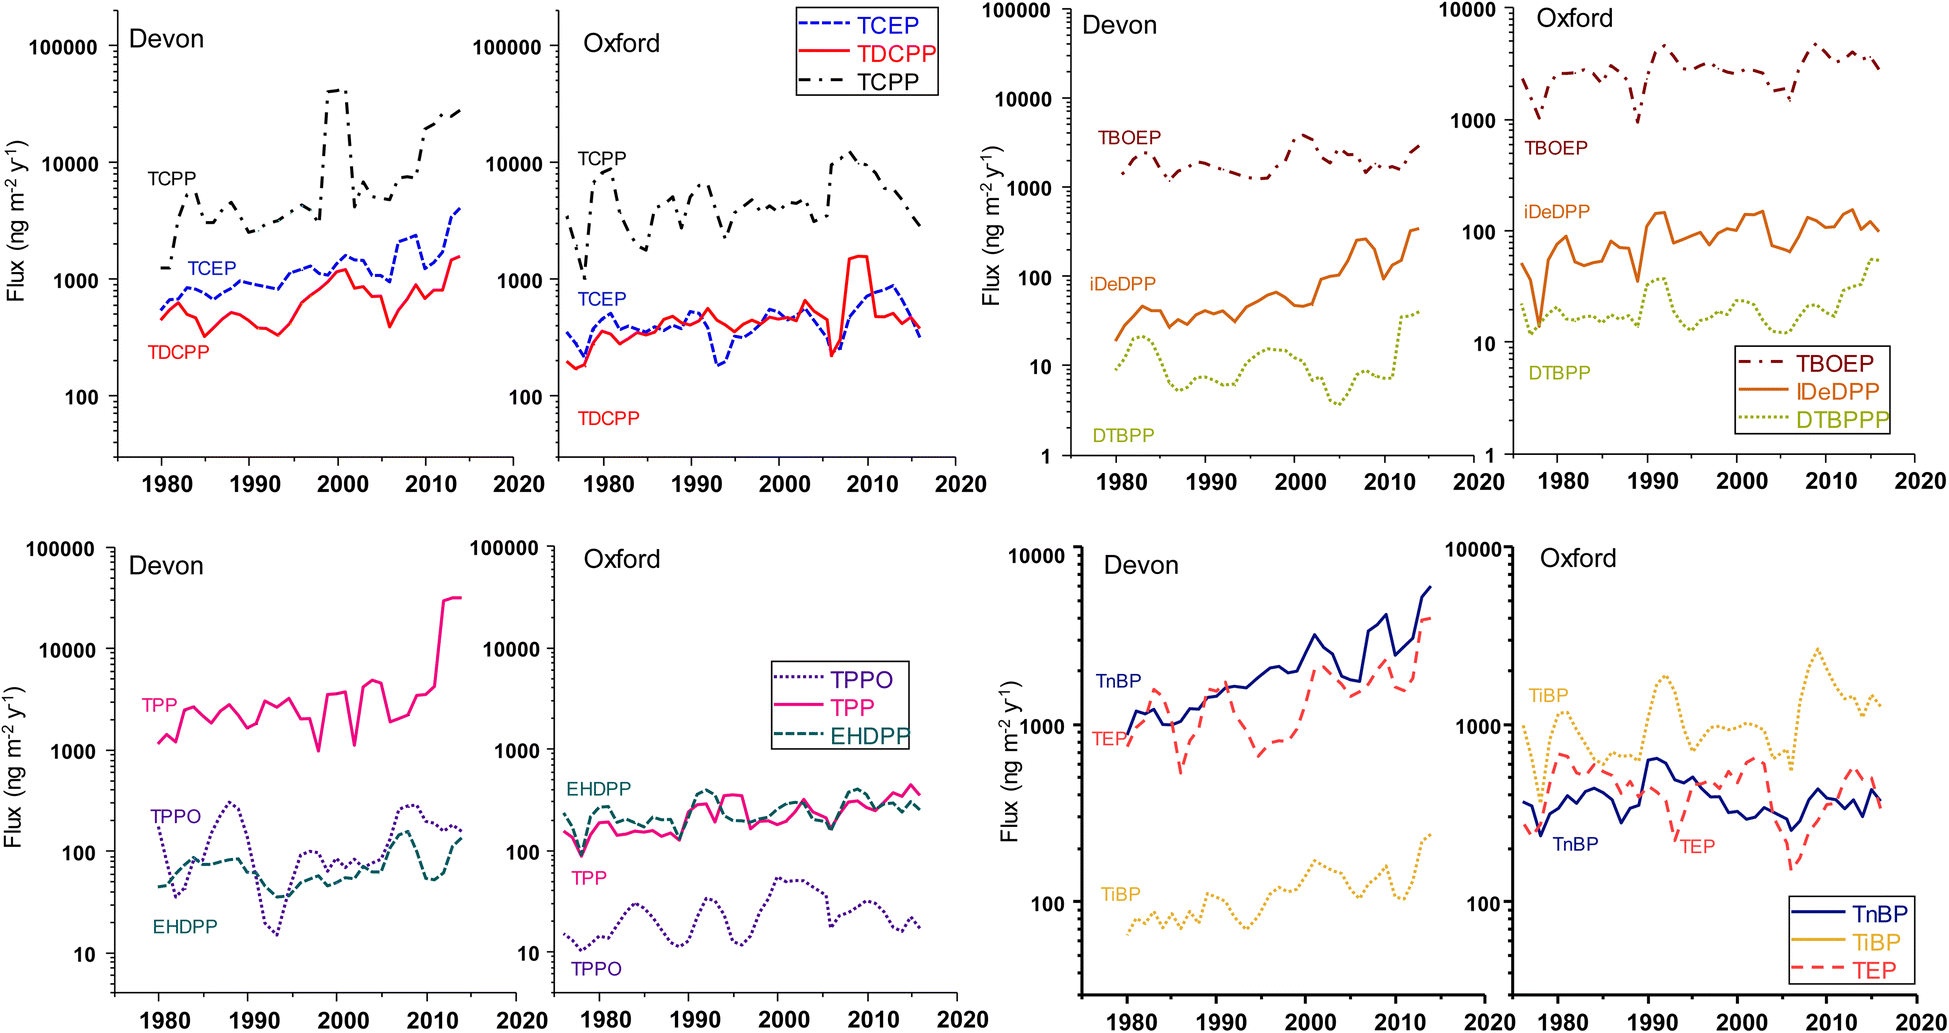 | ||
| Fig. 3 OPEs fluxes (ng m−2 y−1) in Devon Ice Cap (1979–2014) and Mt. Oxford icefield (1975–2016). | ||
In general, the majority of OPEs in Devon Ice Cap display an exponentially increasing depositional flux from 1979 to 2014. Using the slope from the natural log transformed flux versus time, doubling times were estimated for OPEs in Devon Ice Cap (Table S10†). The majority of the OPEs had doubling times between 10 and 35 years. The shortest doubling times corresponded to 10 ± 1.3 y for iDeDPP and 11 ± 2.6 y for TCPP in the Devon Ice Cap.
Interestingly, we do not see the increasing temporal trend in TCPP coincide with a diverging trend in TCEP and TDCPP but rather all three chlorinated OPE congeners increasing ensemble (Table S8†). The magnitude and rate of TCPP accumulation was larger than that of TDCPP and TCEP. This is generally consistent with reports of halogenated OPEs production shifting to TCPP as an alternative to TCEP and TDCPP, given recent legislation on TCEP and TDCPP. The State of California in USA under Proposition 65 has designated TCEP and TDCPP as carcinogens and the European Chemicals Agency has listed TCEP as a substance of high concern.57 Since 2011, five U.S. states have introduced legislation restricting the use of TDCPP and TCEP in children's products and in 2014, TCEP was prohibited in polyurethane foam in products for children in Canada.57 Thus, the depositional trends observed here seem to reflect the general usage shift to chlorinated OPEs (TCEP, TDCPP, and TCPP) and non-chlorinated aryl OPEs (i.e. TPP and EHDPP) as alternatives to penta-BDE (brominated diphenyl ether).58
At the Mt. Oxford site, the temporal trends varied. For TEP, TnBP, and TBOEP, fluxes did not present a statistically significant trend over 3 decades. Other OPEs demonstrated a significant linear (i.e., zero-order) rate of increase in flux. For example, linear regression of annual flux versus year had positive slopes corresponding to 4.9 ± 0.8 ng m−2 y−1 for TPP, 1.9 ± 0.4 ng m−2 y−1 for iDeDPP, 1.8 ± 0.2 ng m−2 y−1 for TEHP, 1.1 ± 0.2 ng m−2 y−1 for TBDPP, and 0.59 ± 0.01 ng m−2 y−1 DIPIPP. The chlorinated OPEs each had a parabolic trend in flux with increasing flux from the early 2000s and peak fluxes occurring in 2008 for TCPP, 2009 for TDCPP, and 2013 for TCEP, followed by a decline (Fig. S3, ESI†). Global production of TCPP, TDCPP, and TCEP has been high since the 1990s, exceeding 50000 tonnes.58 Both TCEP and TDCPP are reportedly replacement flame retardants for polybrominated diphenyl ether (PBDE) mixtures.59 The penta- and octa-BDE mixtures were largely phased out in 2004 and several BDEs are restricted under the Stockholm Convention on Persistent Organic Pollutants.60 Environmental sampling in remote regions suggests declines of PBDE occurred in the early 2000s, such as ringed seals (Pusa hispida botnica) in the Bothnian Bay in northern Baltic Sea61 demonstrated a decreasing trend of PBDEs post-2000 and post-2003 in migratory Arctic seabirds from Prince Leopold Island in the Canadian archipelago at 74.033°N, 90.083°W.62 Houde et al. found ΣPBDEs in ringed seals from east Baffin Island increased significantly from 1998 to 2008 and then decreased until the last time point in 2013. However, interestingly in the same study, no clear temporal trends in PBDEs were noted in Resolute Bay ringed seals between 2000 and 2013.63 This underscores the distinction between contaminant monitoring in marine mammals versus abiotic samples for long term trends. For marine mammals, contaminant trends reflect seawater trends, more than atmospheric deposition but also changes in diet, trophic status, and chemicals that are bioaccumulative. The increasing trends in chlorinated OPEs in Devon Ice Cap and Mt. Oxford icefield starting from the early 2000s coincide with the phase out of PBDE. However, there may be other inputs such as airport related activity driving correlations between TnBP and TCEP on the Devon Ice Cap, dissimilar to observations in Mt. Oxford, as discussed below.
To date, this is the longest temporal record of OPEs in the Arctic. Li et al. (2022) reported 7 congeners of OPEs in Svalbard air based on year-long deployments of passive samplers from 2011 to 2019.53 The temporal trends were based on annual concentrations (the volume of air sampled was not measured) and showed an increasing tendency over the eight-year period. Li et al. stated that annual mean concentrations of TCEP and TnBP increased with doubling times of 2.7 and 3.8 years, respectively.53
Differences in the OPE composition can likely be attributed to differences in air mass source delivery to the two sites. Ten-days back trajectory analyses in two separate years for the Devon Ice Cap core showed contributions from both European and North American air masses similar to previous studies,23 whereas the Mt. Oxford icefield core site was less influenced by North American sources (Fig. 4, S4 and S5, ESI†). This is consistent with other studies using long term back trajectory confirming western Russia and central Siberia as major source regions for aerosols to northern Ellesmere Island and Greenland.64 The use of back trajectory density analyses has its limitations as outlined by Kahl et al.35 In particular, the conditions at the source region must be favourable for emission and mixing to an appreciable height and the chemical must remain in the air column en route to the receptor site. As such, chemical tracers and pollen analysis in ice cores are also informative of source regions. Using chemical tracers, Gogo–Azuma and Koerner also determined Eurasia as the dominant source region for anthropogenic aerosols to Agassiz Ice Cap on Ellesmere Island whereas North America and Eurasia were both sources to the Penny Ice Cap on Baffin Island.65
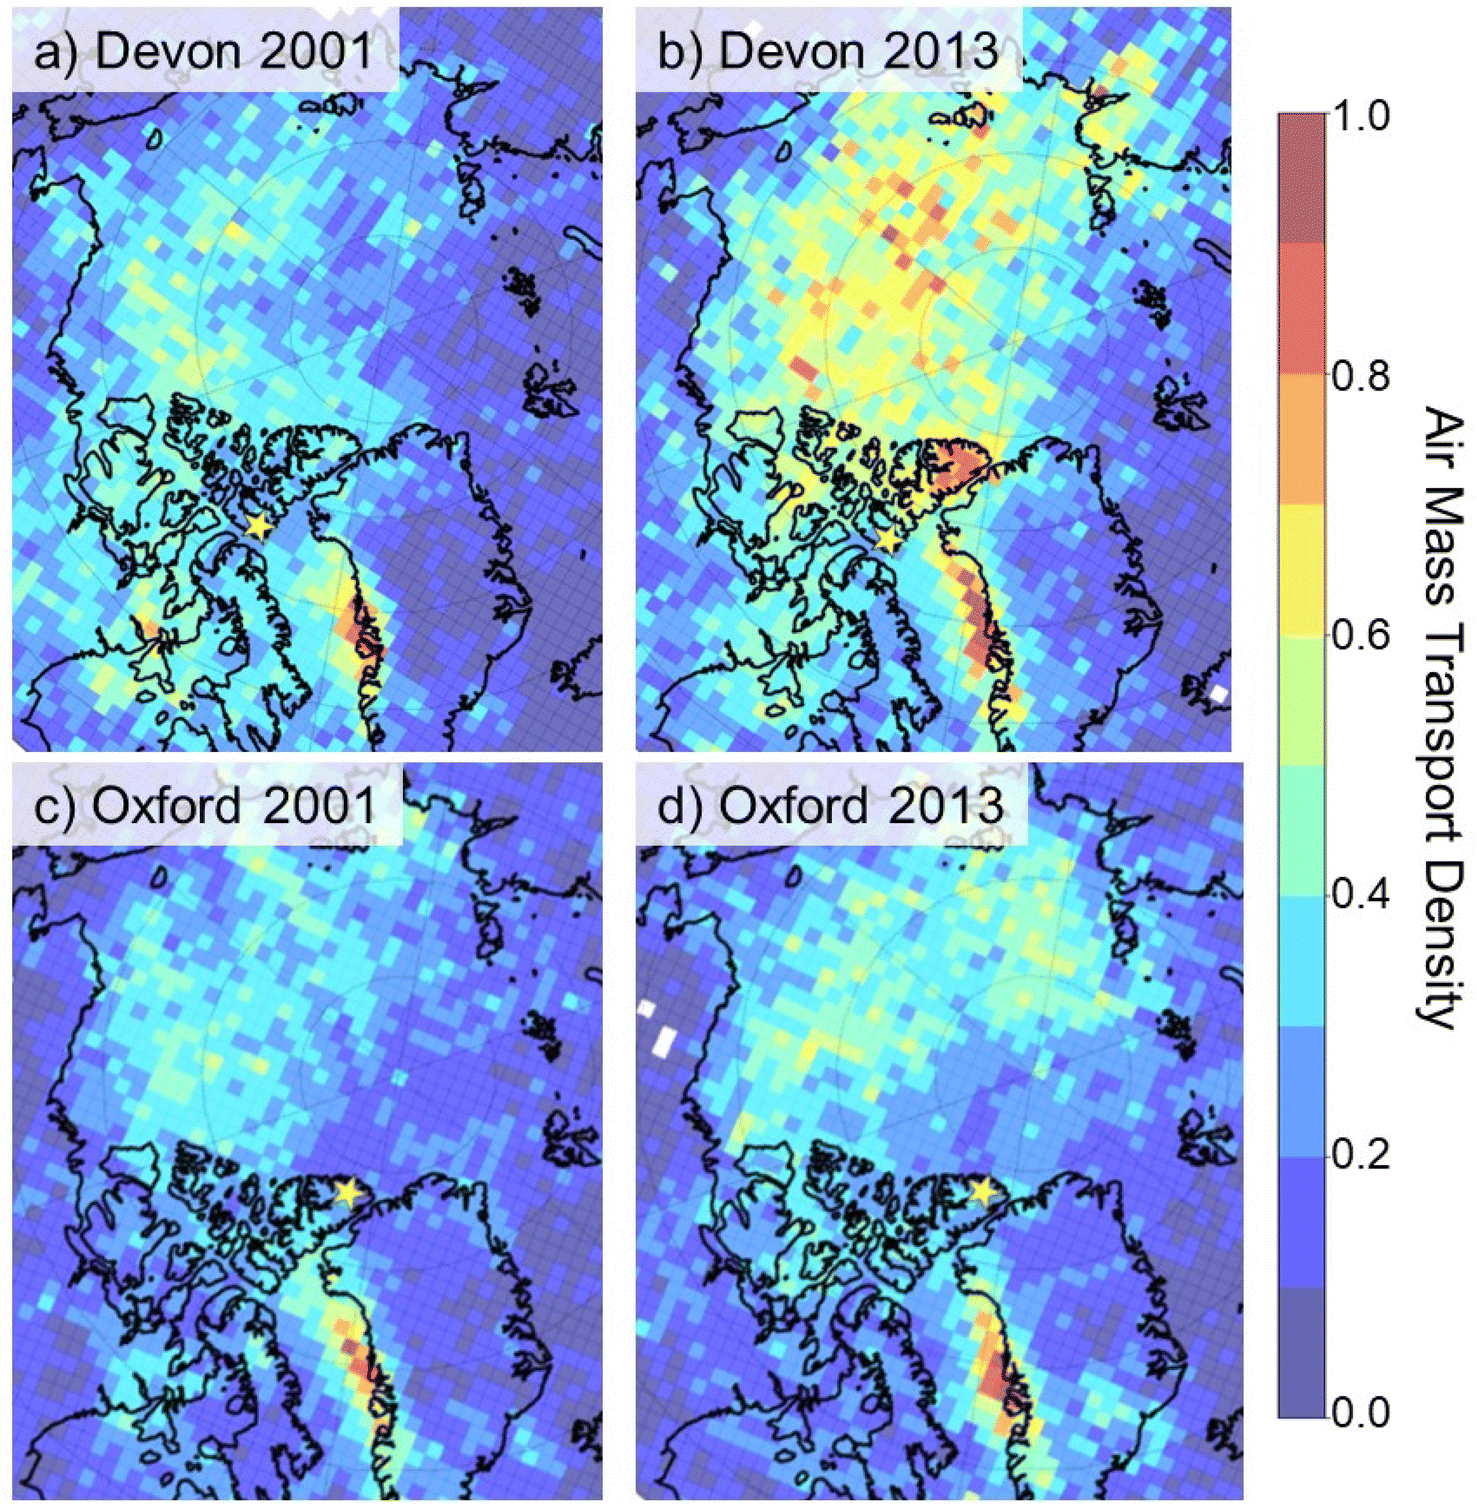 | ||
| Fig. 4 Air mass transport density (scaled 0 to 1) for air parcels reaching ice coring sites (indicated by star) on the Devon Ice Cap and Mt. Oxford icefield in 2001 and 2013. | ||
Local sources to both Devon Ice Cap and Mt. Oxford icefield cannot be excluded. In particular, the Devon Ice Cap is 120 km and 300 km away from the settlements of Grise Fiord and Resolute, respectively. The ice coring sites at Devon Ice Cap and Mt. Oxford icefield are 400 km and 500 km from Qaanaaq (77.467°N, 69.231°W), and the Thule air base (76.517°N, 68.716°W) in northwestern Greenland. Qaanaaq is a settlement of approximately 600 people. Previous research has suggested elevated OPEs can be linked to airports (Li et al. 2019).66 TnBP is used in a commercial airline fire-resistant hydraulic fluid13 and Li et al. (2022) noted higher OPE concentrations in air near a local airport in Ny-Ålesund, Svalbard.53 In our earlier study, we reported elevated concentrations (49–100 ng L−1) of ΣOPEs in lake water near Resolute Bay, particularly TCEP and TnBP, likely due to the local airport (Sun et al. 2020).15 However, the OPEs profile in Lake Hazen in northern Ellesemere Island downstream of Mt. Oxford icefield, was similar to other remote Arctic lakes with ΣOPEs corresponding to 5 to 10 ng L−1. Air filters from land-based sampling in Resolute Bay also had high concentrations of TnBP (median 416 pg m−3) and TCEP (median 135 pg m−3) compared to ship-based sampling (<LOD TnBP and 50 pg m−3 TCEP) in Barrow Strait within 100 km of Resolute.13
3.3 Correlations between OPE congeners
Many of the OPEs were correlated with each other in both coring sites (p < 0.05) (Tables S8 and S9†). The strongest correlation was TCEP with TnBP (Spearman correlation coefficient RS = 0.91, Fig. S6, ESI†), which was only observed in the Devon Ice Cap record and not in Mt. Oxford. TCEP is used as a flame retardant, plasticizer, and viscosity regulator in various types of polymers including polyurethanes, polyester resins, and polyacrylates. TnBP is also used as a plasticizer but not as a flame retardant. Li et al. found TCEP was highly correlated with TnBP in Arctic air in Svalbard (r > 0.8, p < 0.001) and characterized it as unexpected given the opposing uses as well as expected differences in transported pathways.53 In the Devon Ice Cap, TnBP was significantly correlated with other OPEs: TPP, TiBP, TDCPP and iDeDPP. In the Mt. Oxford icefield, TnBP occurred at a concentration lower by an order of magnitude compared to Devon Island and it was not correlated with any other OPEs. In Mt. Oxford icefield, one of the strongest correlations was between TiBP and TBOEP (RS = 0.86). The same correlation was detected in Devon Ice Cap but with a lower correlation coefficient (RS = 0.40). Möller et al. also found significant positive correlations amongst OPEs in air samples from the northern Pacific Ocean and the Arctic Ocean including a significant correlations of TnBP with TCEP (Pearson correlation coefficient RP= 0.798, p < 0.006) and TCPP (RP = 0.91, p < 0.00031).54 They hypothesized that nonhalogenated OPEs like TnBP may have similar atmospheric transport mechanisms to halogenated OPEs such as TCEP and TCPP. In addition, there may be a commonality in source and usage. Interestingly TCEP and TCPP were not correlated in Mt. Oxford icefield but were in the Devon Ice Cap. As mentioned earlier, TCPP is a possible replacement for TCEP and TDCPP in 2011–14. Perhaps continued monitoring of depositional trends in halogenated OPEs within the upper layers of firn will reflect some of the diverging trends in usage in time to come.3.4 Sources of OPEs to the Arctic
Contaminants are deposited to Devon Ice Cap via long range atmospheric transport from North America and Eurasia depending on the season.67,68 Arctic haze episodes occur between December and April in which Arctic atmospheric pollution from mid-latitudes is highest.69,70 During Arctic winters, particle pollution is highest due to local meteorological factors (minimal wet deposition, stratification and dryness of troposphere).71 Back trajectories show that air flow during winter is from Eurasia and not North America but for the remainder of the year, particulate pollution is at much lower concentrations.69 Mt Oxford icefield is likely less influenced by Arctic haze. Earlier research indicates that northern Ellesmere Island receives fewer Arctic haze events compared to research stations in Utqiagvik (previously known as Barrow) in Alaska, Station Nord in Greenland, Tiksi in Russia, and Zeppelin in Svalbard due to katabatic winds from the high mountain range.72,73 While seasonal deposition is likely to differ and would be useful to elucidate sources, we cannot assess this because we sectioned our ice cores by annum.Zhang et al. suggested that chlorinated OPEs are not expected to undergo long range transport through air (characteristic travel distance (CTD) < 200 km) or water (CTD < 600 km) based on a box model evaluation.16 These estimates are based on temperature-driven thermodynamic partitioning being the major contributor to long range transport. Kinetic advective phase-transfer processes are also likely to play an important role in global distribution of contaminants for which gas-particle interactions are important.74
For example, Friedman and Selin (2016) developed a spatial model describing the distribution of polychlorinated biphenyls in Arctic air using GEOS-Chem modeling, which included temperature-dependent partitioning between gas and particle phases.75 The observation of OPEs in remote regions, contrary to the predicted CTD, suggests that kinetic advective processes such as continuous removal of OPEs in northward moving air masses via wet and dry deposition may indeed be a significant delivery mechanism of OPEs to Arctic ecosystems. This effect has been observed for larger molecular weight polychlorinated biphenyls through sorption to atmospheric particles.74,75 Several studies have confirmed transport of OPEs via air particles in remote regions based on sampling in the Canadian Arctic and European Arctic.12,13,54 Na et al. measured OPE in both gas-phase and particle-bound fraction of air samples in the Bering Strait and Chukchi Sea with the fraction of particle-bound OPE comprising 71–93% of the air sample.14 Further they noted an increasing contribution of the particle bound OPE fraction along the latitudinal transect as temperatures dropped from the northwest Pacific to the Arctic. Of note, experimental derivation of gas-particle partitioning of OPEs is hindered by the artefacts introduced by glass fibre filters.13 Thus, while it is very likely that aerosol-mediated transport is relevant to OPEs, the distribution is not fully understood. In general, these observations suggest the northern polar regions may be a sink for OPE via long range transport followed by cold condensation.
Sühring et al. hypothesized that detection of chlorinated OPEs in Arctic air and seawater reflected their continued use in Asia and North America and also their environmental persistence.13 Sühring et al. also noted that the OECD models for long range transport and persistence were not suited for OPEs as they did not account for episodic atmospheric transport and underestimated environmental half-lives.76 Recent research has shown that the persistence of OPE when absorbed to air particulate is much longer than when in the gas phase77,78 introducing some uncertainty regarding the true atmospheric half-lives of OPEs, a quantity used in multi-media partitioning models for atmospheric long range transport estimation.
Thus, we propose that atmospheric aerosols are significant drivers of OPE long range transport to the High Arctic. Castro-Jimenez et al. observed OPEs in the atmosphere over the Mediterranean and Black Sea using ship-based aerosol sampling. In that study TCPP was the most abundant OPE, 540 to 2722 pg m−3 as well as TCEP, TDCPP, TiBP, and TnBP.79 Meyer et al. observed PBDE and hexabromocyclododecane (HBCDD) and BDE-209 in the Devon Ice Cap which are relatively non-volatile and hydrophobic.22 These contaminants were hypothesized to have deposited from atmospheric transport of particles. Recognizing that sodium is a major tracer for open ocean sea salt and sea ice salt,80 we find that sodium was not significantly correlated with individual OPE in ice from either site suggesting that marine sources are not major contributors to OPE in Devon Ice Cap. OPEs were also not correlated to tracers of crustal dust such as non-sea salt calcium (nssCa) and magnesium as evidenced by p-values>0.05. In the Devon Ice Cap samples, p-values and Spearman correlation coefficients for OPEs with nssCa were 0.18 < p < 0.98 (−0.0035 <Rs < 0.30) and with Mg were 0.22 < p < 0.94 (−0.20 <Rs < 0.27). In Mt. Oxford samples, p-values and Spearman correlation coefficients for OPEs with nssCa were 0.13 < p < 0.94 (−0.15 < Rs < 0.25) and with Mg were 0.23 < p < 0.98 (−0.048 < Rs < 0.19).
Several OPEs were significantly correlated to particle concentrations in the two highest size fractions, comprising 2.4 to 10 μm diameters (Fig. S7 and Table S11 ESI†) in both coring sites. In the Devon Ice Cap, the OPEs that were significantly correlated to the particle concentrations were TnBP, TiBP, TCEP, EHDPP, and iDeDPP with RS corresponding to 0.31 to 0.54 and p < 0.05. In the Mt. Oxford icefield, many of the same OPEs were correlated with particles: TnBP, TCEP, EHDPP, iDeDP, but not TiBP. Other OPEs were also correlated with particles in Mt. Oxford icefield: TEP, TPP, TBOEP, TEHP, DTBPP, T2iPP, and TBDPP. Insoluble particles in the ice core were determined using a laser sensor that determines light blockage attributed to insoluble particles in calibrated size bins. The exact composition of the insoluble particle cannot be discerned using this type of analysis and much of the literature38,81,82 attribute their identity to dust particles in the glacier, mainly due to horizons with high particle counts coinciding with additional analyses such as Al and Fe (and other crustal tracers) on filters or proxy evidence such as volcanic eruptions. More recent approaches have been developed to determine the geochemistry of insoluble particles in ice cores wherein time of flight mass spectrometry was used to investigate the elemental composition of dust particles.83 However, to the best of our knowledge, methods have not been applied to identify particle materials of anthropogenic origin such as synthetic fibers and microplastics. Given the widespread use of OPE in plastic materials, it is plausible that plastic particles are a vector of OPE to remote regions. Though little is known about the long range atmospheric transport potential of such materials, microplastics have been identified in Arctic snow and ice. In the remote French Pyrenees, Allen et al. observed microplastics in alpine atmospheric samples consisting of fragments, fibres and films comprised of polystyrene, polyethylene, polypropylene, polyvinyl chloride and polyethylene terephthalate, largely with diameters less than 25 μm.84 Microplastics have also been measured in multi-year sea ice throughout the circumpolar Arctic Ocean.85 Bergman et al. reported small (<100 μm) microplastics in Arctic snow on ice floes in the Fram Strait and Svalbard as well as snow from the Swiss Alps and non-remote area in Bavaria.86 In that research, marine transport via Arctic ice floes to be a vector of microplastics but they also highlight the possibility of airborne transport akin to mineral particles and pollen.86 Thus taken together, these research findings emphasize the need to characterize anthropogenic particles in Arctic ice and their potential association with contaminants such as OPE.
4 Conclusions
In summary we report depositional flux of OPEs to two areas in the Canadian Arctic indicating their ability to undergo long range transport as well as their ubiquitous presence. The more northern and remote site on Ellesmere Island had lower fluxes of OPEs than the Devon Ice Cap. These results suggest the atmospheric lifetime of OPEs is longer than predicted and also that transport to the Arctic may be occurring via aerosols including anthropogenic particles. Icefields in the circumpolar Arctic are shrinking due to climate warming and will likely be a source of OPEs through meltwater to downstream locations.Author contributions
ADS: conceptualization, methodology, validation, data curation, visualization, supervision and writing the original draft. CJY: conceptualization, methodology, project administration and funding acquisition. CS: formal analysis, methodology, and validation. AC: investigation, formal analysis, methodology, and resources. IL: investigation, methodology, funding acquisition and resources. DCGM and MS: funding acquisition, investigation and resources. All authors contributed writing, review and editing.Conflicts of interest
There are no conflicts to declare.Acknowledgements
This work was funded by the Northern Contaminants Program (CJY, ADS, MJS, DCGM, IL, ASC), Polar Continental Shelf Program (CJY, ASC, DCGM, IL), Natural Science and Engineering Research Council Discovery Grant (CJY and MJS) and Northern Research Supplement (MJS, IL). The authors thank Colleen Mortimer and Anja Rutishauser for assistance in sampling on Devon Ice Cap and Jocelyn Hirose on Mt. Oxford icefield. The authors acknowledge Cyril Cook, Heidi Pickard, John MacInnis, and Daniel Persaud for ice core sectioning.References
- G.-L. Wei, D.-Q. Li, M.-N. Zhu, Y.-S. Liao, Z.-Y. Xie, T.-L. Guo, J.-J. Li, S.-Y. Zhang and Z.-Q. Liang, Organophosphorus flame retardants and plasticizers: Sources, occurrence, toxicity and human exposure, Environ. Pollut., 2015, 196, 29–46 CrossRef CAS PubMed.
- A. Marklund, B. Andersson and P. Haglund, Screening of organophosphorus compounds and their distribution in various indoor environments, Chemosphere, 2003, 53, 1137–1146 CrossRef CAS PubMed.
- A. Bacaloni, F. Cucci, C. Guarino, M. Nazzari, R. Samperi and A. Lagana, Occurrence of organophosphorus flame retardant and plasticizers in three volcanic lakes of central Italy, Environ. Sci. Technol., 2008, 42, 1898–1903 CrossRef CAS PubMed.
- J. Regnery and W. Puttmann, Seasonal fluctuations of organophosphate concentrations in precipitation and storm water runoff, Chemosphere, 2010, 78, 958–964 CrossRef CAS PubMed.
- M. B. Woudneh, J. P. Benskin, G. Wang, R. Grace, M. C. Hamilton and J. R. Cosgrove, Quantitative determination of 13 organophosphorous flame retardants and plasticizers in a wastewater treatment system by high performance liquid chromatography tandem mass spectrometry, J. Chromatogr. A, 2015, 1400, 149–155 CrossRef CAS PubMed.
- A. K. Greaves, R. J. Letcher, D. Chen, D. J. McGoldrick and S. M. Backus, Retrospective analysis of organophosphate flame retardants in herring gull eggs and relation to the aquatic food web in the Laurentian Great Lakes of North America, Environ. Res., 2016, 150, 255–263 CrossRef CAS PubMed.
- J. D. Meeker, E. M. Cooper, H. M. Stapleton and R. Hauser, Urinary metabolites of organophosphate flame retardants: Temporal variability and correlations with house dust concentrations, Environ. Health Perspect., 2013, 121, 580–585 CrossRef PubMed.
- A. M. Sundkvist, U. Olofsson and P. Haglund, Organophosphorus flame retardants and plasticizers in marine and fresh water biota and in human milk, J. Environ. Monit., 2010, 12, 943–951 RSC.
- W. Cheng, L. Sun, W. Huang, T. Ruan, Z. Xie, P. Zhang, R. Ding and M. Li, Detection and distribution of Tris(2-chloroethyl) phosphate on the East Antarctic ice sheet, Chemosphere, 2013, 92, 1017–1021 CrossRef CAS PubMed.
- X. Zou, S. Hou, S. Wu, K. Liu, R. Huang, W. Zhang, J. Yu, Z. Zhan and H. Pang, The first detection of organophosphate esters (OPEs) of a high altitude fresh snowfall in the northeastern Tibetan Plateau, Sci. Total Environ., 2022, 838, 155615 CrossRef CAS PubMed.
- Z. Xie, Z. Wang, O. Magand, A. Thollot, R. Ebinghaus, W. Mi and A. Dommergue, Occurrence of legacy and emerging organic contaminants in snow at dome C in the Antarctic, Sci. Total Environ., 2020, 741, 140200 CrossRef CAS PubMed.
- A. Salamova, M. H. Hermanson and R. A. Hites, Organophosphate and halogenated flame retardants in atmospheric particles from a European Arctic site, Environ. Sci. Technol., 2014, 48, 6133–6140 CrossRef CAS PubMed.
- R. Sühring, M. L. Diamond, M. Scheringer, F. Wong, M. Pucko, G. Stern, A. Burt, H. Hung, P. Fellon, H. Li and L. M. Jantunen, Organophosphate Esters in Canadian Arctic Air: Occurrence, Levels and Trends, Environ. Sci. Technol., 2016, 50, 7409–7415 CrossRef PubMed.
- G. Na, C. Hou, R. Li, Y. G. Shi, H. S. Jin, Y. Gao, L. Jiao and Y. Cai, Occurrence, distribution, air-seawater exchange and atmospheric deposition of organophosphate esters (OPEs) from the Northwestern Pacific to the Arctic Ocean, Mar. Pollut. Bull., 2020, 157, 111243 CrossRef CAS PubMed.
- Y. Sun, A. O. De Silva, K. A. St Pierre, D. C. G. Muir, C. Spencer, I. Lehnherr and J. J. MacInnis, Glacial Melt Inputs of Organophosphate Ester Flame Retardants to the Largest High Arctic Lake, Environ. Sci. Technol., 2020, 54(5), 2734–2743 CrossRef CAS PubMed.
- X. Zhang, R. Sühring, D. Serodio, M. Bonnell, N. Sundin and M. L. Diamond, Novel flame retardants: Estimating the physical-chemical properties and environmental fate of 94 halogenated and organophosphate PBDE replacements, Chemosphere, 2016, 144, 2401–2407 CrossRef CAS PubMed.
- I. Liagkouridis, A. P. Cousins and I. T. Cousins, Physical-chemical properties and evaluative fate modelling of 'emerging' and 'novel' brominated and organophosphorus flame retardants in the indoor and outdoor environment, Sci. Total Environ., 2015, 524–525, 416–426 CrossRef CAS PubMed.
- L. Ye, J. Li, S. Gong, S. M. Herczegh, Q. Zhang, R. J. Letcher and G. Su, Established and emerging organophosphate esters (OPEs) and the expansion of an environmental contamination issue: a review and future directions, J. Hazard. Mater., 2023, 459, 132095 CrossRef CAS PubMed.
- A. Lippold, M. Harju, J. Aars, P. Blévin, J. Bytingsvik, G. W. Gabrielsen, K. M. Kovacs, J. L. Lyche, C. Lydersen, A. H. Rikardsen and H. Routti, Occurrence of emerging brominated flame retardants and organophosphate esters in marine wildlife from the Norwegian Arctic, Environ. Pollut., 2022, 315, 120395 CrossRef CAS PubMed.
- C. Yao, H. Yang and Y. Li, A review on organophosphate flame retardants in the enviornment: Occurrence, accumulation, metabolism and toxicity, Sci. Total Environ., 2021, 795, 148837 CrossRef CAS PubMed.
- J. J. Macinnis, K. French, D. C. G. Muir, C. Spencer, A. Criscitiello, A. O. De Silva and C. J. Young, Emerging investigator series: A 14-year depositional ice record of perfluoroalkyl substances in the High Arctic, Environ. Sci.: Processes Impacts, 2017, 19, 22–30 RSC.
- T. Meyer, D. C. G. Muir, C. Teixeira, X. Wang, T. Young and F. Wania, Deposition of brominated flame retardants to the Devon Ice Cap, Nunavut, Canada, Environ. Sci. Technol., 2012, 46, 826–833 CrossRef CAS PubMed.
- H. M. Pickard, A. S. Criscitiello, C. Spencer, M. J. Sharp, D. C. G. Muir, A. O. De Silva and C. J. Young, Continuous non-marine inputs of per- and polyfluoroalkyl substances to the High Arctic: a multi-decadal temporal record, Atmos. Chem. Phys., 2018, 18, 5045–5058 CrossRef CAS.
- C. J. Young, V. I. Furdui, J. Franklin, R. M. Koerner, D. C. G. Muir and S. A. Mabury, Perfluorinated acids in arctic snow: New evidence for atmospheric formation, Environ. Sci. Technol., 2007, 41, 3455–3461 CrossRef CAS PubMed.
- X. Zhang, T. Meyer, D. C. G. Muir, C. Teixeira, X. Wang and F. Wania, Atmospheric deposition of current use pesticides in the Arctic: Snow core records from the Devon Island Ice Cap, Nunavut, Canada, Environ. Sci.: Processes Impacts, 2013, 15, 2304–2311 RSC.
- H. M. Pickard, A. S. Criscitiello, D. Persaud, C. Spencer, D. C. G. Muir, I. Lehnherr, M. J. Sharp, A. O. De Silva and C. J. Young, Ice Core Record of Persistent Short-Chain Fluorinated Alkyl Acids: Evidence of the Impact From Global Environmental Regulations, Geophys. Res. Lett., 2020, 47, e2020GL087535 CrossRef CAS.
- W. Colgan and M. Sharp, Combined oceanic and atmospheric influences on net accumulation on Devon Ice Cap, Nunavut, Canada, J. Glaciol., 2008, 54, 28–40 CrossRef.
- J. England, I. R. Smith and D. J. A. Evans, The last glaciation of east-central Ellesmere Island, Nunavut: ice dynamics, deglacial chronology, and sea level change, Can. J. Earth Sci., 2000, 37, 1355–1370 CrossRef.
- E. Steinbring, R. Carlberg, B. Croll, G. Fahlman, P. Hickson, L. Ivanescu, B. Leckie, T. Pfrommer and M. Schoeck, First Assessment of Mountains on Northwestern Ellesmere Island, Nunavut, as Potential Astronomical Observing Sites, Publ. Astron. Soc. Pac., 2010, 122, 1092–1108 CrossRef.
- A. White and L. Copeland, Area change of glaciers across northern Ellesmere Island, Nunavut, between 1999 and 2015, J. Glaciol., 2018, 64, 609–623 CrossRef.
- P. P. Dunphy and J. E. Dibb, 137Cs gamma-ray detection at Summit, Greenland, J. Glaciol., 1994, 40, 87–92 CrossRef CAS.
- M. Arienzo, J. McConnell, N. Chellman, A. Criscitiello, M. Curran, D. Fritzsche, S. Kipfstuhl, R. Mulvaney, M. Nolan, T. Opel, M. Sigl and J. P. Steffensen, A Method for Continuous 239Pu Determinations in Arctic and Antarctic Ice Cores, Environ. Sci. Technol., 2016, 50, 7066–7073 CrossRef CAS PubMed.
- A. Criscitiello, T. Geldsetzer, R. Rhodes, M. Arienzo, J. McConnell, N. Chellman, M. Osman, J. Yackel and S. Marshall, Marine aerosol records of Arctic sea-ice and polynya variability from New Ellesmere and Devon Island Firn Cores, Nunavut, Canada, J. Geophys. Res.: Oceans, 2021, 126, 2169–9291 Search PubMed.
- A. S. Criscitiello, S. J. Marshall, M. J. Evans, C. Kinnard, A.-L. Norman and M. J. Sharp, Marine aerosol source regions to Prince of Wales Icefield, Ellesmere Island, and influence from the tropical Pacific, 1979–2001, J. Geophys. Res.: Atmos., 2016, 121, 9492–9507 CrossRef CAS.
- J. D. Kahl, D. A. Martinez, H. Kuhns, C. I. Davidson, J.-L. Jaffrezo and J. M. Harris, Air mass trajectories to Summit, Greenland: A 44-year climatology and some episodic events, J. Geophys. Res., 1997, 102, 26861–26875 CrossRef.
- B. G. Kopec, X. Feng, E. S. Posmentier and L. J. Sonder, Seasonal deuterium excess variations of precipitation at Summit, Greenland, and their Climatological Significance, J. Geophys. Res.: Atmos., 2018, 124, 72–91 CrossRef.
- K. Goto-Azuma, R. M. Koerner and D. A. Fisher, An ice-core record over the last two centuries from Penny Ice Cap, Baffin Island, Canada, Ann. Glaciol., 2002, 35, 29–35 CrossRef CAS.
- J. McConnell, A. Wilson, A. Stohl, M. Arienzo, N. Chellman, S. Eckhardt, E. Thompson, A. Pollard and J. Steffensen, Lead pollution recorded in Greenland ice indicates European emissions tracked plagues, wars, and imperial expansion during antiquity, Proc. Natl. Acad. Sci. U. S. A., 2018, 115, 5726–5731 CrossRef CAS PubMed.
- J. Jouzel, R. B. Alley, K. M. Cuffey, W. Dansgaard, P. Grootes, G. Hoffmann, S. J. Johnsen, R. D. Koster, D. Peel, C. A. Shuman, M. Stievenard, M. Stuiver and J. White, Validity of the temperature reconstruction from water isotopes in ice cores, J. Geophys. Res., 1997, 102, 26471–26487 CrossRef CAS.
- D. P. Schneider, E. J. Steig and T. Van Ommen, High-resolution ice-core stable isotopic records from Antarctica: towards interannual climate reconstructions, Ann. Glaciol., 2005, 41, 63–70 CrossRef CAS.
- M. F. Simonsen, G. Baccolo, T. Blunier, A. Borunda, B. Delmonte, R. Frei, S. Goldstein, A. Grinsted, H. A. Kjær, T. Sowers, A. Svensson, B. Vinther, D. Vladimirova, G. Winckler, M. Winstrup and P. Vallelonga, East Greenland ice core dust record reveals timing of Greenland ice sheet advance and retreat, Nat. Commun., 2019, 10, 4494 CrossRef PubMed.
- U. Ruth, D. Wagenbach, J. P. Steffensen and M. Bigler, Continuous record of microparticle concentration and size distribution in the central Greenland NGRIP ice core during the last glacial period, J. Geophys. Res.: Atmos., 2003, 108, 4098 CrossRef.
- R. Rodil, J. B. Quintana and T. Reemtsma, Liquid chromatography - tandem mass spectrometry determination of nonionic organophosphorus flame retardants and plasticizers in wastewater samples, Anal. Chem., 2005, 77, 3083–3089 CrossRef CAS PubMed.
- W. A. Stubbings, N. Riddell, B. Chittim and M. Venier, Challenges in the analyses of organophosphate esters, Environ. Sci. Technol. Lett., 2017, 4, 292–297 CrossRef CAS.
- D. Helsel, Nondetects and Data Analysis: Statistics for Censored Environmental Data, Wiley, 2005 Search PubMed.
- Government of Canada, Updated Risk Management Scope for 2-Propanol, 1-chloro-, Phosphate (3:1) (TCPP) and 2-Propanol, 1,3-dichloro-, Phosphate 3 (TDCPP), 2020 Search PubMed.
- Government of Canada, Draft screening assessment flame retardants group, 2021, https://www.canada.ca/en/environment-climate-change/services/evaluating-existing-substances/draft-screening-assessment-flame-retardants-group.html Search PubMed.
- E. Verbruggen, J. Rila, T. Traas, C. Posthuma-Doodeman and R. Posthumus, Environmental Risk Limits for Several Phosphate Esters with Possible Application as Flame Retardant, RIVM report, 2005, 601501024/2005 Search PubMed.
- R. Prats, B. van Droog, P. Fernández and J. Grimalt, Occurrence and temperature dependence of atmospheric gas-phase organophosphate esters in high-mountain areas (Pyrenees), Chemosphere, 2022, 292, 133467 CrossRef CAS PubMed.
- Y. Hao, S. Xiong, P. Wang, R. Yang, Z. Pei, Y. Li, Q. Zhang and G. Jiang, Novel brominated and organophosphate flame retardants in the atmosphere of Fildes Peninsula, West Antarctica: Continuous observations from 2011 to 2020, J. Hazard. Mater., 2022, 440, 129776 CrossRef CAS PubMed.
- U.-J. Kim and K. Kannan, Occurrence and Distribution of Organophosphate Flame Retardants/Plasticizers in Surface Waters, Tap Water, and Rainwater: Implications for Human Exposure, Environ. Sci. Technol., 2018, 52, 5625–5633 CrossRef CAS PubMed.
- J. Li, Z. Xie, W. Mi, S. Lai, C. Tian, K.-C. Emeis and R. Ebinghaus, Organophosphate esters in air, snow, and seawater in the North Atlantic and the Arctic, Environ. Sci. Technol., 2017, 51, 6887–6896 CrossRef CAS PubMed.
- Y. Li, S. Xiong, Y. Hao, R. Yang, Q. Zhang, F. Wania and G. Jiang, Organophosphate esters in Arctic air from 2011 to 2019: Concentrations, temporal trends, and potential sources, J. Hazard. Mater., 2022, 434, 122872 Search PubMed.
- A. Möller, R. Sturm, Z. Y. Xie, M. H. Cai, J. F. He and R. Ebinghaus, Organophosphorus flame retardants and plasticizers in airborne particles over the Northern Pacific and Indian Ocean toward the polar regions: evidence for global occurrence, Environ. Sci. Technol., 2012, 46, 3127–3134 CrossRef PubMed.
- C. A. McDonough, A. O. De Silva, C. Sun, A. Cabrerizo, D. Adelman, T. Soltwedel, E. Bauerfeind, D. C. G. Muir and R. Lohmann, Dissolved organophosphate esters and polybrominated diphenyl ethers in remote marine environments: Arctic surface water distributions and net transport through Fram Strait, Environ. Sci. Technol., 2018, 52, 6208–6216 CrossRef CAS PubMed.
- G. Santin, E. Eljarrat and D. Barcelo, Simultaneous determination of 16 organophosphorus flame retardants and plasticizers in fish by liquid chromatography-tandem mass spectrometry, J. Chromatogr. A, 2016, 1441, 34–43 CrossRef CAS PubMed.
- E. Schreder, N. Uding and M. La Guardia, Inhalation a significant exposure route for chlorinated organophosphate flame retardants, Chemosphere, 2016, 150, 499–504 CrossRef CAS PubMed.
- I. van der Veen and J. de Boer, Phosphorus flame retardants: Properties, production, environmental occurrence, toxicity and analysis, Chemosphere, 2012, 88, 1119–1153 CrossRef CAS PubMed.
- H. Stapleton, S. Sharma, G. Getzinger, P. Ferguson, M. Gabriel, T. Webster and A. Blum, Novel and high volume use flame retardants in US couches reflective of the 2005 pentaBDE phase out, Environ. Sci. Technol., 2012, 46, 13432–13439 CrossRef CAS PubMed.
- UNEP, SC-4/18: Listing of Tetrabromodiphenyl Ether and Pentabromodiphenyl Ether, United Nations Environmental Program, Stockholm Convention on POPs, 2007 Search PubMed.
- F. Bjurlid, A. Roos, I. Ericson Jogsten and J. Hagberg, Temporal trends of PBDD/Fs, PCDD/Fs, PBDEs and PCBs in ringed seals from the Baltic Sea (Pusa hispida botnica) between 1974 and 2015, Sci. Total Environ., 2018, 616–617, 1374–1383 CrossRef CAS PubMed.
- B. M. Braune, R. J. Letcher, A. J. Gaston and M. L. Mallory, Trends of polybrominated diphenyl ethers and hexabromocyclododecane in eggs of Canadian Arctic seabirds reflect changing use patterns, Environ. Res., 2015, 142, 651–661 CrossRef CAS PubMed.
- M. Houde, X. Wang, S. Ferguson, P. Gagnon, T. Brown, S. Tanabe, T. Kunito, M. Kwan and D. C. G. Muir, Spatial and temporal trends of alternative flame retardants and polybrominated diphenyl ethers in ringed seals (Phoca hispida) across the Canadian Arctic, Environ. Pollut., 2017, 223, 266–276 CrossRef CAS PubMed.
- E. Freud, R. Krejci, P. Tunved, R. Leaitch, Q. T. Nguyen, A. Massling, H. Skov and L. Barrie, Pan-Arctic aerosol number size distributions: seasonality and transport patterns, Atmos. Chem. Phys., 2017, 17, 8101–8128 CrossRef CAS.
- K. Goto-Azuma and R. Koerner, Ice core studies of anthropogenic sulfate and nitrate trends in the Arctic, J. Geophys. Res.: Atmos., 2001, 106, 4959–4969 CrossRef CAS.
- W. Li, Y. Wang and K. Kannan, Occurrence, distribution, and human exposure to 20 organophosphate esters in air, soil, pine needles, river water, and dust samples collected around an airport in New York State, United States, Environ. Int., 2019, 131, 105054 CrossRef CAS PubMed.
- T. Meyer, D. C. G. Muir, C. Teixeira, X. Wang, T. Young and F. Wania, Deposition of Brominated Flame Retardants to the Devon Ice Cap, Nunavut, Canada, Environ. Sci. Technol., 2012, 46, 826–833 CrossRef CAS PubMed.
- M. Krachler, J. Zheng, R. Koerner, C. Zdanowicz, D. Fisher and W. Shotyk, Increasing atmospheric antimony contamination in the northern hemisphere: snow and ice evidence from Devon Island, Arctic Canada, J. Environ. Monit., 2005, 7, 1169–1176 RSC.
- L. Barrie, Arctic air pollution: An overview of current knowledge, Atmos. Environ., 1986, 20, 643–663 CrossRef CAS.
- J. Abbatt, W. Leaitch, A. Aliabadi, A. Bertram, J.-P. Blanchet, A. Boivin-Rioux, H. Bozem, J. Burkart, R. Chang, J. Charatte, J. Chaubey, R. Christensen, A. Cirisan, D. Collins, B. Croft, J. Dionne and G. Evans, Overview paper: new insights into aerosol and climate in the Arctic, Atmos. Chem. Phys., 2019, 19, 2527–2560 CrossRef.
- A. Stohl, Characteristics of atmospheric transport into the Arctic troposphere, J. Geophys. Res., 2006, 111, D11306 CrossRef.
- P. Quinn, G. Shaw, E. Andrews, E. Dutton, T. Ruoho-Airola and S. Gong, Arctic haze: current trends and knowledge gaps, Tellus, 2007, 59B, 99–114 CrossRef CAS.
- M. Willis, W. Leaitch and J. Abbatt, Processes controlling the composition and abundance of Arctic aerosol, Rev. Geophys., 2018, 56, 621–671 CrossRef.
- K. J. Hageman, C. Bogdal and M. Scheringer, Chapter 11 Long-Range and Regional Atmospheric Transport of POPs and Implications for Global Cycling, Compr. Anal. Chem., 2015, 67, 363–387 CAS.
- C. Friedman and N. Selin, PCBs in the Arctic atmosphere: determining important driving forces using a global atmospheric transport model, Atmos. Chem. Phys., 2016, 16, 3433–3448 CrossRef CAS.
- R. Sühring, M. Scheringer, T. F. M. Rodgers, L. M. Jantunen and M. L. Diamond, Evaluation of the OECD POV and LRTP screening tool for estimating the long-range transport of organophosphate esters, Environ. Sci.: Processes Impacts, 2020, 22, 207–216 RSC.
- Y. Liu, L. Huang, S. M. Li, T. Harner and J. Liggio, OH-initiated heterogeneous oxidation of tris-2-butoxyethyl phosphate: Implications for its fate in the atmosphere, Atmos. Chem. Phys., 2014, 14, 12195–12207 CrossRef.
- J. Liu, J. Liggio, T. Harner, L. Jantunen, M. Shoeib and S.-M. Li, Heterogeneous OH Initiated oxidationL a possible explanation for the persistence of organophosphate flame retardants in air, Environ. Sci. Technol., 2014, 48, 1041–1048 CrossRef PubMed.
- J. Castro-Jiménez, N. Berrojalbiz, M. Pizarro and J. Dachs, Organophosphate ester (OPE) flame retardants and plasticizers in the open mediterranean and black seas atmosphere, Environ. Sci. Technol., 2014, 48, 3203–3209 CrossRef PubMed.
- R. Rhodes, X. Yang, E. Wolff, J. McConnell and M. Frey, Sea ice as a source of sea salt aerosol to Greenland ice cores: a model-based study, Atmos. Chem. Phys., 2017, 17, 9417–9433 CrossRef CAS.
- P. Bohleber, N. Stoll, M. Rittner, M. Roman, I. Weikusat and C. Barbante, Geochemical characterization of insoluble particle cllusters in ice cores using two-dimensional impurity imaging, Geochem., Geophys., Geosyst., 2022, 24, e2022GC010595 CrossRef.
- M. Ram and R. I. Gayley, Insoluble particles in polar ice: Identification and measurement of the insoluble background aerosol, Geophys. Res. Lett., 1994, 21, 437–440 CrossRef.
- T. Erhardt, C. M. Jensen, O. Borovinskaya and H. Fischer, Single Particle Characterization and Total Elemental Concentration Measurements in Polar Ice Using Continuous Flow Analysis-Inductively Coupled Plasma Time-of-Flight Mass Spectrometry, Environ. Sci. Technol., 2019, 53, 13275–13283 CrossRef PubMed.
- S. Allen, D. Allen, V. R. Phoenix, G. Le Roux, P. Durántez Jiménez, A. Simonneau, S. Binet and D. Galop, Atmospheric transport and deposition of microplastics in a remote mountain catchment, Nat. Geosci., 2019, 12, 339–344 CrossRef CAS.
- I. Peeken, S. Primpke, B. Beyer, J. Gütermann, C. Katlein, T. Krumpen, M. Bergmann, L. Hehemann and G. Gerdts, Arctic sea ice is an important temporal sink and means of transport for microplastic, Nat. Commun., 2018, 9, 1505 CrossRef PubMed.
- M. Bergman, S. Mützel, S. Primpke, M. B. Tekman, J. Trachsel and G. Gerdts, White and wonderful? Microplastics prevail in snow from the Alps to the Arctic, Sci. Adv., 2019, 5, eaax1157 CrossRef PubMed.
Footnote |
| † Electronic supplementary information (ESI) available. See DOI: https://doi.org/10.1039/d3em00215b |
| This journal is © The Royal Society of Chemistry 2023 |