
Comparative techno-economic analysis of different PV-assisted direct solar hydrogen generation systems†
Astha
Sharma
 *a,
Thomas
Longden
b,
Kylie
Catchpole
a and
Fiona J.
Beck
a
*a,
Thomas
Longden
b,
Kylie
Catchpole
a and
Fiona J.
Beck
a
aSchool of Engineering, The Australian National University, Canberra, Australian Capital Territory, Australia. E-mail: fiona.beck@anu.edu.au
bCrawford School of Public Policy, The Australian National University, Canberra, Australian Capital Territory, Australia
First published on 15th August 2023
Abstract
Photovoltaic (PV) assisted direct solar hydrogen generation (DSHG) is an alternative pathway for large-scale renewable hydrogen generation, where solar energy is directly used to drive water splitting in a compact integrated system. Despite promising improvements in efficiency, the robust technoeconomic analysis required to quantitatively understand the opportunities and challenges of using DSHG to reduce the cost of renewable hydrogen production has been lacking. Herein, we compare three different DSHG module configurations with varying levels of integration between PV and electrocatalysts, covering the variety of different systems that have been proposed in the literature. Photoelectrochemical (PEC) configurations have the highest level of integration, with catalyst directly coated on the PV components to form photoelectrodes. In contrast, PV–electrochemical configurations (PV–EC) consist of series connected photovoltaic and electrochemical (EC) components connected via wires. It is also possible to decouple PV–EC systems, such that the PV and EC components are connected through a dc–dc convertor to optimize power management. Our analysis demonstrates that the cost of hydrogen produced by these systems depends on the configuration, and that the decoupled PV–EC systems produce the lowest cost hydrogen. Regression analysis identifies membrane cost and lifetime, gas handling and compression, and O&M as the key cost components impacting the LCOH. Comparison of DSHG and PV–Electrolysers (PV–E) highlights the conditions under which DSHG could out-compete PV–E, emphasizing it is a competitive technology within the uncertainty of the analysis. Using these results, we identify where research efforts should focus to drive down the cost for large scale deployment of DSHG systems to achieve LCOH of <2 $ per kgH2.
Broader contextProviding renewable alternatives for industrial fuel and feedstock will require an extremely rapid scale-up of renewable hydrogen production within the next few decades. It is an open question whether costs will come down quickly enough to be competitive with fossil fuel alternatives in time to meet global zero-emissions targets. Direct solar hydrogen generation systems (DSHG) combine photovoltaic components that convert sunlight into electrical energy and electrocatalytic components that convert electrical into chemical energy in hydrogen bonds in a single system, potentially reducing the levelized cost of hydrogen (LCOH) by lowering capital costs. The demonstration of >20% efficient solar-to-hydrogen conversion in the last few years has driven interest in scaling up and commercialising this technology, with the goal of realising low-cost, large-scale renewable hydrogen generation. Despite this, the competitiveness of these systems against standard solar powered electrolysis has not been clarified in the literature. Previous technoeconomic studies have focussed on different DSHG designs, and have reached different conclusions regarding the relative competitiveness of DSHG vs. off-grid solar powered electrolysers. This study provides a robust technoeconomic analysis of plant level DSHG systems to understand the opportunities and challenges of deploying DSHG to reduce the cost of renewable hydrogen production. |
1. Introduction
The global energy sector needs to transition away from fossil fuels by 2050 in order to meet the emissions targets necessary to keep global temperature rise below 1.5 °C.1 Providing renewable alternatives for industrial fuel and feedstock will require an extremely rapid scale up of renewable hydrogen production. Projections from the International Energy Agency's Net Zero by 2050 roadmap suggest that low carbon hydrogen production will need to increase from a base of less than 1 mega ton per annum (Mtpa) in 2020, to over 450 Mtpa in 2050.2 However, most analyses show that the cost of producing renewable hydrogen is not yet competitive with fossil fuels for most applications.3–6 Target costs for renewable hydrogen have been set at USD 2 per Kg by 2026 by UN Green Hydrogen Catapult initiative,7 and USD 1 $ per kg within a decade by the US Earth-shot initiative.8 While the IEA and International Renewable Energy Agency (IRENA) have projected that electrolysers will reduce in cost due to the combination of standardisation of electrolyser units and scale up of manufacturing,2,9 it is an open question whether costs will come down quickly enough to meet global zero-emissions targets.2,10 In this context, exploring new pathways for producing renewable hydrogen is important to drive deeper, more rapid cost reductions.Direct solar hydrogen generation (DSHG) is an alternate approach for renewable hydrogen production which combines photovoltaic components that convert sunlight into electrical energy and electrocatalytic components that convert electrical into chemical energy in hydrogen bonds in a single system.11 The integrated system eliminates the need for separate power generation and electrolyser plant, as well as complex power infrastructure, potentially reducing the levelized cost of hydrogen (LCOH) by lowering capital costs. We distinguish PV-assisted DSHG from photocatalytic (PC) approaches that use semiconductor particles coated with catalysts. Photocatalytic hydrogen generation has the potential for very low material and fabrication costs, at the expense of efficiency,12 and will require different plant designs and optimisations different than PV-assisted DSHG systems.
A variety of PV-assisted DSHG configurations have been reported in the literature exploring different semiconductors, catalysts, and integration strategies.13,14 While there are many different approaches, there is a consensus that a combination of low-cost materials and high solar-to-hydrogen efficiency is key to minimise the levelized cost of DSHG.15 Target figures of merit have been set by the US department of energy (US-DOE) to promote the development of competitive DSHG technologies, including a solar-to-hydrogen energy conversion (STH) efficiency of 25% and a system lifetime of at least 10 years.16
Sustained research has driven advances in the performance of DSHG systems, achieving the STH efficiencies above 15%.17–22 Of particular interest are potentially low-cost systems that leverage the advances made in silicon solar cells by the PV industry over the past decade, coupled with earth abundant catalysts.17–20 For example, we have recently demonstrated low-cost DSHG systems with STH efficiency of 20% using perovskite-silicon tandem solar cells.23 Similarly, Fu and colleagues have reported a STH efficiency of 16% using commercial Si solar cells.24
More recently, research and development has begun to shift to scaling-up and commercialising DSHG systems.14 Lab demonstrations of modules with areas exceeding >50 cm2![[thin space (1/6-em)]](https://www.rsc.org/images/entities/char_2009.gif) 25 and 300 cm226 have been achieved. Very recently, a kilowatt scale DSHG pilot plant capable of co-generation of hydrogen and heat was reported by researchers from EPFL.22 In parallel, spin-off companies Solhyd, Sunhydrogen, and Sunrgyze are developing and commercialising DSHG systems with very different designs, all leveraging the common idea of integrating the PV and EC in a single module. Sunhydrogen and Sunrgyze have both demonstrated DSHG modules in outdoor operating conditions for an extended period of time.27,28
25 and 300 cm226 have been achieved. Very recently, a kilowatt scale DSHG pilot plant capable of co-generation of hydrogen and heat was reported by researchers from EPFL.22 In parallel, spin-off companies Solhyd, Sunhydrogen, and Sunrgyze are developing and commercialising DSHG systems with very different designs, all leveraging the common idea of integrating the PV and EC in a single module. Sunhydrogen and Sunrgyze have both demonstrated DSHG modules in outdoor operating conditions for an extended period of time.27,28
Despite these promising advances, the potential of DSHG to radically reduce the cost of renewable hydrogen production has not yet been satisfactorily quantified. Robust technoeconomic analysis is needed to further advance the development of the DSHG technology and focus research on the areas that can most improve cost competitiveness. To date, there have been conflicting results regarding the competitiveness of DSHG compared to standard electrolysers powered by off-grid solar electricity (PV–E). For example, Shaner concluded that the LCOH for unconcentrated DSHG was marginally lower than PV–E29 (for 2014 $ base year). In contrast, Grimm and colleagues found that the LCOH of DSHG was higher compared to PV–E,30 (for 2017 $ base year). This discrepancy is likely due to a number of factors.
Firstly, previous technoeconomic studies have focussed on the LCOH production from different configurations of DSHG. Photoelectrochemical systems (PEC), have at least one semiconductor-liquid junction such that the catalysts are deposited directly on a PV component to form a photoelectrode.29–31 While this configuration has the potential for lower upfront costs due to their simple design, direct contact between the PV components and the electrolyte could speed up degradation and lead to shorter system lifetimes. In contrast, combining photovoltaic cells with electrolysis cells in a single system, without the need for liquid-semiconductor junctions (PV–EC), has been shown to reach higher efficiencies and could be more stable13 but requires additional wiring and potentially higher upfront costs. Shaner et al. considered a module design with 3 series connected Si cells wired to HER and OER catalysts coated on electrodes (PV–EC),29 whereas the module design analysed by Grimm et al. included one semiconductor-liquid junction, consisting of a HER catalyst directly deposited on one photoelectrode, combined with a separate anode connected by wires (PEC).30 Different module designs will not only impact the upfront module cost, but also component lifetimes, and therefore operations and maintenance costs.
Secondly, due to the immaturity of the technology, there is large uncertainty around the so-called soft costs and operating parameters assumed for DSHG systems. For this reason, both studies mentioned above estimated the cost of installation, operation, and maintenance to be a fixed percentage of the capital costs. Such an approach does not take into account any differences in the plant design and the different operational needs of the technologies.
Thirdly, authors use different methods to account for the high level of financial risk associated with new technologies. For example, Grimm considered an arbitrary contingency cost of 30% for PEC compared to 20% for the PV–E systems, owing to higher risks. Other works have instead assumed a very high discount rate of 12%.29,30 Discount rate can significantly influence the levelized cost of renewable technologies, which tend to have the majority of costs up front as capital investment. Neither of these approaches take into account government strategies for de-risking deployment supporting investment.32
While these studies are an important step forward, the lack of consensus suggests further work is needed to understand the opportunities and challenges of deploying DSHG to reduce the cost of renewable hydrogen production. To assess the potential of DSHG to out-compete standard solar powered electrolyser systems, it is important to take into consideration different DSHG configurations, module design, plant design, and operational requirements over the long term for large-scale operation.
In this work we perform a rigorous technoeconomic analysis of DSHG systems, compared with an off-grid PV–Electrolyser (PV–E) system, to understand the potential of DSHG to provide low-cost renewable hydrogen. We restrict ourselves to Si PV based systems to leverage the low-costs and ease of large-scale production of an already established industry,33 and consider the details of plant design to reduce the uncertainty in the cost. We compare different common configurations of DSHG including PEC and PV–EC in order to understand the cost advantages of different device designs for large scale DSHG, and to provide guidance on where research efforts should focus to drive down costs more quickly.
To estimate the costs of the system we use the best available data, with reference to similar costs in large scale solar PV systems where appropriate, and incorporate the variability reported across the industry. DSHG specific costs, such as membrane, catalyst, piping, and gas handling are extrapolated from similar existing and mature technologies wherever possible.
Recognizing the inherent uncertainty in the costs of such systems, we perform a regression analysis to investigate the impacts of the range of costs of system components reported in the literature. This approach decomposes the cost of different system components into a comparable coefficient which allows us to interrogate the effect of the assumptions made in designing and costing the system. In doing so, we are able to quantify the impact of the costs of different system components on LCOH and investigate the most significant in more detail. Finally, we compare the costs of the cheapest DSHG systems with a comparable PV–E system and discuss the technological developments and cost reductions essential to reduce the LCOH for large scale deployment of DSHG systems to achieve LCOH of <2 $ per kgH2.
2. Design and costing of direct solar hydrogen plants
A detailed plant design is needed to accurately estimate costs but is also a significant source of uncertainty due to the technological immaturity of DSHG. Here we aim to mitigate this uncertainty by modelling a DSHG plant on a standard, commercial scale Si PV plant. Our DSHG module is based on a modified commercial PV module, with an additional back chassis to hold the electrochemical components of the system, namely the membrane, electrolyte, and electrodes, and to collect gases. The modules are mounted on aluminium-structures similar to those used in PV plants, however the individual DSHG modules are not connected with wires but with pipes that collect hydrogen and oxygen and circulate electrolyte (see Fig. 1(a)). Electrolyte and gas handling systems are needed to make sure the electrolyte is distributed, and gasses collected throughout the plant. This is a point of difference compared with PV–E systems, as in standard renewable hydrogen plants the hydrogen is produced centrally at the electrolyser. Continuous monitoring is required to ensure proper electrolyte and gas flow and identify leaks, provided by water flow controllers and gas sensors installed at regular intervals throughout the plant. Once produced, the hydrogen is further purified and compressed via a gas handling and compression system similar to those required by a standard PV–E plant. The details of the DSHG plant design are provided in the methods section. A standard PV–E plant is also modelled here for comparison and care is taken to keep the plant design as similar or equivalent as possible.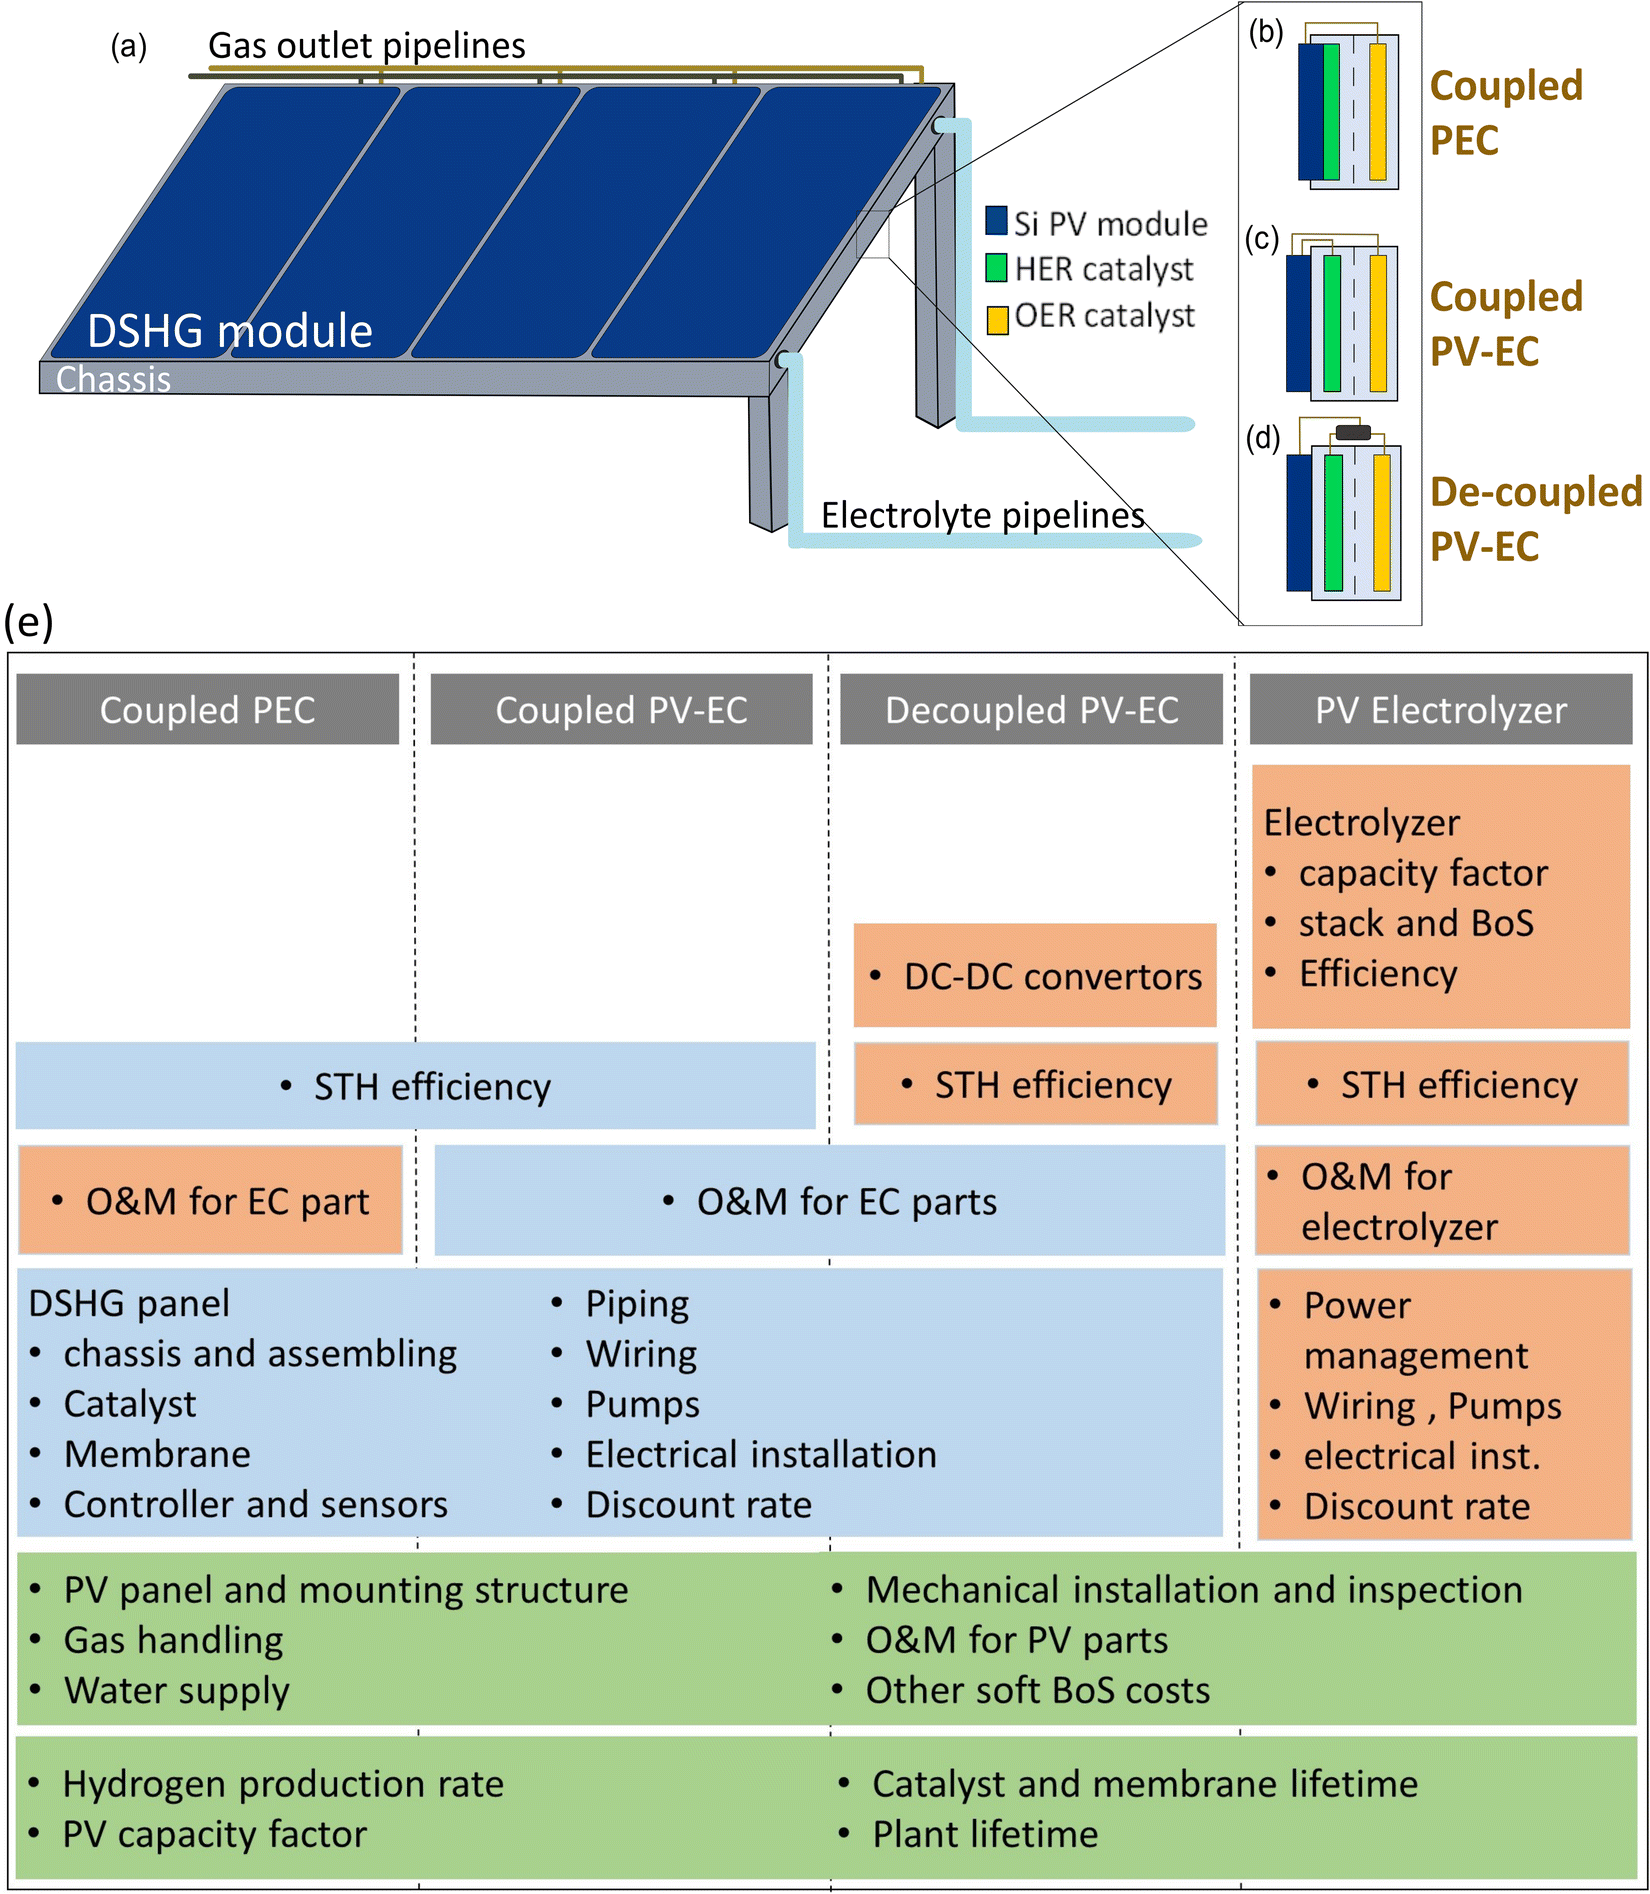 | ||
| Fig. 1 Schematic of (a) direct solar hydrogen generation (DSHG) module. Different configurations analysed (b) coupled PEC, (c) coupled PV–EC and, (d) decoupled PV–EC DSHG. (e) Cost breakdowns for all three DSHG system configurations and off grid PV–Electrolyser. Operating conditions and component costs that are identical to all the four systems are shown in green. Costs common in two or more systems are shown in blue and orange shows the costs specific to each system. | ||
A key component of the DSHG system is the module. A large number of configurations of DSHG modules are possible, and they vary in how the electrocatalytic components (EC, including catalysts, electrodes, membrane, electrolyte, and chassis) and the photovoltaic components (PV, including semiconductor photovoltaic cells and photoelectrodes) are connected, and in the degree of integration between them. We have previously defined the systems as coupled: where the EC and PV components are connected in series and the output voltage of the cells must match that required by the water splitting reaction; and decoupled: where a dc–dc convertor is introduced between the PV and EC components so that the PV cells are operated at their maximum power point and the optimal current and voltage can be supplied to the EC components.34,35
In this work we analyse three different DSHG configurations: coupled PEC, coupled PV–EC and decoupled PV–EC as shown in Fig. 1(b)–(d) respectively. We distinguish between PEC and PV–EC configurations, where PEC represents the highest degree of integration with catalysts directly integrated on semiconductor photoelectrodes, and PV–EC represents physically separated PV and EC components,11,34,35 as shown in Fig. 1(a)–(d). Taken together, these configurations represent the most prospective for large scale direct solar hydrogen generation. Earth abundant catalysts are chosen in this work, owing to their low-cost and high performance.36 The design specifications of the modules for all three configurations are discussed in detail in the methods section. Throughout this paper the term DSHG systems collectively refers to the three DSHG configurations described here. Whenever a particular DHSG configuration is discussed, it is mentioned explicitly.
The cost of the plant is split into fixed capital and variable costs. The fixed costs are the capital costs associated with setting up the plant and include the modules, mounting structure, piping, water, gas handling and compression system for DSHG; or the wiring, invertor, electrolysers, gas handling and compression system for the PV–E system. The capital costs of the peripheral system components (i.e., everything except the DSHG module for PEC and PV–EC, and the PV modules and electrolyser for PV–E) are collectively called the hard balance of system (BoS) costs. Fixed costs also include costs related to the design and installation of the system. Any other administration costs including financing and permitting are called soft BoS costs.
Variable costs are associated with operating and maintaining the plant, including cleaning, regular inspections for wear and tear, and repair and replacement of parts. In particular, the catalyst coated electrodes and the membranes used to separate the oxygen and hydrogen evolution reactions need to be replaced regularly as they will degrade faster than other parts of the system. This is also true for electrolysers which generally have the ‘stack’ containing these components replaced every 5 years.9 Replacement costs for these components are an important part of variable costs and include the cost of installation of replacement parts.
To estimate the costs of each system, we perform a detailed design analysis followed by rigorous research on the sub components and other associated expenditures, given in detail in the methods section. Fig. 1(e) shows the detailed cost breakdown for the three DSHG configurations considered in this work: coupled PEC, coupled, and decoupled PV–EC, and PV–E. Operating conditions are the same for all the four systems, and some system components are identical, for example the Si PV module (used as the basis for the DSHG module), aluminium mounting structure, gas handling and compression, and soft BoS costs (shown in green in Fig. 1(e)). DSHG module components such as the chassis and assembly cost, catalyst, membrane, piping, associated installation, and O&M costs are common for all three DSHG configurations (shown in blue). The decoupled configuration has additional cost associated with dc–dc convertor and a higher STH efficiency which is specific to this configuration (shown in orange).34,35 Similarly, the PV–E system also has specific costs related to electrolyser assembly, invertor, wiring and associated operating conditions, installation, and replacement costs which (shown in orange). Technical specifications of each of these costs are discussed in detail in the methods section, and all costs are listed in Table S1 (ESI†) for DSHG and S2 for PV–E, along with corresponding references.
2.1. LCOH and regression analysis
To compare the overall costs of all the systems, the levelized cost of hydrogen (LCOH) is calculated as:30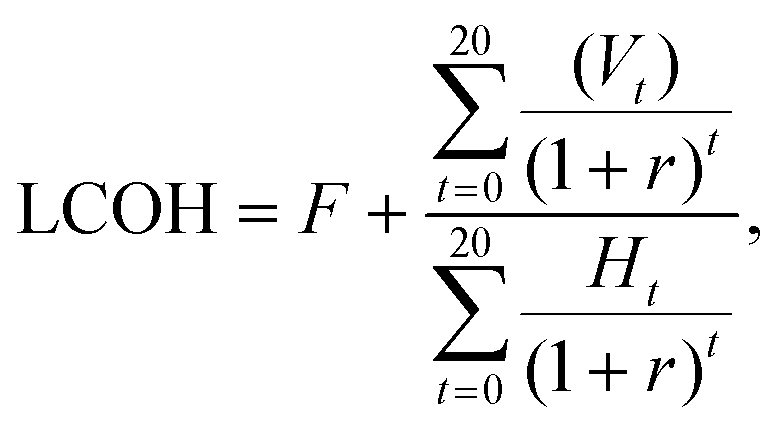 | (1) |
| Parameter | Value | |
|---|---|---|
| DSHG | PV–E | |
| Hydrogen production rate (Ht) | 610 tonnes per day | 610 tonnes per day |
| Plant lifetime | 20 years | 20 years |
| Solar capacity factor | 20% | 20% |
| Electrolyser efficiency | — | 68% |
| Discount rate (r) | 8% | 5.75% |
| Inflation rate | 1.9% | 1.9% |
For the PV–Electrolyser system, costs are based on a PEM electrolyser with an efficiency of 68%, taken from a 2020 IRENA report.9 Previous work has shown that optimising the capacity of PV system compared to the electrolyzer capacity is important to reduce the overall cost of hydrogen. As electrolysers currently cost more per MW of capacity than solar, oversizing the PV system improves the electrolyser capacity factor. Here we oversize the PV capacity by 1.5 times the electrolyser capacity, which has been shown to improve the electrolyser capacity factor to 31%.30,37
An average solar capacity factor of 20% is considered in this work, representing DSHG modules at a fixed optimum angle at a location with high insolation throughout the year. An inflation rate of 1.9% per year is considered based on a widely accepted inflation rate of 2% or below.38 A discount rate of 5.75% is assumed for PV–E systems based on which is based on the average discount rate for renewable energy projects in Australia.39,40 For the DSHG systems, a higher discount rate of 8% is chosen due to greater uncertainty factors related to a newer technology The impact of this will be investigated below. Table 1 summarises the financial parameters considered for the DSHG, and PV–E solar hydrogen plants considered here.
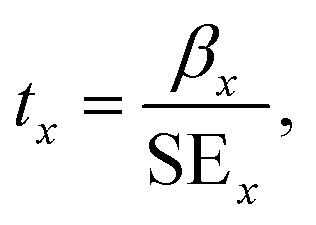
Once we have initial estimate for the LCOH, we perform a regression analysis to quantify the impact of uncertainties on the overall LCOH for the DSHG configurations. In this approach, we model the LCOH for the different DSHG configurations using calibrated equations given by:
 | (2) |
 | (3) |
3. Results and discussion
3.1. LCOH and cost breakdown
The LCOH for all four configurations is shown in Fig. 2(a). The baseline cost and range are identified from literature for each component and are given in Table S1–S4 in the ESI,† along with the corresponding references. The ranges represent either the known variation or the uncertainty in the component costs. For component costs based on those of utility scale PV plants (for example standard or modified PV modules, racking and mounting, and installation costs), the uncertainty is very low, and the range is taken from the International Renewable Energy Agency's report on renewable power generations costs in 2020,42 which shows that plant costs can vary by a factor of 3 depending upon the location of the plant (Fig. S1(a), ESI†). The low (baseline) and mid-range for the utility-scale PV plant is set by taking one and two standard deviations of values lower than the mean respectively, while the high range is defined by taking one standard deviation of values higher than mean, assuming that no renewable hydrogen plants would be built in the most expensive places (Fig. S1(b), ESI†). For other components, the uncertainty in the cost is higher and the range is set using the best available data (for example membrane costs). In some cases, where costs are sensitively dependent on design decisions (for example, the number of sensors and controllers) or choice of material (for example piping), the ranges are very large to cover all possible options.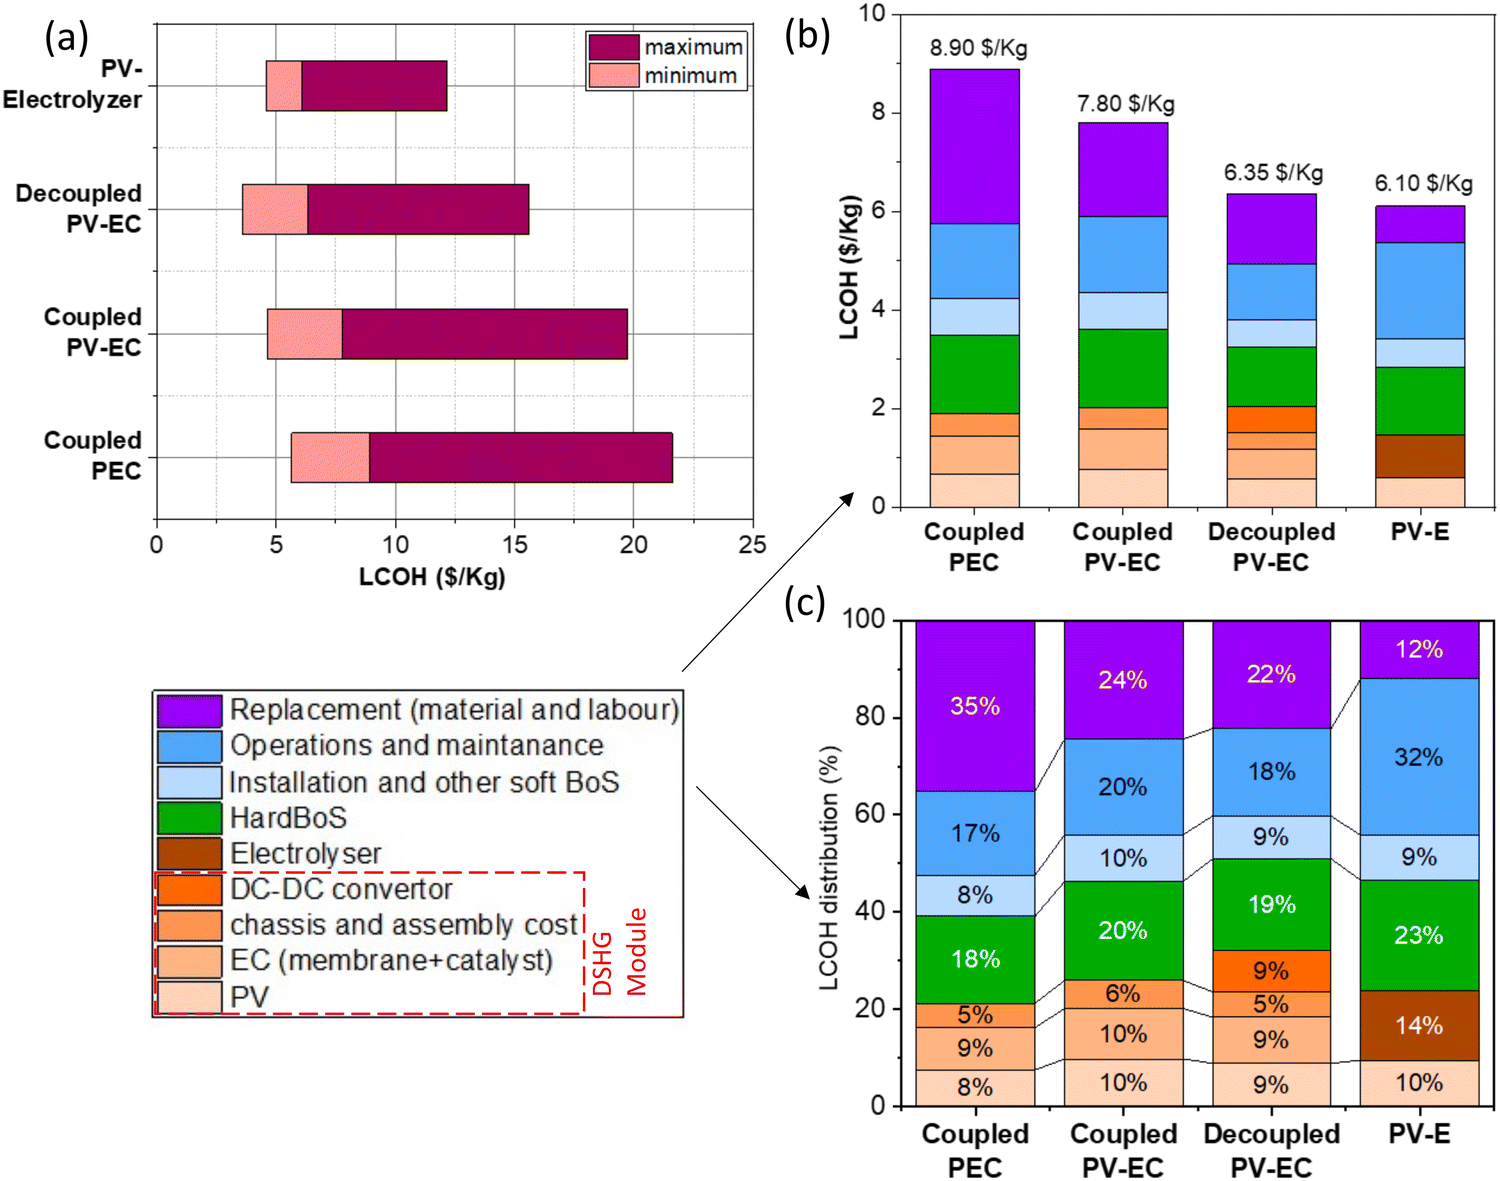 | ||
| Fig. 2 (a) Range of levelized cost of hydrogen (LCOH) for all direct solar hydrogen generation (DSHG) systems and PV–Electrolyser for range of component costs, given in Table S3 and S4 in the ESI,† (b) LCOH for all DSHG systems and PV–Electrolyser for baseline costs with cost breakdown and (c) percentage contribution of different components, divided into module cost (PV, EC, chassis and assembly, dc–dc convertor, electrolyser), hard BoS, soft BoS, operations and maintenance (O&M) and replacement (material and labour) costs. | ||
Fig. 2(b) and (c) shows the cost breakdown of the baseline LCOH for all three DSHG system configurations compared to the PV–E system, in both absolute costs (b) and as a fraction of the total LCOH (c). The cost is divided into those associated with the DSHG modules (including the modified PV module, electrocatalysts (EC), membrane, chassis, assembly, and dc–dc convertor for the decoupled PV–EC configuration) or equivalently those associated with the standard PV modules and electrolyser costs for the PV–E system; hard BoS costs; installation, other soft BoS costs, and O&M; and replacement costs.
On comparing the costs of hydrogen production via the three DSHG configurations in Fig. 2, the decoupled PV–EC configuration has the lowest baseline LCOH, followed by the coupled PV–EC and coupled PEC. While the overall DSHG module cost is slightly lower for the coupled PEC configuration due to absence of back contact and back plate in PV module, replacement costs are very high, as the whole module needs to be replaced at the end of catalyst and membrane lifetime since the catalysts are deposited directly on the PV cell surface. For both the PV–EC configurations, the replacement costs are relatively low as only the electrodes and membrane need to be replaced, not the PV module. Although the decoupled PV–EC configuration has a slightly higher module cost due to the addition of dc–dc convertors, this is offset by the higher STH efficiency.
Together the DSHG module and replacement costs dominate the LCOH in all the DSHG configurations and are different for all three designs. These costs are also among the most uncertain: apart from the cost of the modified Si PV module, there is a high level of uncertainty in the costs of other module components due to absence of existing large-scale systems. Furthermore, in the absence of data related to long-term operation of DSHG systems, catalyst and membrane lifetime estimations are based on similar systems such as fuel cells and electrolysers, introducing higher uncertainties in the LCOH analysis.
Comparing PV–E and DSHG costs in Fig. 2 shows the baseline LCOH for PV–E is slightly lower than the cheapest DSHG technology, the decoupled PV–EC case. This is primarily due to lower upfront capital costs for PV modules and electrolysers, lower replacement costs, and lower discount rate. This is somewhat offset by the increased hard BoS costs due to the need for an inverter. Notably, the O&M costs for the PV–E are much higher than for DSHG configurations due to higher maintenance costs for electrolysers. However, within the cost ranges considered, both the coupled and decoupled PV–EC configurations have the potential to be cheaper than PV–E as shown in Fig. 3(a).
 | ||
| Fig. 3 (a) Estimated regression coefficients for each component considered in DHSG system (b) cost contribution of component to LCOH in $ per kg assuming baseline LCOH and component cost. Components that have the biggest impact on the LCOH are highlighted with larger markers. | ||
It is clear from the analysis presented in Fig. 2 that different conclusions could be drawn about the relative competitiveness of DSHG and standard PV–E plants, depending on the configuration of the DSHG system and which cost estimates in the literature are used. In particular, the data shows that the configuration of the DSHG system has significant implications for the range of the LCOH, and that coupled PV–EC systems have roughly 9–18% lower costs than PEC configurations. This analysis goes some way to explaining how different conclusions could be reached by different authors in previous technoeconomic assessments.29,30 However, the results show that the cost differences between PV–E and the cheapest DSHG system, the decoupled PV–EC, vary widely from −28% to +22% within the ranges considered here. A more in-depth analysis is needed to understand the circumstances in which DSHG has a cost advantage over standard PV–E technologies, as presented below.
3.2. Regression analysis
In this section we use regression analysis to understand the relationship between the LCOH and the cost of different components in more detail. Regression analysis is used to estimate the impacts of individual (or combinations) of variables, while holding all other factors constant. For a linear regression like this, the coefficients are the marginal change in the LCOH for changes in the variable/s of interest. Standardizing the independent and dependent variables enables comparative analysis of coefficients within the model and across the model where the relative scale of variation for each coefficient might differ. This allows us to identify the components that are most significant, and investigate the impact of design choices and cost uncertainities on the total LCOH. In doing so, we can better understand how robust the conclusions drawn from Fig. 2 are: namely that decoupled PV–EC is the cheapest form of DSHG, and under what conditions it can out-compete PV–E.We define 17 critical components of different DSHG configurations, along with their associated regression coefficients (βx), standard error (SEx) and t-values (tx) for all the three DSHG systems, given in Table S8 (ESI†). Fig. 3(a) shows the regression coefficients with a confidence interval of 95%. These are the marginal (or incremental) effects of a change in the value of individual components on the LCOH. Fig. 3(b) shows the contribution of each component cost to the baseline LCOH value. It provides a visual relationship of the impact of each cost component (independent variable) on the total LCOH (dependent variable).
The DSHG module contributes the most to the overall cost for all systems (in agreement with Fig. 1). Within the module, the membrane is the highest cost contributing component followed by the PV module and chassis. The membrane is also one of the most uncertain parameters due to lack of any real world costs for mass produced membranes for DSHG systems. The cost assumptions are based on either the cost of membranes supplied for lab-scale experiments or membranes used in electrolysers and fuel cells.43 The lifetime of the membrane is also a critical factor. Currently most of the studies in literature consider a membrane lifetime of 5–7 years,9,39 but no practical DSHG system/membrane has been demonstrated with such high lifetimes. Low membrane lifetime also results in high replacement costs. Additionally, a large area of membrane is needed for the DSHG system, with membrane spread over the whole plant area in the DSHG system, which also impacts the replacement cost parameter, which is higher for coupled systems.
For the PEC configuration, the requirement for regular replacement of the whole module due to the monolithic design increases the impact of the PV module cost. Physically seperating the PV and EC, as in coupled and decoupled PV–EC designs, reduces the impact of the PV module cost as the catalyst can be replaced independently.
The gas handling and compression system is the hard BoS cost with most impact on the LCOH. Gas compression and cooling systems are already commercially available and used with electrolysers. There is less uncertainity around their costs, and prices are expected to further reduce as electrolyser systems are scaled up. For DSHG systems, additional pumps and gas blowers will be required to enable the flow of electrolyte and gas through the modules in the plant. In the absence of existing large-scale systems, there is little information on the design, and maintenance requirements for these additional components, leading to large uncertainties in the costs.
O&M costs are the next most significant costs for all three DSHG configurations. While cost estimates of O&M for the PV related components are well defined, the O&M requirements related to EC parts (i.e., catalysts, membrane, electrode in chassis) and piping are less well understood, leading to large uncertainties.
Hard BoS costs such as water, controllers and sensors, piping materials, and installation and other soft BoS costs, have less impact on the LCOH compared to components discussed above. Even though water is a scarce resource, it is not a major driver of the LCOH. However, the plant location will depend on availability of water, purification and waste disposal requirements in that region. The lower impact of piping (material and installation) costs on LCOH provides the liberty to choose more expensive and durable materials and installation strategies for the piping network across the plant. This will, in return, lower the chances of any leaks, wear and tear, and reduce maintanance requirements for the piping network. As O&M costs have a larger impact on the LCOH, this could lead to lower overall costs. Similarly, the relatively low impact of controller and sensor costs also provides the freedom to install better quality devices with higher sensitivity to leaks.
Overall, membrane cost and lifetime, PV module cost (PEC configuration), gas handling and compression, and O&M are identified as the key components that impact the LCOH. This enables us to focus on improving the performance and reducing the costs of the components of interest to drive down the LCOH rapidly. The regression analysis also underlines the components with lower impact on LCOH:water, controllers and sensors, and piping materials. These insights are useful as they indicate that more expensive piping materials and sensor placement strategies can be employed without significantly impacting the LCOH.
3.3. Cost competitiveness of DSHG vs. PV–E systems
Having identified the key components that impact the LCOH, we now interrogate the conditions under which DSHG would be cost competitive with PV–E. We focus on the comparison between PV–E and decoupled PV–EC (D–PV–EC) as the most competitive DSHG system and emphasise the components that have the largest impact on the LCOH of DSHG systems based on the regression analysis above, namely: the cost and lifetime of the membrane and catalysts, and the O&M costs.Fig. 4 shows the difference in LCOH for PV–E and D–PV–EC as we vary costs specific to each system such that the maximum LCOH in each figure (top right corner) is the baseline cost from Fig. 1. The surface plots are divided into three primary sections; the red region represents the positive values where D–PV–EC is more expensive than PV–E; and the blue region represents the negative values where D–PV–EC is cheaper than PV–E.
 | ||
| Fig. 4 Difference in levelized cost of hydrogen for PV–Electrolyser (PV–E) and decoupled PV–EC (D PV–EC) for variation in different parameters costs specific to each system (a) electrolyser stack vs. EC (b) operations and maintenance (O&M) PV–E vs. D PV–EC (c) electrolyser and gas handling PV–E vs. D PV–EC (d) wiring cost PV–E vs. piping and wiring cost D PV–EC. The blue region shows the negative values, i.e., the conditions for which D PV–EC is cheaper than PV–E. | ||
In Fig. 4(a), we keep all other parameters constant at the baseline values given in Table S1 and S2 (ESI†) and vary the total cost of the electrolyser stack for the PV–E system and equivalent electrocatalytic components, corresponding to the membrane and catalyst assembly, for the D–PV–EC system (i.e., catalyst, membrane, chassis, dc–dc convertor). The data shows that for D–PV–EC to be cost competitive with PV–E with current electrolyser stack costs, the EC costs need to reduce to at least 560 $ per kW, 10% below baseline. However, the International Energy Agency projects that electrolyser costs are expected to drop rapidly, to below 400 $ per kW by 2050 driving down the electrolyser stack cost to below 180 $ per kW.2 This will further push the cost reduction requirements for the EC stack to 385 $ per kW, 38% below baseline in D–PV–EC system to be cost competitive to PV–E in future.
Membrane cost, lifetime, and replacement requirements will play an important role in driving down the EC cost. As shown in Fig. 3, membrane costs account for $1.6 per kg H2 of the baseline LCOH or more than 60% of the EC cost (upfront + replacement material). Improvement in the membrane lifetime and cost reductions are essential to reduce both the fixed EC stack cost and the replacement costs. PV–E is less sensitive to the membrane cost compared to DSHG as it's a much smaller part of the system. Reducing the membrane cost by 50% can reduce the LCOH to from 6.35 to 5.5 $ per kg, while improving the lifetime to from 5 to 10 years can reduce the LCOH of current system to 4.9 $ per kg. In addition, the total replacement costs would be reduced by 65% compared to the baseline costs. Based on the cost predictions for mass production of fuel cell membranes,43 it is likely that scaling up the membrane production will significantly reduce the membrane cost. In addition, designing membranes for DSHG systems operating at low-current and low-pressure operating conditions could further reduce costs and improve the lifetimes. Modifying the module design to reduce the use of membranes, and exploring new membrane-less designs are other possible ways to reduce the cost.
Fig. 4(b) compares the LCOH of PV–E and D–PV–EC systems for varying O&M costs. The O&M requirements for PV–E and PV–EC are different. PV–E does not have such onerous piping maintenance requirements as DSHG but does have additional O&M costs associated with the electrolysers. To be cost competitive to PV–E with current baseline costs, O&M for D–PV–EC needs to reduce to around 360 $ per kW, around 22% reduction in the baseline cost. With scaled up manufacturing and improved electrolyser design, the O&M costs for electrolysers are expected to reduce rapidly in the next 10–15 years,6 requiring further reductions for DSHG to be competitive. Improvement in the membrane and catalyst quality and lifetime as discussed above will also reduce the replacement costs. With the piping system spread over the plant area in D–PV–EC system, O&M costs will likely be higher due to piping related costs such as regular inspections and cleaning.
Next, we compare the effect of the cost of the electrolyte and gas handling systems (including the water, pumps for electrolyte flow, hydrogen compression and cooling) on relative competitiveness of PV–E and D–PV–EC. DSHG systems require distributed electrolyte and gas handling throughout the plant, as described in the methods section. In contrast, the PV–E system has a central gas and electrolyte handling system, which only services the electrolyser. Here we assume that the gas compression and cooling system is identical for both D–PV–EC DSHG and PV–E systems. The cost of the electrolyte and gas handling system in D–PV–EC is required to reduce to 340 $ per kW, 23% below baseline, to be competitive with current PV–E (Fig. 4(c)). With the same hydrogen compression and cooling system, the additional cost of pumps and gas blowers for the flow of electrolyte and gas through the field needs to reduce to ensure the competitiveness of D–PV–EC system. Introducing automatic valves at the array level, which will operate after a sufficient gas is generated by the modules, can reduce or eliminate the requirement of gas blowers to ensure gas flow through the pipes to the compression system. Similarly opting for a gravity-based water supply system can reduce the requirements of pumps throughout the plant for electrolyte flow. These approaches have the potential to reduce the additional gas handling costs in the D–PV–EC system apart from compression requirements. Even with the low-cost alternate technologies, there will always be need of additional components to manage the electrolyte and gas flow throughout the plant, which makes it unlikely for the gas handling costs for D–PV–EC to go below those of PV–E.
One of the key differences between the DSHG and PV–E systems is how the modules are connected to each other. As discussed above, D–PV–EC DSHG modules are connected to each other via pipes for electrolyte and gas, opposed to PV–E where they are connected via wires and have additional inverters. Here we interrogate how connection via pipes or via wiring impacts the LCOH, including all upfront and maintenance costs. Fig. 4(d) shows the LCOH comparison for varying piping and wiring costs for D–PV–EC and PV–E respectively. Even with the additional cost of inverters included in the PV–E wiring costs, the overall cost of wiring is lower than the costs for piping for baseline D PV–EC and PV–E systems. This is due to high O&M costs associated with piping. A 10% reduction in the cost of the wiring in PV–E to ∼100 $ per kW would require piping costs to reduce to 128 $ per kW, more than a 55% reduction compared to the baseline costs, to enable D–PV–EC to be competitive. With a decrease in wiring costs to below 75 $ per kW, piping costs would essentially have to reduce to zero for D–PV–EC to be cost competitive, considering all other costs stay the same. Piping costs for DSHG are not well quantified and require better understanding on maintenance, leaks, and durability for cost reduction. Further, using better quality titanium pipes or PE pipes with inner linings and higher joint quality will potentially reduce the O&M costs for piping further driving down the overall piping cost.
The results above suggest that the optimal system design is essential for DSHG systems to be cost competitive with PV–E systems. PV systems have already come a long way down the cost curve, benefitting both PV–E and DSHG systems. DSHG systems have the potential to benefit from cheaper EC components as technology advance and membranes and catalyst production scales up, along with DSHG fabrication. But regular replacement requirements due to lower lifetime of membrane and catalysts will limit the reduction in O&M costs. Optimising the module design to reduce or exclude the use of membrane is another promising potential option for cost reduction. Piping materials and installation costs are not a significant component of the cost, as shown in the regression analysis, but the regular O&M requirements are much more onerous. The use of high-quality piping materials and better installation practices including improved quality joints could reduce the risks associated with safety and regular inspection requirements driving down the O&M costs.
3.4. Potential of cost reduction for DSHG technology
The motivation for investigating new pathways for renewable hydrogen production is to enable deep, rapid cost reductions, beyond that achievable by PV–E systems. In this section we analyse the potential for DSHG to meet the UN Green Hydrogen Catapult initiative goal of LCOH < 2 $ per kg.7Capacity factor and discount rate both strongly impact LCOH (Fig. S2, ESI†), as shown in Fig. 5(a). The capacity factor has a significant impact on the overall LCOH, reducing the cost from >6 $ per kg for capacity factors of 18% to less than 3.4 $ per kg for 25%, at discount rates of 8%. This suggests that hydrogen plant locations should be sited in areas with high daily peak sunlight hours. Assuming that plant locations are restricted to areas with solar capacity factor of 22%, (which can be found in abundance in countries aiming to become low carbon hydrogen exporters, like Australia)44 the LCOH can be reduced from 6.35 to 5.8 $ per kg for baseline costs and a discount factor of 8%.
 | ||
| Fig. 5 Contour plot of LCOH of decoupled PV–EC as a function of (a) capacity factor and discount rate (b) non-technology (soft BoS + labour) and technology (hard BoS + DSHG module + replacement materials) related costs. (c) Contour plot of technology related costs as a function of Hard BoS and DSHG module + replacement materials cost. | ||
Concurrently, it is reasonable to assume that discount rates for DSHG could be reduced to 6%, close to those routinely applied to PV systems, through government strategies to support investment and additional incentives to adopt DSHG technology. Overall, assuming more favourable, but realistic, values for the capacity factor (22%) and discount rate (6%) can reduce the LCOH to below 5 $ per kg without requiring capital cost reductions or technology improvements.
Next, we separate out the variation in costs directly dependent on DSHG module and plant design (i.e., those can be reduced by targeted by technology improvements) and those that are independent (i.e., soft BoS and labour). The top right corner of Fig. 5(b) represents the baseline LCOH estimates from Fig. 1, modified to have a lower discount rate of 6% and higher capacity factor of 22%. The LCOH is the calculated as a function of the technology costs and non-technology costs as they are reduced independently by up 80%. Technology costs include the DSHG module (including replacements) and hard BoS which are directly dependent and most impacted by improvement in the technology and grouped together. Non-technology costs include soft BoS costs: margin, financing costs, system design, permitting and incentive application and labour costs: installation and operations and maintenance. Note that some of the soft BoS and labour costs would still benefit from technology development, for example O&M costs would be reduced by increased membrane lifetime, and more robust piping. Non-tech costs are also affected by the plant location, which controls the associated labour and other soft BoS costs.
Fig. 5(b) shows that simultaneous reductions in both technology-related, and non-technology costs are required to achieve LCOH < 2 $ per kg. Even with technology improvements leading to cost reductions of 80% to 370 $ per kW, soft BoS and labour costs would need to come down to around 700 $ per kW; a reduction of 15%. Assuming more modest reductions in technology costs of just over 50% to 900 $ per kW would require dramatic reductions in non-technology costs of 80%, to almost $100 per kW. Improvements in the plant design may reduce the labour costs associated with installation, while extending membrane lifetime will reduce the ongoing labour costs, but the reduction will be limited by increase in inflation and average wages. Similarly choosing more robust but expensive materials for piping, high number of sensors across the plants could reduce the O&M costs. However, soft BoS and labour cost reductions of 80% appear highly unlikely.
To understand what technology improvements would be required to achieve cost reductions of 50–80%, the total technology related cost is further divided into costs associated with the DSHG module and those associated with hard BoS, as shown in Fig. 5(c). Like Fig. 5(a), the top right corner represents the total technology related costs used to calculate the baseline LCOH from Fig. 1. Costs associated with the DSHG module and hard BoS are independently varied to investigate the effect of up to 80% reduction in baseline costs. The area below the line represents the combination of costs for the DSHG and hard BoS that would need to be achieved for the total technology costs to reach below 900 $ per kW: the maximum allowable to realise a LCOH of below 2 $ per kg.
The costs of the DSHG module, including catalyst replacement for the life of the plant would need to reduce to below 400 $ per kW for current hard BoS costs to reach total technology costs below $900 per kW. Concurrent reductions in the hard BoS costs from the baseline costs could relax these stringent cost reduction requirements for the DSHG modules.
As discussed in Section 3.1, the PV module contributes 9% to the LCOH and 28% to cost of the D–PV–EC DSHG module. The cost of the c-Si PV modules are expected to reduce to ∼15 c$ per W by 2030.45 This would drive down the upfront DSHG module cost from 860 $ per kW to 770 $ per kW, reducing overall DSHG module + replacement material cost by around 100 $ per kW (from 1350 $ per kW to 1265 $ per kW).
It is well known that the rapid cost reductions in the PV electricity costs have been partly driven by improvements in solar cell efficiency, especially as BoS costs have become a large fraction of the overall system cost. Improvements in PV efficiency, like the recent announcement of mass produced commercial Si cells reaching efficiencies of 26%,46 can be directly leveraged to improve the STH efficiency and reduce the overall LCOH. Additionally, the PV research community continue to drive efficiency upwards by exploring high bandgap materials in tandem with Si cells; recently reaching 33% efficiency using low-cost materials,47 with the potential to achieve close to 45% efficiency.48 We have previously shown that high efficiency tandem PV configurations can improve STH efficiency to 20% on the cell level, with increasing efficiency expected to exponentially reduce the LCOH.23
The EC costs are also important. Reducing the upfront EC costs by 50%, would bring down the upfront module cost to below <500 $ per kW, and total module costs to ∼700 $ per kW over the life of the plant for reduced PV prices. Once again, we see that membrane cost and lifetime are critical here: removing the need for catalyst and membrane replacement during the lifetime of the plant would further reduce total DSHG module costs to ∼500 $ per kW, requiring negligible BoS cost reductions. As mentioned above, technology advancements and scale up of production could enable large cost reductions in EC components.
Assuming that total DSHG module costs to be lowered to 700 $ per kW for the life of the plant, hard BoS costs will still be required to be reduced by 60% to around 200 $ per kW to achieve LCOH of 2 $ per kg. Optimising the plant design to minimise the costs of the gas and water handling systems and associated sensors may provide some of these savings. Currently most of the DSHG demonstrations are at small scale: in labs or at pilot scale. Scaling up the add scalability vs. cost reduction discussion.
4. Conclusion
In this work a comprehensive techno-economic analysis is performed for different direct solar hydrogen generation (DSHG) configurations to understand the impact of module and plant design on LCOH and identify key research areas to drive down the costs rapidly. DSHG configurations are further compared with off-grid PV–Electrolyser (PV–E) to understand the potential of DSHG for low-cost renewable hydrogen.A key result is that the DSHG module configuration has a significant influence on the LCOH. The decoupled PV–EC (D–PV–EC) DSHG configuration achieves the lowest baseline LCOH of 6.35 $ per kg compared to 7.80 and 8.90 $ per kg for more integrated coupled PV–EC and PEC approach respectively. Even with higher upfront module cost, improvement in the STH efficiency and less onerous replacement requirements reduce the overall LCOH below that of more integrated systems. Due to large uncertainty in the cost of certain DSHG components, the D–PV–EC vary widely from −28% to +22% compared to PV–E within the ranges considered here. Regression analysis is shown to be a powerful tool in identifying the key components that impact the LCOH, namely the membrane cost and lifetime, gas handling and compression, and O&M. Costs such as water, controller and sensors, and piping materials have low impact on LCOH providing more freedom for material selection. Instead, research efforts should focus on reducing the cost and improving the lifetime of the membrane and catalysts. Concurrently, plant design and BoS technology needs to be further optimised to drive down the O&M costs.
PV–E systems are likely to significantly reduce in cost in the future as the nascent hydrogen industry scales up. To be competitive with PV–E, D–PV–EC DSHG systems will need to significantly reduce in cost. While large reductions in DSHG module costs can be expected due to component cost reductions, it will also be necessary to reduce hard and soft BoS and labour costs. O&M requirements for the EC and piping network across the plant will probably be a limiting factor and additional efforts are required to understand them better. However, our work does suggest that piping costs can be increased to allow more robust gas and electrolyte handling systems without greatly effecting the LOCH.
Our analysis suggests that the pathway to ultra-low cost DSHG will require more than the development of low-cost modules. Improvement in the module design, membrane cost and lifetime along with predicted reduction in the PV costs in coming years can significantly bring down the module cost. However, plant location, financing costs, operations, and maintenance, and BoS costs will all need to be optimised to achieve the goal of $2 per kg.
5. Technical analysis and cost breakdown (can be moved to SI if required)
5.1. Module
Module designs for all three DSHG configurations are based on a modified PV module, with a chassis fitted to the back of the module to house the catalysts and or electrodes, membrane, and the electrolyte, as shown in Fig. 2(a). The module is supported by a mounting structure similar to those in a utility scale PV plant. The performance and size parameters are identical to commercially available LG R series Si PV module – LG435QAC, with a certified output power of 435W and power conversion efficiency (PCE) of 21.9%.49 The size specifications and operating parameters of PV and DSHG module are given in Table S5–S7 in ESI.†Coupled PEC modules have the highest degree of integration as the catalyst is coated directly on the rear of the PV cell, which is in contact with the electrolyte as shown in Fig. 2(b). Multiple Si cells are connected in series to provide the required potential for water splitting reaction.1,2 The back panel and back contact of the PV module are removed for the direct catalyst integration which reduces the cost of Si PV module by ∼15%.6 It has a simple device design consisting of single component and low module cost due to the direct integration of PV and EC.3,4 The catalyst coated rear forms the top of the chassis, such that it is in direct contact with the electrolyte. The anode is wired to the front contacts of the PV module. The rest of the module is encapsulated such that the front light absorbing PV part is not in direct contact with the electrolyte solution. Due to direct integration, the full module will require replacement after every few years due to low catalyst lifetime which can potentially increase the overall cost. Coupled PEC systems also suffer from low STH efficiency and due to increased interfacial losses and stability as many proven light harvesting materials suffer from corrosion in the electrolyte.13 Despite this, we assume that the STH efficiency and lifetime is the same as the other coupled configuration, calculated as 15%, assuming catalyst performance following our previous work.23
In the coupled PV–EC module configuration, PV and EC components are physically separated and connected to each other via wires (Fig. 2(c)). The PV cell is not in direct contact with the electrolyte which improves the stability.3,4 Physically separated components allow individual optimisation of the catalyst and PV allowing to better optimisation of current and voltage to achieve higher STH efficiency.13,34 Only the catalyst component needs be replaced after its lifetime reducing the overall replacement cost. The coupled PV–EC system has additional module cost associated with back contact and back plate of the PV module and substrate for one of the catalysts.
The decoupled PV–EC DSHG configuration is a modified version of its coupled counterpart, where a dc–dc convertor is introduced in between the PV module and the electrodes (Fig. 2(d)). The rest of the design is identical in both cases. Decoupled system is not limited by current, and voltage matching requirements like the coupled configuration and the PV can operate at its maximum power point.3,5 This improves the STH efficiency compared to the coupled configuration without any improvement in the materials. The Decoupled system will incur additional cost and assembling requirements for the dc–dc convertor. In ideal systems, decoupling improves the STH efficiency up to 30% but comes with the additional cost of dc–dc convertors. In the realistic system considered here, an efficiency of 20.6% is assumed (coupled system efficiency 15.3%).
The rear mounted chassis is made of glass or polypropylene with EVA and sealants for encapsulation, such that it is waterproof, stable, and light weight. The chassis material and assembly cost is assumed to be similar to perovskite solar cell encapsulation, due to their similar encapsulation requirements.50
The electrodes consist of high-performance earth abundant nickel-based hydrogen evolution reaction (HER) and oxygen evolution reaction (OER) catalysts on structured metal substrates, such as those reported in our previous work.23 Structured metal surfaces provide high surface area and increased reaction sites, improving the performance for a specific geometric area compared to planer substrates. As DSHG systems operate at low currents, a low catalytic loading of 1–10 ug/will be sufficient to achieve the required catalytic activity.29 In the current work a catalyst and membrane lifetime of 5 years is assumed based on the recent electrolyser literature.4,37
The system requires electrolyte to mediate the reaction: 1 M potassium hydroxide is considered owing to better performance and stability of wide variety of earth abundant catalysts in alkaline environment.51 Gas separation and ionic conductivity in the system is achieved using a Nafion proton exchange membrane due to its stable performance in the alkaline electrolyte.52 The membrane specifications for DSHG systems could be different from electrolysers and fuel cell systems due to low-current and low-pressure operating conditions. However, similar material and manufacturing processes would be employed for manufacturing DSHG systems as they have the same requirements for the electrolyte environment and gas separation. The membrane costs will depend upon the input material, substrate, and labour cost for manufacturing. Here we use the estimations of membrane costs performed by NREL for fuel cell systems assuming the membranes are in mass production.43
Pipes fitted to the chassis allow hydrogen and oxygen to be collected, and electrolyte to be circulated. Specifications for piping will be discussed as part of the hard balance of system components, below.
5.2. Hard balance of system
Pipes need maintenance to ensure they are degradation and contamination free. In the DSHG systems under consideration, the internal surface of the gas-wetted pipe is cleaned once in every 6 months using dilute hydrogen peroxide solution flow. Apart from using sensors for leak detection (discussed below), the pipelines are visually inspected at least 2 times every year for leakage, and any other defects in the coating, valves, welding, dents, cracks, and corrosion damage.
5.3. Soft balance of system
Additional soft BoS costs such as margin, financing costs, system design, permitting and incentive application are assumed to be the same as the utility scale PV plants for all DSHG and PV–E systems.42
5.4. PV–Eelectrolyser
Compared to the DSHG system, the costs of an off-grid PV–Electrolyser plant are relatively well understood and have been the subject of several reports from the IEA and IRENA.4,42 The PV–Electrolyser plant is designed as an off-grid system, with electrolysers powered by the utility scale PV plant. The PV plant design and component specifications are kept same as commercial utility scale PV plants and taken from IRENA power generation costs, 2021 report.42 As mentioned above, costs for the PV module, mounting structure, mechanical installation, O&M, and soft BoS are taken from utility scale PV plant data and considered same for DSHG system as well. Specific requirements such as the power management, wiring and electrical installation costs are taken to be equal to those of utility scale PV plants.42 Proton exchange membrane electrolyser technology is considered with the design specifications and cost breakdown taken from the 2020 IRENA report on green hydrogen cost reduction.9 For the sensitivity analysis, the electrolyser cost range is based on the recent IEA4 and NREL59 reports. An operations and maintenance cost of 3% of capital costs per year is assumed for the electrolyser based on NREL data.60 The various costs associated with PV–Electrolyser are shown in Fig. 1.6. Plant design
It is necessary to specify the design of the hydrogen plant in order to more accurately estimate the costs of the piping, sensors and controllers, gas handling and compression. The facility is divided into four hierarchical levels of increasing size, following the work of Sathre et al.61 The smallest level is the DSHG module of size ∼2 × 1 m2, described in section 2.1 above. Each module has three pipes, one for incoming electrolyte and two for outgoing gases. 12 modules are combined to form an array, including piping manifolds for the electrolyte flow and gas transfer from all the modules. 5 arrays are connected by larger piping manifolds to form a field. Each field includes a single set of controllers and sensors to monitor the electrolyte and gas flow. The fields connect to a larger bore pipe to collect the gas and deliver electrolyte via a valve which can be closed to cut off the flow if leaks are detected in a field. The piping diameter at each level depends on the mass flow of electrolyte and gases and increases from module to facility level. All the fields combine with rest of the hard BoS as discussed in the section 2.2 above, to form the entire facility.Conflicts of interest
There are no conflicts to declare.Acknowledgements
ARENA: this work was funded by the Australian Renewable Energy Agency (grant number KC007). ZCEAP: This work has been carried out under the Zero-Carbon Energy for the Asia-Pacific Grand Challenge at the Australian National University.References
- cycle, I.t.a.r., AR6 Synthesis Report: Climate Change 2023. 2023.
- IEA, Net zero by 2050:A Roadmap for the Global Energy Sector, 2021.
- F. Ueckerdt, et al., Potential and risks of hydrogen-based e-fuels in climate change mitigation, Nat. Clim. Change, 2021, 11(5), 384–393 CrossRef CAS.
- (IEA), I.E.A., Global Hydrogen Review 2021.
- T. Longden, et al., ‘Clean’hydrogen? –Comparing the emissions and costs of fossil fuel versus renewable electricity based hydrogen, Appl. Energy, 2022, 306, 118145 CrossRef CAS.
- IRENA, electrolyser costs, accessed on 5th May 2023.
- UN Green Hydrogen Catapult initiative accessed on 27 feb 2023; Available from.
- U.S. department of energy, Energy Earthshot Initiative accessed on 27 feb 2023; Available from: https://www.energy.gov/eere/fuelcells/hydrogen-shot.
- IRENA, G.H.C.R., Scaling up Electrolysers to Meet the 1.5 °C Climate Goal. International Renewable Energy Agency, Abu Dhabi, 2020.
- R. Fazeli, F. J. Beck and M. Stocks, Recognizing the role of uncertainties in the transition to renewable hydrogen, Int. J. Hydrogen Energy, 2022, 47(65), 27896–27910 CrossRef CAS.
- T. J. Jacobsson, et al., Sustainable solar hydrogen production: from photoelectrochemical cells to PV–electrolyzers and back again, Energy Environ. Sci., 2014, 7(7), 2056–2070 RSC.
- H. Nishiyama, et al., Photocatalytic solar hydrogen production from water on a 100-m2 scale, Nature, 2021, 598(7880), 304–307 CrossRef CAS PubMed.
- J. W. Ager, et al., Experimental demonstrations of spontaneous, solar-driven photoelectrochemical water splitting, Energy Environ. Sci., 2015, 8(10), 2811–2824 RSC.
- S. Haussener, Solar fuel processing: Comparative mini-review on research, technology development, and scaling, Sol. Energy, 2022, 246, 294–300 CrossRef CAS.
- S. Ardo, et al., Pathways to electrochemical solar-hydrogen technologies, Energy Environ. Sci., 2018, 11(10), 2768–2783 RSC.
- (DOE), U.S.D.o.E., DOE technical targets for hydrogen production from photoelectrochemical hydrogen production.
- S. K. Karuturi, et al., Over 17% Efficiency Stand-Alone Solar Water Splitting Enabled by Perovskite-Silicon Tandem Absorbers. Advanced Energy, Materials, 2020, 2000772 CAS.
- H. Park, et al., Water Splitting Exceeding 17% Solar-to-Hydrogen Conversion Efficiency Using Solution-Processed Ni-Based Electrocatalysts and Perovskite/Si Tandem Solar Cell, ACS Appl. Mater. Interfaces, 2019, 11(37), 33835–33843 CrossRef CAS PubMed.
- J. Gao, et al., Solar Water Splitting with Perovskite/Silicon Tandem Cell and TiC-Supported Pt Nanocluster Electrocatalyst, Joule, 2019, 3(12), 2930–2941 CrossRef CAS.
- R. Fan, et al., Unassisted solar water splitting with 9.8% efficiency and over 100 h stability based on Si solar cells and photoelectrodes catalyzed by bifunctional Ni–Mo/Ni, J. Mater. Chem. A, 2019, 7(5), 2200–2209 RSC.
- T. G. Deutsch, Concentrating on solar for hydrogen, Nat. Energy, 2023, 1–2 Search PubMed.
- I. Holmes-Gentle, et al., Kilowatt-scale solar hydrogen production system using a concentrated integrated photoelectrochemical device, Nat. Energy, 2023, 1–11 Search PubMed.
- Y. Wang, et al., Direct Solar Hydrogen Generation at 20% Efficiency Using Low-Cost Materials, Adv. Energy Mater., 2021, 2101053 CrossRef CAS.
- H.-C. Fu, et al., Spontaneous solar water splitting with decoupling of light absorption and electrocatalysis using silicon back-buried junction, Nat. Commun., 2020, 11(1), 1–9 CrossRef PubMed.
- M. Lee, et al., Scalable Photovoltaic-Electrochemical Cells for Hydrogen Production from Water-Recent Advances, ChemElectroChem, 2022, 9(24), e202200838 CrossRef CAS.
- E. Kemppainen, et al., Effect of the ambient conditions on the operation of a large-area integrated photovoltaic-electrolyser, Sustainable Energy Fuels, 2020, 4(9), 4831–4847 RSC.
- SolHyd. Available from: https://solhyd.org/en/.
- Sunrgyze. Available from: https://sunrgyze.com/en/.
- M. R. Shaner, et al., A comparative technoeconomic analysis of renewable hydrogen production using solar energy, Energy Environ. Sci., 2016, 9(7), 2354–2371 RSC.
- A. Grimm, W. A. de Jong and G. J. Kramer, Renewable hydrogen production: A techno-economic comparison of photoelectrochemical cells and photovoltaic-electrolysis, Int. J. Hydrogen Energy, 2020, 45(43), 22545–22555 CrossRef CAS.
- B. D. James, et al., Technoeconomic analysis of photoelectrochemical (PEC) hydrogen production. DOE report, 2009 Search PubMed.
- IRENA, Green Hydrogen Supply: A Guide to Policy Making. 2021.
- International Technology Roadmap for Photovoltaic (ITRPV), 2020.
- F. J. Beck, Rational Integration of Photovoltaics for Solar Hydrogen Generation, ACS Appl. Energy Mater., 2019, 2(9), 6395–6403 CrossRef CAS.
- A. Sharma and F. J. Beck, Quantifying and Comparing Fundamental Loss Mechanisms to Enable Solar-to-Hydrogen Conversion Efficiencies above 20% Using Perovskite–Silicon Tandem Absorbers. Adv. Energy Sustainability Res. 2020 Search PubMed.
- IRENA, Green Hydrogen Cost Reduction: Scaling up Electrolysers to Meet the 1.5 °C Climate Goal, International Renewable Energy Agency, Abu Dhabi, 2020.
- D. S. Mallapragada, et al., Can industrial-scale solar hydrogen supplied from commodity technologies Be cost competitive by 2030?, Cell Rep. Phys. Sci., 2020, 1(9), 100174 CrossRef.
- (ABS)., A.B.o.S., consumer price index CPI.
- J. Yates, et al., Techno-economic analysis of hydrogen electrolysis from off-grid stand-alone photovoltaics incorporating uncertainty analysis, Cell Rep. Phys. Sci., 2020, 1(10), 100209 CrossRef CAS.
- Initiative, A.G.T.a.C.E.P., Renewable energy discount rate survey results, 2018.
- T. Longden, F. Jotzo and A. Löschel, Conditions for low cost green hydrogen production: mapping cost competitiveness with reduced-form marginal effect relationships. 2021, Centre for Climate & Energy Policy, Crawford School of Public Policy, The….
- IRENA, Renewable power generation costs, 2020.
- B. D. James, J. M. Huya-Kouadio, C. Houchins and D. A. DeSantis, Mass Production Cost Estimation of Direct H2 PEM Fuel Cell Systems for Transportation Applications: 2018 Update, NREL, 2018.
- National map. accessed on 16/01/2023.
- L. Oberbeck, et al., IPVF's PV technology vision for 2030, Prog. Photovoltaics Res. Appl., 2020, 28(11), 1207–1214 CrossRef.
- D. Carroll, SunDrive sets 26.07% efficiency record for heterojunction PV cell in mass production.
- P. Chandak, KAUST Sets World Record With 33.2% Efficiency Perovskite/Silicon Tandem Solar Cell.
- M. H. Futscher and B. Ehrler, Efficiency limit of perovskite/Si tandem solar cells, ACS Energy Lett., 2016, 1(4), 863–868 CrossRef CAS.
- LG Neon R series solar panel specifications, accessed on 16th April 2022.
- N. L. Chang, et al., A bottom-up cost analysis of silicon–perovskite tandem photovoltaics, Prog. Photovoltaics Res. Appl., 2021, 29(3), 401–413 CrossRef CAS.
- C. C. McCrory, et al., Benchmarking hydrogen evolving reaction and oxygen evolving reaction electrocatalysts for solar water splitting devices, J. Am. Chem. Soc., 2015, 137(13), 4347–4357 CrossRef CAS PubMed.
- R. Yeo, et al., Perfluorosulphonic acid (Nafion) membrane as a separator for an advanced alkaline water electrolyser, J. Appl. Electrochem., 1980, 10(6), 741–747 CrossRef CAS.
- Deloitte, Decarbonising Australia's gas distribution networks, 2018.
- M. W. Melaina, O. Antonia and M. Penev, Blending Hydrogen into Natural Gas Pipeline Networks: A Review of Key Issues, NREL, 2013.
- T. M. Adams, et al., VA 4 Evaluation of Natural Gas Pipeline Materials for Hydrogen/Mixed Hydrogen-Natural Gas Service, 2005.
- S. Babu, et al., Hydrogen Permeability and Integrity of Hydrogen Transfer Pipelines. Lincoln Electric Co., https://ms.ornl.gov/Babu/EE/h2pipe/h2.pdf, 2003.
- K. P. Retha Coertzen, M. Brannock and B. Dagg, Water for Hydrogen, GHD perspective, accessed May 2022.
- Water and Wastewater Annual Price Escalation Rates for Selected Cities across the United States. Federal energy management program, NREL, 2017.
- A. T. Mayyas, et al., Manufacturing cost analysis for proton exchange membrane water electrolyzers, National Renewable Energy Lab.(NREL), Golden, CO (United States), 2019.
- NREL, H2A: Hydrogen Analysis Production Model, 2018.
- R. Sathre, et al., Life-cycle net energy assessment of large-scale hydrogen production via photoelectrochemical water splitting, Energy Environ. Sci., 2014, 7(10), 3264–3278 RSC.
Footnote |
| † Electronic supplementary information (ESI) available. See DOI: https://doi.org/10.1039/d3ee01697h |
| This journal is © The Royal Society of Chemistry 2023 |