 Open Access Article
Creative Commons Attribution 3.0 Unported Licence
Outdoor radon-222 in Arctic Finland
Jussi
Paatero
 *,
Juha
Hatakka
and
Timo H.
Virtanen

Finnish Meteorological Institute, P. O. Box 503, Helsinki, Finland. E-mail: jussi.paatero@fmi.fi
First published on 16th August 2023
Abstract
Outdoor radon-222 was measured at Sevettijärvi, northern Finland (69°35′N, 28°50′E) from September 1995 to January 2000. Radon-222 was measured via its beta emitting short-lived progeny collected on a glass-fibre filter. The data set from Sevettijärvi contains 25![[thin space (1/6-em)]](https://www.rsc.org/images/entities/char_2009.gif) 641 hourly values of radon-222 activity concentration with a median value of 1.2 Bq m−3. Wind speed and direction, vertical mixing and source areas of air masses all have an effect on the radon-222 content of the air. The results show that, excluding very stable mixing conditions, most of the radon-222 is long-range transported. The radiation dose caused by outdoor radon-222 is only about one per cent of the total radiation dose for the Sevettijärvi residents.
641 hourly values of radon-222 activity concentration with a median value of 1.2 Bq m−3. Wind speed and direction, vertical mixing and source areas of air masses all have an effect on the radon-222 content of the air. The results show that, excluding very stable mixing conditions, most of the radon-222 is long-range transported. The radiation dose caused by outdoor radon-222 is only about one per cent of the total radiation dose for the Sevettijärvi residents.
Environmental significanceRadon-222 can give useful information about the atmospheric behaviour of trace components (e.g. aerosol particles and greenhouse gases) due to meteorological factors. The data can be utilised also in studies concerning atmospheric new particle formation due to ion-induced or ion-mediated nucleation. Outdoor radon data can be used to trace its sources in the Arctic, e.g., long range atmospheric transport from continental regions. The data can also be used for modelling of ecosystem carbon cycling in permafrost environments with radon modules and subroutines for projections of future radon load as an impact of permafrost thawing. |
1 Introduction
Natural radioactivity in outdoor air has been studied in Arctic Fennoscandia for over a century. As early as 1903–1904 George C. Simpson spent a year at Karasjok, northern Norway making observations on air electricity and atmospheric radioactivity.1 Despite his rudimentary instrumentation he obtained results that are reasonable even today. He, for example, observed a diurnal variation in the ionization rate that can be attributed to the diurnal behaviour of airborne radon-222 (222Rn, t½ = 3.8 d). Six decades later measurements of outdoor 222Rn were started at Rovaniemi and Kevo, Finland.2 These measurements are ongoing.Radon-222, especially indoors, has shown to be the most important source of radiation exposure to humans in Finland as in many other countries too. About two thirds of the 5.9 mSv average annual radiation dose comes from 222Rn.3
The Finnish Meteorological Institute (FMI) established an air quality monitoring station at Sevettijärvi, northern Finland, in 1991. Its primary purpose was to study air pollutants originating from the Kola Peninsula metallurgical industry. These studies formed a part of a larger project that investigated causes and consequences of forest damages in eastern Lapland.4–6 Radon-222 was measured at the site between 1995 and 2000. The primary purpose was to study the effect of meteorological conditions on the 222Rn activity concentration in outdoor air. However, during the analysis of the gathered data it became evident that an assessment of radiation dose could provide useful information for environmental health studies concerning the local population as their living habits and diet differ significantly from those of the current western general population. The measurements were made two decades ago. However, radon-222 is a natural radionuclide originating from the extremely long-lived uranium-238. Therefore, its source term and subsequently activity concentration in the air are constant in the long run, not to mention the meteorological factors affecting its atmospheric behaviour. The results of these measurements are presented in the following.
2 Experimental
2.1. Study site
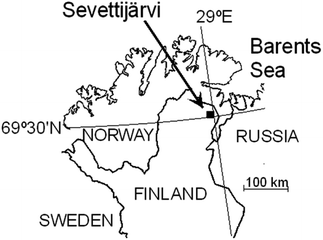
Outdoor 222Rn was measured at Sevettijärvi, northern Finland (69°35′N, 28°50′E, 130 m above sea level [a.s.l.]) from September 1995 to January 2000. The station is located about 300 km north of the Arctic Circle (Fig. 1 and 2). The midnight Sun lasts from 19 May to 25 July. The polar night prevails from 28 November to 13 January. During the winter solstice the civil twilight lasts for 4½ hours. The closest fjord of the Barents Sea lies about 30 km north–north–east of the station. The annual amount of precipitation in the area is about 450 mm and the annual mean temperature is −1 °C. The ground is covered with snow usually from late October to mid-May.7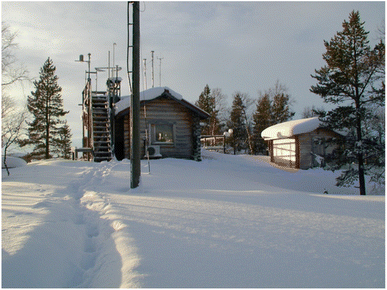 | ||
| Fig. 2 Sevettijärvi air quality monitoring station, northern Finland, in February 2003 (photo: FMI/Jussi Paatero). | ||
The terrain surrounding the study site is covered mainly by till, hummocky moraine, and bedrock terrain.8 The uranium content of till at the Sevettijärvi region, about 4 ppm, is higher than the uranium content encountered elsewhere in northernmost Lapland which has been verified with aerogeophysical measurements.9,10
2.2. Instrumentation
Radon-222 was measured via its beta emitting short-lived progeny collected on a glass-fibre filter using a simplified version of the instrumentation described earlier.11 Sample air is drawn through a filter wrapped around a cylindrical frame. The air inlet is six metres above the ground. The beta activity accumulating onto the filter is continuously recorded by a cylindrical Geiger–Müller (GM) counter mounted co-axially inside the filter. The filter with the GM tube is located inside a lead shield to reduce the background count rate. The filter is changed in two weeks intervals. The air flow rate is about 25 m3 h−1 and it is measured with a mass flow meter. The pulses from the GM counter are recorded by a data logger and stored into a computer at 10 minute intervals for subsequent off-line analysis. The number of collected counts per 10 minutes usually varies from a baseline of about 250 to several thousands. The detector system has participated in an international intercomparison test with good results.12When the pump is running, the count rate of the GM tube increases as beta activity gathers onto the filter. During the study period the artificial radioactivity content of the air was zero.13 The activity content of 220Rn progeny of the air is low compared to that of 222Rn.14 Therefore, the beta activity accumulated onto the filter can be totally attributed to 222Rn.
The short-lived 222Rn progeny consists of four nuclides: 218Po (t½ = 3.05 min), 214Pb (t½ = 26.8 min), 214Bi (t½ = 19.8 min) and 214Po (t½ = 162 μs). The activity of 214Po is equal to its predecessor, 214Bi, owing to its short half-life. The Po isotopes are alpha emitters and do not contribute to the GM tube count rate. The activity concentration of 218Po in air, which is almost the same as the activity concentration of 222Rn, can be calculated from the measured count rates by assuming that the activity concentration ratio between 218Po, 214Pb, and 214Bi is constant and known. In this study, it was assumed that activity concentrations of the three nuclides are equal. Significant deviations from this assumption occur rarely in connection with a high local contribution to the radon concentration.15 In cases of long-range transport of stable continental air masses with a high 222Rn content the deviations are not significant. In addition, detector counting efficiencies for beta particles of 214Pb and 214Bi need to be known. In our counting geometry, these are 0.96% and 4.3%, respectively. The activity concentration A can be calculated from the eqn 1
 | (1) |
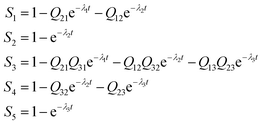 | (2) |
The coefficient Qij is an abbreviation for λi/(λi − λj). The Si terms are constants because constant time intervals are used in the measurement.
Surface weather parameters including air temperature, relative humidity and wind direction and speed were measured with an automatic weather station (MILOS500 by Vaisala Ltd). Eight SYNOP observations per day (00, 03, 06, 09, 12, 15, 18 and 21 UTC) were available. Simultaneous solar radiation and cloud cover observations were obtained from Utsjoki-Kevo weather station (69°45′N, 27°02′E, 98 m a.s.l.) 70 km west–northwest of Sevettijärvi.
3 Results and discussion
3.1. Basic data
The data set from Sevettijärvi contains 25![[thin space (1/6-em)]](https://www.rsc.org/images/entities/char_2009.gif) 641 hourly values of 222Rn activity concentration. Five per cent of the observations were below the minimum detectable concentration of 0.1 Bq m−3. The hourly 222Rn activity concentration values varied from <0.1 Bq m−3 to 41 Bq m−3. The median value was 1.2 Bq m−3. Replacing the below detection limit values with values of 0.05 Bq m−3 (=half the detection limit) gives an average activity concentration of 2.2 Bq m−3. For comparison, a geometric mean 222Rn content of 2.5 Bq m−3 of the air 6 m above the ground was observed in southern Finland.16 In Poland the arithmetic mean outdoor 222Rn activity concentration was 5 Bq m−3 in Łódź, 6 Bq m−3 in Ciosny and 10 Bq m−3 in Kraków.17 In Slovenia a geometric mean value of 12 Bq m−3 was measured.18 In New York City, USA, an average outdoor 222Rn content of 4.2 Bq m−3 in the air was observed during a period of seven years.19 In Sicily, around the summit of Etna volcano, the average level of outdoor 222Rn was in the range of 4.8–9.6 Bq m−3 with a possible influence by the volcano emissions.20 In Andalucia, south-western Spain an average 222Rn content of 3.5 Bq m−3 of the outdoor air 10 m above the ground was observed.21 In Saudi Arabia 222Rn in outdoor air was measured at 16 sites with values ranging between 6.2 and 13.3 Bq m−3.22
641 hourly values of 222Rn activity concentration. Five per cent of the observations were below the minimum detectable concentration of 0.1 Bq m−3. The hourly 222Rn activity concentration values varied from <0.1 Bq m−3 to 41 Bq m−3. The median value was 1.2 Bq m−3. Replacing the below detection limit values with values of 0.05 Bq m−3 (=half the detection limit) gives an average activity concentration of 2.2 Bq m−3. For comparison, a geometric mean 222Rn content of 2.5 Bq m−3 of the air 6 m above the ground was observed in southern Finland.16 In Poland the arithmetic mean outdoor 222Rn activity concentration was 5 Bq m−3 in Łódź, 6 Bq m−3 in Ciosny and 10 Bq m−3 in Kraków.17 In Slovenia a geometric mean value of 12 Bq m−3 was measured.18 In New York City, USA, an average outdoor 222Rn content of 4.2 Bq m−3 in the air was observed during a period of seven years.19 In Sicily, around the summit of Etna volcano, the average level of outdoor 222Rn was in the range of 4.8–9.6 Bq m−3 with a possible influence by the volcano emissions.20 In Andalucia, south-western Spain an average 222Rn content of 3.5 Bq m−3 of the outdoor air 10 m above the ground was observed.21 In Saudi Arabia 222Rn in outdoor air was measured at 16 sites with values ranging between 6.2 and 13.3 Bq m−3.22
3.2. Seasonal and diurnal variation
The highest 222Rn activity concentrations occur during winter months November–February with very little diurnal variation (Fig. 3). In the absence of solar radiation, the atmospheric boundary layer is stratified and the 222Rn transported from the soil to the atmosphere remains in the ground-level air. The snow cover has a minor effect on the diffusion of 222Rn into the atmosphere. In March, the midday solar radiation is strong enough to cause convective flows, which transport 222Rn upwards in the air. The minimum 222Rn activity concentrations are found in April–June. The high ground-water level and wet surface soil reduce the diffusion of 222Rn into the air. Simultaneously the abundant solar radiation causes efficient vertical mixing of the atmospheric boundary layer. In July–September the ground-water level decreases which supports the transfer of 222Rn from the soil into the atmosphere. Frequent nocturnal surface inversions raise the average 222Rn concentration level from evening hours to morning hours. In October, the relatively low 222Rn concentrations can be explained by frequent passage of low-pressure areas with associated strong winds and the wet surface soil due to precipitation. Compared to southern Finland the late summer diurnal variation is much less prominent.2,16 On the other hand, the seasonal variation is deeper at Sevettijärvi than in southern Finland.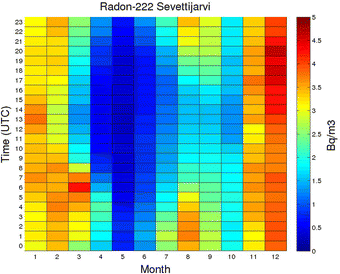 | ||
| Fig. 3 Mean seasonal and diurnal variation of 222Rn activity concentration (Bq m−3) in surface air at Sevettijärvi, northern Finland. Local time is UTC+2. | ||
The observed diurnal variation of 222Rn content of the air is similar to that found in southern Finland,16 Poland,17 Germany,23 Czech Republic24 and China.25 High values are encountered around the Sun rise when the vertical temperature inversion stratifies the lowermost troposphere. Low values prevail in the afternoon when the solar radiation causes convective flows that dilute radon by transporting it upwards in the troposphere. Earlier studies show that in northern regions the atmospheric residence time of aerosol particles carrying 222Rn progeny is longer in winter than in summer.26,27
3.3. Effects of atmospheric stability conditions
A widely used method in air quality studies for assessing the mixing conditions in the surface-level air has been the Pasquill stability classification. This stability classification scheme takes into consideration the wind speed and cloud cover. It also takes into consideration the intensity of solar radiation. In this work we applied the implementation for Finnish conditions adapted by Nordlund et al.28 except that we replaced the elevation angle of the Sun with solar radiation data from Utsjoki-Kevo. The mixing conditions were divided to six classes from class A (most unstable) to class F (most stable). Different classification schemes for day and night and winter and summer were used. The winter classification takes into account the snow cover that affects the solar radiation conditions by changing the albedo of the Earth' surface. Winter conditions with snow cover were expected to prevail from 1 January to 15 May and from 16 October to 31 December.7 Summer classification was used for 222Rn activity concentration observations between May 16 and October 16. The difference between day and night was based on the hourly sum of global radiation with zero values indicating night-time conditions. The day-time conditions were divided to three classes, 1–799 kJ m−2, 800–1599 kJ m−2, and 1600–2400 kJ m−2.The average 222Rn activity concentration in different stability classes is depicted in Fig. 4 and in Table 1. Evidently the concentration values do not differ much from classes A to E. Only during very stable conditions with the class F the average 222Rn activity concentration is about twice the concentrations in the other classes. Based on these results one can conclude that most of 222Rn activity in the air is long-range transported. Only during very stable conditions local 222Rn emissions make a significant contribution to the 222Rn content of the surface air.
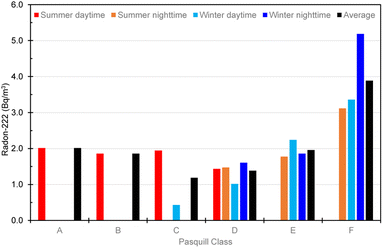 | ||
| Fig. 4 Radon-222 activity concentration (Bq m−3) in the surface air classified according to modified Pasquill stability class, Sevettijärvi, northern Finland. | ||
| A | B | C | D | E | F | |
|---|---|---|---|---|---|---|
| Summer daytime | 2.01 | 1.86 | 1.94 | 1.43 | ||
| Summer nighttime | 1.47 | 1.78 | 3.12 | |||
| Winter daytime | 0.43 | 1.02 | 2.24 | 3.36 | ||
| Winter nighttime | 1.61 | 1.86 | 5.19 | |||
| Average | 2.01 | 1.86 | 1.19 | 1.38 | 1.96 | 3.89 |
3.4. Effect of wind conditions
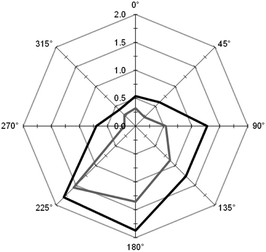
About 99% of the airborne 222Rn originates from land and only 1% from the sea.29 Thus, low 222Rn activity concentrations are observed in maritime and Arctic air masses and high concentrations in continental air masses. At Sevettijärvi low 222Rn activity concentrations in the surface air are observed during northerly winds as there are practically no 222Rn sources north of Sevettijärvi (Fig. 5). On the other hand, high 222Rn activity concentrations are measured when air masses with recent contact to continental areas are transported to the Sevettijärvi area by southerly winds. The 222Rn activity concentrations decrease with the increasing wind speed values. This is related to the increasing mechanical turbulence which dilutes the 222Rn upwards in the air.The 222Rn exposure (activity concentrations multiplied with exposure times) as a function of the wind direction is even more emphasized to southwesterly winds than the activity concentrations (Fig. 6). This is due to the climatic conditions with prevailing southwestern winds. In both cases, the activity concentration and the exposure, the contribution of calm situations (wind speed 0–0.5 m s−1) is significant.
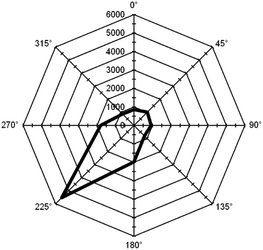 | ||
| Fig. 6 Exposure to 222Rn (Bq h m−3) in surface air as a function of wind direction at Sevettijärvi, northern Finland, wind speed > 0.5 m s−1, calm cases with wind speed 0–0.5 m s−1: 4883 Bq h m−3. | ||
3.5. Radon-222 source area analysis
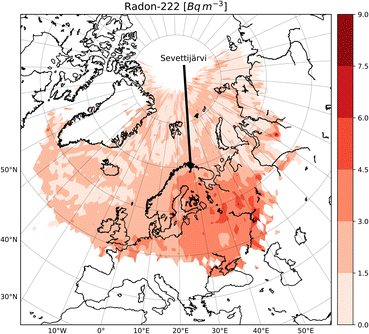
To analyse the source areas of air masses arriving Sevettijärvi and containing varying amount of 222Rn a set of three-dimensional air mass trajectories arriving Sevettijärvi were calculated 120 hours backwards in time using the trajectory model FLEXTRA.30 The meteorological data for the trajectory calculations were obtained from the European Centre for Medium-Range Weather Forecasts (ECMWF). Eight trajectories per day with arrival times of 00, 03, 06, 09, 12, 15, 18, and 21 UTC were computed. 120 hourly locations of each trajectory arriving Sevettijärvi were combined with the 222Rn activity concentrations observed during the moment of arrival. Next, the concentration–location pairs of all the trajectories were averaged over cells of 1° latitude and 1° longitude. Obviously, the statistical accuracy decreases with increasing distance from Sevettijärvi, as the averaged area contains fewer and fewer concentration–location pairs. Earlier a similar method has been used at the Finnish Meteorological Institute to identify the sources of airborne substances, e.g., atmospheric fine particles and sulphur dioxide, 210Pb and 7Be in the Arctic area.5,6,31–33The source area analysis indicates that highest 222Rn activity concentrations are found in air masses coming from continental regions in south and south-east (Fig. 7). Low 222Rn activity concentrations can be linked to maritime and Arctic air masses originating from the Atlantic Ocean and the Arctic Ocean. Earlier results that 210Pb, a decay product of 222Rn, can be transported to northern Finland from North America, are not evident in this analysis.32
3.6. Radiation dose estimates
Reindeer herding families at Sevettijärvi maintain a way of living, including dietary habits, which differs significantly from the general population in Finland. Practically all families live in wooden single-family houses but they spend an estimated 30% of time in outdoor activities, e.g. reindeer herding, fishing, hunting and berry picking. Compared to present day western diet, the Sevettijärvi residents consume large amounts of local food items: meat and other edible parts of reindeer, freshwater fish, berries etc. Radiation dose due to outdoor 222Rn was calculated and compared with other sources of radiation exposure (Fig. 8). As expected the largest dose contribution, over 1700 μSv a−1, comes from indoor 222Rn. The second largest contribution, 760 μSv a−1, is due to X-ray examinations and radiation therapy. The dose caused by ingested radionuclides, 700 μSv a−1, is twice the dose received by the general population.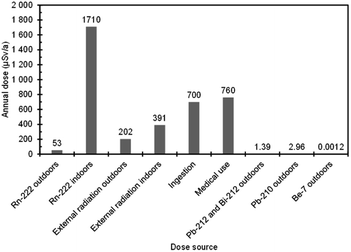 | ||
| Fig. 8 Estimates of radiation doses (μSv a−1) due to different sources for the Sevettijärvi residents. | ||
It has been known for six decades that the food-chain lichen–reindeer–man efficiently enriches radionuclides into man.34–37 However, this is not reflected in cancer incidence rates.38 External radiation outdoors and indoors, together about 600 μSv a−1, is mainly due to cosmic radiation and gamma radiation from the ground. Outdoor 222Rn, including its short-lived progeny, causes an order of magnitude lower dose contribution, about 50 μSv a−1. The sample air intake was 6 m above the ground. Especially during stable atmospheric conditions the 222Rn activity concentration at inhalation height, 1–2 m above ground, can be clearly higher. Thus, the inhalation dose can be somewhat underestimated. The dose caused by airborne aerosol-bound radionuclides is marginal. These estimates were obtained with the following assumptions:
- The residents spend 30% of time outdoors.
- The dose due to 222Rn both indoors and outdoors was calculated with the UNSCEAR-based equation by Li et al.39 Equilibrium factors of 1 and 0.4 for 222Rn and its progeny were used for outdoors and indoors, respectively. Significant disequilibrium cases of 222Rn and its progeny are rare outdoors as most of the 222Rn is long-range transported. The transport time allows progeny to grow in close to equilibrium with 222Rn.15 The average indoor 222Rn concentration for the Sevettijärvi region was obtained from the radon statistics published by the STUK – Radiation and Nuclear Safety Authority (https://www.stuk.fi).
- The doses caused by external radiation were based on ionization chamber measurements at Sodankylä, northern Finland and the observations that the external radiation is 17% weaker indoors compared to outdoors.40,41
- The dose due to medical use of radiation was taken from the annual report of STUK – Radiation and Nuclear Safety Authority.3
- The dose from ingestion was obtained from the report of Solatie et al.42
- The dose due to airborne 7Be, 210Pb, and 220Rn progeny (212Pb and 212Bi) was calculated with the observed activity concentrations and ICRP inhalation dose conversion coefficients.14,32,43,44
4 Conclusions
Observations of outdoor 222Rn at Sevettijärvi, Arctic Finland indicate that its activity concentration is strongly dependent on meteorological conditions. Wind speed and direction, vertical mixing and source areas of air masses all have an effect on the 222Rn content of the air. The results show that, excluding very stable mixing conditions, most of the 222Rn is long-range transported. The radiation dose caused by outdoor 222Rn is only about one per cent of the total radiation dose for the Sevettijärvi residents.Author contributions
Conceptualization: JP, data curation: JP, JH, formal analysis: JP, JH, THV, funding acquisition: JP, investigation: JP, methodology: JP, project administration: JP, resources: JP, software: JP, JH, supervision: JP, validation: JP, JH, visualization: JP, JH, THV, writing – original draft: JP, JH, THV, writing – review & editing: JP.Conflicts of interest
There are no conflicts to declare.Acknowledgements
The authors would like to thank Mrs Toini Sanila and her family for the routine maintenance of the Sevettijärvi monitoring station, Mr Kari Karhunen for the help with the FMI's meteorological observation data base, and Mrs Tiina Sanila-Aikio for useful discussions concerning living habits of the Sevettijärvi residents. The data analysis and manuscript preparation were funded by the Ministry for Foreign Affairs of Finland/Baltic Sea, Arctic and Barents programme, research agreement VN/17963/2020, “Sources and health effects of radioactive substances within the Arctic area”.Notes and references
- G. C. Simpson, Philos. Trans. R. Soc., A, 1905, 205, 61–97, DOI:10.1098/rsta.1906.0003.
- R. Mattsson, J. Geophys. Res., 1970, 75, 1741–1744, DOI:10.1029/JC075i009p01741.
- Environmental Radiation Monitoring in Finland. Annual Report 2020, STUK-B268, ed. A. Mattila and S. Inkinen, STUK – Radiation and Nuclear Safety Authority, Helsinki, Finland, 2021 Search PubMed.
- E. Tikkanen and I. Niemelä, Kola Peninsula Pollutants and Forest Ecosystems in Lapland. Final Report of the Lapland Forest Damage Project, Finland's Ministry of Agriculture and Forestry and the Finnish Forest Research Institute, Helsinki, Finland, 1995 Search PubMed.
- A. Virkkula, R. E. Hillamo, V.-M. Kerminen and A. Stohl, Boreal Environ. Res., 1998, 2, 317–336 Search PubMed.
- A. Virkkula, K. Teinilä, R. Hillamo and A. Stohl, Boreal Environ. Res., 2003, 8, 351–363 CAS.
- P. Pirinen, H. Simola, J. Aalto, J.-P. Kaukoranta, P. Karlsson and R. Ruuhela, Climatological Statistics of Finland 1981–2010. Reports 2012:1, Finnish Meteorological Institute, Helsinki, Finland, 2012 Search PubMed.
- P. Lahermo, T. Tarvainen, T. Hatakka, B. Backman, R. Juntunen, N. Kortelainen, T. Lakomaa, M. Nikkarinen, P. Vesterbacka, U. Väisänen and P. Suomela, One Thousand Wells – the Physical-Chemical Quality of Finnish Well Waters in 1999. Report of Investigation No. 155, Geological Survey of Finland, Espoo, Finland, 2002 Search PubMed.
- The Geochemical Atlas of Finland – Part 2: till, ed. T. Koljonen, Geological Survey of Finland, Espoo, Finland, 1992 Search PubMed.
- P. Turunen and H. Salmirinne, Geofysikaalinen kartoitus. 53–65, in Lapin Geologiset Luonnonvarat 2010. Acta Lapponica Fenniae No. 25, ed. P. Sarala, Lapin tutkimusseura ry, Rovaniemi, Finland, 2012 Search PubMed.
- J. Paatero, J. Hatakka, R. Mattsson and I. Lehtinen, Radiat. Prot. Dosim., 1994, 54, 33–39 CrossRef CAS.
- D. Schmithüsen, S. Chambers, B. Fischer, S. Gilge, J. Hatakka, V. Kazan, R. Neubert, J. Paatero, M. Ramonet, C. Schlosser, S. Schmid, A. Vermeulen and I. Levin, Atmos. Meas. Tech., 2017, 10, 1299–1312, DOI:10.5194/amt-10-1299-2017.
- Environmental Radiation Monitoring in Finland. Annual Report 2000, ed. R. Mustonen, STUK – Radiation and Nuclear Safety Authority, Helsinki, Finland, 2001 Search PubMed.
- R. Mattsson, J. Paatero and J. Hatakka, Radiat. Prot. Dosim., 1996, 63, 133–139 CrossRef CAS.
- R. Mattsson, V. A. Helminen and C. Sucksdorff, Some Investigations of Airborne Radioactivity with a View to Meteorological Applications, Contributions No. 58, Finnish Meteorological Office, Helsinki, Finland, 1965 Search PubMed.
- X. Chen, J. Paatero, V.-M. Kerminen, L. Riuttanen, J. Hatakka, V. Hiltunen, P. Paasonen, A. Hirsikko, A. Franchin, H. E. Manninen, T. Petäjä, Y. Viisanen and M. Kulmala, Boreal Environ. Res., 2016, 21, 299–318 Search PubMed.
- A. Podstawczyńska, K. Kozak, W. Pawlak and J. Mazur, Nukleonika, 2010, 55, 543–547 Search PubMed.
- J. Vaupotič, I. Kobal and M. J. Križman, Nukleonika, 2010, 55, 579–582 Search PubMed.
- I. M. Fisenne and H. W. Keller, Environ. Int., 1996, 22, S131–S138 CrossRef CAS.
- J. Vaupotič, P. Žvab and S. Giammanco, Nukleonika, 2010, 55, 573–577 Search PubMed.
- C. Grossi, D. Arnold, J. A. Adame, I. López-Coto, J. P. Bolívard, B. A. de la Morena and A. Vargas, Radiat. Meas., 2012, 47, 149–162, DOI:10.1016/j.radmeas.2011.11.006.
- A. A. Kinsara, E.-S. I. Shabana, W. H. Abulfaraj and M. M. T. Qutub, Health Phys., 2015, 108, 59–66 CrossRef CAS PubMed.
- J. Porstendorfer, G. Butterweck and A. Reineking, Health Phys., 1994, 67, 283–287 CrossRef CAS PubMed.
- P. Otahal and I. Burian, Nukleonika, 2010, 55, 539–542 CAS.
- G. Peng, W. Yi, S. Zhiyan and S. Xueyun, Chin. J. Radiol. Med. Prot., 2020, 40, 698–701, DOI:10.3760/cma.j.issn.0254-5098.2020.09.008.
- T. Suzuki, N. Nakayama, M. Igarashi, K. Kamiyama and O. Watanabe, Concentrations of 210Pb and 210Po in the atmosphere of Ny-Ålesund. Svalbard, Memoirs of National Institute of Polar Research, 1996, 51, 233–237 Search PubMed.
- W. Zhang, J. Chen, K. Ungar and M. Cooke, J. Environ. Radioact., 2015, 141, 123–129, DOI:10.1016/j.jenvrad.2014.12.008.
- G. Nordlund, A.-L. Riekkinen and B. Tammelin, Pasquill-tyyppinen Ilman Epäpuhtauksien Leviämismalli, Tiedonantoja No. 31, Ilmatieteen laitos, Helsinki, Finland, 1976 Search PubMed.
- M. Baskaran, C. H. Coleman and P. H. Santschi, J. Geophys. Res., 1993, 98, 20555–20571, DOI:10.1029/93JD0218.
- A. Stohl and P. Seibert, Q. J. R. Meteorol. Soc., 1998, 124, 1465–1484, DOI:10.1002/qj.49712454907.
- A. Virkkula, M. Mäkinen, R. Hillamo and A. Stohl, Water, Air, Soil Pollut., 1995, 85, 1997–2002 CrossRef CAS.
- J. Paatero and J. Hatakka, Health Phys., 2000, 79, 691–696, DOI:10.1097/00004032-200012000-00015.
- J. Paatero, M. Buyukay, K. Holmén, J. Hatakka and Y. Viisanen, Polar Res., 2010, 29, 345–352 CrossRef CAS.
- J. K. Miettinen, A. Jokelainen, P. Roine, K. Lidén and Y. Naversten, Ann. Acad. Sci. Fenn. Ser. A II Chem., 1963, 120, 5–46 Search PubMed.
- T. Jaakkola, M. Keinonen, M. Hakanen and J. K. Miettinen, Investigations of the transfer of plutonium and americium from plants to reindeer and man in Finnish Lapland. 509–524, in Actinides in Man and Animals, Proceedings of the Snowbird Actinide Workshop, 15–17 October 1979, ed. M. E. Wrenn, RD Press, Salt Lake City, USA, 1981 Search PubMed.
- J. Paatero and S. Salminen-Paatero, J. Environ. Radioact., 2020, 212, 106–126, DOI:10.1016/j.jenvrad.2019.106126.
- S. Salminen-Paatero and J. Paatero, Int. J. Environ. Res. Public Health, 2021, 18, 10577–10593 CrossRef CAS PubMed.
- L. Soininen and H. Mussalo-Rauhamaa, Int. J. Environ. Res. Public Health, 2021, 18, 8186–8201 CrossRef PubMed.
- X. Li, H. Ke, C. Ouyang, X. Yu, Y. Liu, F. Wang and W. Li, PLoS One, 2021, 16, e0253463 CrossRef CAS PubMed.
- J. Paatero, E. Kyrö, H. Hatakka, V. Aaltonen and Y. Viisanen, Measurement of snow cover based on external radiation. 155–159, in The Natural Radiation Environment VII. Seventh International Symposium on the Natural Radiation Environment (NRE-VII). Radioactivity in the Environment, ed. J. P. McLaughlin, S. E. Simopoulos and F. Steinhäusler, Elsevier, Amsterdam, the Netherlands, 2005, vol. 7 Search PubMed.
- T. Jaakkola and P. Kauranen, Environmental γ-radiation Dose Rate in Finnish Lapland and southern Finland, Second International Congress of Radiation Protection Association. Brighton, 3-8 May 1970. Abstracts of papers presented at the Congress, Health Phys., 1970, 19(suppl), 70 Search PubMed.
- D. Solatie, M. Junttila and P. Vesterbacka, Radiochemistry, 2006, 48, 632–633 CrossRef CAS.
- J. Paatero, J. Hatakka, R. Mattsson and Y. Viisanen, Radiat. Prot. Dosim., 1998, 77, 191–198 CrossRef CAS.
- Compendium of Dose Coefficients Based on ICRP Publication 60, Publication 119, Annals of the ICRP, ed. C. H. Clement, 2012, p. 41 Search PubMed.
| This journal is © The Royal Society of Chemistry 2023 |

