
 Open Access Article
 This Open Access Article is licensed under a
 Creative Commons Attribution 3.0 Unported Licence
Influence of ambient and endogenous H2O2 on reactive oxygen species concentrations and OH radical production in the respiratory tract†
Eleni
Dovrou‡
*,
Steven
Lelieveld
 ,
Ashmi
Mishra
,
Ulrich
Pöschl
and
Thomas
Berkemeier
*
,
Ashmi
Mishra
,
Ulrich
Pöschl
and
Thomas
Berkemeier
*
Multiphase Chemistry Department, Max Planck Institute for Chemistry, Mainz 55128, Germany. E-mail: dovrouel@gmail.com; t.berkemeier@mpic.de
First published on 1st May 2023
Abstract
Air pollution is a major health risk, but the underlying chemical mechanisms are not yet well understood. Fine particulate matter (PM2.5) and gaseous pollutants can generate reactive oxygen species (ROS) in the epithelial lining fluid (ELF), and hydrogen peroxide (H2O2) is the most abundant ROS in the human body. Here, we show that H2O2 concentrations in the ELF may be primarily determined by the release of endogenous H2O2 and the inhalation of ambient gas-phase H2O2, while the chemical production of H2O2 through inhaled PM2.5 is less important. The production of hydroxyl radicals (˙OH), however, was strongly correlated with Fenton chemistry of PM2.5 in the model calculations. Hence, our findings suggest that the adverse health effects of PM2.5 may not be primarily related to direct chemical production of H2O2, but rather to the conversion of peroxides into more reactive species such as the ˙OH radical, or the stimulation of biological ROS production. The analysis highlights remaining uncertainties in the relevant physical, chemical and biological parameters, suggesting a critical reassessment of current paradigms in elucidating and mitigating the health effects of different types of air pollutants.
Environmental significanceEpidemiological studies show that fine particulate matter (PM2.5) is the main component responsible for the adverse health effects of air pollution. The oxidative potential of PM2.5 is defined as its ability to produce reactive oxygen species (ROS) and it is increasingly used as a marker for the toxicity of PM2.5 in air quality monitoring and field investigations. Here, we compare and contrast the ability of PM2.5 to produce ROS in the epithelial lining fluid of the lung with the influence of ambient and endogenous hydrogen peroxide. We find that, under physiological conditions, PM2.5 may only play a minor role compared to other ROS sources, which may have far-reaching implications for the assessment of air pollution toxicity. |
1. Introduction
Ambient air pollution is associated with adverse health effects and excess mortality.1,2 Fine particulate matter (PM2.5), ozone (O3), and nitrogen oxides (˙NOx ≡ ˙NO, ˙NO2) have been identified as the most hazardous components of air pollution.3,4 The causes of the toxicity of individual components and mixtures, however, remain poorly understood.5,6 PM2.5 is a complex mixture of organic and inorganic compounds, containing, also, redox-active components such as transition metals, quinones, and highly oxidized organic molecules.7–9 In the epithelial lining fluid (ELF) of the respiratory tract, a thin aqueous film and direct interface between air and body,10,11 air pollutants can dissolve and undergo chemical reactions that produce reactive oxygen species (ROS), including hydrogen peroxide (H2O2) and oxygen-centered free radicals like the superoxide anion (O2˙−) and the hydroxyl radical (˙OH).12,13 Excessive concentrations of ROS, especially in the form of ˙OH, cause damage to cells and tissue, leading to oxidative stress and inflammation.13,14 The so-called oxidative potential or the ability to produce H2O2 and other ROS in aqueous solution is often used as a measure for the toxicity of particulate air pollutants.15–17 The oxidative potential of PM2.5 samples can be determined in acellular assays, which either detect the formation of ROS such as H2O2 and ˙OH directly, or indirectly through the decay of antioxidants such as glutathione or ascorbic acid.18,19 However, H2O2 is also produced in cells and tissues and formed in the ozonolysis of surfactant lipids in the ELF.9,20–22 Additionally, it is an ubiquitous atmospheric trace gas with high water solubility. Atmospheric H2O2 is mainly produced via self-reaction of the hydroperoxyl radical (HO2˙), which is an abundant atmospheric radical formed in many (photo-)chemical processes (ESI Section S1†).23,24 In contrast to H2O2 formation by PM2.5, the contribution of endogenous aqueous and ambient gaseous H2O2 to ROS concentrations in the lung is often not considered in the assessment of air pollution toxicity.7,9,16In this work, we develop and apply a detailed kinetic multi-layer model of surface and bulk chemistry in the epithelial lining fluid of the respiratory tract (KM-SUB-ELF 2.0) to quantify the interplay of chemical ROS production from PM2.5 with the diffusion and exchange of H2O2 between the air, ELF, cellular tissues and blood vessels in the respiratory tract. Fig. 1 outlines the principal interactions of air pollutants (PM2.5, O3, ˙NO2, and H2O2) with radical and redox reaction cycles in the ELF and underlying tissues. H2O2 assumes a central position in the reaction scheme as it is an intermediate in many redox cycles and partitions to and from both the blood stream and inhaled air. Redox-active components of PM2.5 such as transition metal ions (Cu+, Fe2+) contribute to formation of H2O2 through production and conversion of superoxide.7,9 H2O2 is efficiently buffered by enzymes such as catalase in the ELF and peroxiredoxins in the cells, but can be converted into the highly reactive and noxious ˙OH radical through Fenton chemistry.7–9 Secondary organic aerosol (SOA) is a major component of ambient PM2.5 (ref. 25 and 26) and contributes to the formation of ROS in the ELF.8
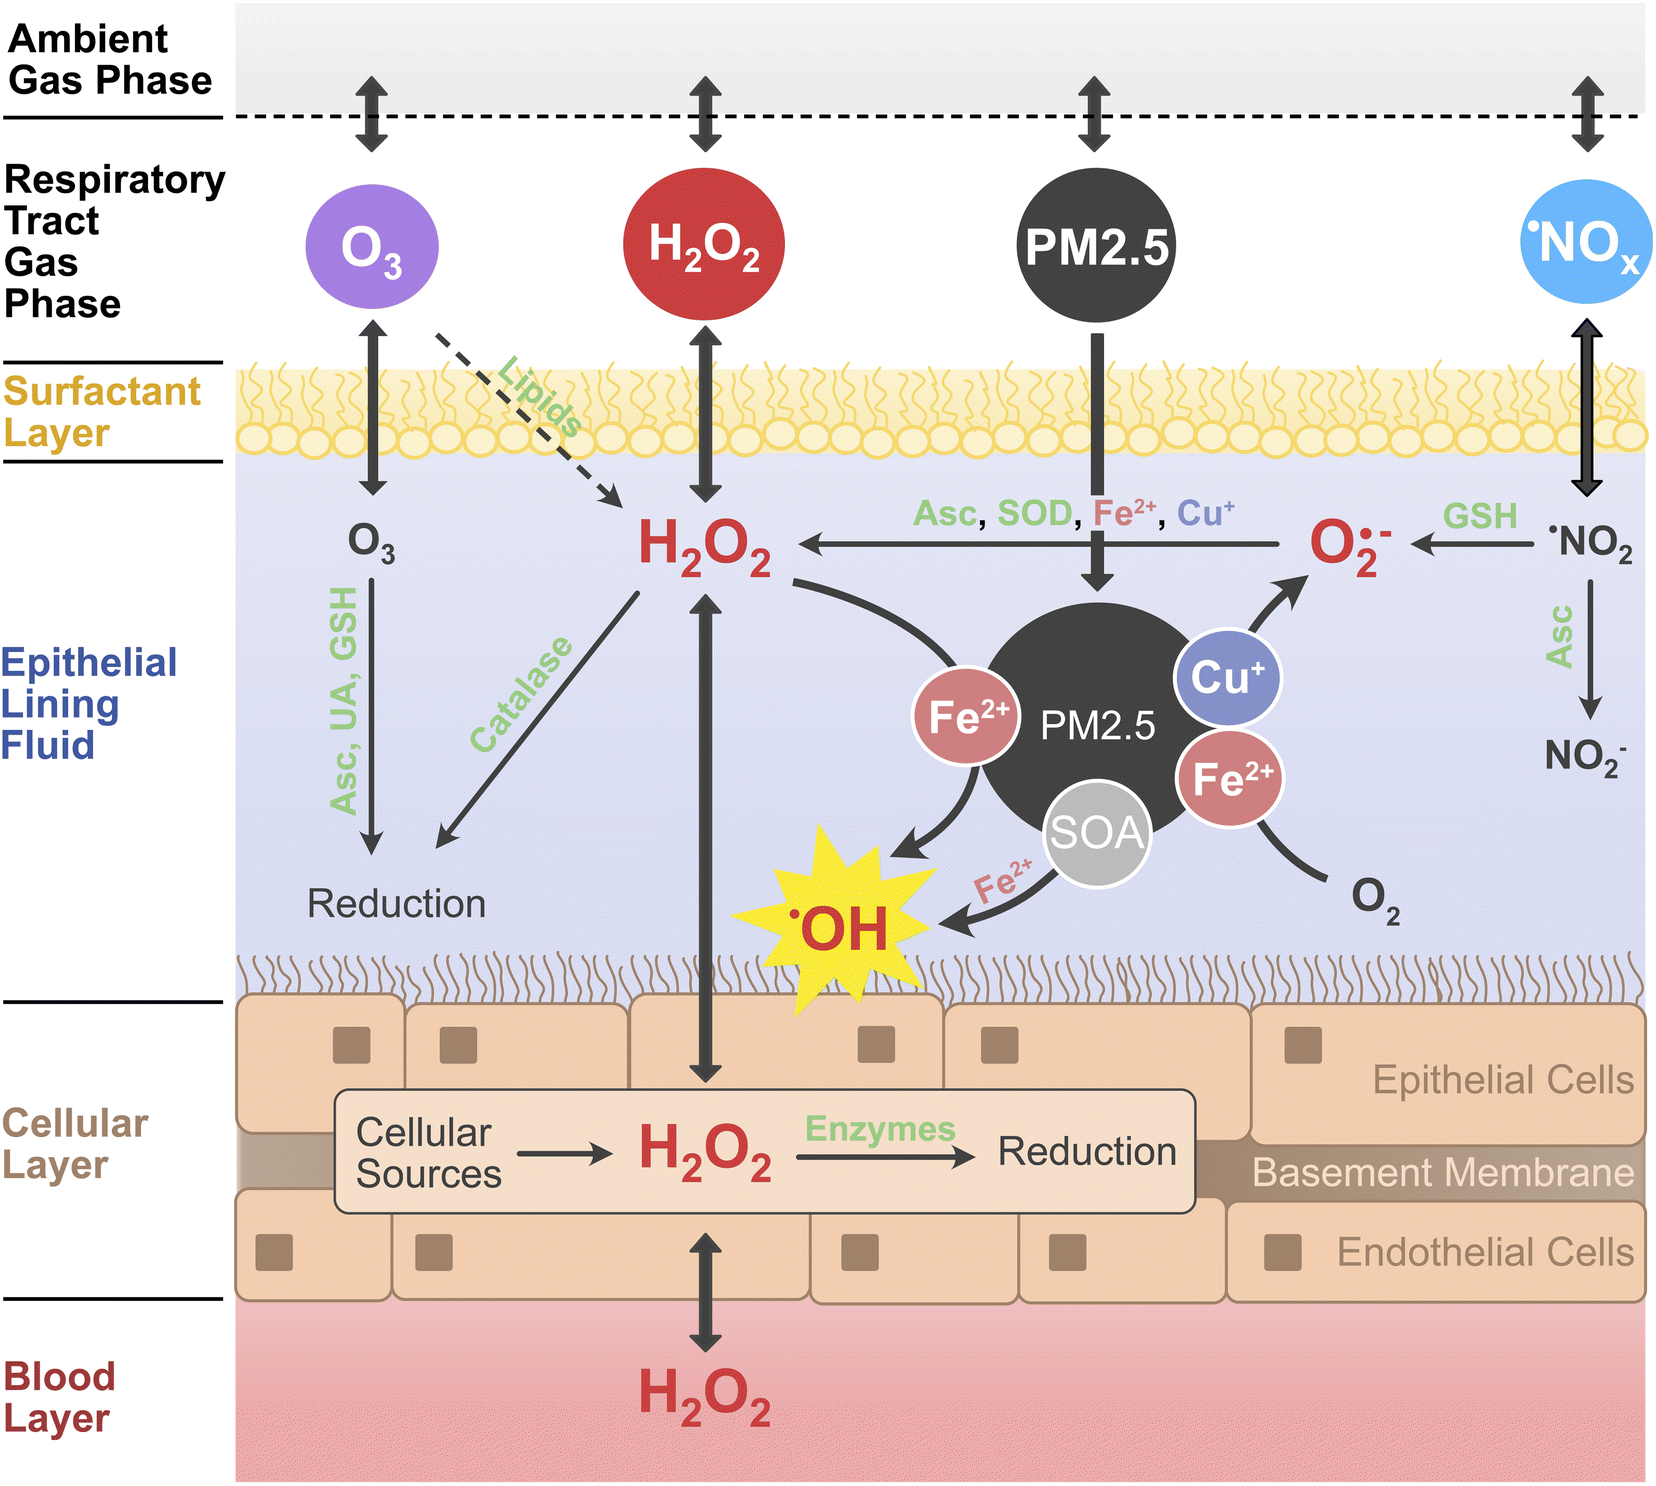 | ||
| Fig. 1 Simplified schematic representation of the chemical reactions and diffusion of H2O2 and other air pollutants (PM2.5, ˙NOx, O3) considered in the KM-SUB-ELF 2.0 model. The model consists of five major compartments: the respiratory tract gas phase, surfactant layer, the epithelial lining fluid, a layer of cells, and blood vessels. The cell layer comprises epithelial and endothelial cells as well as an intermediary basement membrane into a single compartment. Transition metals copper (Cu) and iron (Fe) contained in PM2.5 catalyze the formation and conversion of reactive oxygen species (ROS; red font). Hydroxyl radicals (˙OH) are produced from Fenton(-like) reactions of iron with H2O2 or organic peroxides contained within secondary organic aerosol (SOA). Antioxidants and enzymes (green font) including ascorbic acid (Asc), uric acid (UA), glutathione (GSH), superoxide dismutase (SOD), catalase, GSH peroxidase, and peroxiredoxins convert and scavenge ROS as well as oxidants such as O3 and ˙NO2. | ||
2. Methods
2.1 Kinetic multi-layer model
The model KM-SUB-ELF 2.0 consists of six compartments: the ambient gas phase, the gas phase of the respiratory tract, the surfactant layer, the aqueous ELF, the cellular layer, and the blood layer (Fig. 1). The model is an extended version of the model KM-SUB-ELF,7,9 which it expands through the inclusion of the cellular layer, the blood layer, and H2O2 as gas-phase pollutant. The model explicitly treats inhalation from the ambient gas phase, adsorption and desorption of gas-phase molecules to and from the surfactant layer, diffusion between the surfactant layer, ELF, cells and blood vessels, as well as 131 chemical reactions across the respiratory tract gas phase, surfactant layer, aqueous ELF, and the cellular layer (Table S1†). The air pollutants considered in the model are fine particulates smaller than 2.5 μm (PM2.5) as well as ˙NO2, O3, and H2O2 from the gas phase. The model simulates a 2 h exposure window in which pollutants are inhaled into the gas phase of the respiratory tract with a breathing rate of 1.5 m3 h−1. A fraction of 45% of inhaled particulates is deposited into the ELF at the beginning of the exposure window. We use a standardized PM2.5 composition that was established previously using the median mass fractions of redox-active PM2.5 constituents from a large set of atmospheric field measurements.9 The median mass fractions are 3.1 × 10⁻⁴ for copper, 8.1 × 10⁻³ for iron, 1.6 × 10⁻⁵ across three quinones, and 0.33 for secondary organic aerosol (SOA). For simplicity, the model does not resolve concentration gradients of gases or particulates between the upper and lower parts of the respiratory tract.The model considers three individual quinone compounds, phenanthrenequinone, 1,2-naphthoquinone, and 1,4-naphthoquinone, which were found to be most important for ROS production in acellular assays.7,16 Solubilities of the transition metals iron and copper are 10% and 40%, respectively, while quinones and SOA are assumed to fully dissolve. Low molecular mass antioxidants included in the model are ascorbate (Asc), glutathione (GSH), uric acid (UA), and α-tocopherol (α-Toc). The concentrations of antioxidants remained fixed during the 2 h exposure simulation. The surfactant layer consists of a surfactant lipid, 1-palmitoyl-2-oleoyl-sn-glycerol (POG), a surfactant protein (SP-B1–25), and α-Toc, following Lelieveld et al.9 The ozonolysis of POG in the surfactant layer yields Criegee intermediates, which are assumed to hydrolyze to H2O2 with a yield of 0.17.27 Enzymatic reactions are considered within ELF and cellular compartments: superoxide dismutase (SOD) and catalase are included in ELF, while in cells a range of H2O2-scavenging enzymes (peroxiredoxins, catalase, GSH peroxidase) are considered. Aside from transport from the blood layer, endogenous H2O2 is produced at a constant rate of 1 × 1014 cm−3 s−1 inside the cellular layer.28,29 The H2O2 concentration in the blood layer is held constant due to constant supply from the blood stream. A more detailed description of the model, including antioxidant concentrations, enzymatic reactions, biological ROS production rates, and the treatment of SOA can be found in the ESI (Sections S2–S5†).
The model code solves a system of ordinary differential equations using the stiff differential equation solver ode23tb in Matlab, and calculates the evolution of reactant concentrations over time. An explicit Jacobian matrix is provided to aid in computation. An overview of model input parameters is given in Tables S1–S4.†
2.2 Source apportionment of H2O2 and ˙OH in ELF
In this study, the source apportionment of H2O2 in the ELF could not be achieved with traditional flux analyses, i.e. comparing chemical and diffusion fluxes, due to the inherent coupling of chemical reaction and diffusion in multiple compartments. Instead, we performed a sensitivity analysis and compared five scenarios in which only a single source of H2O2 was present in the model at a time (endogenous H2O2, ambient H2O2, ˙NO2, O3, and PM2.5) to the scenario with all sources as further detailed in the ESI (Section S6†). Note that this approach was only possible because non-linear effects were almost non-existent, i.e. the H2O2 production in scenario with all sources agrees to more than 99% with the sum of the H2O2 produced in the single-source scenarios. For source apportionment of ˙OH, a traditional flux analysis could be performed due to negligible diffusion of the reactive radical across compartment boundaries.3. Results and discussion
The model calculations show that concentrations of H2O2 in ELF and cells are strongly affected by H2O2 mass transport through membranes and are sensitive to membrane permeability (Fig. 2A). Permeability of H2O2 through a single cell membrane has been reported over the large range of 10−6 to 10−3 cm s−1.30–32 H2O2 permeation in the respiratory tract may involve diffusion through several membranes, which requires introduction of an effective permeability, μeff, through tissue. Fig. 2A shows the computed H2O2 concentrations in cells and ELF as a function of μeff.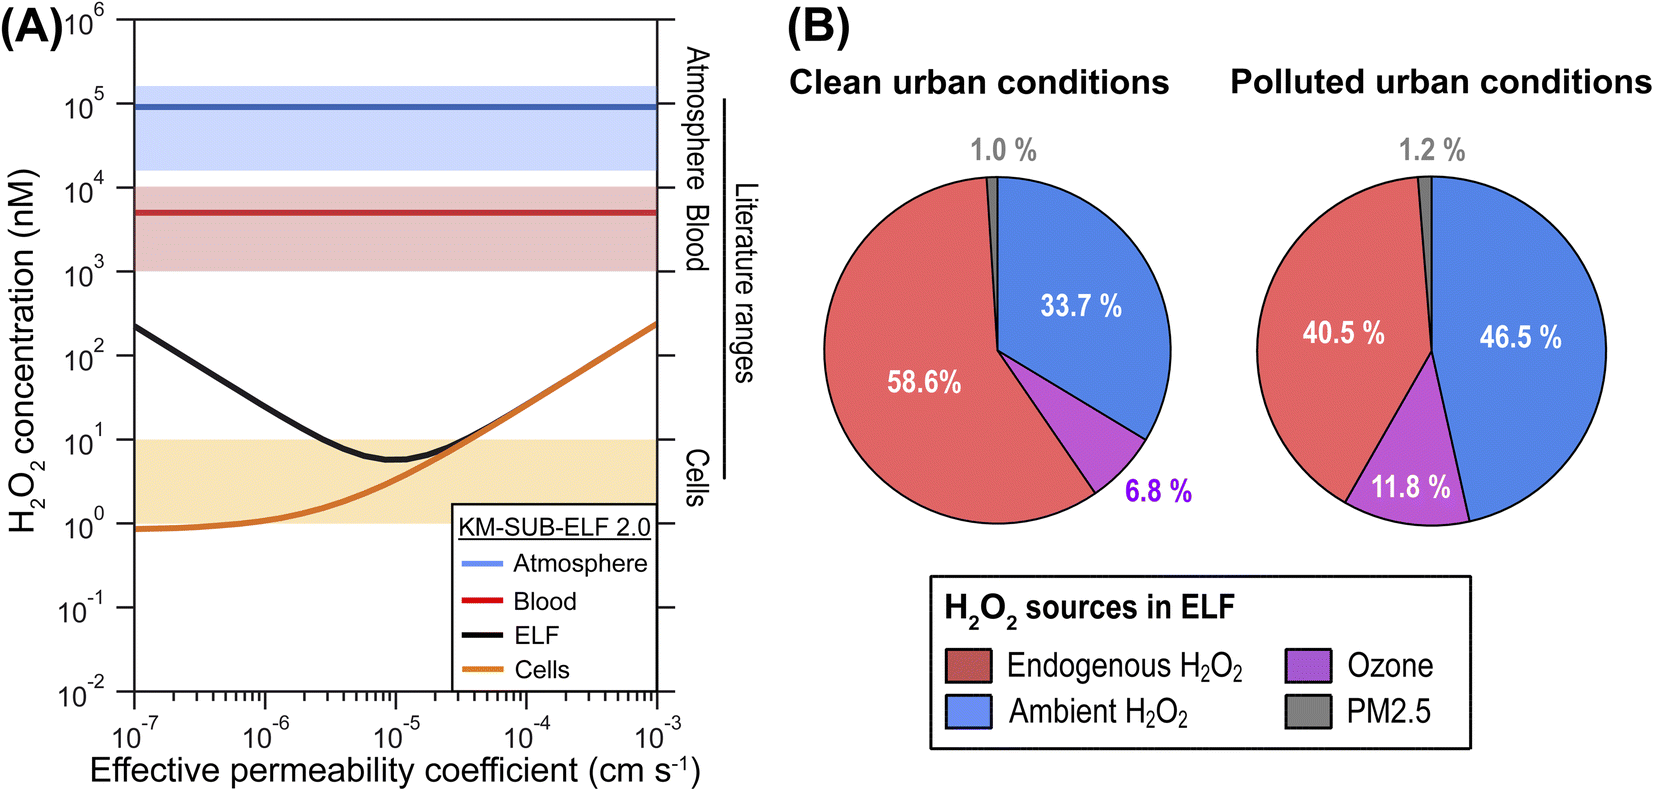 | ||
| Fig. 2 Influence of membrane permeability and sources of H2O2 in ELF. (A) H2O2 concentration in blood (red line), epithelial lining fluid (ELF; black line), and cells (orange line) as a function of the effective permeability of membranes between ELF and blood layer for H2O2 (μeff) under ambient air pollution typical for a clean urban environment (PM2.5 = 30 μg m−3, ˙NO2 = 30 μg m−3, O3 = 30 ppb, H2O2 = 1 ppb). The blue line represents an aqueous-phase concentration of H2O2 in equilibrium with the ambient gas phase concentration. The blue, red and orange shaded areas represent characteristic ranges of atmospheric, blood and cellular H2O2 concentration reported in the literature, respectively, where physiological values represent healthy individuals (Table S1†). (B) Relative contributions of different sources to the H2O2 concentration in ELF at a μeff of 1 × 10⁻⁵ cm s−1 for two ambient pollution scenarios: clean urban conditions (PM2.5 = 30 μg m−3, ˙NO2 = 30 μg m−3, O3 = 30 ppb, H2O2 = 1 ppb) and polluted urban conditions (PM2.5 = 60 μg m−3, ˙NO2 = 60 μg m−3, O3 = 75 ppb, H2O2 = 2 ppb). | ||
In line with previous estimations, the modelled H2O2 concentration in the cellular layer (∼5 nM) is three orders of magnitude lower than H2O2 concentration in the blood (∼5 μM) and four orders of magnitude lower than a liquid that is in equilibrium with the ambient gas concentration of H2O2 (∼50 μM). The supply of H2O2 from inhalation, membrane transport, as well as biological and chemical production is counteracted by enzymatic H2O2 consumption in the cells, especially peroxiredoxins, maintaining a low cellular concentration of H2O2 (Fig. S1†). The cellular consumption causes the human respiratory tract to act as a net sink of ambient H2O2, i.e., inhaled concentrations are generally larger than exhaled concentrations (Fig. S2†). This leads to very low gas-phase concentrations of H2O2 in the respiratory tract in the sub-ppt range (Fig. S3†).
The KM-SUB-ELF 2.0 results agree well with reported values for typical H2O2 concentrations in cells (1–10 nM) when μeff is smaller than 4 × 10⁻⁵ cm s−1 (Fig. 2A). In this range, the H2O2 concentration in ELF (black solid line) shows a distinct minimum at a μeff of 1 × 10⁻⁵ cm s−1. This minimum marks a change in the regime of H2O2 supply to the ELF in the model: at μeff > 1 × 10⁻⁵ cm s−1, H2O2 is transported rapidly and predominantly from the blood, leading to high cellular and ELF concentrations (endogenous H2O2 regime). In contrast, at a low μeff < 1 × 10⁻⁵ cm s−1, the ELF is more insulated from cells and blood vessels and H2O2 concentration in the ELF is determined rather by inhaled H2O2 (ambient H2O2 regime). In the following, we will discuss results in terms of the central value of 1 × 10⁻⁵ cm s−1 for μeff.
Fig. 2B shows the attribution of the H2O2 concentration in ELF to its main sources in the model. The analysis is performed for two different air pollution scenarios. Under clean urban conditions, H2O2 originates mostly from gas-phase and endogenous sources with 33.7% and 58.6%, respectively (Fig. 2B). The endogenous sources include transport from the blood stream and production of H2O2 in the cellular layer. The reaction of O3 with surfactant lipids accounts for 6.8% of H2O2 production. Only a minor portion, 1%, is due to production by constituents of PM2.5. In the scenario reflecting polluted urban conditions, elevated ambient gas-phase H2O2 levels contribute strongest to the H2O2 concentration in ELF at 46.5%. The contribution of O3 increases to 11.8% while the contribution of PM2.5 constituents remains minor at 1.2%. ˙NOx (in the form of ˙NO2) shows only negligible contributions (<0.1%) to H2O2 in both scenarios. Even higher pollution levels can be observed during haze events in megacities.33 Under such conditions (PM2.5 = 300 μg m−3),34,35 the contribution of PM2.5 constituents can reach 10% in the model calculations (Fig. S4†). We note that these numbers must be interpreted as averages over the entire respiratory tract and concentrations of the water-soluble gases H2O2 and O3 will be higher in the upper parts of the respiratory tract,36 which likely decreases their importance for the deep lung as detailed in the ESI (Section S7†). A very sensitive and rather uncertain model parameter in these calculations is the cellular production rate of H2O2, for which we can give only an order of magnitude estimate as detailed in the ESI (Section S4†), and which may dominate H2O2 sources at higher values (Fig. S4d†).
Fig. 3A shows the influence of ambient gas-phase H2O2 and PM2.5 levels on H2O2 concentration in the ELF for a range of ambient conditions. The predominantly horizontal contour lines indicate that increasing ambient H2O2 has a direct effect on the aqueous peroxide concentration in the ELF, while the influence of PM2.5 becomes evident only at very high mass loadings. In contrast, ˙OH production is primarily driven by PM2.5 levels in the model, as indicated by predominantly vertical contour lines in Fig. 3B. The secondary influence of ambient H2O2 becomes evident when levels exceed typical atmospheric values of 0–5 ppb. The concentration of H2O2 in the blood has a similar influence on model results as the ambient H2O2 concentration (Fig. S5†). These model results, however, are highly dependent on the choice of the effective membrane permeability coefficient μeff as discussed in Section S8† and shown in Fig. S5 and S6 of the ESI.†
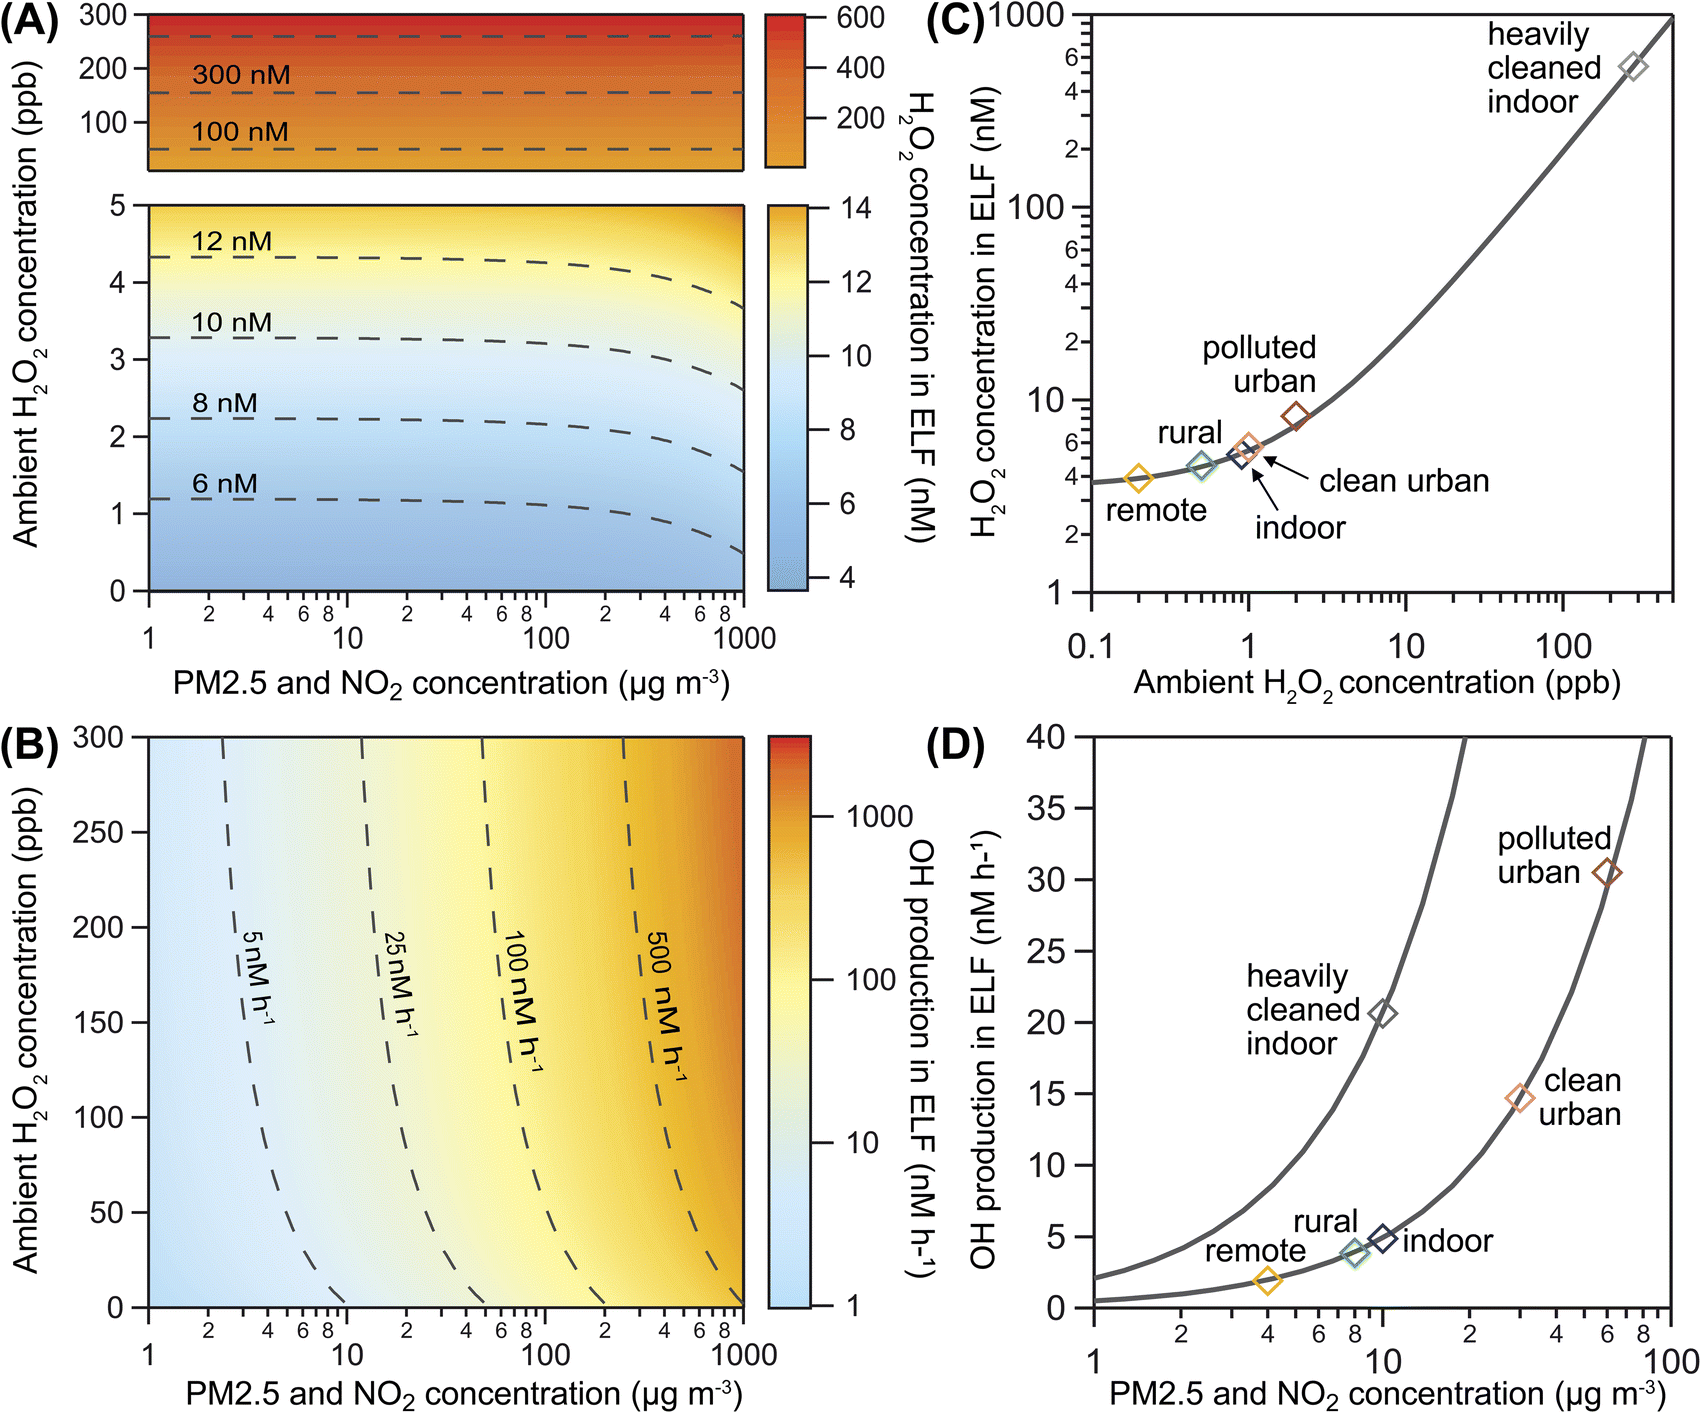 | ||
| Fig. 3 H2O2 concentration and ˙OH production in ELF. (A) H2O2 concentration in ELF and (B) ˙OH production in ELF as a function of ambient gas-phase H2O2 and PM2.5 levels. Dashed contour lines indicate conditions that lead to the same model outcome. (C) H2O2 concentrations in ELF and (D) ˙OH production in ELF for six selected air pollution scenarios (markers). Solid lines indicate the sensitivity due to variation of only ambient gas-phase H2O2 (panel C, one scenario representative for all) and PM2.5 levels (panel D, two representative scenarios). | ||
Fig. 3 also presents H2O2 concentrations (Fig. 3C) and ˙OH production (Fig. 3D) for six selected scenarios of typical atmospheric conditions (Table S2†). We find that remote, rural, and indoor air is associated with the lowest H2O2 concentrations and ˙OH production. High ambient gas-phase H2O2 in polluted urban air may cause slightly elevated H2O2 concentrations in ELF, while the high PM2.5 levels may cause significantly increased ˙OH production. In a heavily cleaned indoor space, very high ambient gas-phase H2O2 may not only control the H2O2 concentrations in ELF, but may also raise ˙OH production due to Fenton chemistry of H2O2. This scenario is in the ambient H2O2 regime, while the other scenarios are in the transition range between the ambient H2O2 and endogenous H2O2 regime. Variation of PM2.5 concentration for all scenarios (solid grey lines in Fig. 3D) reveals a steeper slope and thus a stronger sensitivity to PM2.5 in the heavily cleaned indoor space compared to the other scenarios. This result shows that ambient gas-phase H2O2 can synergistically increase the ˙OH production capability of PM2.5 and suggests a non-linear effect on oxidative stress upon exposure to both pollutants. Because of the high water solubility and efficient enzymatic removal of H2O2, we expect this effect to be most relevant in the upper respiratory tract.
The model KM-SUB-ELF 2.0 applied in this study yields H2O2 concentration levels (∼5 nM) lower than reported in earlier studies that did not consider cellular H2O2 sinks (∼100 nM)7,9 and lower than measurements of exhaled breath condensate or bronchoalveolar lavage fluid (∼100–1000 nM).37–40 The deviation from measurements may be due to an underestimation of the H2O2 production rate of epithelial cells (ESI Section S4†) or a missing endogenous source of ROS, possibly superoxide production by alveolar macrophages,41 which will be further investigated in a follow-up study. This follow-up study will also address the gradients of water-soluble trace gases between the upper and lower respiratory tract. Both aspects may reconcile the agreement with measurement data and would decrease the importance of ambient H2O2 for the deep lung. First preliminary estimations are outlined and discussed in ESI Section S7.† The main conclusion of this study that aqueous-phase chemistry of PM2.5 does not have a large contribution to the H2O2 concentration in ELF, remains unchanged (Fig. S4†).
The principal source of ˙OH among PM2.5 constituents, however, is directly affected by the H2O2 concentration in the ELF. At a low H2O2 concentration, ˙OH is produced predominantly through Fenton-like reactions of the organic peroxides contained in SOA (Fig. S7†), which may be labile and decay with a short half-life42 or follow a similar chemistry to H2O2 by forming ˙OH radicals in reactions with transition metals and water.8 In contrast, previous analyses of ELF redox chemistry identified the Fenton reaction of H2O2 as dominant ˙OH source, albeit at higher H2O2 concentrations in the ELF.7,9,15 We note that the relative contribution of the individual pathways not only depends upon the H2O2 concentration in the ELF, but may also vary with the exact composition of PM2.5 and the aqueous-phase chemistry of SOA (Fig. S8†). SOA has a highly complex and variable composition and quantitative ˙OH yields from SOA samples in epithelial lining fluid have only been reported by a few studies.8,12,43 Furthermore, organic peroxides inhaled through SOA may also be scavenged by enzymes such as peroxiredoxins and peroxidases before significant conversion to ˙OH occurs.44,45 This gap between the potential high importance of SOA in air pollution health effects and the lack of quantitative kinetic data highlights the need for further studies under controlled conditions to assess the relative importance of these two major ˙OH production channels.
4. Conclusions
The model simulations in this study show that under typical atmospheric pollution scenarios, the concentration of H2O2 in the respiratory tract is dictated by endogenous sources and ambient gas phase sources (H2O2 and O3) with similar contributions. However, a recent study suggests that macrophages contribute to ROS levels in the ELF through release of superoxide, which can be significantly enhanced through stimulation with PM2.5 constituents.41 Such an additional source of ROS, which is outside the scope of this study, may tip the scales fully in favor of endogenous sources of H2O2. Air pollution-induced changes of H2O2 concentration in the ELF thus may only be achieved directly during severe haze events, heavy indoor cleaning, or indirectly through stimulation of macrophages causing enhanced endogenous release of superoxide. As superoxide and H2O2 in ELF are likely dominated by endogenous sources, direct chemical production of superoxide and H2O2 may only play a secondary role in the adverse effects of fine particulate matter (PM2.5).Acellular oxidative potential assays, which are commonly used to assess potential PM2.5 toxicity, tend to be sensitive to superoxide and H2O2 producers such as copper ions and quinones.46 However, the findings in this study challenge the view that adverse health effects of PM2.5 are closely related to their ability of increasing ROS concentrations in the lungs. ROS are already ubiquitous in the human body, primarily in the form of H2O2, which can diffuse readily through tissues and epithelial lining fluid.47 In the ELF, H2O2 and other peroxides form a reservoir of ROS, which is tightly controlled by endogenous processes (Fig. 4). The model simulations in this study show that PM2.5 acts by conversion of peroxides into highly reactive ˙OH radicals that cause oxidative stress and damage to cells and tissues. PM2.5 may further act by stimulating the production of superoxide from endogenous sources. We therefore propose that chemical production of superoxide and H2O2 in a cell-free assay may not be a suitable metric for assessing the differential toxicity of individual PM2.5 components and some acellular oxidative potential assays may not capture the actual deleterious effects of PM2.5. Alternatives may be cellular cytotoxicity assays using air–liquid interface cell culture48 or acellular assays determining the production of ˙OH radicals,49 preferably in the presence of physiological concentrations of H2O2.
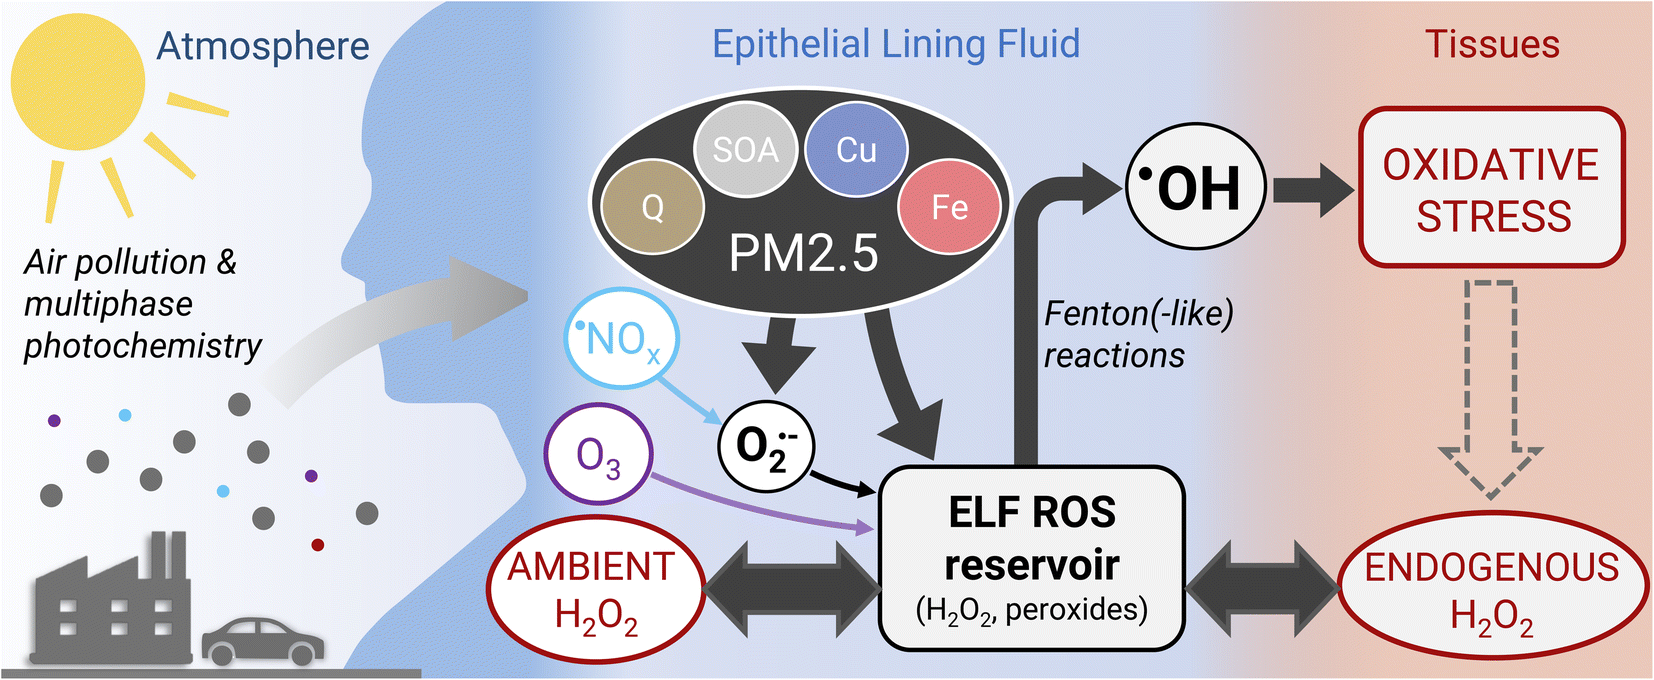 | ||
| Fig. 4 Health effects of atmospheric air pollution. The epithelial lining fluid (ELF) is a thin aqueous film at the air–body interface in which inhaled air pollutants dissolve and deposit. H2O2 and other peroxides form a reservoir of reactive oxygen species (ROS) in the ELF. H2O2 levels in the ELF are controlled by endogenous processes (endogenous H2O2 regime) or inhalation of gas-phase H2O2 (ambient H2O2 regime). A small fraction of H2O2 originates from conversion of superoxide (O2˙−) generated from interaction of fine particulate matter (PM2.5) and nitrogen oxides (˙NOx) with ELF. Other peroxides are supplied through secondary organic aerosol (SOA) contained within PM2.5 or by chemical reactions of ozone (O3). Transition metal-mediated, catalytic conversion of peroxides leads to formation of the highly reactive ˙OH radical that can trigger oxidative stress and, ultimately, cell death. | ||
Oxidative stress and disease may alter the physiological properties and redox homeostasis in the respiratory tract through effects on membrane permeability, enzyme expression, and pH value.50 This may further increase the susceptibility of diseased individuals to air pollution in the form of PM2.5 and trigger reinforcing feedback loops.51 Further investigations will be required to resolve such biological feedbacks, the differential toxicity of individual air pollutants from different sources (traffic, combustion etc.), and the cumulative effects of long-term exposure.
Author contributions
Conceptualization: E. D., S. L., U. P. and T. B., methodology: all authors, numerical simulation and validation: E. D., S. L., A. M., and T. B., formal analysis: E. D. and T. B. with assistance from S. L. and A. M., visualization: E. D., S. L., U. P. and T. B., writing–original draft: E. D. and T. B., writing–review and editing: all authors.Conflicts of interest
There are no conflicts to declare.Acknowledgements
This work was funded by the Max Planck Society. A. M. and S. L. were supported by the Max Planck Graduate Center with the Johannes Gutenberg-Universität Mainz (MPGC). We gratefully acknowledge Helmut Sies and Roel P. F. Schins for helpful discussions. Open Access funding provided by the Max Planck Society.Notes and references
- J. Lelieveld, J. S. Evans, M. Fnais, D. Giannadaki and A. Pozzer, The contribution of outdoor air pollution sources to premature mortality on a global scale, Nature, 2015, 525, 367–371 CrossRef CAS PubMed.
- R. Burnett, H. Chen, M. Szyszkowicz, N. Fann, B. Hubbell, C. A. Pope, J. S. Apte, M. Brauer, A. Cohen, S. Weichenthal, J. Coggins, Q. Di, B. Brunekreef, J. Frostad, S. S. Lim, H. Kan, K. D. Walker, G. D. Thurston, R. B. Hayes, C. C. Lim, M. C. Turner, M. Jerrett, D. Krewski, S. M. Gapstur, W. R. Diver, B. Ostro, D. Goldberg, D. L. Crouse, R. V. Martin, P. Peters, L. Pinault, M. Tjepkema, A. Van Donkelaar, P. J. Villeneuve, A. B. Miller, P. Yin, M. Zhou, L. Wang, N. A. H. Janssen, M. Marra, R. W. Atkinson, H. Tsang, T. Q. Thach, J. B. Cannon, R. T. Allen, J. E. Hart, F. Laden, G. Cesaroni, F. Forastiere, G. Weinmayr, A. Jaensch, G. Nagel, H. Concin and J. V. Spadaro, Global estimates of mortality associated with longterm exposure to outdoor fine particulate matter, Proc. Natl. Acad. Sci. U. S. A., 2018, 115, 9592–9597 CrossRef CAS PubMed.
- T. Chen, J. Gokhale, S. Shofer and W. G. Kuschner, Outdoor Air Pollution : Nitrogen Dioxide , Sulfur Dioxide , and Carbon Monoxide Health Effects, Med. Sci., 1994, 333, 249–256 Search PubMed.
- T. Fang, P. S. J. Lakey, J. C. Rivera-Rios, F. N. Keutsch and M. Shiraiwa, Aqueous-Phase Decomposition of Isoprene Hydroxy Hydroperoxide and Hydroxyl Radical Formation by Fenton-like Reactions with Iron Ions, J. Phys. Chem. A, 2020, 124, 5230–5236 CrossRef CAS PubMed.
- J. Lelieveld and U. Pöschl, the Air-Pollution Health Crisis, Nat. Commun., 2017, 551, 291–293 CrossRef PubMed.
- J. J. West, A. Cohen, F. Dentener, B. Brunekreef, T. Zhu, B. Armstrong, M. L. Bell, M. Brauer, G. Carmichael, D. L. Costa, D. W. Dockery, M. Kleeman, M. Krzyzanowski, N. Künzli, C. Liousse, S. C. C. Lung, R. V. Martin, U. Pöschl, C. A. Pope, J. M. Roberts, A. G. Russell and C. Wiedinmyer, What We Breathe Impacts Our Health: Improving Understanding of the Link between Air Pollution and Health, Environ. Sci. Technol., 2016, 50, 4895–4904 CrossRef CAS PubMed.
- P. S. J. Lakey, T. Berkemeier, H. Tong, A. M. Arangio, K. Lucas, U. Pöschl and M. Shiraiwa, Chemical exposure-response relationship between air pollutants and reactive oxygen species in the human respiratory tract, Sci. Rep., 2016, 6, 1–6 CrossRef PubMed.
- H. Tong, A. M. Arangio, P. S. J. Lakey, T. Berkemeier, F. Liu, C. J. Kampf, W. H. Brune, U. Poschl and M. Shiraiwa, Hydroxyl radicals from secondary organic aerosol decomposition in water, Atmos. Chem. Phys., 2016, 16, 1761–1771 CrossRef CAS.
- S. Lelieveld, J. Wilson, E. Dovrou, A. Mishra, P. S. J. Lakey, M. Shiraiwa, U. Pöschl and T. Berkemeier, Hydroxyl Radical Production by Air Pollutants in Epithelial Lining Fluid Governed by Interconversion and Scavenging of Reactive Oxygen Species, Environ. Sci. Technol., 2021, 55, 14069–14079 CrossRef CAS PubMed.
- K. A. Jellinger, Neuroproteomics Methods and Protocols, Eur. J. Neurol., 2010, 17, e33 CrossRef.
- K. A. Rodvold, M. H. Gotfried, J. G. Still, K. Clark and P. Fernandes, Comparison of plasma, epithelial lining fluid, and alveolar macrophage concentrations of solithromycin (CEM-101) in healthy adult subjects, Antimicrob. Agents Chemother., 2012, 56, 5076–5081 CrossRef CAS PubMed.
- J. Wei, T. Fang, P. S. J. Lakey and M. Shiraiwa, Iron-Facilitated Organic Radical Formation from Secondary Organic Aerosols in Surrogate Lung Fluid, Environ. Sci. Technol., 2022, 56(11), 7234–7243 CrossRef CAS PubMed.
- H. Sies, Hydrogen peroxide as a central redox signaling molecule in physiological oxidative stress: Oxidative eustress, Redox Biol., 2017, 11, 613–619 CrossRef CAS PubMed.
- A. Peters, T. S. Nawrot and A. A. Baccarelli, Hallmarks of environmental insults, Cell, 2021, 184, 1455–1468 CrossRef CAS PubMed.
- T. Fang, P. S. J. Lakey, R. J. Weber and M. Shiraiwa, Oxidative Potential of Particulate Matter and Generation of Reactive Oxygen Species in Epithelial Lining Fluid, Environ. Sci. Technol., 2019, 53, 12784–12792 CrossRef CAS PubMed.
- J. G. Charrier, A. S. McFall, N. K. Richards-Henderson and C. Anastasio, Hydrogen peroxide formation in a surrogate lung fluid by transition metals and quinones present in particulate matter, Environ. Sci. Technol., 2014, 48, 7010–7017 CrossRef CAS PubMed.
- H. Sakugawa, I. R. Kaplan, W. Tsai and Y. Cohen, Atmospheric hydrogen peroxide, Environ. Sci. Technol., 1990, 24, 1452–1462 CrossRef CAS.
- P. Shahpoury, Z. Zhang, A. Filippi, S. Hildmann, S. Lelieveld, B. R. Patel, A. Traub, D. Umbrio, M. Wietzoreck, J. Wilson, T. Berkemeier, V. Celo, E. Dabek-Zlotorzynska, G. Evans, T. Harner, K. Kerman, G. Lammel, M. Noroozifar, U. Pöschl and H. Tong, Inter-comparison of oxidative potential metrics for airborne particles identifies differences between acellular chemical assays, Atmos. Pollut. Res., 2022, 13, 1–14 Search PubMed.
- J. T. Bates, T. Fang, V. Verma, L. Zeng, R. J. Weber, P. E. Tolbert, J. Y. Abrams, S. E. Sarnat, M. Klein, J. A. Mulholland and A. G. Russell, Review of Acellular Assays of Ambient Particulate Matter Oxidative Potential: Methods and Relationships with Composition, Sources, and Health Effects, Environ. Sci. Technol., 2019, 53, 4003–4019 CrossRef CAS PubMed.
- H. Sies, C. Berndt and D. P. Jones, Oxidative stress, Annu. Rev. Biochem., 2017, 86, 715–748 CrossRef CAS PubMed.
- P. Neeb, F. Sauer, O. Horie and G. K. Moortgat, Formation of hydroxymethyl hydroperoxide and formic acid in alkene ozonolysis in the presence of water vapour, Atmos. Environ., 1997, 31, 1417–1423 CrossRef.
- M. Zeng, N. Heine and K. R. Wilson, Evidence that criegee intermediates drive autoxidation in unsaturated lipids, Proc. Natl. Acad. Sci. U. S. A., 2020, 117, 4486–4490 CrossRef CAS PubMed.
- D. Vione, V. Maurino, C. Minero and E. Pelizzetti, The atmospheric chemistry of hydrogen peroxide: A review, Ann. Chim., 2003, 93, 477–488 CAS.
- J. H. Seinfeld and S. N. Pandis, Atmospheric Chemistry and Physics: from Air Pollution to Climate Change, 3rd edn, 2016 Search PubMed.
- J. L. Jimenez, M. R. Canagaratna, N. M. Donahue, A. S. H. Prevot, Q. Zhang, J. H. Kroll, P. F. DeCarlo, J. D. Allan, H. Coe, N. L. Ng, A. C. Aiken, K. S. Docherty, I. M. Ulbrich, A. P. Grieshop, A. L. Robinson, J. Duplissy, J. D. Smith, K. R. Wilson, V. A. Lanz, C. Hueglin, Y. L. Sun, J. Tian, A. Laaksonen, T. Raatikainen, J. Rautiainen, P. Vaattovaara, M. Ehn, M. Kulmala, J. M. Tomlinson, D. R. Collins, M. J. Cubison, E. J. Dunlea, J. A. Huffman, T. B. Onasch, M. R. Alfarra, P. I. Williams, K. Bower, Y. Kondo, J. Schneider, F. Drewnick, S. Borrmann, S. Weimer, K. Demerjian, D. Salcedo, L. Cottrell, R. Griffin, A. Takami, T. Miyoshi, S. Hatakeyama, A. Shimono, J. Y. Sun, Y. M. Zhang, K. Dzepina, J. R. Kimmel, D. Sueper, J. T. Jayne, S. C. Herndon, A. M. Trimborn, L. R. Williams, E. C. Wood, A. M. Middlebrook, C. E. Kolb, U. Baltensperger and D. R. Worsnop, Evolution of organic aerosols in the atmosphere, Science, 2009, 326, 1525–1529 CrossRef CAS PubMed.
- M. Hallquist, J. C. Wenger, U. Baltensperger, Y. Rudich, D. Simpson, M. Claeys, J. Dommen, N. M. Donahue, C. George, A. H. Goldstein, J. F. Hamilton, H. Herrmann, T. Hoffmann, Y. Iinuma, M. Jang, M. E. Jenkin, J. L. Jimenez, A. Kiendler-Scharr, W. Maenhaut, G. McFiggans, T. F. Mentel, A. Monod, A. S. H. Prévôt, J. H. Seinfeld, J. D. Surratt, R. Szmigielski and J. Wildt, The formation, properties and impact of secondary organic aerosol: Current and emerging issues, Atmos. Chem. Phys., 2009, 9, 5155–5236 CrossRef CAS.
- Z. Zhou and J. P. D. Abbatt, Formation of Gas-Phase Hydrogen Peroxide via Multiphase Ozonolysis of Unsaturated Lipids, Environ. Sci. Technol. Lett., 2021, 8, 114–120 CrossRef CAS.
- V. L. Kinnula, J. I. Everitt, A. R. Whorton and J. D. Crapo, Hydrogen peroxide production by alveolar type II cells, alveolar macrophages, and endothelial cells, Am. J. Physiol.: Lung Cell. Mol. Physiol., 1991, 261, L84–L91 CrossRef CAS PubMed.
- W. J. Piotrowski, J. Marczak, D. Dinsdale, Z. Kurmanowska, Y. Tarasow, J. Komos and D. Nowak, Release of hydrogen peroxide by rat type II pneumocytes in the prolonged culture, Toxicol. In Vitro, 2000, 14, 85–93 CrossRef CAS PubMed.
- G. P. Bienert, J. K. Schjoerring and T. P. Jahn, Membrane transport of hydrogen peroxide, Biochim. Biophys. Acta, Biomembr., 2006, 1758, 994–1003 CrossRef CAS PubMed.
- D. Wragg, S. Leoni and A. Casini, Aquaporin-driven hydrogen peroxide transport: a case of molecular mimicry?, RSC Chem. Biol., 2020, 1, 390–394 RSC.
- F. Orrico, A. C. Lopez, D. Saliwonczyk, C. Acosta, I. Rodriguez-Grecco, I. Mouro-Chanteloup, M. A. Ostuni, A. Denicola, L. Thomson and M. N. Möller, The permeability of human red blood cell membranes to hydrogen peroxide is independent of aquaporins, J. Biol. Chem., 2022, 298, 101503 CrossRef CAS PubMed.
- K. Li, D. J. Jacob, H. Liao, Y. Qiu, L. Shen, S. Zhai, K. H. Bates, M. P. Sulprizio, S. Song, X. Lu, Q. Zhang, B. Zheng, Y. Zhang, J. Zhang, H. C. Lee and S. K. Kuk, Ozone pollution in the North China Plain spreading into the late-winter haze season, Proc. Natl. Acad. Sci. U. S. A., 2021, 118, 1–7 Search PubMed.
- Z. Rao, Z. Chen, H. Liang, L. Huang and D. Huang, Carbonyl compounds over urban Beijing: Concentrations on haze and non-haze days and effects on radical chemistry, Atmos. Environ., 2016, 124, 207–216 CrossRef CAS.
- C. Ye, P. Liu, Z. Ma, C. Xue, C. Zhang, Y. Zhang, J. Liu, C. Liu, X. Sun and Y. Mu, High H2O2 Concentrations Observed during Haze Periods during the Winter in Beijing: Importance of H2O2 Oxidation in Sulfate Formation, Environ. Sci. Technol. Lett., 2018, 5, 757–763 CrossRef CAS.
- M. P. Hlastala, F. L. Powell and J. C. Anderson, Airway exchange of highly soluble gases, J. Appl. Physiol., 2013, 114, 675–680 CrossRef CAS PubMed.
- T. Kakeshpour, B. Metaferia, R. N. Zare and A. Bax, Quantitative detection of hydrogen peroxide in rain, air, exhaled breath, and biological fluids by NMR spectroscopy, Proc. Natl. Acad. Sci. U. S. A., 2022, 119, 1–3 CrossRef PubMed.
- W. B. Gerritsen, P. Zanen, A. A. Bauwens, J. M. van den Bosch and F. J. Haas, Validation of a new method to measure hydrogen peroxide in exhaled breath condensate, Respir. Med., 2005, 99, 1132–1137 CrossRef PubMed.
- M. Corradi, P. Pignatti, G. Brunetti, M. Goldoni, A. Caglieri, S. Nava, G. Moscato and B. Balbi, Comparison between exhaled and bronchoalveolar lavage levels of hydrogen peroxide in patients with diffuse interstitial lung diseases, Acta Bio Med. Atenei Parmensis, 2008, 79, 73–78 Search PubMed.
- A. S. Jackson, A. Sandrini, C. Campbell, S. Chow, P. S. Thomas and D. H. Yates, Comparison of biomarkers in exhaled breath condensate and bronchoalveolar lavage, Am. J. Respir. Crit. Care Med., 2007, 175, 222–227 CrossRef CAS PubMed.
- T. Fang, Y. Huang, J. Wei, J. E. M. Mena, P. S. J. Lakey, M. T. Kleinman, M. A. Digman and M. Shiraiwa, Superoxide Release by Macrophages through NADPH Oxidase Activation Dominating Chemistry by Isoprene Secondary Organic Aerosols and Quinones to Cause Oxidative Damage on Membranes, Environ. Sci. Technol., 2022, 56(23), 17029–17038 CrossRef CAS PubMed.
- M. Krapf, I. El Haddad, E. A. Bruns, U. Molteni, K. R. Daellenbach, A. S. H. Prévôt, U. Baltensperger and J. Dommen, Labile Peroxides in Secondary Organic Aerosol, Chem, 2016, 1, 603–616 CAS.
- J. Wei, T. Fang, C. Wong, P. S. J. Lakey, S. A. Nizkorodov and M. Shiraiwa, Superoxide Formation from Aqueous Reactions of Biogenic Secondary Organic Aerosols, Environ. Sci. Technol., 2021, 55, 260–270 CrossRef CAS PubMed.
- L. B. Poole, A. Hall and K. J. Nelson, Overview of peroxiredoxins in oxidant defense and redox regulation, Curr. Protoc. Toxicol., 2011, 7.9, 1–20 Search PubMed.
- V. L. Kinnula, S. Lehtonen, R. Kaarteenaho-Wiik, E. Lakari, P. Pääkkö, S. W. Kang, S. G. Rhee and Y. Soini, Cell specific expression of peroxiredoxins in human lung and pulmonary sarcoidosis, Thorax, 2002, 57, 157–164 CrossRef CAS PubMed.
- J. G. Charrier and C. Anastasio, On dithiothreitol (DTT) as a measure of oxidative potential for ambient particles: evidence for the importance of soluble transition metals, Atmos. Chem. Phys., 2012, 12(5), 11317–11350 CAS.
- C. C. Winterbourn, Reconciling the chemistry and biology of reactive oxygen species, Nat. Chem. Biol., 2008, 4, 278–286 CrossRef CAS PubMed.
- G. Lacroix, W. Koch, D. Ritter, A. C. Gutleb, S. T. Larsen, T. Loret, F. Zanetti, S. Constant, S. Chortarea, B. Rothen-Rutishauser, P. S. Hiemstra, E. Frejafon, P. Hubert, L. Gribaldo, P. Kearns, J. M. Aublant, S. Diabaté, C. Weiss, A. De Groot and I. Kooter, Air-Liquid Interface in Vitro Models for Respiratory Toxicology Research: Consensus Workshop and Recommendations, Appl. In Vitro Toxicol., 2018, 4, 91–106 CrossRef PubMed.
- D. H. Gonzalez, D. A. Diaz, J. P. Baumann, A. J. Ghio and S. E. Paulson, Effects of albumin, transferrin and humic-like substances on iron-mediated OH radical formation in human lung fluids, Free Radical Biol. Med., 2021, 165, 79–87 CrossRef CAS PubMed.
- L. K. Rogers, M. J. Cismowski, C. Ohio and C. Ohio, HHS Public Access, 2019, 37–43 Search PubMed.
- K. Ziegler, A. T. Kunert, K. Reinmuth-selzle, A. Lena, D. Widera, M. G. Weller, D. Schuppan, J. Fröhlich-nowoisky, K. Lucas and U. Pöschl, Redox Biology Chemical modi fi cation of pro-in fl ammatory proteins by peroxynitrite increases activation of TLR4 and NF- κ B : Implications for the health e ff ects of air pollution and oxidative stress, Redox Biol., 2020, 37, 1–9 Search PubMed.
Footnotes |
| † Electronic supplementary information (ESI) available. See DOI: https://doi.org/10.1039/d2ea00179a |
| ‡ Present address: Institute of Chemical Engineering Sciences, Foundation for Research and Technology Hellas, Patra 26504, Greece. |
| This journal is © The Royal Society of Chemistry 2023 |