
 Open Access Article
 This Open Access Article is licensed under a
 Creative Commons Attribution 3.0 Unported Licence
Formation of insoluble brown carbon through iron-catalyzed reaction of biomass burning organics†
Katherine S.
Hopstock
 a,
Brooke P.
Carpenter
a,
Joseph P.
Patterson
a,
Hind A.
Al-Abadleh
b and
Sergey A.
Nizkorodov
*a
a,
Brooke P.
Carpenter
a,
Joseph P.
Patterson
a,
Hind A.
Al-Abadleh
b and
Sergey A.
Nizkorodov
*a
aDepartment of Chemistry, University of California, Irvine, California 92697, USA. E-mail: nizkorod@uci.edu
bDepartment of Chemistry and Biochemistry, Wilfrid Laurier University, Waterloo, ON N2L 3C5, Canada
First published on 8th December 2022
Abstract
Biomass burning organic aerosol (BBOA) is one of the largest sources of organics in the atmosphere. Mineral dust and biomass burning smoke frequently co-exist in the same atmospheric environment. Common biomass burning compounds, such as dihydroxybenzenes and their derivatives, are known to produce light-absorbing, water-insoluble polymeric particles upon reaction with soluble Fe(III) under conditions characteristic of aerosol liquid water. However, such reactions have not been tested in realistic mixtures of BBOA compounds. In this study, model organic aerosol (OA), meant to replicate BBOA from smoldering fires, was generated through the pyrolysis of Canary Island pine needles in a tube furnace at 300, 400, 500, 600, 700, and 800 °C in nitrogen gas, and the water-soluble fractions were reacted with iron chloride under dark, acidic conditions. We utilized spectrophotometry to monitor the reaction progress. For OA samples produced at lower temperatures (300 and 400 °C), particles (P300 and P400) formed in solution, were syringe filtered, and extracted in organic solvents. Analysis was conducted with ultrahigh pressure liquid chromatography coupled to a photodiode array spectrophotometer and a high-resolution mass spectrometer (UHPLC-PDA-HRMS). For OA samples formed at higher pyrolysis temperatures (500–800 °C), water-insoluble, black particles (P500–800) formed in solution. In contrast to P300 and P400, P500–800 were not soluble in common solvents. Scanning electron microscopy-energy dispersive X-ray spectroscopy (SEM-EDS) and transmission electron microscopy (TEM) were used to image P600 and determine bulk elemental composition. Electron microscopy revealed that P600 had fractal morphology, reminiscent of soot particles, and contained no detectable iron. These results suggest that light-absorbing aerosol particles can be produced from Fe(III)-catalyzed reactions in aging BBOA plumes produced from smoldering combustion in the absence of any photochemistry. This result has important implications for understanding the direct and indirect effects of aged BBOA on climate.
Environmental significanceChemical compounds in biomass burning smoke evolve during atmospheric transport through chemical and physical aging processes. Both biomass burning smoke and mineral dust, a source of atmospheric iron, are transported globally over long distances for many days allowing for mixing of iron-containing particles with biomass burning organics. Our previous works have shown that Fe(III) can catalyze oligomerization reactions with a broad range of phenolic compounds, abundantly present in biomass burning smoke, to produce strongly light-absorbing compounds. This work explores how this chemistry in actual biomass burning aerosol is generated through pyrolysis of pine needles. We observed efficient formation of light-absorbing particles in reactions of this biomass burning aerosol with dissolved Fe(III). These results suggest that biomass burning smoke may become more light-absorbing as it mixes with mineral dust particles during atmospheric transport, and therefore have a stronger effect on climate after aging. |
1. Introduction
Biomass burning events represent one of the largest sources of volatile organic compounds (VOCs) in the atmosphere and have prominent effects on atmospheric chemistry and climate. Emissions of both gaseous and particulate species are chemically complex and can evolve during transport through chemical and physical aging (i.e., heterogenous oxidation reactions, photolysis reactions, and cloud processing).1–4 Phenolic compounds, such as catechol, guaiacol, coniferaldehyde, and syringol, are common products of lignin pyrolysis and, although relative emissions of these compounds vary with fuel type, they are always present in burning emissions.5–8 Along with organic compounds, inorganic species have been detected in western United States wildfire plumes including metals Fe, Mn, Ca, Al, Ti, and Sr, which are associated with crustal matter and dust.9 Schlosser et al. (2017) reported that dust was one of the main components of coarse particulate matter collected at IMPROVE sites during times of biomass burning events.9 In addition to wildfire plumes, aerosol particles containing dissolved Fe(III) are widespread in the atmosphere due to windblown, iron-rich mineral dust (∼2000 Tg per year).10–12 Both biomass burning organic aerosol (BBOA) and mineral dust are transported globally over long distances and this timeframe allows for the partitioning of organic vapors into iron-containing particles.13–15 During long-range transport, atmospheric processing of dust can lead to iron oxides being dissolved under acidic conditions (pH < 4).16–18 This long-range transport of iron-containing particles can provide an opportunity for mixing with biomass burning products and can be a sink for VOCs. Most BBOA aging studies have investigated free radical driven oxidation reactions (NOx, OH, O3) and photolysis reactions, and the studies of BBOA aging due to transition metal catalysis remain limited.2,19–23Previous laboratory studies have shown that Fe(III) can catalyze oligomerization reactions with known constituents of BBOA and industrial emissions to produce lower volatility secondary brown carbon (BrC) products.24–31 Reaction solutions were open to air and dissolved O2 acted as an oxidant. These irreversible, oxidative polymerization reactions formed water-insoluble, black particles in acidic systems (pH 3) with excess Fe(III). The production of particles was dependent upon the iron to organic molar ratios and the structure of the organic precursor. During reaction with organics, iron cycles between its +2 and +3 oxidation states, and its reactivity is dependent upon the presence of electron donors/acceptors, strength of complexation to ligands, and steric effects.10,30,32 This cycling between Fe(II) and Fe(III) is coupled with the production of H2O2 and OH radicals, and reactive oxygen species (ROS) as intermediates in reaction.4,24
Fig. 1 contains a summary of compounds shown to produce insoluble particulate products in reactions with Fe(III). In Slikboer et al. (2015), catechol and guaiacol (Fig. 1a) were mixed with Fe(III) at pH 3 in millimolar concentrations to yield water-insoluble polycatechol and polyguaiacol particles, respectively.24 In the case of catechol, upon addition of Fe(III), a progression of color change from colorless to green to black was observed. This green color was attributed to the formation of the catechol–iron bidentate mononuclear complex followed by ligand to metal charge transfer. Guaiacol did not produce this color change because the methoxy group inhibited iron complexation but, through a slightly different mechanism, produced polyguaiacol particles. Follow up studies also showed that these oligomerization reactions were not suppressed in the presence of oxalate and sulfate ions,25 and some dicarboxylic acids which normally have a high complexation affinity to iron.29 Lavi et al. (2017) expanded on the reactivity of BBOA phenol precursors with Fe(III).26 Dimers, trimers, tetramers, and pentamers were observed for reactions of Fe(III) with syringol, o-cresol, and p-cresol (Fig. 1b).26 These oligomeric species absorbed light between 300–500 nm and were present in lower abundance than reactions of guaiacol and catechol, which produced insoluble BrC particles.26 Chin et al. (2021) further expanded the list of organic compounds capable of forming insoluble particles to include 3-hydroxycatechol, 4-hydroxycatechol, and coniferaldehyde (Fig. 1a).30 These laboratory studies with isolated BBOA compounds suggest that Fe(III) reacts with a broad range of phenolic compounds, which can produce secondary BrC compounds in atmospheric particles, however, it is unclear how this chemistry translates to secondary BrC formation from actual BBOA, prompting this study.
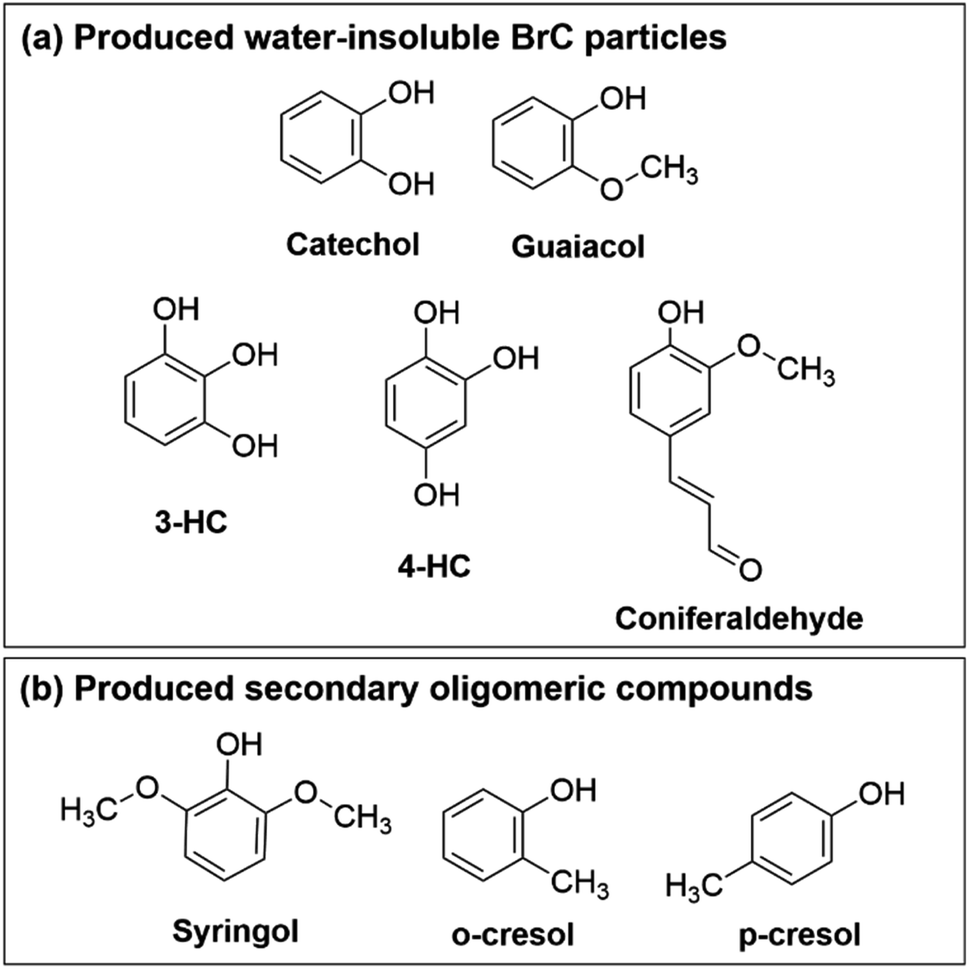 | ||
| Fig. 1 Phenolic BBOA precursors known to produce (a) water-insoluble BrC particles and (b) secondary oligomeric compounds upon reaction with Fe(III) under aqueous, acidic, dark conditions. 3-HC is 3-hydroxycatechol and 4-HC is 4-hydroxycatechol. | ||
Wildfire conditions often range between smoldering (heterogeneous, 450–700 °C) combustion and flaming (homogeneous, 1100–1800 °C) combustion with a quick transition between each depending on environmental conditions.33 Exploratory measurements by Chin et al. (2021) concluded that BBOA collected under smoldering conditions reacted in the presence of Fe(III) to produce insoluble particles,30 whereas BBOA collected under flaming conditions did not appreciably react, as flaming combustion favors the reaction of aromatics with NOx in biomass burning plumes to generate nitroaromatics.34 Pyrolysis is one of the mechanisms operating in smoldering combustion, in which a biomass fuel is heated in the absence of oxygen to produce pyrolyzate (gas), char, and ash,33 and it occurs at temperatures known to produce the most phenolic products.35 In this work, we utilize pyrolysis in a tube furnace under an inert atmosphere in order to precisely control experimental conditions and study chemistry of emitted particles as a function of temperature. We observe efficient formation of secondary particles in reactions of this mimic BBOA with dissolved Fe(III). This work highlights the role iron plays in the aging of BBOA to produce oligomeric species and water-soluble/insoluble BrC secondary products.
2. Experimental
2.1 Canary Island pine pyrolysis OA generation
A summary flowchart of all experiments can be found in ESI Scheme S1.† Dry Canary Island pine (Pinus canariensis) needles were used as biomass fuel for these pyrolysis experiments. The main motivation for selecting this fuel is that this species of pine is increasingly planted for landscaping in warmer climates, such as Southern California, and urban fires are on the rise worldwide. For each experiment, approximately 200 mg of needles were placed in a ceramic pyrolysis boat then inserted into a 2.5 cm quartz tube, upstream from the Thermolyne F21135 Tube Furnace. The tube was then sealed with parafilm and continuously purged with N2 gas (∼0.7 standard liters per minute). The flow of N2 gas was constant during pyrolysis, and the setup was not reopened until after collection had ceased. This ensured that no oxygen from the laboratory was introduced into the furnace. A 40 cm section of the tube, downstream from the pyrolysis boat, was heated to a prescribed temperature (300, 400, 500, 600, 700, or 800 °C). Once the furnace reached the temperature of interest, the entire tube (containing the ceramic pyrolysis boat and pine needles) was pushed from the outside so that the pine needles were in the heated zone and pyrolysis could begin. There was a temperature drop of ∼75 °C upon entry of the room temperature section of the tube into the heated zone, but the temperature increased back up to the prescribed temperature before smoke appeared. The flow of N2 gas pushed the generated smoke particles through the quartz tubing for collection on PTFE 47 mm Teflon filters (Millipore Sigma, Fluoropore Membrane Filter, FGLP04700, 47 mm, 0.22 μm pore size). The starting pressure was ∼760 Torr. The collection times varied (1–10 min). Pyrolysis and gas flow were stopped in time to prevent the filter from overloading (if left unattended the filter resistance could increase enough to over-pressurize the system above 800 Torr which was deemed unsafe for continuing collection).Fig. 2 shows representative photographs of the collected filter samples at all pyrolysis temperatures. Since the particles produced in this process do not result from biomass burning, but rather pyrolysis in an inert N2 atmosphere, we will refer to them as organic aerosol (OA). The fraction of OA that is extractable in water (18 MΩ cm Milli-Q water, pH 6.9) will be labeled as “OA” with its pyrolysis temperature listed after (i.e., OA300 is the water extract of particles generated through pyrolysis at 300 °C). Insoluble particles generated in aqueous reactions of OA with Fe(III) will be labeled as “P” with the pyrolysis temperature after (i.e., P300 are the insoluble particles generated through the reaction of OA300 with FeCl3).
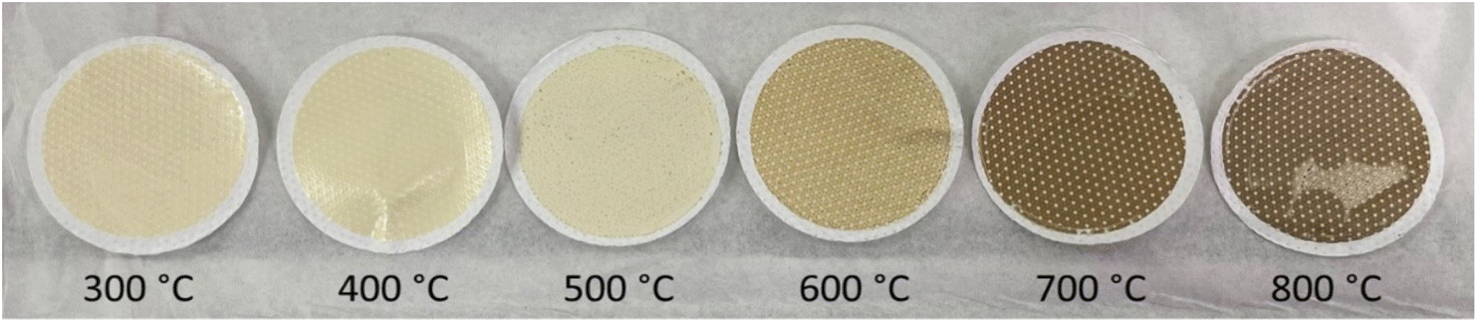 | ||
| Fig. 2 OA filters generated at various pyrolysis temperatures using Canary Island pine needles. | ||
2.2 Aqueous phase reactions and UV-visible spectroscopy experiments
After OA collection, each filter was weighed with a Sartorius ME5-F microbalance (1 μg precision) and the OA mass on the filter was calculated. The emission factors (EF) for each pyrolysis temperature were estimated (Table 1), assuming that the filters had 100% collection efficiency (all smoke particles were trapped before venting to the exhaust). Apparent EFs likely represent lower limits for the actual EFs, as pyrolyzed material partly deposited on the walls of the flow tube before reaching the filter. Each filter was first extracted in water (18 MΩ cm Milli-Q water) by shaking for 30 minutes on a Thermolyne Type 37600 mixer (M37615, ∼1500 rpm) then the filter was removed and separately dissolved in methanol. Absorption spectra were obtained for the fractions dissolved separately in water and in methanol, assuming that only a fraction of OA could be dissolved in water but all remaining OA on the filter was dissolved in methanol.36 The filters became colorless after the methanol extraction indicating that all light-absorbing compounds dissolved.| Pyrolysis temperature (°C) | Emission factor (g kg−1) | Average percent of collected OA dissolved in water (%) | Average mass dissolved in water (mg) |
|---|---|---|---|
| 300 | 23 ± 9 | 60 ± 6 | 1.5 ± 0.6 |
| 400 | 25 ± 8 | 60 ± 6 | 2.5 ± 0.5 |
| 500 | 22 ± 2 | 62 ± 4 | 2.1 ± 0.3 |
| 600 | 24 ± 8 | 52 ± 5 | 2.4 ± 0.7 |
| 700 | 26 ± 2 | 36 ± 7 | 1.9 ± 0.4 |
| 800 | 22 ± 3 | 32 ± 5 | 1.6 ± 0.3 |
The concentrations of water-soluble organics were estimated, assuming that absorption coefficients of the water and methanol soluble fractions were the same, and these values were utilized to determine the volume of 80 mM iron chloride solution that should have been added to the organics in order to achieve a 2![[thin space (1/6-em)]](https://www.rsc.org/images/entities/char_2009.gif) :1 molar ratio of Fe(III) to organics,24,30 assuming an average molecular weight of 200 Da for OA. 80 mM iron chloride solutions were prepared with iron(III) chloride hexahydrate (97%, CAS 10025-77-1, Sigma-Aldrich) in Milli-Q water. The reactions were conducted in the dark at pH 3, as determined by a calibrated pH meter (Mettler Toledo SevenEasy S20). Upon dissolving the OA in water, the measured pH dropped from 6.9 to ∼3, without having to acidify it further. The atmospheric relevance of these reaction conditions was described previously in Chin et al. (2021) and references therein.30
:1 molar ratio of Fe(III) to organics,24,30 assuming an average molecular weight of 200 Da for OA. 80 mM iron chloride solutions were prepared with iron(III) chloride hexahydrate (97%, CAS 10025-77-1, Sigma-Aldrich) in Milli-Q water. The reactions were conducted in the dark at pH 3, as determined by a calibrated pH meter (Mettler Toledo SevenEasy S20). Upon dissolving the OA in water, the measured pH dropped from 6.9 to ∼3, without having to acidify it further. The atmospheric relevance of these reaction conditions was described previously in Chin et al. (2021) and references therein.30
UV-Vis absorption spectra (Fig. 3 and S1†) were acquired using a UV-Vis spectrometer (Shimadzu UV-2450) in a 1 cm quartz cuvette with a reference cuvette containing Milli-Q water. Upon addition of iron chloride to the 300–800 °C water-soluble OA fractions, the reaction progressions were monitored for 48 h. To monitor the initial reaction progress within seconds after addition of iron to the high temperature pyrolysis samples (500–800 °C), an Ocean Optics USB4000 spectrometer with a tungsten deuterium lamp was utilized to measure absorbance change every 0.5 s for 40 s (Fig. 4).
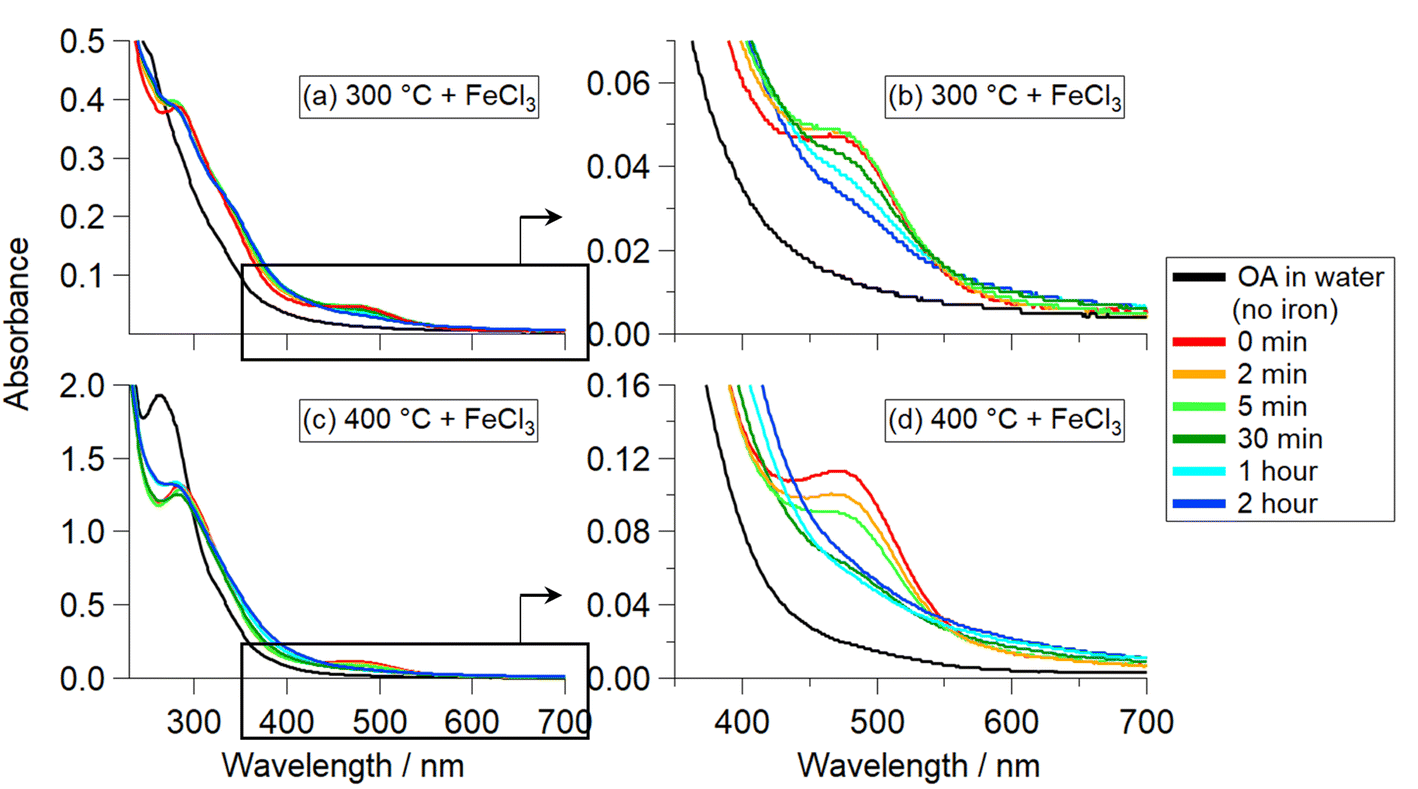 | ||
| Fig. 3 Absorption spectra for the first two hours of reaction of OA300 + FeCl3 (a and b) and OA400 + FeCl3 (c and d). Panels (b) and (d) show an enlargement of the 477 nm peak present in panels (a) and (c). Nanopure water acidified to pH 3 was used as a reference blank. | ||
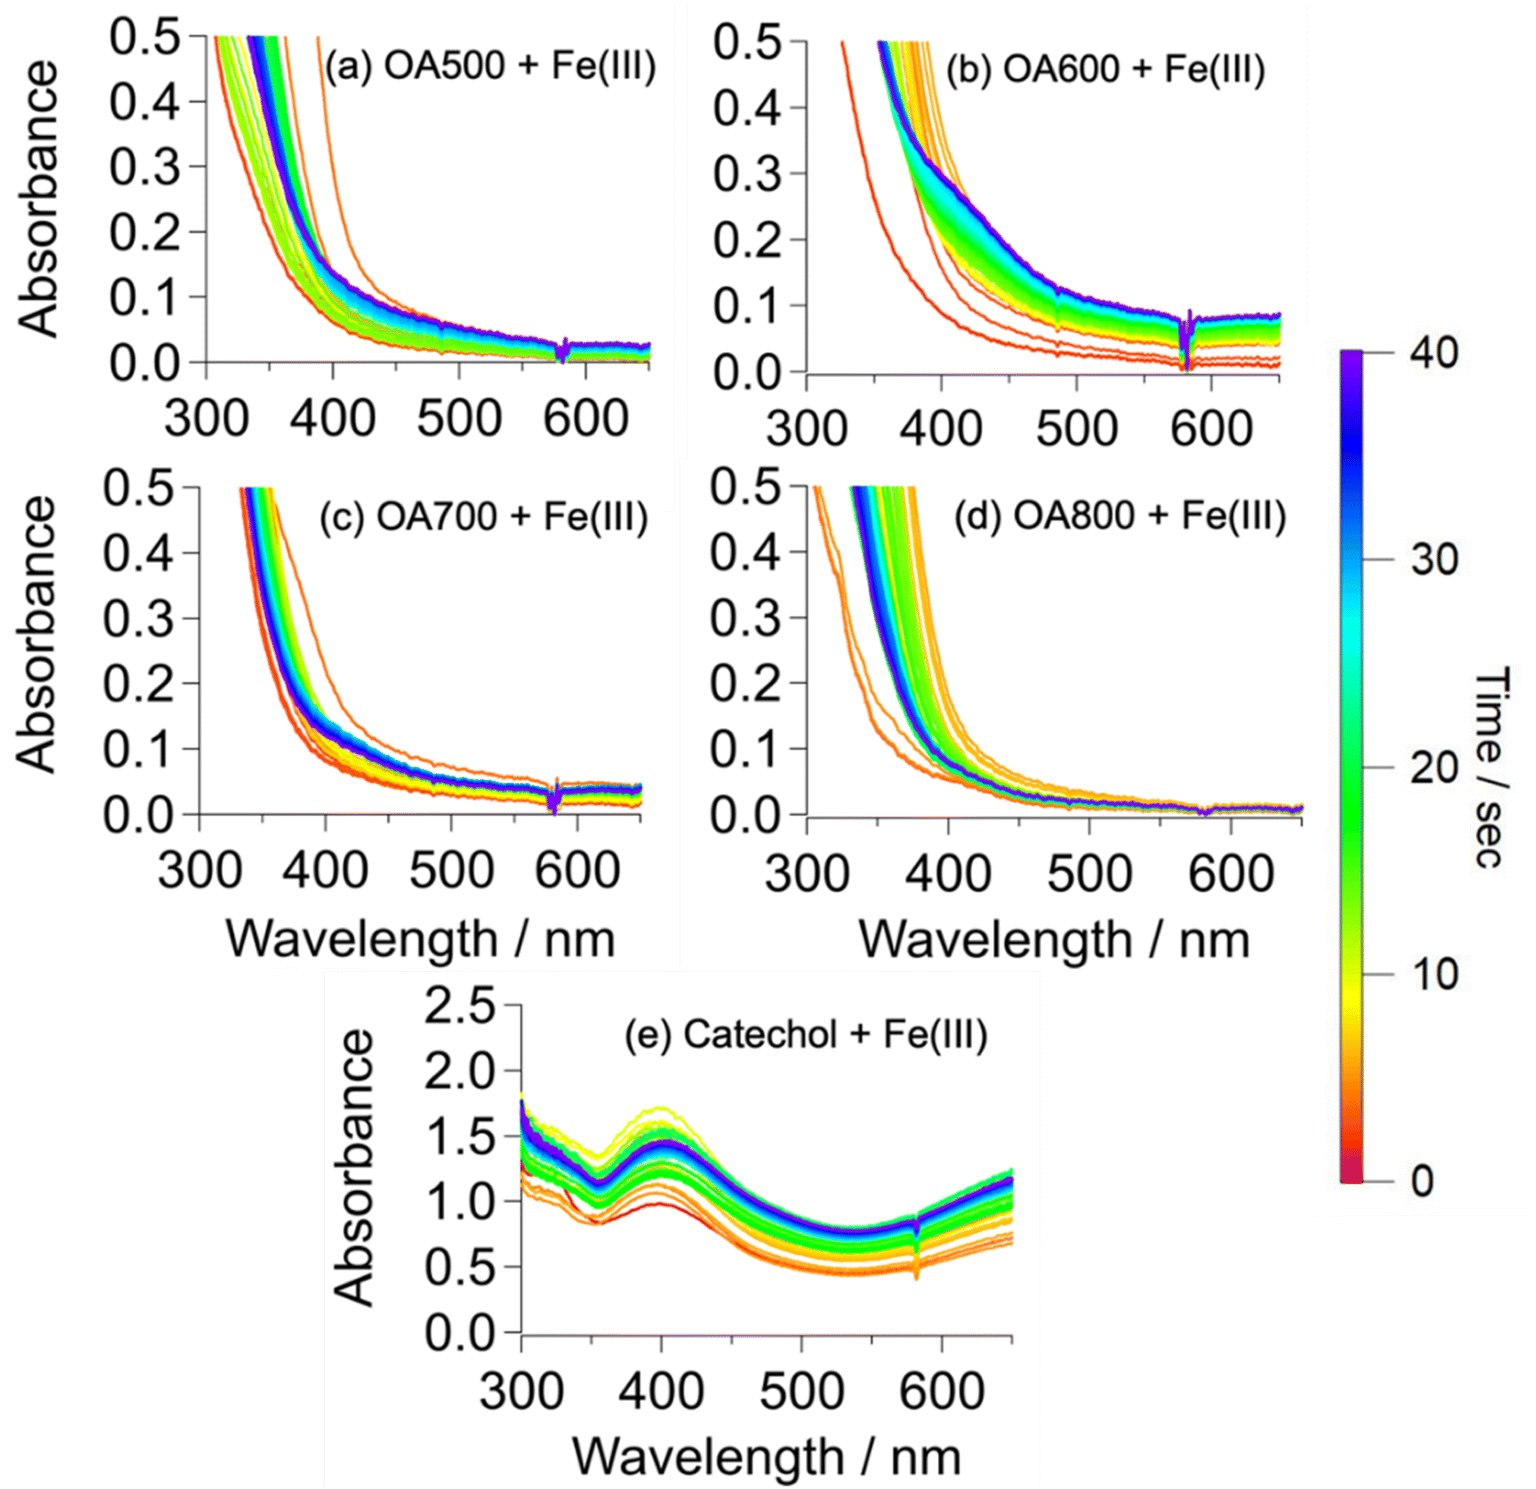 | ||
| Fig. 4 Absorption spectra of OA500 (a), OA600 (b), OA700 (c), and OA800 (d) reactions with Fe(III) taken every 0.5 s for 40 s with an Ocean Optics USB4000. Panel (e) shows the reaction of catechol with Fe(III) for comparison. Nanopure water acidified to pH 3 was used as a reference blank. | ||
2.3 Mass spectrometric experiments
:1 (v/v) ACN/H2O for high resolution mass spectrometry (HRMS) analysis. The water-insoluble filter contents were extracted in 10 mL of methanol then rotary evaporated and redissolved in 1:1 (v/v) ACN/H2O for HRMS analysis. In addition to P300/400 and water-soluble reaction products, OA from all pyrolysis temperatures (OA300–800, no FeCl3) were run on HRMS (Scheme S1†). P500–800 (Fig. S2†) did not undergo this same procedure (see Section 2.3.2).
The mass spectra were recorded with a Thermo Scientific Vanquish Horizon ultrahigh pressure liquid chromatograph coupled to a Vanquish Horizon photodiode array spectrophotometer and to a Q Exactive Plus high-resolution mass spectrometer (UHPLC-PDA-HRMS) with a resolving power up to 1.4 × 10⁵ at m/z 200. The separation was performed on a reverse-phase column (Phenomenex Luna Omega Polar C18, 150 × 2.1 mm, 1.6 μm particles, 100 Å pores) with temperature kept at 30 °C and injected volume of 10 μL. The eluent flow was 0.3 μL min−1 and consisted of HPLC-MS grade water acidified with 0.1% v/v formic acid (solution A) and HPLC-MS grade acetonitrile with 0.1% v/v formic acid added (solution B). The gradient was: 0–3 min 95% A; 3–14 min linear ramp to 95% B; 14–16 min hold at 95% B; 16 min return to 95% A and hold until 22 min in preparation for the next run (Fig. 5). PDA data was collected at 5 Hz over 190–680 nm range with a 4 nm effective bandwidth. Mass spectra (Fig. 6) were obtained with m/z range of 100–1500 in the negative ion mode, producing [M − H]− ions (favored ionization mechanism for phenolic species). The parameters of the heated electrospray ionization (HESI) ion source settings of the Orbitrap were as follows: −2.5 kV spray voltage, 320 °C capillary temperature, 300 °C probe heater temperature, S-Lens ion funnel RF level 60, 50 units of sheath gas (nitrogen) flow, 10 units of auxiliary gas (nitrogen) flow, and 1 unit of spare gas (nitrogen) flow. A summary of these results can be found in Table S1.†
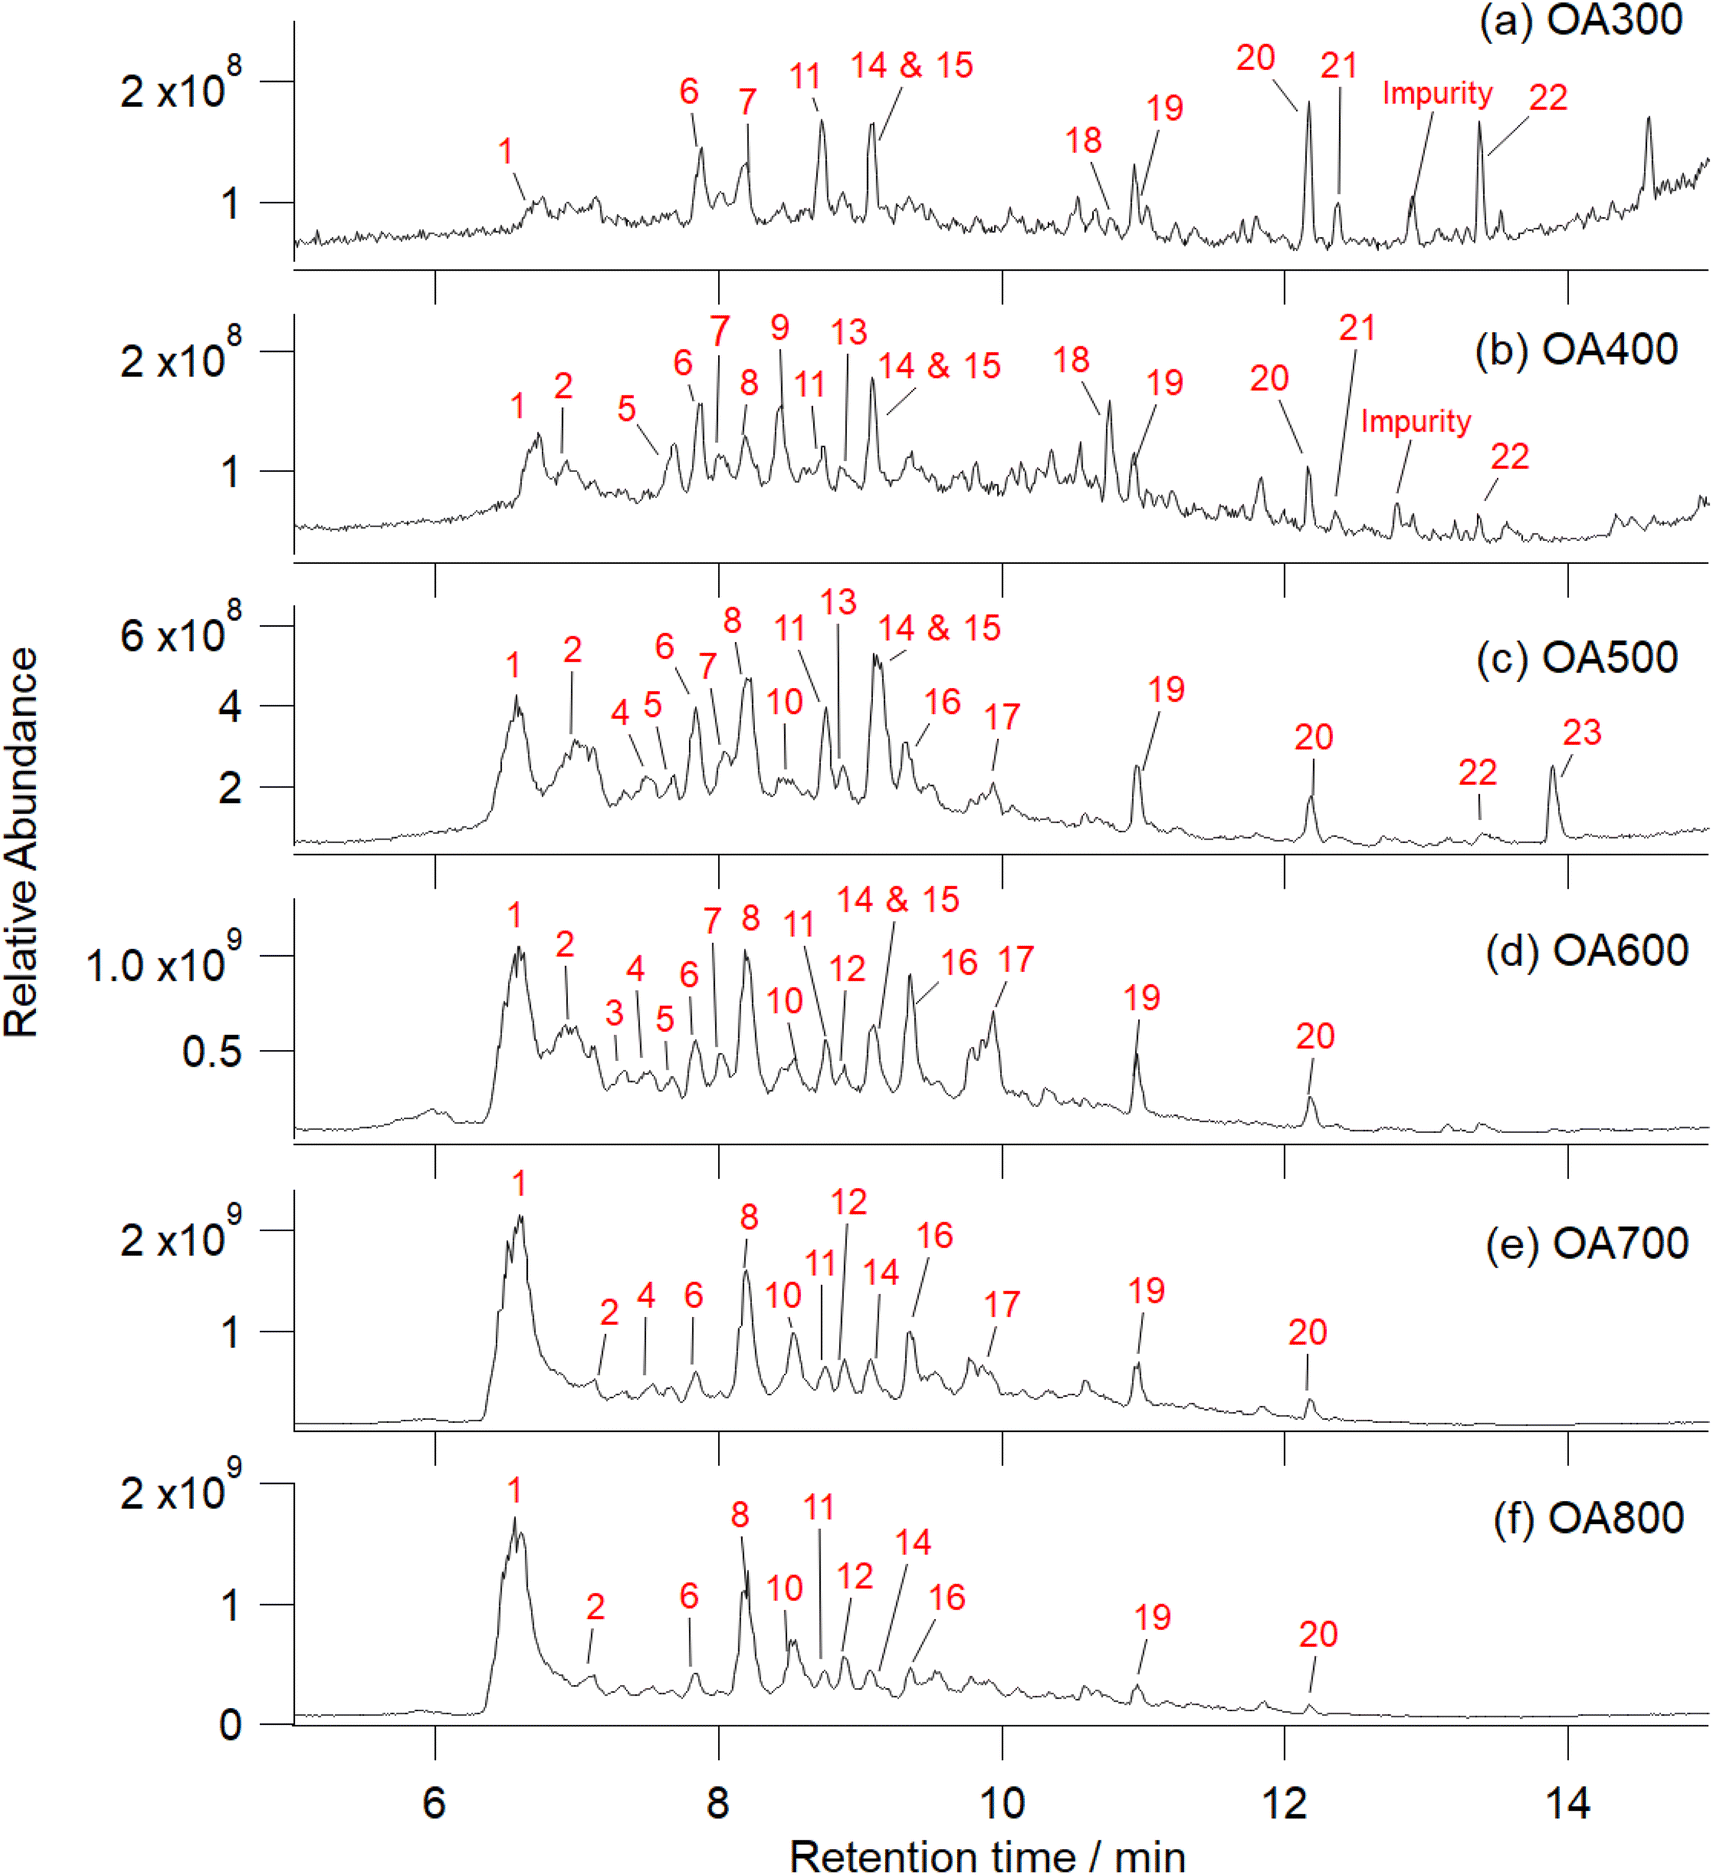 | ||
| Fig. 5 UHPLC-HRMS total ion chromatograms of Canary Island pine OA generated under 300–800 °C pyrolysis conditions in flowing nitrogen (a–f). These samples were analyzed prior to reaction with FeCl3. Increasing pyrolysis temperature decreases peaks at higher retention times and catechol/phenolic peaks begin to dominate. Ions responsible for chromatographic peaks are numbered in red with their corresponding identities listed in the rightmost column in Table S2.† Notable peaks include: (1) catechol, (2) salicylic acid, (5) homovanillic acid, (6) benzoic acid, (7) p-coumaric acid, (8) 2-methylbenzoic acid/methoxybenzaldehyde and vanillic acid, (9) 4-nitrocatechol, (10) guaiacol, (11) C9H10O4, (14) 3-hydroxybenzaldehyde, and (15) coniferaldehyde. Additional detailed compositional analysis at each retention time is listed in Table S2† and high temperature OA mass spectra are labeled in Fig. S5.† | ||
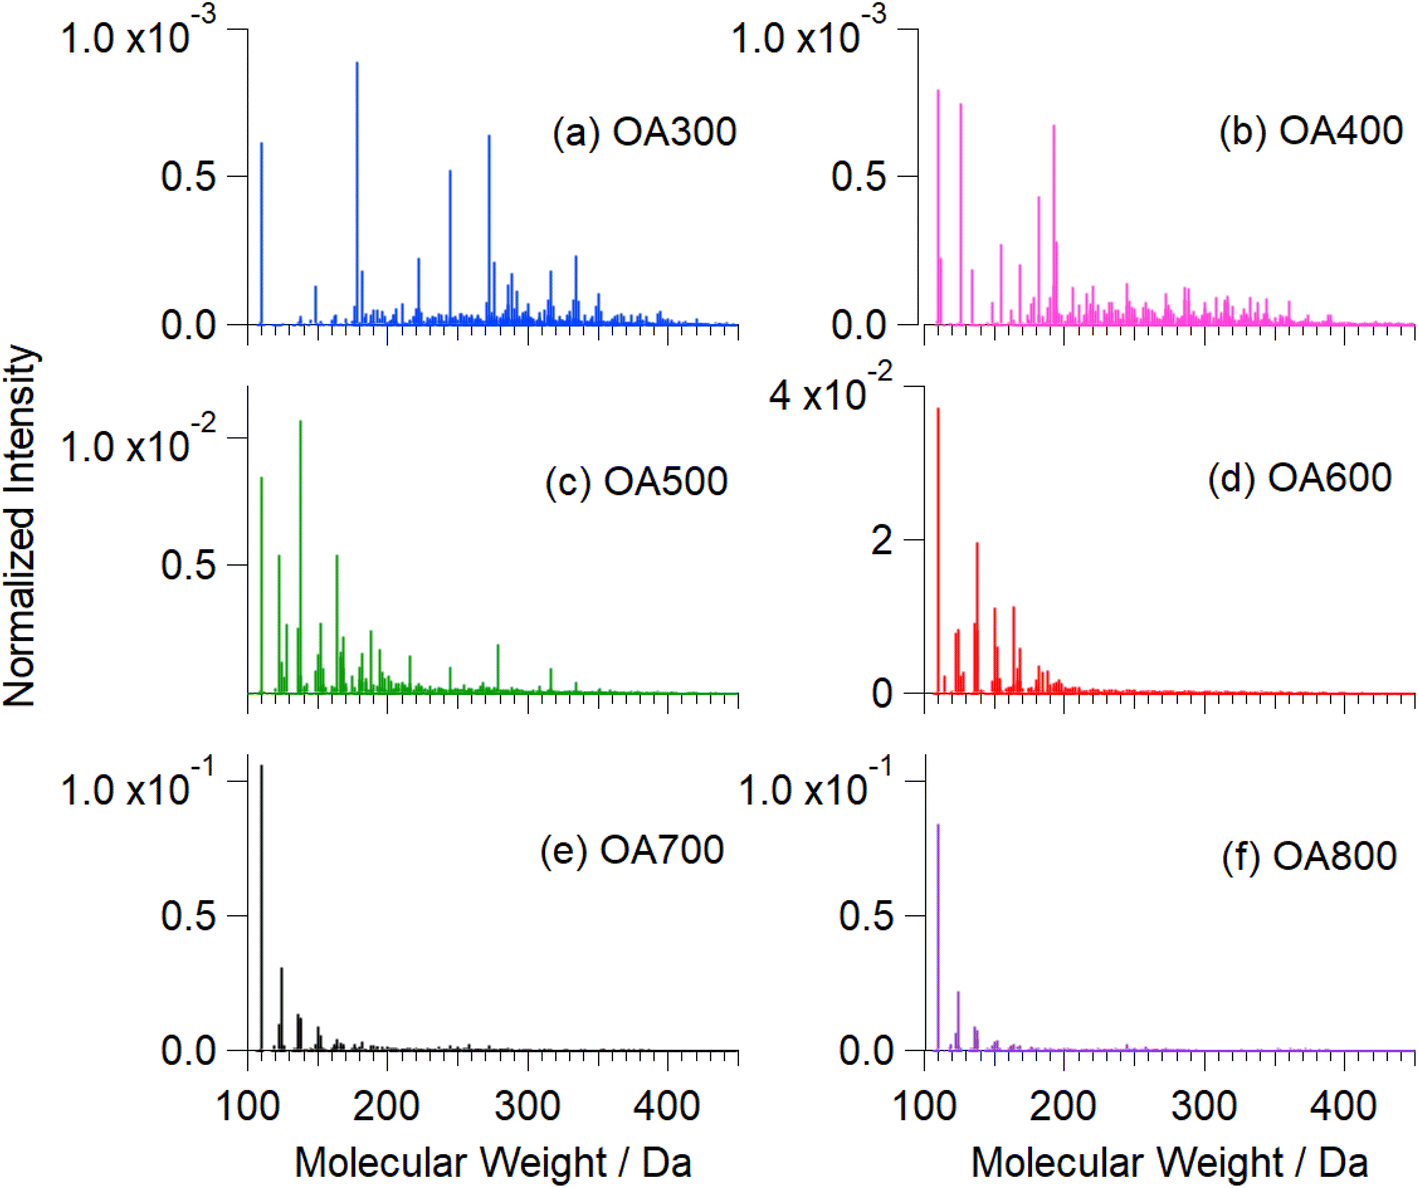 | ||
| Fig. 6 Mass spectra of water-soluble fractions of Canary Island pine OA300 (a), OA400 (b), OA500 (c), OA600 (d), OA700 (e), and OA800 (f). These mass spectra were recorded before reaction with Fe(III). The strongest peak at MW = 110 in high-temperature samples corresponds to catechol. Fig. S5† shows an expanded version of this figure with major peaks labelled with formulae. | ||
Analysis of chromophoric compounds in water-soluble products of OA300/OA400 reactions with Fe(III) and of P300/P400 (Fig. S3 and S4†) was conducted similarly to that described in Chin et al. (2021).30 Strong peaks contributing to the near-UV and visible PDA chromatogram were correlated to the corresponding peaks in the total ion current (TIC) chromatogram, considering a 0.06 min delay time between PDA and Orbitrap detectors. Light-absorbing peaks occurring in the TIC were confirmed and verified using selected ion monitoring (SIM) chromatograms. Exact m/z values were assigned to molecular formulae using the molecular formula calculator mentioned previously.
Molecular formulae of OA300–800 were assigned similarly to previous work (the list of the assigned formulae can be found in Fig. S5 and Table S2†).37–40 Chromatograms were analyzed using the Thermo Scientific program FreeStyle 1.6 and mass spectra between the column's dead time and the start of the column re-equilibration time (2–16 min) were integrated. Decon2LS program, https://pnnl-comp-mass-spec.github.io/ (accessed January 2022) was used to cluster together all mass spectra from the same temperature. The clustered peaks from each temperature were aligned to a common m/z axis. Background peaks present in the blank samples only were removed from all sample spectra. Peaks containing 13C isotopes were removed. All peaks were assigned to the formulae CxHyOz with a mass accuracy of ±0.0005 m/z units. Ion formulae generated were verified with a molecular formula calculator, https://nationalmaglab.org/user-facilities/icr/icr-software (accessed January 2022). All results were reproduced in triplicate and all identified compounds are presented and discussed as neutral species with their corresponding masses.
2.4 Particle characterization
000 g for 10 min. Concentrated samples were then washed with water 3 times. To retrieve the sample, the sample vial was inverted into a clean Eppendorf tube and centrifuged for two minutes at 1000g. Each sample was then resuspended in 200 μL of nanopure water.
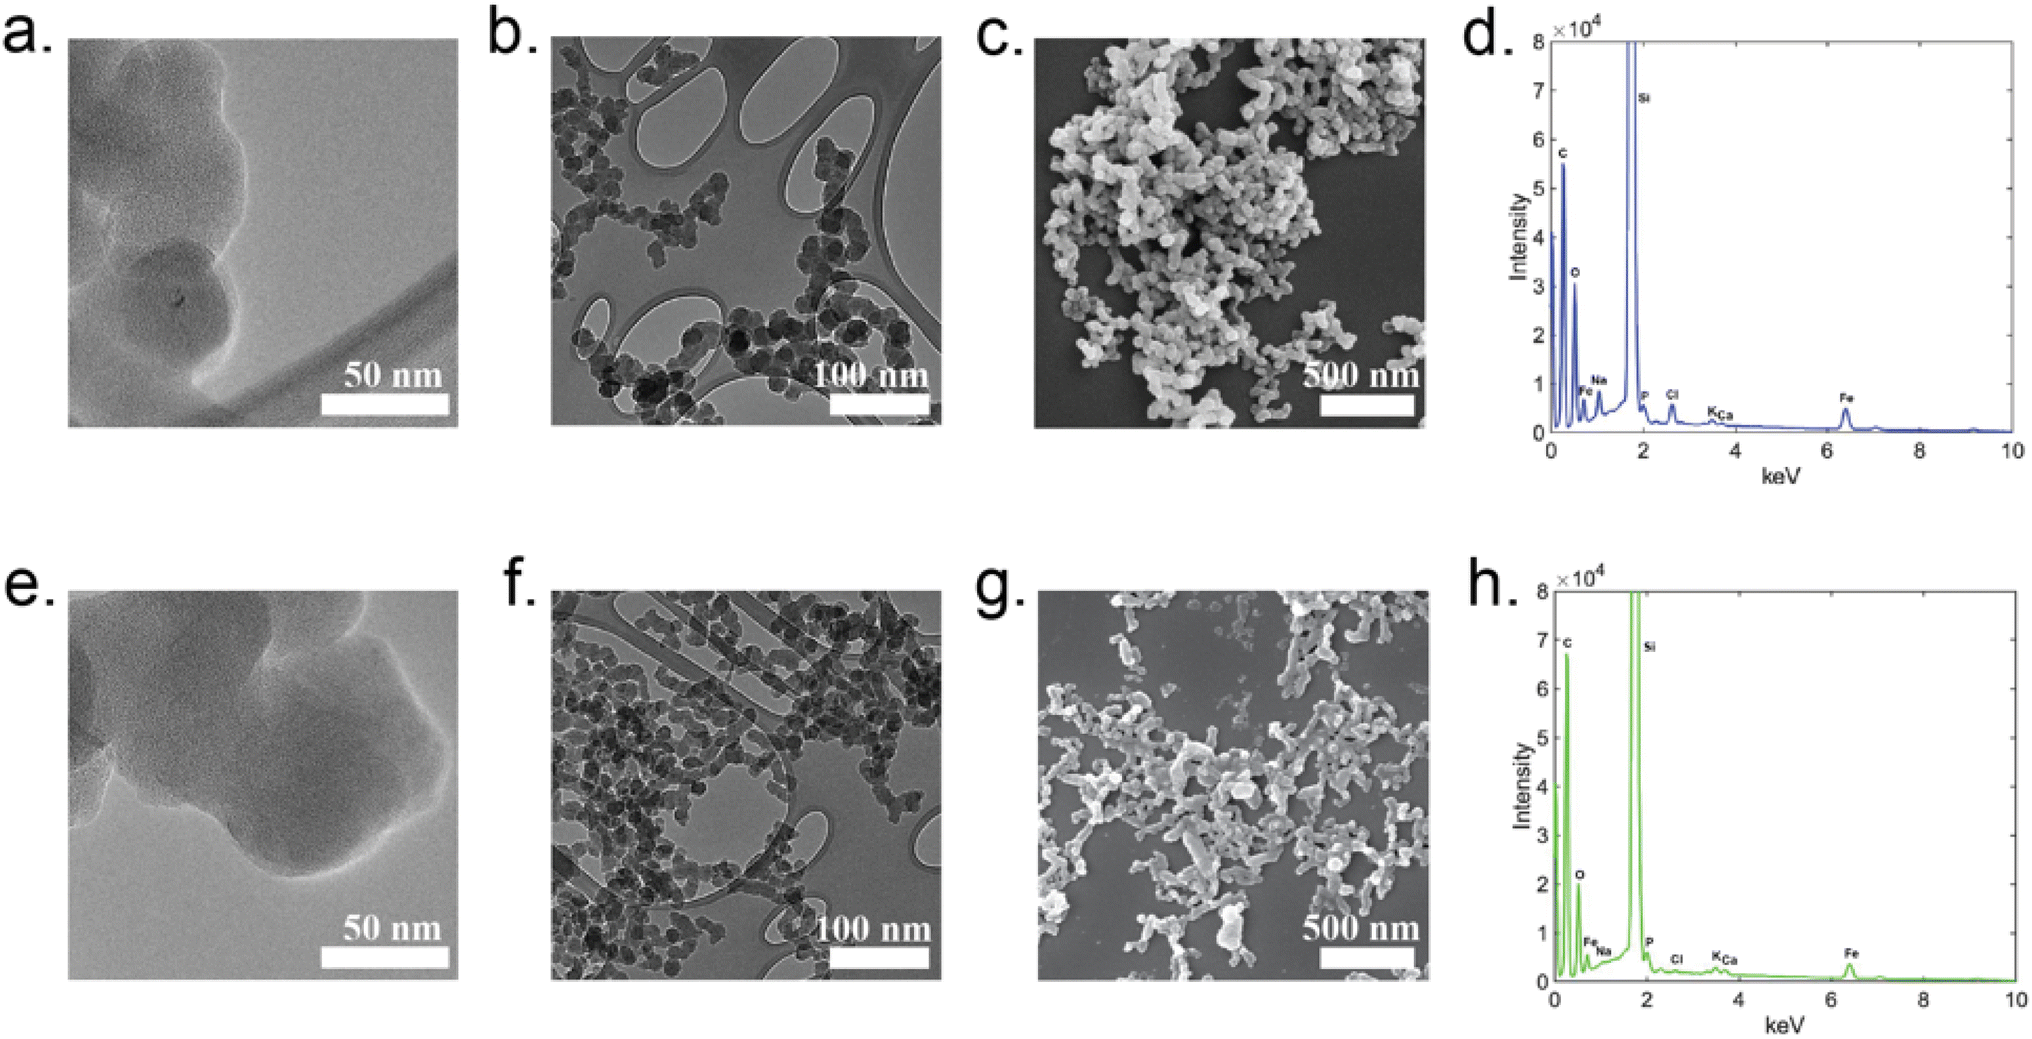 | ||
| Fig. 7 Scanning electron microscopy (SEM) images, transmission electron microscopy (TEM) images, and energy dispersive X-ray spectroscopy (EDS) spectra for polycatechol particles (control experiment) and water-insoluble dark particles (P600). SEM images of polycatechol (a and b) and reaction particles (e and f) were taken on silica substrates. TEM images and EDS spectra are shown for polycatechol (c and d, respectively) and reaction particles (g and h, respectively). The large Si peak is from the SEM grids (SiO2). | ||
3. Results and discussion
3.1 Reactions between OA300/400 and Fe(III)
Reactions of OA300/400 + FeCl3 did not exhibit any solution color changes but produced water-insoluble particles (that could be redissolved in organic solvents). Fig. 3(a–d) shows the UV-Vis absorption spectra collected immediately after the addition of iron (time 0 min) and at timepoints during the reactions. Both reactions have an absorbance band at 290 nm (Fig. 3a and c), attributed to an π to π* transition of the organic reactant solution after ∼1 h of reaction. In addition, there is an absorption band peaking at 296 nm attributed to the formation of Fe(OH)2+.30 At 477 nm, there is a peak that forms upon addition of iron at time 0 min (Fig. 3b and d), which can be attributed to the formation of an organic intermediate. Prior to the addition of iron, OA300 and OA400 (black traces) do not exhibit this peak. Previous studies that focused on BBOA precursor reactivity with Fe(III) observed similar peak behavior at ∼400 nm, which was attributed to an intermediate ortho-quinone species.24,30 This species forms after catechol oxidation and complexation with iron, and then it reacts with peroxide (in solution) to initiate radical chemistry and polymerize to form polycatechol. Since the peak we observe is at 477 nm and not 400 nm, it is clear the intermediate is not identical, but, nevertheless, behaves in a similar way to what has been previously observed. The decrease in this absorbance band at 477 nm over time coincides with a small increase in absorbance at longer wavelengths, implying that the intermediate is being incorporated into the insoluble BrC particles. There is slight scattering and absorption by the insoluble, suspended particles forming over time with a weak wavelength dependence.Table S1† summarizes the HRMS results for the reactions of OA300 and OA400 with the distribution of molecular formulae after reaction with iron for 48 h. The average MW increased from 324.9 to 486.1 Da (OA300 to P300) and 338.5 to 435.5 Da (OA400 to P400). In addition, P300 and P400 were less oxidized, as indicated by lower average O:C ratios (Table S1†). These results are consistent with the expectation that Fe(III) can catalyze the oligomerization of phenolic compounds in solution to generate polyphenolic polymers.
3.2 Reactions between OA500–800 and Fe(III)
OA500–800 + FeCl3 reactions (Fig. 4a–d) exhibited different results than OA300/400 + FeCl3 reactions (Fig. 3). The solutions underwent various intensities of a clear to green to brown color change, similar to that of the catechol + Fe(III) reaction in Slikboer et al. (2015) that yielded water-insoluble, black polycatechol particles (Fig. S2†).24 In order to monitor this change, UV-Vis absorption spectra needed to be taken on a faster timescale than for OA300/400 + Fe(III) reactions. In addition, after 1 min the OA500–800 + Fe(III) absorbance spectra did not exhibit significant changes. Fig. 4 shows the UV-Vis absorption spectra taken during the reactions of OA500–800 (a–d) and reference system catechol (e) shortly after the addition of iron. There is depletion of the 334 nm FeCl3 peak (red trace) and the formation of a peak at 390 nm that can be attributed to an n to π* transition of ortho-quinone species formed as an intermediate during the formation of catechol–Fe complexes.10,24,41 This peak increases in intensity for the first 10 s of reaction and then decreases, as the intermediate reaction product (ortho-quinone) is reacted in solution to form polycatechol.24 The increase in absorbance over time in the visible and near IR was due to scattering and absorption by black particles being produced in solution. These spectral features are not present in the unreacted OA absorbance spectra in Fig. S1.† The catechol spectrum also exhibits a ligand-to-metal charge transfer band in the near IR ∼700 nm (and subsequent green color in solution) when a bidentate mononuclear catechol–Fe(II) complex formed.32The UV-Vis spectra exhibit various similarities to the pure catechol/FeCl3 reaction (Fig. 4e), but resemblances vary depending on pyrolysis temperature. OA500–800/FeCl3 reactions do not display an explicit 390 nm intermediate peak but instead show absorbance growth (in varying amounts depending on the sample) at ∼400 nm, indicating reaction on a slower timescale than that of pure catechol. In contrast, OA300/400 reactions in Fig. 3(a and b) did not exhibit an intermediate peak at 390 nm, indicating a lack of reactivity between catechol-like species and iron. Of all the samples, OA500 and OA600 reacted on a similar timescale to catechol, indicating a higher abundance of water-soluble phenols available for reaction with iron. OA700 and OA800 reacted slower but they also visibly formed dark particles during the 48 hour reaction time. The amount of produced particles as assessed by the strength of light-scattering across all wavelengths was the highest for OA600, indicating higher presence of catechol-like phenolic compounds to participate in particle formation. Since these OA reactions are composed of a complex mixture with varying phenolic compound concentrations, the absorbance intensities are drastically lower than that of the pure catechol reaction.
3.3 Mass spectrometry analysis (UHPLC-PDA-HRMS)
OA samples from all pyrolysis temperatures prior to reaction with FeCl3 were run in triplicate on UHPLC-PDA-HRMS for detailed chemical analysis. Table S2† lists the major ions detected in negative ion mode with their corresponding retention times, neutral molecular formulae, tentative structural assignments, and pyrolysis temperatures in which the compounds were present. References are presented in cases where structural assignments have been made in previous studies.5,30,38,42–55Fig. 5 shows the total ion chromatograms of all temperature OA, with peaks labeled according to their corresponding detected ion in Table S2.† As expected, hydrophilic, more polar compounds (such as organic acids) eluted earlier than the more hydrophobic, less polar species, which had stronger interactions with the stationary phase in the reverse-phase C18 column (Fig. S3 and S4†). We observed oxygenated aromatics, substituted phenols, methoxyphenols, and substituted benzoic acids in various abundance, dictated by pyrolysis temperature. Tracers of lignin burning (such as catechol, acetovanillone, homovanillic acid, vanillic acid, and vanillin) were present at all pyrolysis temperatures measured.43 Levoglucosan, a tracer of biomass burning, was seen in low abundance during the LC deadtime (∼1.46 min), as it is highly water soluble.Fig. S3† shows the PDA and TIC chromatograms for OA300/400, water-soluble reaction products, and P300/400 once dissolved in methanol and run through HRMS. Unreacted OA exhibits peaks throughout the chromatogram, indicating products with a wide range of polarities. Water-soluble products (Fig. S3d†) have large PDA/TIC peaks at early retention times, indicating more polar products are present, whereas P300/P400 have greater intensity peaks at later retention times, suggesting less polar products. Large peaks at approximately 8 min (benzoic acid) are reduced in intensity in P300/400 in comparison to the water-soluble products. Both (Fig. S3d†) and (Fig. S3f†) exhibit a peak at 11.02 min (m/z 221.0817, C12H14O4). As this peak is present in both water-soluble and water-insoluble products, filtration may not have properly remove particles containing this compound or it could be present in both phases.
The light absorption properties of OA300/400 and P300/400 are further compared in Fig. S4(a–d),† which shows the heat map view absorption spectra as a function of retention time. P300 (Fig. S4c†) and P400 (Fig. S4d†) have less strongly absorbing peaks than their unreacted OA300/400 counterparts. Coniferaldehyde (9.15 min) was responsible for the greatest absorption for OA300/400 before reaction with iron. In the P300 and P400 chromatograms, coniferaldehyde was present and was the strongest absorber, indicating that it was either trapped inside of particles or it was produced through particle decomposition in solution. In addition to other labeled organic compounds, 4-nitrocatechol (4-NC) was observed in the OA400 PDA chromatogram (8.47 min, assigned by the retention time of the standard and PDA absorption spectrum) which was not present in the P400 PDA chromatogram (remained in the soluble reaction products). Previous experiments showed that 4-NC is not reactive with FeCl3 under these reaction conditions.30
Fig. 6 shows mass spectra integrated over all retention times (2–16 min) as function of pyrolysis temperature. As temperature increases, the mass spectral complexity decreases, with catechol (m/z 109) becoming the most dominant peak in the mass spectra (600, 700, and 800 °C). In comparison to catechol, guaiacol is present in increasing abundance beginning at 500 °C. Of the compounds known to polymerize in the presence of iron (Fig. 1), we observed catechol, guaiacol, and coniferaldehyde in the unreacted OA extracts. These peaks were verified by standard experiments in our previous work.30 Increasing pyrolysis temperature decreased the amount of collected OA that was extracted in water. At higher temperatures, nonpolar species (PAHs and non-cyclic aliphatics) dominate emissions, reducing the amount of water-soluble OA by 20% from 500 °C to 800 °C (Table 1). Some of these aromatic compounds are soluble in water but are not relevant to this study as they do not react with iron. Fig. S5† shows an expanded version of this figure with major peaks labelled with formulae.
During pyrolysis, chemical bonds within biopolymers (lignin, hemicellulose, and cellulose) break down and release VOCs as a function of combustion temperature. Lignin decomposition occurs between 200 and 1000 °C to produce species of guaiacol, eugenol, and syringol, whereas, hemicellulose and cellulose pyrolysis occur at lower temperatures, 210–310 °C and 300–380 °C, respectively, to emit furans and furfurals.35,56,57 Higher temperature combustion results in fragmentation of hemicellulose and cellulose further into more volatile, smaller VOCs. At temperatures greater than 500 °C, aromatization processes begin and emission of shortly substituted aromatics (phenols), non-substituted aromatics, and PAHs occurs.35 We indirectly observed these expected chemical transformations through the observation of color changes in the collected OA (Fig. 2) and the water extraction efficiencies listed in Table 1. As pyrolysis temperature increased, OA collected on the filters progressively darkened and the OA extracted in water decreased by half from the 300 to 800 °C. More water-insoluble products (PAHs) were present at higher temperatures but, as the chromatography results in Fig. 5 show, catechol (peak #1) and other phenolic/oxidized aromatics were emitted even at higher temperatures. For iron to catalyze polymerization reactions with organics, a bidentate mononuclear organic–Fe(III) complex must be formed for subsequent ligand to metal charge transfer.24,30 Adjacent phenolic groups or oxygen atoms on adjacent carbon atoms must be present on the organic structure for a bidentate complex to be formed with Fe(III). In Fig. 5, we observed the following organics that fit these characteristics in the unreacted OA: catechol (#1), salicylic acid (#2), homovanillic acid (#5), vanillic acid (#8), guaiacol (#10), 3-hydroxybenzoic acid (#14), and coniferaldehyde (#15). It is probable that a combination of these organics participated in Fe-catalyzed reactions to yield heterogeneous polyphenolic particles.
We acknowledge that the characterization of this OA is not all-encompassing (since we focused on the water-soluble compounds only) and should not be utilized for a complete inventory of pyrolyzed Canary Island pine emissions. Organic carbon extraction with methanol gives a better estimation of BrC compared to only water-soluble fractions,58,59 but the water-soluble components better represent those that would undergo atmospheric aging in the aqueous phase. Due to the ionization nature of ESI (−), n-heterocyclic PAHs and aliphatic compounds were not well detected. ESI (+) and atmospheric pressure photoionization (APPI) (±) would give a more complete picture of the exact chemical composition of unreacted BBOA water-soluble extracts (PAHs); however, these techniques were not employed in this study.
3.4 Characterization of insoluble particles through LDI-ToF-MS, TEM, and SEM-EDS
To explore the structure of the insoluble particles generated through reactions of OA500–800 with Fe(III), we employed laser desorption ionization time-of-flight mass spectrometry (LDI-ToF-MS). LDI is typically used in the analysis of polymers and protein samples, but it was utilized in an atmospheric application by Link et al. (2020) to ionize polycatechol films for tentative chemical formulae and structural assignments.27 Fig. S6† shows the negative ionization mode spectra for the P500–700. P800 was also run on LDI but is not shown in Fig. S6,† as the collected spectrum produced no useful signal, possibly due to the low mass loading of our sample on the plate before ionization. While this spectrum is complex, and the resolving power of the instrument is insufficient to provide formulae of different peaks, general observations can still be made from the overall shape of the mass spectral envelope, spanning the range of m/z 200–600. Dimers, trimers, and tetramers of catechol (MW 110), guaiacol (MW 124), and coniferaldehyde (MW 178) would fall within the ion range of the detected ions. The similar mas spectral shape for the P500–700 spectra indicates that, at these three pyrolysis temperatures, similar products were formed. There is a small shift in the average m/z values of the detected compounds as the pyrolysis temperature increases (Fig. S6†), and this shift reflects the reduction in the molecular weight of the products emitted at higher temperatures observed in Fig. 6.We employed electron microscopy (SEM and TEM) and X-ray spectroscopy (EDS) to image particles and determine bulk elemental composition in comparison with polycatechol standard particles (produced by the method of Slikboer et al. (2015)24). Fig. 7 shows representative SEM images, TEM images, and EDS spectra. From the images, the polycatechol standard particles and P600 appear to have similar morphology: both have fractal structures consisting of interconnected ∼10–50 nm primary particles, which is reminiscent of the structure of fresh soot.60 Both polycatechol standard particles and P600 particles are qualitatively indistinguishable. Morphology directly affects the surface chemistry of a particle and influence its interactions/reactivity with its surrounding environment. Since the morphologies and elemental composition qualitatively appear to be very similar, we can hypothesize that their surface chemistries would behave similarly. The EDS spectra of polycatechol (Fig. 7d) and OA reaction particles (Fig. 7h) are almost identical with slight variation in intensity. Consistent with previous work on polycatechol,24 P600 EDS spectra (Fig. 7h) show carbon and oxygen as the main elemental components of the particles, further indicating a polyphenolic composition. Fig. S7 and S8† show the SEM images and EDS spectra for the sample and blanked regions of the SEM grids. EDS spectra for both polycatechol (Fig. S7c†) and P600 (Fig. S8c†) exhibit strong C, O, and Fe peaks, whereas the blanked regions (Fig. S7b and S8b†) exhibit no Fe peaks and only weak C and O peaks.
There is some residual Fe in the EDS spectra for both samples, which we have attributed to incomplete washing of samples. In previous work, Tran et al. (2017) observed that C4 and C6 dicarboxylic acids (fumaric acid and muconic acid) reacted with FeCl3 under similar conditions to create colored particles with iron trapped inside the polymer.61 If these reactions occurred in our complex organic mixture, we would have expected to see a larger iron trace in the EDS spectrum in Fig. 7h than in the polycatechol standard spectrum in Fig. 7d, however, it was not the case. In addition, we did not observe fumaric acid, muconic acid or similar diacids in our HRMS results of OA starting material, which helps explain why iron was not chemically trapped in the particles. Conversely, Link et al. (2020) found that residual iron can be a product of incomplete washing of iron out of particles during preparation for EDS measurements, further supporting our results.27 As P500–800 result from reaction of heterogeneous OA, we believe their structure to be polyphenolic, in contrast to the more chemically homogenous of polycatechol.
4. Conclusions and future work
We have shown that previously observed Fe(III)-catalyzed reactions with phenolic compounds resulting in light-absorbing products are also taking place in more complex mixtures of water-soluble organics emitted by pyrolyzed biomass. The addition of Fe(III) to water-soluble components of OA can catalyze reactions with phenolic compounds, forming phenoxy radical intermediates that initiate C–C coupling reactions to form light-absorbing dimers/oligomers. These oligomerization reactions convert volatile molecules into higher-molecular weight, water-insoluble, light-absorbing products of lower volatility.4,24,27We acknowledge the limitations of bulk experiments, which do not fully reproduce conditions in atmospheric particles, for example, hydrogen peroxide produced in this reaction is not able to evaporate from the bulk solution as it would from ambient particles. Hydrogen peroxide concentrations were not measured in reaction solutions in this work, and it should be a priority for follow up mechanistic studies. We also acknowledge that the organic aerosol samples used in this work were produced by oxygen-free pyrolysis of biomass, so it will be important to test this chemistry at different oxygen levels in the future. The concentrations used in these experiments are only applicable to aerosol liquid water and/or surfaces of particles, and that real atmospheric particles can have other organic compounds that can compete for complexation with iron (oxalate and sulfate) or scavenge OH radicals. Scavenging may slow the formation rate of these particles, as OH is an intermediate product in this reaction mechanism.24 Further experiments are needed to assess kinetic effects of particle formation in more atmospherically accurate samples.62 Also, it is unknown what effect UV irradiation has on this reaction's progress or the extent of photodegradation, as this work has only been conducted under dark conditions. It is possible that light could photodegrade organics in the water-soluble OA fractions and drive photo-Fenton processes resulting in oxidation and photodegradation of organics instead of its oligomerization. It will be also be important to test the effect of oxalate ion on this Fe(III)-catalyzed chemistry and conduct particle aging/lifetime experiments under photolytic conditions in order to surmise how environmental conditions can impact the climate forcing properties of these BrC particles.
Author contributions
K. S. H. conducted the experiments, data analysis, and wrote the manuscript. B. P. C. and J. P. P. conducted all microscopy imaging and analysis. S. A. N. and H. A. A. designed the experiments, assisted in interpretation of results, and manuscript co-editing.Conflicts of interest
There are no conflicts to declare.Acknowledgements
The authors thank Dr Veronique Perraud for help with Orbitrap experiments, Dr Lisa Wingen for help setting up LDI-ToF-MS experiments and data analysis, and Dr Natalie Smith and Avery Dalton for help HRMS data processing and Ocean Optics experiments. This study was supported by the U.S. National Science Foundation grant AGS-1853639. The UPLC-PDA-HRMS instrument used in this work was purchased with the U.S. National Science Foundation grant CHE-1920242. The pyrolysis setup was developed as part of the U.S. National Oceanic and Atmospheric Administration grant NA22OAR4310196.Notes and references
- R. F. Hems, E. G. Schnitzler, C. Liu-Kang, C. D. Cappa and J. P. D. Abbatt, Aging of Atmospheric Brown Carbon Aerosol, ACS Earth Space Chem., 2021, 5, 722–748 CrossRef CAS.
- A. L. Hodshire, A. Akherati, M. J. Alvarado, B. Brown-Steiner, S. H. Jathar, J. L. Jimenez, S. M. Kreidenweis, C. R. Lonsdale, T. B. Onasch, A. M. Ortega and J. R. Pierce, Aging Effects on Biomass Burning Aerosol Mass and Composition: A Critical Review of Field and Laboratory Studies, Environ. Sci. Technol., 2019, 53, 10007–10022 CrossRef CAS PubMed.
- Y. Rudich, N. M. Donahue and T. F. Mentel, Aging of organic aerosol: bridging the gap between laboratory and field studies, Annu. Rev. Phys. Chem., 2007, 58, 321–352 CrossRef CAS PubMed.
- H. A. Al-Abadleh, Aging of atmospheric aerosols and the role of iron in catalyzing brown carbon formation, Environ. Sci.: Atmos., 2021, 1, 297–345 CAS.
- B. R. T. Simoneit, W. F. Rogge, M. A. Mazurek, L. J. Standley, L. M. Hildemann and G. R. Cass, Lignin pyrolysis products, lignans, and resin acids as specific tracers of plant classes in emissions from biomass combustion, Environ. Sci. Technol., 1993, 27, 2533–2541 CrossRef CAS.
- C. E. Stockwell, P. R. Veres, J. Williams and R. J. Yokelson, Characterization of biomass burning emissions from cooking fires, peat, crop residue, and other fuels with high-resolution proton-transfer-reaction time-of-flight mass spectrometry, Atmos. Chem. Phys., 2015, 15, 845–865 CrossRef.
- L. E. Hatch, A. Rivas-Ubach, C. N. Jen, M. Lipton, A. H. Goldstein and K. C. Barsanti, Measurements of I/SVOCs in biomass-burning smoke using solid-phase extraction disks and two-dimensional gas chromatography, Atmos. Chem. Phys., 2018, 18, 17801–17817 CrossRef CAS.
- P. Veres, J. M. Roberts, I. R. Burling, C. Warneke, J. de Gouw and R. J. Yokelson, Measurements of gas-phase inorganic and organic acids from biomass fires by negative-ion proton-transfer chemical-ionization mass spectrometry, J. Geophys. Res.: Atmos., 2010, 115, D23302 CrossRef.
- J. S. Schlosser, R. A. Braun, T. Bradley, H. Dadashazar, A. B. MacDonald, A. A. Aldhaif, M. A. Aghdam, A. H. Mardi, P. Xian and A. Sorooshian, Analysis of aerosol composition data for western United States wildfires between 2005 and 2015: Dust emissions, chloride depletion, and most enhanced aerosol constituents, J. Geophys. Res.: Atmos., 2017, 122, 8951–8966 CrossRef CAS PubMed.
- H. A. Al-Abadleh, Review of the bulk and surface chemistry of iron in atmospherically relevant systems containing humic-like substances, RSC Adv., 2015, 5, 45785–45811 RSC.
- M. Astitha, J. Lelieveld, M. Abdel Kader, A. Pozzer and A. de Meij, Parameterization of dust emissions in the global atmospheric chemistry-climate model EMAC: impact of nudging and soil properties, Atmos. Chem. Phys., 2012, 12, 11057–11083 CrossRef CAS.
- O. A. Choobari, P. Zawar-Reza and A. Sturman, The global distribution of mineral dust and its impacts on the climate system: A review, Atmos. Res., 2014, 138, 152–165 CrossRef CAS.
- D. W. Griffin, C. A. Kellogg and E. A. Shinn, Dust in the Wind: Long Range Transport of Dust in the Atmosphere and Its Implications for Global Public and Ecosystem Health, Global Change Hum. Health, 2001, 2, 20–33 CrossRef.
- V. Ramanathan, P. J. Crutzen, J. Lelieveld, A. P. Mitra, D. Althausen, J. Anderson, M. O. Andreae, W. Cantrell, G. R. Cass, C. E. Chung, A. D. Clarke, J. A. Coakley, W. D. Collins, W. C. Conant, F. Dulac, J. Heintzenberg, A. J. Heymsfield, B. Holben, S. Howell, J. Hudson, A. Jayaraman, J. T. Kiehl, T. N. Krishnamurti, D. Lubin, G. McFarquhar, T. Novakov, J. A. Ogren, I. A. Podgorny, K. Prather, K. Priestley, J. M. Prospero, P. K. Quinn, K. Rajeev, P. Rasch, S. Rupert, R. Sadourny, S. K. Satheesh, G. E. Shaw, P. Sheridan and F. P. J. Valero, Indian Ocean Experiment: An integrated analysis of the climate forcing and effects of the great Indo-Asian haze, J. Geophys. Res.: Atmos., 2001, 106, 28371–28398 CrossRef CAS.
- J. Lelieveld, P. J. Crutzen, V. Ramanathan, M. O. Andreae, C. A. M. Brenninkmeijer, T. Campos, G. R. Cass, R. R. Dickerson, H. Fischer, J. A. de Gouw, A. Hansel, A. Jefferson, D. Kley, A. T. J. de Laat, S. Lal, M. G. Lawrence, J. M. Lobert, O. L. Mayol-Bracero, A. P. Mitra, T. Novakov, S. J. Oltmans, K. A. Prather, T. Reiner, H. Rodhe, H. A. Scheeren, D. Sikka and J. Williams, The Indian Ocean Experiment: Widespread Air Pollution from South and Southeast Asia, Science, 2001, 291, 1031–1036 CrossRef CAS PubMed.
- M. F. M. McDaniel, E. D. Ingall, P. L. Morton, E. Castorina, R. J. Weber, R. U. Shelley, W. M. Landing, A. F. Longo, Y. Feng and B. Lai, Relationship between Atmospheric Aerosol Mineral Surface Area and Iron Solubility, ACS Earth Space Chem., 2019, 3, 2443–2451 CrossRef CAS.
- A. Kumar, M. M. Sarin and B. Srinivas, Aerosol iron solubility over Bay of Bengal: Role of anthropogenic sources and chemical processing, Mar. Chem., 2010, 121, 167–175 CrossRef CAS.
- R. C. Moffet, H. Furutani, T. C. Rödel, T. R. Henn, P. O. Sprau, A. Laskin, M. Uematsu and M. K. Gilles, Iron speciation and mixing in single aerosol particles from the Asian continental outflow, J. Geophys. Res.: Atmos., 2012, 117, D07204 CrossRef.
- Y. Deng, K. Zhang, H. Chen, T. Wu, M. Krzyaniak, A. Wellons, D. Bolla, K. Douglas and Y. Zuo, Iron-catalyzed photochemical transformation of benzoic acid in atmospheric liquids: Product identification and reaction mechanisms, Atmos. Environ., 2006, 40, 3665–3676 CrossRef CAS.
- C. J. Hennigan, M. A. Miracolo, G. J. Engelhart, A. A. May, A. A. Presto, T. Lee, A. P. Sullivan, G. R. McMeeking, H. Coe, C. E. Wold, W.-M. Hao, J. B. Gilman, W. C. Kuster, J. de Gouw, B. A. Schichtel, J. L. J. Collett, S. M. Kreidenweis and A. L. Robinson, Chemical and physical transformations of organic aerosol from the photo-oxidation of open biomass burning emissions in an environmental chamber, Atmos. Chem. Phys., 2011, 11, 7669–7686 CrossRef CAS.
- D. A. Thomas, M. M. Coggon, H. Lignell, K. A. Schilling, X. Zhang, R. H. Schwantes, R. C. Flagan, J. H. Seinfeld and J. L. Beauchamp, Real-Time Studies of Iron Oxalate-Mediated Oxidation of Glycolaldehyde as a Model for Photochemical Aging of Aqueous Tropospheric Aerosols, Environ. Sci. Technol., 2016, 50, 12241–12249 CrossRef CAS PubMed.
- N. L. Ng, S. S. Brown, A. T. Archibald, E. Atlas, R. C. Cohen, J. N. Crowley, D. A. Day, N. M. Donahue, J. L. Fry, H. Fuchs, R. J. Griffin, M. I. Guzman, H. Herrmann, A. Hodzic, Y. Iinuma, J. L. Jimenez, A. Kiendler-Scharr, B. H. Lee, D. J. Luecken, J. Mao, R. McLaren, A. Mutzel, H. D. Osthoff, B. Ouyang, B. Picquet-Varrault, U. Platt, H. O. T. Pye, Y. Rudich, R. H. Schwantes, M. Shiraiwa, J. Stutz, J. A. Thornton, A. Tilgner, B. J. Williams and R. A. Zaveri, Nitrate radicals and biogenic volatile organic compounds: oxidation, mechanisms, and organic aerosol, Atmos. Chem. Phys., 2017, 17, 2103–2162 CrossRef CAS PubMed.
- J. K. Kodros, D. K. Papanastasiou, M. Paglione, M. Masiol, S. Squizzato, K. Florou, K. Skyllakou, C. Kaltsonoudis, A. Nenes and S. N. Pandis, Rapid dark aging of biomass burning as an overlooked source of oxidized organic aerosol, Proc. Natl. Acad. Sci. U. S. A., 2020, 117, 33028–33033 CrossRef CAS PubMed.
- S. Slikboer, L. Grandy, S. L. Blair, S. A. Nizkorodov, R. W. Smith and H. A. Al-Abadleh, Formation of Light Absorbing Soluble Secondary Organics and Insoluble Polymeric Particles from the Dark Reaction of Catechol and Guaiacol with Fe(III), Environ. Sci. Technol., 2015, 49, 7793–7801 CrossRef CAS PubMed.
- A. Al Nimer, L. Rocha, M. A. Rahman, S. A. Nizkorodov and H. A. Al-Abadleh, Effect of Oxalate and Sulfate on Iron-Catalyzed Secondary Brown Carbon Formation, Environ. Sci. Technol., 2019, 53, 6708–6717 CrossRef CAS PubMed.
- A. Lavi, P. Lin, B. Bhaduri, R. Carmieli, A. Laskin and Y. Rudich, Characterization of Light-Absorbing Oligomers from Reactions of Phenolic Compounds and Fe(III), ACS Earth Space Chem., 2017, 1, 637–646 CrossRef CAS.
- N. Link, N. Removski, J. Yun, L. T. Fleming, S. A. Nizkorodov, A. K. Bertram and H. A. Al-Abadleh, Dust-Catalyzed Oxidative Polymerization of Catechol and Its Impacts on Ice Nucleation Efficiency and Optical Properties, ACS Earth Space Chem., 2020, 4, 1127–1139 CrossRef CAS.
- H. A. Al-Abadleh, F. Motaghedi, W. Mohammed, M. S. Rana, K. A. Malek, D. Rastogi, A. A. Asa-Awuku and M. I. Guzman, Reactivity of aminophenols in forming nitrogen-containing brown carbon from iron-catalyzed reactions, Commun. Chem., 2022, 5, 1–12 CrossRef.
- H. A. Al-Abadleh, M. S. Rana, W. Mohammed and M. I. Guzman, Dark Iron-Catalyzed Reactions in Acidic and Viscous Aerosol Systems Efficiently Form Secondary Brown Carbon, Environ. Sci. Technol., 2021, 55, 209–219 CrossRef CAS PubMed.
- H. Chin, K. S. Hopstock, L. T. Fleming, S. A. Nizkorodov and H. A. Al-Abadleh, Effect of aromatic ring substituents on the ability of catechol to produce brown carbon in iron(III)-catalyzed reactions, Environ. Sci.: Atmos., 2021, 1, 64–78 CAS.
- J. Ling, F. Sheng, Y. Wang, A. Peng, X. Jin and C. Gu, Formation of brown carbon on Fe-bearing clay from volatile phenol under simulated atmospheric conditions, Atmos. Environ., 2020, 228, 117427 CrossRef CAS.
- P. Salgado, D. Contreras, H. D. Mansilla, K. Márquez, G. Vidal, C. J. Cobos and D. O. Mártire, Experimental and computational investigation of the substituent effects on the reduction of Fe3+ by 1,2-dihydroxybenzenes, New J. Chem., 2017, 41, 12685–12693 RSC.
- M. A. Santoso, E. G. Christensen, J. Yang and G. Rein, Review of the Transition From Smouldering to Flaming Combustion in Wildfires, Front. Mech. Eng., 2019, 5, 49 CrossRef.
- M. A. J. Harrison, S. Barra, D. Borghesi, D. Vione, C. Arsene and R. Iulian Olariu, Nitrated phenols in the atmosphere: a review, Atmos. Environ., 2005, 39, 231–248 CrossRef CAS.
- K. Sekimoto, A. R. Koss, J. B. Gilman, V. Selimovic, M. M. Coggon, K. J. Zarzana, B. Yuan, B. M. Lerner, S. S. Brown, C. Warneke, R. J. Yokelson, J. M. Roberts and J. de Gouw, High- and low-temperature pyrolysis profiles describe volatile organic compound emissions from western US wildfire fuels, Atmos. Chem. Phys., 2018, 18, 9263–9281 CrossRef CAS.
- Y. Chen and T. C. Bond, Light absorption by organic carbon from wood combustion, Atmos. Chem. Phys., 2010, 10, 1773–1787 CrossRef CAS.
- S. A. Nizkorodov, J. Laskin and A. Laskin, Molecular chemistry of organic aerosols through the application of high resolution mass spectrometry, Phys. Chem. Chem. Phys., 2011, 13, 3612 RSC.
- L. T. Fleming, P. Lin, A. Laskin, J. Laskin, R. Weltman, R. D. Edwards, N. K. Arora, A. Yadav, S. Meinardi, D. R. Blake, A. Pillarisetti, K. R. Smith and S. A. Nizkorodov, Molecular composition of particulate matter emissions from dung and brushwood burning household cookstoves in Haryana, India, Atmos. Chem. Phys., 2018, 18, 2461–2480 CrossRef CAS.
- N. R. Smith, G. V. Crescenzo, Y. Huang, A. P. S. Hettiyadura, K. Siemens, Y. Li, C. L. Faiola, A. Laskin, M. Shiraiwa, A. K. Bertram and S. A. Nizkorodov, Viscosity and liquid–liquid phase separation in healthy and stressed plant SOA, Environ. Sci.: Atmos., 2021, 1, 140–153 CAS.
- D. E. Romonosky, A. Laskin, J. Laskin and S. A. Nizkorodov, High-Resolution Mass Spectrometry and Molecular Characterization of Aqueous Photochemistry Products of Common Types of Secondary Organic Aerosols, J. Phys. Chem. A, 2015, 119, 2594–2606 CrossRef CAS PubMed.
- G. Albarran, W. Boggess, V. Rassolov and R. H. Schuler, Absorption Spectrum, Mass Spectrometric Properties, and Electronic Structure of 1,2-Benzoquinone, J. Phys. Chem. A, 2010, 114, 7470–7478 CrossRef CAS PubMed.
- D. M. Smith, T. Cui, M. N. Fiddler, R. P. Pokhrel, J. D. Surratt and S. Bililign, Laboratory studies of fresh and aged biomass burning aerosol emitted from east African biomass fuels – Part 2: Chemical properties and characterization, Atmos. Chem. Phys., 2020, 20, 10169–10191 CrossRef CAS.
- D. R. Oros and B. R. T. Simoneit, Identification and emission factors of molecular tracers in organic aerosols from biomass burning Part 1. Temperate climate conifers, Appl. Geochem., 2001, 16, 1513–1544 CrossRef CAS.
- L. R. Mazzoleni, B. Zielinska and H. Moosmüller, Emissions of Levoglucosan, Methoxy Phenols, and Organic Acids from Prescribed Burns, Laboratory Combustion of Wildland Fuels, and Residential Wood Combustion, Environ. Sci. Technol., 2007, 41, 2115–2122 CrossRef CAS PubMed.
- J. S. Smith, A. Laskin and J. Laskin, Molecular Characterization of Biomass Burning Aerosols Using High-Resolution Mass Spectrometry, Anal. Chem., 2009, 81, 1512–1521 CrossRef CAS PubMed.
- S. Tomaz, T. Cui, Y. Chen, K. G. Sexton, J. M. Roberts, C. Warneke, R. J. Yokelson, J. D. Surratt and B. J. Turpin, Photochemical Cloud Processing of Primary Wildfire Emissions as a Potential Source of Secondary Organic Aerosol, Environ. Sci. Technol., 2018, 52, 11027–11037 CrossRef CAS PubMed.
- D. R. Oros and B. R. T. Simoneit, Identification and emission factors of molecular tracers in organic aerosols from biomass burning Part 2. Deciduous trees, Appl. Geochem., 2001, 16, 1545–1565 CrossRef CAS.
- L. A. Edye and G. N. Richards, Analysis of condensates from wood smoke. Components derived from polysaccharides and lignins, Environ. Sci. Technol., 1991, 25, 1133–1137 CrossRef CAS.
- A. P. S. Hettiyadura, V. Garcia, C. Li, C. P. West, J. Tomlin, Q. He, Y. Rudich and A. Laskin, Chemical Composition and Molecular-Specific Optical Properties of Atmospheric Brown Carbon Associated with Biomass Burning, Environ. Sci. Technol., 2021, 55, 2511–2521 CrossRef CAS PubMed.
- L. T. Fleming, P. Lin, J. M. Roberts, V. Selimovic, R. Yokelson, J. Laskin, A. Laskin and S. A. Nizkorodov, Molecular composition and photochemical lifetimes of brown carbon chromophores in biomass burning organic aerosol, Atmos. Chem. Phys., 2020, 20, 1105–1129 CrossRef CAS.
- M. Loebel Roson, R. Duruisseau-Kuntz, M. Wang, K. Klimchuk, R. J. Abel, J. J. Harynuk and R. Zhao, Chemical Characterization of Emissions Arising from Solid Fuel Combustion—Contrasting Wood and Cow Dung Burning, ACS Earth Space Chem., 2021, 5, 2925–2937 CrossRef CAS.
- P. Lin, L. T. Fleming, S. A. Nizkorodov, J. Laskin and A. Laskin, Comprehensive Molecular Characterization of Atmospheric Brown Carbon by High Resolution Mass Spectrometry with Electrospray and Atmospheric Pressure Photoionization, Anal. Chem., 2018, 90, 12493–12502 CrossRef CAS PubMed.
- A. B. Dalton and S. A. Nizkorodov, Photochemical Degradation of 4-Nitrocatechol and 2,4-Dinitrophenol in a Sugar-Glass Secondary Organic Aerosol Surrogate, Environ. Sci. Technol., 2021, 55, 14586–14594 CrossRef CAS PubMed.
- B. R. T. Simoneit, Biomass burning—a review of organic tracers for smoke from incomplete combustion, Appl. Geochem., 2002, 17, 129–162 CrossRef CAS.
- S. Lee, K. Baumann, J. J. Schauer, R. J. Sheesley, L. P. Naeher, S. Meinardi, D. R. Blake, E. S. Edgerton, A. G. Russell and M. Clements, Gaseous and Particulate Emissions from Prescribed Burning in Georgia, Environ. Sci. Technol., 2005, 39, 9049–9056 CrossRef CAS PubMed.
- H. Zhou, Y. Long, A. Meng, Q. Li and Y. Zhang, The pyrolysis simulation of five biomass species by hemi-cellulose, cellulose and lignin based on thermogravimetric curves, Thermochim. Acta, 2013, 566, 36–43 CrossRef CAS.
- H. Zhou, Y. Long, A. Meng, S. Chen, Q. Li and Y. Zhang, A novel method for kinetics analysis of pyrolysis of hemicellulose, cellulose, and lignin in TGA and macro-TGA, RSC Adv., 2015, 5, 26509–26516 RSC.
- Y. Cheng, K. He, Z. Du, G. Engling, J. Liu, Y. Ma, M. Zheng and R. J. Weber, The characteristics of brown carbon aerosol during winter in Beijing, Atmos. Environ., 2016, 127, 355–364 CrossRef CAS.
- J. Liu, M. Bergin, H. Guo, L. King, N. Kotra, E. Edgerton and R. J. Weber, Size-resolved measurements of brown carbon in water and methanol extracts and estimates of their contribution to ambient fine-particle light absorption, Atmos. Chem. Phys., 2013, 13, 12389–12404 CrossRef.
- J. Cai, N. Lu and C. M. Sorensen, Comparison of size and morphology of soot aggregates as determined by light scattering and electron microscope analysis, Langmuir, 1993, 9, 2861–2867 CrossRef CAS.
- A. Tran, G. Williams, S. Younus, N. N. Ali, S. L. Blair, S. A. Nizkorodov and H. A. Al-Abadleh, Efficient Formation of Light-Absorbing Polymeric Nanoparticles from the Reaction of Soluble Fe(III) with C4 and C6 Dicarboxylic Acids, Environ. Sci. Technol., 2017, 51, 9700–9708 CrossRef CAS PubMed.
- H. A. Al-Abadleh and S. A. Nizkorodov, Open questions on transition metals driving secondary thermal processes in atmospheric aerosols, Commun. Chem., 2021, 4, 1–4 CrossRef.
Footnote |
| † Electronic supplementary information (ESI) available. See DOI: https://doi.org/10.1039/d2ea00141a |
| This journal is © The Royal Society of Chemistry 2023 |