
 Open Access Article
 This Open Access Article is licensed under a Creative Commons Attribution-Non Commercial 3.0 Unported Licence
Probing the limits of sampling gaseous elemental mercury passively in the remote atmosphere†
Christopher
Hoang
a,
Olivier
Magand
 *b,
Jérôme
Brioude
c,
Andrea
Dimuro‡
d,
Christophe
Brunet
d,
Claudine
Ah-Peng
e,
Yann
Bertrand
b,
Aurelien
Dommergue
b,
Ying Duan
Lei
a and
Frank
Wania
*a
*b,
Jérôme
Brioude
c,
Andrea
Dimuro‡
d,
Christophe
Brunet
d,
Claudine
Ah-Peng
e,
Yann
Bertrand
b,
Aurelien
Dommergue
b,
Ying Duan
Lei
a and
Frank
Wania
*a
aDepartment of Physical and Environmental Sciences, University of Toronto Scarborough, 1265 Military Trail, Toronto, Ontario, Canada M1C 1A4. E-mail: frank.wania@utoronto.ca
bUniversité Grenoble Alpes, CNRS, IRD, Grenoble INP, IGE, Grenoble, France. E-mail: olivier.magand@cnrs.fr
cLaboratoire de l’Atmosphère et des Cyclones, UMR8105, CNRS, Université de La Réunion, 97744 Saint-Denis, France
dObservatoire Volcanologique du Piton de la Fournaise, Institut de Physique du Globe de Paris, 97418 La Plaine des Cafres, Réunion, France
eUMR PVBMT, Université de La Réunion, Saint-Pierre, France
First published on 12th December 2022
Abstract
Reliably recording very low ambient concentrations of gaseous elemental mercury (GEM) in remote regions is often required, for example in the context of evaluating how effective the Minamata Convention is in reducing global Hg emissions. However, sampling over extended periods of time at sites that are difficult to access can be very challenging. In order to establish what role inexpensive and easy-to-use passive air samplers may play in this regard, we deployed a sampler using a Radiello diffusive barrier and activated carbon sorbent for periods of up to three years and with sampling periods ranging from one to three months in some of the most extreme, remote and challenging global environments: at Concordia station on the Antarctic plateau, on Amsterdam Island in the remote Southern Indian Ocean and at several sites on the tropical island of La Réunion. The ability to reliably record the GEM concentrations at these sites was strongly influenced by the size of the sequestered amount of mercury relative to the extent and variability of the contamination of field blank samples. In some cases, acceptably low and consistent field blank contamination could only be achieved by storing samplers in sealed glass jars during transport and storage. The size of the sequestered amount is easily increased by extending deployment times, and the experience of the current study suggests that deployment periods in excess of two months are advisable. Sampling in Antarctica was compromised by the extreme low temperatures, which caused unknown sampling rates, hoar frost accumulation, material failure and potential failure of storage seals. While good agreement with GEM concentrations measured with an active sampler was noted on Amsterdam Island, the passive sampler derived levels at the Maïdo Observatory in La Réunion were notably higher than concentrations measured simultaneously with a Tekran vapour analyzer, which was possibly related to sampling rates being temporarily elevated at the very beginning of deployment at low GEM concentrations.
Environmental significanceWhereas extremely remote locations, such as Antarctica or isolated islands, are important for studying the troposphere, limitations regarding site access, electrical power, skilled personnel, and specialized supplies can make measurements challenging. Passive sampling approaches without the need for power, maintenance and frequent site visits are attractive, but their performance under the frequently harsh conditions encountered at such sites needs to be established. We tested the feasibility of recording long-term average concentrations of gaseous elemental mercury with a passive sampler at some of the world's most remote and extreme atmospheric research stations. The failures and successes of these tests informed the development of guidelines and procedures that increase the likelihood of obtaining reliable long-term records of atmospheric mercury with passive samplers. |
Introduction
Mercury (Hg), listed within the top 10 environmental pollutants by the United Nations, is a potent neurotoxin that is globally dispersed in the atmosphere. Humans are mostly exposed to Hg by eating seafood.1–3 The Minamata Convention, which came into force in 2017, aims to limit the use, emissions and health impacts of Hg globally. The importance of Hg as a pollutant is highlighted by it being the only element in the periodic table to merit its own environmental international treaty.4,5 The Convention's effectiveness in lowering Hg emissions, environmental concentrations of Hg and ultimately human exposure to Hg will have to be evaluated. An important element of this effectiveness evaluation will be the recording of long-term time trends in the concentrations of Hg in the atmosphere of remote regions,6–11 because air concentrations in remote regions (e.g. in the remote Southern hemisphere or in polar regions) are not affected by local or even regional sources but integrate the trends in emissions within an entire hemisphere. In other words, if efforts to reduce Hg emissions are successful overall, this should be reflected in declining air concentrations in remote locations, provided that natural Hg sources do not offset the Convention's measures. Furthermore, remote sites may be well suited to highlight the role of such natural sources, including evasion from the ocean. In particular, the response of natural Hg sources to a rapidly changing climate remains to be determined.Sampling in remote locations can be challenging, because of the effort and cost of transporting personnel and equipment (e.g., ref. 6, 9 and 10). For that reason, it would be desirable to be able to rely on sampling techniques that are easy to ship, have limited site requirements (e.g., in terms of availability of electricity and specialty gases), are simple to operate, and could be left unattended for extended periods of time. Passive air samplers (PASs) fulfill many of these conditions. However, remote locations also are often exposed to harsh environmental conditions and the ability of PASs to reliably function under such conditions will need to be confirmed. Accordingly, we sought here to test the feasibility of using a cost-effective passive sampling technique to record long-term concentration trends of gaseous elemental Hg (GEM) at atmospheric background levels under very harsh environmental conditions. A PAS using a Radiello diffusive barrier and activated carbon sorbent12,13 has been shown to have a precision and accuracy that is comparable to that of state-of-the-art active measurement techniques.14,15 While this PAS has been tested at a number of sites worldwide with a wide range of climatic circumstances,14 its long-term performance in extremely challenging environments needs further evaluation. For example, Naccarato et al.15 noted lower performance metrics for the sampler when deployed to measure background GEM levels in winter conditions in Canada than in Italy.
Here we set out to challenge the PAS by McLagan et al.12 with the objective to establish (i) the limits of its applicability and (ii) a set of recommended procedures to increase the chances for obtaining reliable results. This was done by testing the PAS on La Réunion and Amsterdam Island in the southern Indian Ocean as well as at Concordia station on the Antarctic Plateau. A global map in the ESI† indicates the location of these three places within the Southern hemisphere (Fig. S1†). Each of these three locations confronts the sampler with a combination of extremely demanding circumstances:
- GEM levels in the Southern hemispheric background atmosphere are very low, at or even below 1 ng m−3.8
- The very large distance between the sampling site and the analytical laboratory that prepared and analyzed the samplers, and the associated extended storage periods, introduce a multitude of opportunities for samples to become contaminated during storage and transport. The time between initial PAS preparation and final analysis can sometimes exceed several years due to the logistical challenges of shipping material to locales that are extremely difficult to access.
- Weather conditions are often extreme with respect to wind speed, precipitation rate, and temperature.16–18
Questions we sought to address included: What are the limits of what is feasible in terms of monitoring global background concentrations of GEM in the atmosphere with a PAS? What is the field blank contamination that can be expected during convoluted journeys involving plane and ship transport and extended storage in warehouses and customs areas? What is the shortest deployment period recommended under such circumstances? Should sampling rates be adjusted to local temperature and wind speed conditions?
Methods
Overview
On La Réunion (“RU”) PASs for GEM as described in McLagan et al.12 were deployed for successive periods of approximately one month at multiple sites on the island over a period of ∼eight months (Nov. 2017 to Jun. 2018). At one of these sites (Maïdo Observatory,18 “RU-MO”), GEM levels were also recorded by a Tekran vapour analyzer allowing for a direct comparison with values obtained with an active sampling method; at another site (Piton Bleu, “RU-PB”) sampling continued for an extra eight months (June 2018 to February 2019). At Concordia Station (Dome C, “DMC”), passive samplers were deployed consecutively for a period of two years (Nov. 2018 to Dec. 2020), whereas the time period of sampling on Amsterdam Island (“AMS”) was three years (Nov. 2018 to Nov. 2021). At AMS and DMC, GEM has also been recorded continuously since 2012 with a Tekran vapour analyzer, allowing for additional direct comparisons. The PAS deployment period at AMS and DMC was approximately one month during the first half year (until May/June 2018) and then approx. 2 or 3 months thereafter.All 186 samplers (154 exposed samplers and 32 field blanks) were assembled at the University of Toronto Scarborough, which means that they were shipped by international courier from Toronto, Canada to Grenoble, France and from there to their Southern hemisphere destination, with the same return journey. For shipping and storage, the samplers were sealed tightly with tape, bagged individually into zip-lock plastic bags19 and placed in sturdy, foam-lined cases made of either aluminum or hard plastic. No sorbent was added to individual samplers or the case. As the sites are not visited regularly (in particular, AMS and DMC), the duration of storage at field sites varied between 9 and 18 months, with an average of around one year. Field blanks, i.e., samples that underwent the same journey as the real samples but were not exposed to the atmosphere, were taken regularly to characterize the extent of sampler contamination arising from assembly, handling, transport and storage. Compared to the sampling on La Réunion, the number of field blanks relative to the number of exposed samplers was approximately doubled from 0.14 to 0.28 for the AMS and DMC deployments. During the second half of the AMS and DMC deployments, PASs were placed in individual glass jars (Fig. S2†) in an effort to further reduce contamination during transport and storage. All 77 deployments were duplicated.
Sampling
Table 1 gives details on the different sampling locations and sampler deployments. On La Réunion, samplers were placed at seven different locations, ranging in altitude from 76 to 2565 m above sea level (asl), and being potentially influenced by urban or volcanic sources or possibly both. Fig. S3† shows a map of the island of La Réunion showing topography and the location of the 6 major sampling sites. At four of these sites, samplers were deployed consecutively eight times for approximately 1 month each (seven times at Mare Longue Forest, “RU-MLF”, Fig. S8†). At Piton Partage (“RU-PPA”, Fig. S10†), this was done only for three months. On the summit of Piton de la Fournaise (Volcano summit, “RU-VS”, Fig. S9†), the three consecutive deployments lasted 1, 2 and 3.5 months. A duplicated sample was taken near an active eruptive fissure of Piton de La Fournaise (“RU-EC”, Fig. S11†) for a period of 6 days during the April–June 2018 major eruption time period (27/04/2018 to 01/06/2018; 34.6 days). Samplers were deployed consecutively 19 times at Pointe Bénédicte on Amsterdam Island (55 m asl, Fig. S12†) and 15 times at the ATMOS shelter at Concordia Station (>3200 m asl, Fig. S13†). Fig. S4† indicates the location of Pointe Bénédicte on the NW corner of Amsterdam Island, ∼2.0 km to the West (upwind) of the main research station. More detailed site descriptions for Maïdo Observatory, Amsterdam Island and Concordia Stations are available in ref. 18, 11 and 20 respectively.| Code | Name | Elevation | Coordinates | Characterisation | Period | n periods | n blanks |
|---|---|---|---|---|---|---|---|
| RU-UR | La Réunion University | 76 m | 20.9012° S, 55.4844° E | Urban influence | 11/17 to 06/18 | 8 | 2 |
| RU-MO | Maïdo Observatory | 2160 m | 21.0796° S, 55.3830° E | Oceanic & vegetation influence during day, free troposphere at night | 11/17 to 06/18 | 8 | 3 |
| RU-PB | Piton Bleu | 1656 m | 21.1644° S, 55.5610° E | Vegetation, possible far field downwind volcanic influence | 11/17 to 02/19 | 8 + 5 | 1 + 2 |
| RU-MLF | Mare Longue Forest | 325 m | 21.3493° S, 55.7454° E | Tropical forest | 11/17 to 05/19 | 7 | 2 |
| RU-VS | Volcano Summit | 2565 m | 21.2471° S, 55.7096° E | Volcanic influence | 11/17 to 06/18 | 3 | 2 |
| RU-PPA | Piton Partage | 2283 m | 21.2194° S, 55.7024° E | Vegetation, possibly volcanic influence | 04/18 to 06/18 | 3 | 0 |
| RU-EC | Eruptive Cone | 1800 m | 21.2552° S, 55.7003° E | Volcanic influence | 05/18 | 1 | 0 |
| AMS-PB | Pointe Bénédicte | 55 m | 37.7983° S, 77.5378° E | Remote, oceanic site | 11/18 to 11/21 | 19 | 12 |
| DMC-AS | ATMOS Shelter | >3200 m | 75.0999° S, 123.3333° E | High-altitude site on Antarctic plateau | 11/18 to 12/20 | 15 | 8 |
Deployment and retrieval dates and times for each individual sampler are given in Table S2 to S10 in the ESI.† In most cases, samplers were attached at a height of ca. 2.0 m above ground with zip-ties to existing structures at the sampling sites. Fig. S5 to S13† contain photographs of all nine sampling locations.
Meteorological datasets
Several meteorological datasets (temperature, pressure, wind speed and wind direction, relative humidity, global radiation) were used in this study. Meteo-France provided data for La Reunion University (RU-UR), Maïdo Observatory (RU-MO), Mare-Longue Forest (RU-MLF), Piton Partage (RU-PPA) and the site at the eruptive cone (RU-EC). The meteorological stations of the Observatoire Volcanologique du Piton de la Fournaise (OVPF) supplied data for Piton Bleu (RU-PB) and Piton de la Fournaise volcano summit (RU-VS). Meteorological data recorded by stations located at Pointe Bénédicte (AMS) and the ATMOS shelter (DMC), which are operated by the Laboratoire des Sciences du Climat et de l'Environment (LSCE) and the Institut des Géosciences de l'Environnement (IGE) in the framework of projects by the French polar science institute, were retrieved directly. The averages of the air temperatures and wind speeds, used to adjust the sampling rates of the PASs to local conditions for each of the deployment periods, are presented in Table 4.GEM measurements with passive air samplers
The Hg in the PAS is sequestered in a sulfur-impregnated activated carbon sorbent (HGR carbon, Calgon). The Hg content in the carbon was quantified using total mercury analyzers, namely either an AMA254 (Leco Instruments Ltd) or a MA3000 (Nippon Instruments Corporation). The samples underwent thermal decomposition, amalgamation, followed by atomic absorption spectroscopy using pure oxygen gas as a carrier gas.21 Each sample was split into two aliquots of approximately 0.4 g each when using the AMA254, and four aliquots of approximately 0.2 g each when using the MA3000. If one of the aliquots was lost during analysis, an amount in the entire sample was still calculated by assuming that the spilled carbon had the same concentration (in ng Hg per g carbon) as the aliquot that was analyzed. This was possible because the mass of each aliquot was recorded prior to analysis. In all cases, about 0.2 g of sodium carbonate was added on top of the carbon to avoid sulfur catalyst poisoning.22 Additionally, approximately 5 g of sodium carbonate was incorporated into the catalyst tube of the AMA254 to further extend its lifetime. No sodium carbonate was added to the catalyst tube of the MA3000.Samples underwent a drying cycle at 200 °C for 30 seconds before being thermally decomposed at 750 °C for 330 seconds in the AMA254. Samples analyzed in the MA3000 underwent a drying cycle at 150 °C for 60 seconds and were heated to an intermediate temperature of 300 °C, followed by thermal decomposition at 720 °C for 150 seconds. The Hg vapor would then be trapped onto a gold-impregnated amalgamator. The AMA254 and MA3000 was purged for 60 and 30 seconds, respectively, to remove any interferents in the system. The amalgamator in the AMA254 and MA3000 were heated to 900 °C and 650 °C, respectively in order to release the captured Hg and sent it to a dual pathlength cuvette. A Hg vapour lamp emits at a wavelength of 253.65 nm as the vapour travels through the low and high cell of the cuvette and reaches the detector.
The AMA254 was calibrated by diluted Hg standards of 0.1 ppm, 1 ppm, and 10 ppm made from a Hg liquid standard (1000 ± 5 mg L−1 in 10% HCl; Inorganic Ventures). The low cell was calibrated using standards of 0, 1, 2.5, 5, 10 and 25 ng while the high cell was calibrated using standards of 0, 25, 50, 100, 250, 350, and 450 ng. The calibration curve in the low cell was fitted linearly, while the calibration curve in the high cell was fitted quadratically as the instrument reaches its upper limit of linearity. The MA3000 was similarly calibrated using the same type of diluted Hg standards of 0.1 ppm, 1 ppm, and 10 ppm. The low cell was calibrated using standards of 0, 1, 2, 3.5, 5, 6.5 and 8 ng while the high cell was calibrated using standards of 0, 15, 20, 25, and 30 ng. The calibration curve in both the low and high cell were fitted linearly.
Throughout the analysis, liquid and solid standards were run between sample sets. The 0.1 ppm liquid standard and two in-house reference material (activated carbon that had been exposed to Hg vapour, called “Loaded HGR-II” and “Loaded HGR-III”, with a concentration of 34.4 ng Hg g−1 and 27.4 ng Hg g−1 respectively C) were analyzed to check for reproducibility in the low cell, while the 1 ppm liquid standard and standard reference material NIST-2685c (149.4 ng g−1 ± 4.5) were analyzed to check for reproducibility in the high cell. Recoveries of the 0.1 ppm liquid standards were 101.22 ng g−1 (n = 85) with a relative standard deviation (RSD) of 6.25%. Recoveries of the Loaded HGR-II and Loaded HGR-III were 34.66 ng g−1 (n = 29, RSD = 4.53%) and 27.7 (n = 31, RSD = 3.55%), respectively. Recoveries of the 1 ppm liquid standards were 1007.11 ng g−1 (n = 29, RSD = 3.55%). Recoveries of the NIST-2685c were 146.94 ng g−1 (n = 45, RSD = 3.17%).
The amount of Hg quantified in a sampler (in ng Hg) was reduced by the product of the mass of carbon in that sampler (g carbon) with the average concentration of Hg in an appropriate set of field blanks (in ng Hg per g carbon). A volumetric air concentration of GEM (in ng m−3) was then obtained by dividing the blank corrected amount of Hg by the product of a sampling rate (in m3 day−1) and the deployment period (in day). We used two calculations, using either the global generic sampling rate of 0.135 m3 day−1 recommended by McLagan et al.14 or sampling rates specific to each deployment period derived by adjusting the generic sampling rate for the average temperatures and wind speeds prevailing during a particular deployment period by using the empirical relationship by McLagan et al.14 Results of duplicate samples were averaged and a percent relative difference was calculated. One sample each from RU-UR, RU-PPA and AMS and two from RU-PB were judged to be outliers (flagged in Tables S1 to S6† based on large discrepancies relative to a duplicate and other samples from the same site) and thus were not used in the calculation of averages. One sample from RU-VS was lost during analysis. One sample from AMS was blown away during a storm, but was retrieved and analyzed.
GEM measurements with automated Tekran vapour analyzers
GEM has been measured with vapour analyzers 2537A/B (Tekran Inc., Toronto, Canada), running at standard temperature and pressure conditions (273.15 K, 1013.25 hPa), at AMS11 and DMC20 since 2012, and at the Maïdo Observatory from 2017 to 2018.23 These measurements are based on Hg enrichment on a gold cartridge, followed by a thermal desorption and detection by cold vapour atomic fluorescence spectroscopy. Switching between two cartridges allows for alternating sampling and desorption and thus full temporal coverage. The instruments are automatically calibrated every 69 h at AMS and DMC, and every 167 h at Maïdo using internal Hg permeation sources which in turn are annually checked by manual injections of saturated Hg vapour from a temperature-controlled vessel. The instruments' mass flow meter and the related flow rate was checked with an external and calibrated mass flow meter during the study. To ensure the comparability of the Hg measurements regardless of study site, the vapour analyzers have been operated according to Global Mercury Observation System (GMOS) standard operating procedures,24 in accordance with best practices adopted in well-established regional Hg monitoring networks (CAMNet, AMNet).During the 10 months of operation, the Tekran 2537 A at the Maïdo Observatory experienced less than 5% shift in the manual injection check and less than 1% shift in mass flow meter calibration. Raw dataset, routine, and exceptional maintenance and monitoring files were compiled and processed by software developed at IGE and specifically designed to quality assure and quality control atmospheric mercury datasets in order to produce clean GEM time series. In this automated process, the raw dataset is compared against potential flags corresponding to more than 40 criteria that specifically refer to all operational phases related to the calculation of Hg concentrations and calibration.25 Each raw observation is individually flagged depending on the result of each corresponding criterion and returns, as a temporary output, a flagged dataset (valid, warning, and invalid). Inclusion of all field notes, implying corrections and invalidations of data regrouped in the flagged dataset step, as well as a clarification step by the site manager according to their knowledge allows for the production of a complete quality-assured and quality-controlled dataset according to the initial temporal acquisition resolution.
Results
Blank levels
When passive sampling at atmospheric background concentrations, the level and the variability of field blank contamination is of paramount importance, because they control the method detection limit (MDL) and plausible quantification limit (PQL) that can be achieved. These in turn are decisive for the shortest deployment period that yields reliable results. The analytical results on all field blank samples are presented in Table S1 in the ESI.† The mean Hg concentration in ten field blanks from La Réunion was 1.14 ± 0.42 ng Hg per g carbon. Field blank levels in the first batch of samplers from AMS and DMC as well as the second batch of samplers deployed at Piton Bleu on La Réunion was much higher at around 4 to 6 ng g−1 and, especially in the case of the AMS samples, highly variable (ranging 0.4 to 10.5 ng g−1). Packing each sampler into its individual glass jar for storage and transport, was successful in lowering levels and variability of the field blank contamination of the second batch of AMS samples to 1.02 ± 0.55 ng g−1. In the case of the DMC samples, using glass jars caused blanks to drop to 2.64 ng g−1, but their variability was small (12%).In order to place these field blank levels into context, Table 2 compiles values previously reported for this PAS. It appears that under optimal circumstances, field blank levels around and below 0.5 ng g−1 are achievable, which is only marginally higher than analytical blanks. In many cases, studies that achieved such low blank levels involved a limited amount of transport (e.g. by airplane) and storage in uncontrolled environments, e.g. because analytical lab and field deployment site were in close vicinity.12,13,15,26 However, some studies involving transatlantic return shipments could maintain such low field blank levels (e.g., Canada–Norway27 and Canada–Italy15). Somewhat higher blank levels above 0.5 ng g−1, but below 2 ng g−1, were encountered in studies involving regional travel and extended sampler storage (e.g., ref. 19 and 28) and in studies of mercury-contaminated sites involving transatlantic travel (Canada–Italy28,29). Higher field blank levels above 3 ng g−1 have occasionally been observed during a study involving 20 global sampling sites,14 during a study in gold mining communities in Ghana27 and during a study involving sampling in New Zealand.30 In the latter case, the contamination could be traced back to sampler storage in a warehouse with greatly elevated GEM concentrations30 and avoiding that warehouse succeeded in lowering average blank levels by more than an order of magnitude (from 36 ng to 2.3 ng g−1).
| Study region | Average levels in field blanks in ng g−1 | Number of field blanks | Reference |
|---|---|---|---|
| La Réunion | 1.14 ± 0.42 | 10 | This study |
| Piton Bleu (06/18 to 02/19) | 3.83, 4.89 | 2 | |
| Amsterdam Island | 6.15 ± 3.74 | 5 | |
| Amsterdam Island (glass jars) | 1.02 ± 0.55 | 7 | |
| Concordia station | 4.11 ± 0.90 | 4 | |
| Concordia station (glass jars) | 2.64 ± 0.31 | 3 | |
| Toronto, UTSC campus | 0.51 ± 0.13 | 12 | |
| Wind experiments | 0.5 ± 0.2 | 7 | 13 |
| Temperature/RH experiments | 0.58 ± 0.15 | 5 | |
| Radiello reuse experiments | 0.38 ± 0.08 | 4 | |
| Greater Toronto area | 0.4 ± 0.2 | 18 | 26 |
| Global calibration and evaluation at 20 sites | 0.5 to 9 mean: 1.8 ± 2.0 | 50 | 14 |
| 29 | |||
| Italian Hg mine, two-weeks deployments | 1.6 ± 1.3 | 11 | |
| Italian Hg mine, seasonal deployments | 1.5 ± 0.9 | 13 | |
| New Zealand, 1st deployment | 36 ± 17 | 7 | 30 |
| New Zealand, 2nd deployment | 2.3 ± 0.9 | 6 | |
| Rende, Italy | 0.44 ± 0.06 | 10 | 15 |
| Downsview, Canada | 0.43 ± 0.05 | 10 | |
| Low concentration calibration | 0.86 ± 0.40 | 6 | 19 |
| High concentration calibration yellow R. | 0.23 ± 0.08 | 9 | |
| High concentration calibration white R. | 1.12 ± 0.23 | 6 | |
| Gold mining area 1, Ghana | 15 ± 3 | 2 | 27 |
| Gold mining area 2, Ghana | 3 | 1 | |
| Waste facility, Norway | 0.4 ± 0.1 | 3 | |
| Borden study | 0.69 ± 0.36 | 16 | 28 |
| Scarborough study | 0.91 ± 0.46 | 49 | |
| Brescia study | 0.72 ± 0.37 | 11 |
Within this comparative context, the field blank levels of the La Réunion samplers are not unusually high, considering that the sampler were assembled and analyzed in Toronto, i.e., had to undergo a long journey from Canada to mainland France to La Réunion and back. The field blank levels in the AMS and DMC samplers are quite high, but not implausibly so, considering that the logistics of getting the samplers to the sampling site and back are extremely complex, involve transport in ships in addition to airplanes, as well extended storage in places with uncontrolled and unknown GEM contamination (e.g., research stations, customs and international courier warehouses). While extensive storage experiments suggested that it is possible to reduce uptake of Hg by the carbon sorbent during extended storage,19 it cannot be completely avoided, especially if the samplers encounter high GEM environments.27,30 The success of glass storage containers in lowering blank levels and making them less variable is promising.
Blank correction
The amount of Hg quantified in exposed samplers is corrected for blank contamination by subtracting the product of the average blank contamination in ng g−1 and the mass of carbon in an exposed sampler. In all cases we used the average concentration in field blanks that underwent the same transport and storage as exposed samplers for correction. In the case of the La Réunion samples, the levels in field blank left at different sampling sites (3 MO, 2 MFL, 2 UR, 2 VS, 1 PB), were not significantly different and the average was used.The percentage by which the amount in exposed samplers is reduced during the blank correction is an important quality criterion and should be as small as possible. In addition to the field blank contamination level, this percentage depends on the length of sampler deployment and the atmospheric GEM concentrations, decreasing with longer deployments and higher atmospheric concentrations. These percentages are reported in the fourth column of Table 3. Analytical results for each individual sample are presented in Tables S2 to S10 in the ESI.† In the samplers deployed in La Réunion, the blanks contained on average ∼15% as much Hg as exposed samplers, these fractions being lower when sample deployments were longer (e.g. ∼7% at volcano summit) and higher during the short deployments (e.g. 38% for the 6 day sample deployed at the eruptive cone). During subsequent deployments, the higher field blank contamination meant that on average the blanks contained one third (second batch of RU-BP deployments and DMC deployments w/o jars) to one half (AMS deployment w/o jars) of the Hg amount in exposed samplers. Using glass jars for sampler storage, reduced that fraction dramatically, to ∼5% in the samplers deployed for ∼2 to 3 months at AMS, and to ∼16% for those deployed in DMC.
| Number of deployments & samples | Average deployment length in days | % blank adjustment | MDL n > MDL | PQL n > PQL | Replicate precision in % | |
|---|---|---|---|---|---|---|
| a Only based on two field blank samples. b Outlier removed. | ||||||
| La Réunion | MDL = 0.84 ng | PQL = 2.8 ng | ||||
| UR 11/17 to 06/18 | 8/15 | 30 (26 to 35) | 13 (9 to 18) | 15 out of 15 | 15 out of 15 | 11 (3 to 30)b |
| MO 11/17 to 06/18 | 8/16 | 29 (25 to 36) | 14 (11 to 16) | 16 out of 16 | 16 out of 16 | 11 (1 to 25) |
| PB 11/17 to 02/19 | 8/16 | 29 (21 to 35) | 14 (10 to 17) | 16 out of 16 | 16 out of 16 | 6 (2 to 18) |
| MLF 11/17 to 05/19 | 7/14 | 32 (26 to 55) | 16 (10 to 20) | 14 out of 14 | 14 out of 14 | 11 (3 to 20) |
| VS 11/17 to 06/18 | 3/5 | 77 (34 to 108) | 7 (5 to 12) | 5 out of 5 | 5 out of 5 | 5 (2 and 9) |
| PPA 04/18 to 06/18 | 3/6 | 27 (25 to 29) | 16 (13 to 18) | 6 out of 6 | 6 out of 6 | 11 (5 and 16)b |
| EC 05/18 | 1/2 | 6 | 38 | 2 out of 2 | 0 out of 2 | 10 |
| MDL = 1.4a ng | PQL = 4.7a ng | |||||
| PB 06/18-02/19 | 5/10 | 47 (29 to 65) | 33 (24 to 48) | 10 out of 10 | 7 out of 10 | 10 (2 to 14)b |
| Amsterdam Island | MDL = 7.9 ng | PQL = 26 ng | ||||
| No jars 11/18-12/19 | 10/20 | 37 (21 to 71) | 49 (38 to 70) | 0 out of 20 | 0 out of 20 | 39 (2 to 90) |
| MDL = 1.1 ng | PQL = 3.7 ng | |||||
| w jars 12/18-11/21 | 9/18 | 75 (56 to 107) | 5 (3 to 8) | 18 out of 18 | 18 out of 18 | 8 (4 to 21) |
| Concordia Station | MDL = 1.8 ng | PQL = 6.0 ng | ||||
| No jars 11/18-11/19 | 9/18 | 40 (28 to 62) | 35 (26 to 47) | 18 out of 18 | 6 out of 18 | 27 (5 to 48) |
| MDL = 0.7 ng | PQL = 2.2 ng | |||||
| w jars 11/18-12/20 | 6/12 | 67 (59 to 91) | 16 (11 to 22) | 12 out of 12 | 12 out of 12 | 20 (5 to 42) |
Method detection limits and plausible quantification limit
We define the MDL and PQL in ng of Hg as three and ten times the standard deviation of the field blank levels, again relying on the field blanks that had been used for blank correction. These values therefore varied quite widely depending on the variability of each batch of field blanks, being relatively low for the samplers deployed at La Réunion (MDL < 1 ng, PQL < 3 ng) and quite high for the first set of deployments at AMS, when field blanks were not only quite high, but also extremely variable (MDL ∼8 ng, PQL ∼26 ng). Columns five and six in Table 3 indicate the number of individual exposed samplers that had levels of Hg exceeding the MDL and PQL. All deployments on La Réunion yielded levels above the MDL and only a handful were below the PQL (namely the 6 day samples at EC and a few of the samples from the second set of PB deployments, when field blank levels were much higher). At AMS, amounts in not a single of the samplers deployed without glass jars exceeded either the MDL and PQL. In a remarkable illustration of the effectiveness of using glass jars and increasing the deployment length, all of the AMS and DMC samples in the second batch had levels above MDL and PQL.Replicate precision
All deployments were duplicated allowing for the calculation of the relative percent difference (7th column in Table 3). The results largely mirror the results of the blank adjustment. Replicate precision of La Réunion deployments was on average ∼11%, but ranging for individual pairs from 1 to 30%. In the AMS deployments, the use of glass jars improved replicate precision dramatically from an average of 39% to 8%, whereas at DMC, the jars only marginally improved precision from 27% to 20%.Even the replicate precision around 10% at RU and AMS is considerably worse than what had been reported in previous applications of the sampler. McLagan et al.12 reported a mean relative standard deviation (RSD) between triplicate samplers of 4 ± 2 and 2 ± 1% for an indoor and outdoor experiment, respectively. McLagan et al. reported a value of 2 ± 2% in studies conducted in Toronto26 (n = 11) and Italy29 (n = 9). The global calibration and evaluation study, which involved 129 replicated deployments yielded a mean RSD of 3.6 ± 3.0%.14 Naccarato et al.15 observed replicate precision of 3% (n = 22), which increased with deployment length, from ∼5% for two-weeks samples to ∼2% for 12 weeks samples. Quant et al.28 reported a precision of ∼7.5%. The relatively poor replicate precision observed in the present study can be attributed to the contribution of two factors, a blank correction that represents a relatively large fraction of the sequestered amount of Hg and the relatively high variability in the field blank levels. For example, the RSD of the 10 field blank samples taken on RU was 37%. The blank correction procedure that was applied assumes that all RU samples have the average field blank contamination of 1.14 ng g−1 (∼14% of the sequestered amount). In reality, the concentrations in the ten RU field blanks ranged over a factor of 4 from 0.42 ng g−1 to 1.71 ng g−1, which corresponds to 5 or 21% of the sequestered amount of Hg.
Overall assessment of data reliability
Collectively, the data compiled in Table 3 convey the confidence that we can place in the reliability of the results obtained with the PAS during the various deployments. Clearly, the data obtained from the first batch of deployments on AMS and all of the data from DMC are not very reliable and should at best be considered semi-quantitative. High and variable field blank levels, in combination with relatively short deployments result in large blank adjustments, poor replicate precision and levels that most of the time do not exceed the PQL. The data obtained from almost all of the La Réunion deployments and the second batch of AMS deployments, on the other hand, have much more acceptable quality characteristics, with relatively modest blank corrections, reasonable duplicate precision and levels that exceed the PQLs. In the case of the second batch of AMS deployments, this is partly due to the longer deployments, which result in smaller blank correction and better replicate precision than during the RU deployments despite slightly higher MDL and PQL.Calculation of volumetric air concentrations
Volumetric air concentrations in units of ng m−3 are derived by dividing the field-blank-adjusted amount of Hg in an exposed sampler in ng by the product of a sampling rate in m3 day−1 and the deployment length in days. The average concentrations for the different batches and deployments given in Table 4 were derived using either the generic sampling rate of 0.135 m3 day−1 recommended by McLagan et al.14 or by adjusting this sampling rates to account for the influence of variable wind speed and temperature.14 The generic sampling rate was derived from deployments with an average temperature and wind speed of 9.9 °C and 3.4 m s−1.14 Many of the deployments at the higher elevation sites on La Réunion (MO, PB, PPA, EC) have meteorological conditions close to these values and therefore the adjusted sampling rates are only marginally different from the generic one. Slightly higher deployment-specific sampling rates at UR (warm, windy), MLF (warm) and VS (windy) means that the calculated volumetric concentrations at these RU sites are slightly lower than if the generic value were used.| Temperature | Windspeed | Volumetric GEM concentration | ||
|---|---|---|---|---|
| Using T & WS adjusted SR | Using generic SR | |||
| a Replicate precision. | ||||
| La Réunion | ||||
| UR 11/17 to 06/18 (n = 8) | 25.7 ± 1.5 °C | 5.2 ± 0.3 m s−1 | 1.09 ± 0.10 ng m−3 (9%) | 1.25 ± 0.10 ng m−3 |
| MO 11/17 to 06/18 (n = 8) | 12.8 ± 1.8 °C | 3.6 ± 0.6 m s−1 | 1.15 ± 0.07 ng m−3 (6%) | 1.18 ± 0.07 ng m−3 |
| PB 11/17 to 02/19 (n = 8) | 14.5 ± 1.8 °C | 3.5 ± 0.8 m s−1 | 1.22 ± 0.11 ng m−3 (9%) | 1.26 ± 0.11 ng m−3 |
| MLF 11/17 to 05/19 (n = 7) | 24.9 ± 1.7 °C | 2.9 ± 0.2 m s−1 | 0.93 ± 0.08 ng m−3 (9%) | 1.01 ± 0.08 ng m−3 |
| VS 11/17 to 06/18 (n = 3) | 11.7 ± 0.7 °C | 4.8 ± 0.6 m s−1 | 1.16 ± 0.07 ng m−3 (6%) | 1.21 ± 0.05 ng m−3 |
| PPA 04/18 to 06/18 (n = 3) | 11.0 ± 1.8 °C | 3.4 ± 0.1 m s−1 | 1.03 ± 0.07 ng m−3 (7%) | 1.04 ± 0.08 ng m−3 |
| EC 05/18 (n = 1) | 11.7 °C | 3.9 m s−1 | 1.44 ± 0.14 ng m−3 (10%)a | 1.47 ± 0.15 ng m−3 |
| PB 06/18-02/19 (n = 5) | 12.0 ± 2.6 °C | 3.7 ± 0.7 m s−1 | 0.98 ± 0.08 ng m−3 (8%) | 1.01 ± 0.08 ng m−3 |
![[thin space (1/6-em)]](https://www.rsc.org/images/entities/char_2009.gif) |
||||
| Amsterdam Island | ||||
| No jars 11/18-12/19 (n = 10) | 14.9 ± 2.3 °C | 8.2 ± 1.6 m s−1 | 0.96 ± 0.28 ng m−3 (30%) | 1.09 ± 0.31 ng m−3 |
| w jars 01/19-11/21 (n = 8) | 13.6 ± 2.1 °C | 9.1 ± 1.6 m s−1 | 1.03 ± 0.05 ng m−3 (5%) | 1.17 ± 0.06 ng m−3 |
| w jars 12/18 (n = 1) | 14.8 °C | 8.9 m s−1 | 2.1 ± 0.4 ng m−3 (21%)a | 2.4 ± 0.5a ng m−3 |
|
||||
| Concordia Station | ||||
| No jars 11/18-11/19 (n = 9) | −(48.5 ± 11.9) °C | 4.6 ± 0.5 m s−1 | 1.68 ± 0.42 ng m−3 (25%) | 1.07 ± 0.30 ng m−3 |
| w jars 11/18-12/20 (n = 6) | −(48.0 ± 13.3) °C | 4.5 ± 0.6 m s−1 | 1.69 ± 0.15 ng m−3 (9%) | 1.8 ± 0.16 ng m−3 |
Pointe Bénédicte on AMS is very windy with average wind speeds during deployment periods reaching as high as 11.5 m s−1 (average for all deployment periods: 8.6 m s−1), causing the deployment specific sampling rate to be 15% higher than the generic one, which yields accordingly 15% lower volumetric air concentrations. DMC, on the other hand, is extremely cold, with average temperatures during the June/July deployments reaching below −60 °C (average for all deployment periods: −48.3 °C). Accordingly, the adjusted sampling rate is on average 36% lower than the generic one (up to 44% lower during the extremely cold deployments). Using such low sampling rates yield average GEM concentrations around 1.7 ng m−3, which is clearly implausibly high for the southern hemispheric background atmosphere. This suggests that the temperature adjustment of the sampling rate is not appropriate, when it involves temperature that are far outside of the range for which this adjustment was obtained, thus requiring an extreme extrapolation. Naccarato et al.15 already observed that a sampling rate adjustment to far less extreme winter time temperature in Toronto did not improve agreement between GEM concentrations obtained by passive air sampler and a Tekran vapour analyzer.
Volumetric air concentrations
The volumetric air concentrations on RU obtained using the adjusted sampling rates are ∼1.1 ng m−3 when averaged over all deployment periods and sampling sites (Table 4). At AMS, the average for the second more reliable batch of deployments was around 1.03 ng m−3 (and 0.96 ng m−3 for the first, much less trustworthy batch of samples) (Table 4). When no sampling rate adjustment was applied, the DMC samplers recorded air concentrations of around 1.07 ng m−3 (Table 4).One sampling period had slightly higher levels: the AMS sample taken during December 2018 (AMS-PB-S11) had concentrations above 2 ng m−3, with the duplicates agreeing that levels were well above background. During that particular sampling period vegetation around the sampling site was being cleared, which may be responsible for these elevated GEM levels, for example as a result of fuel-powered or otherwise Hg-contaminated equipment.31 The Tekran vapour analyzer data cannot be used to confirm or refute this explanation, as the instrument was shut down during this period of work.
Comparison with volumetric air concentrations measured with active air sampling techniques
Fig. 1 compares the concentrations obtained with the passive air samplers deployed at the Maïdo Observatory, on Amsterdam Island and at Concordia Station with the values recorded by the Tekran vapour analyzers at the same locations. The latter data are averaged for the PAS deployment periods and the mean plus or minus one standard deviation is shown (red lines). In the case of the passive samplers, the mean and the individual values of the two replicates is shown (black lines). The panels at the bottom of the figure show the differences between the two recorded values, i.e., the concentrations obtained by the PAS minus the average concentration from the Tekran analyzers (blue lines). Values above (below) 0 therefore indicate that the passive samplers recorded higher (lower) values than the Tekran analyzers.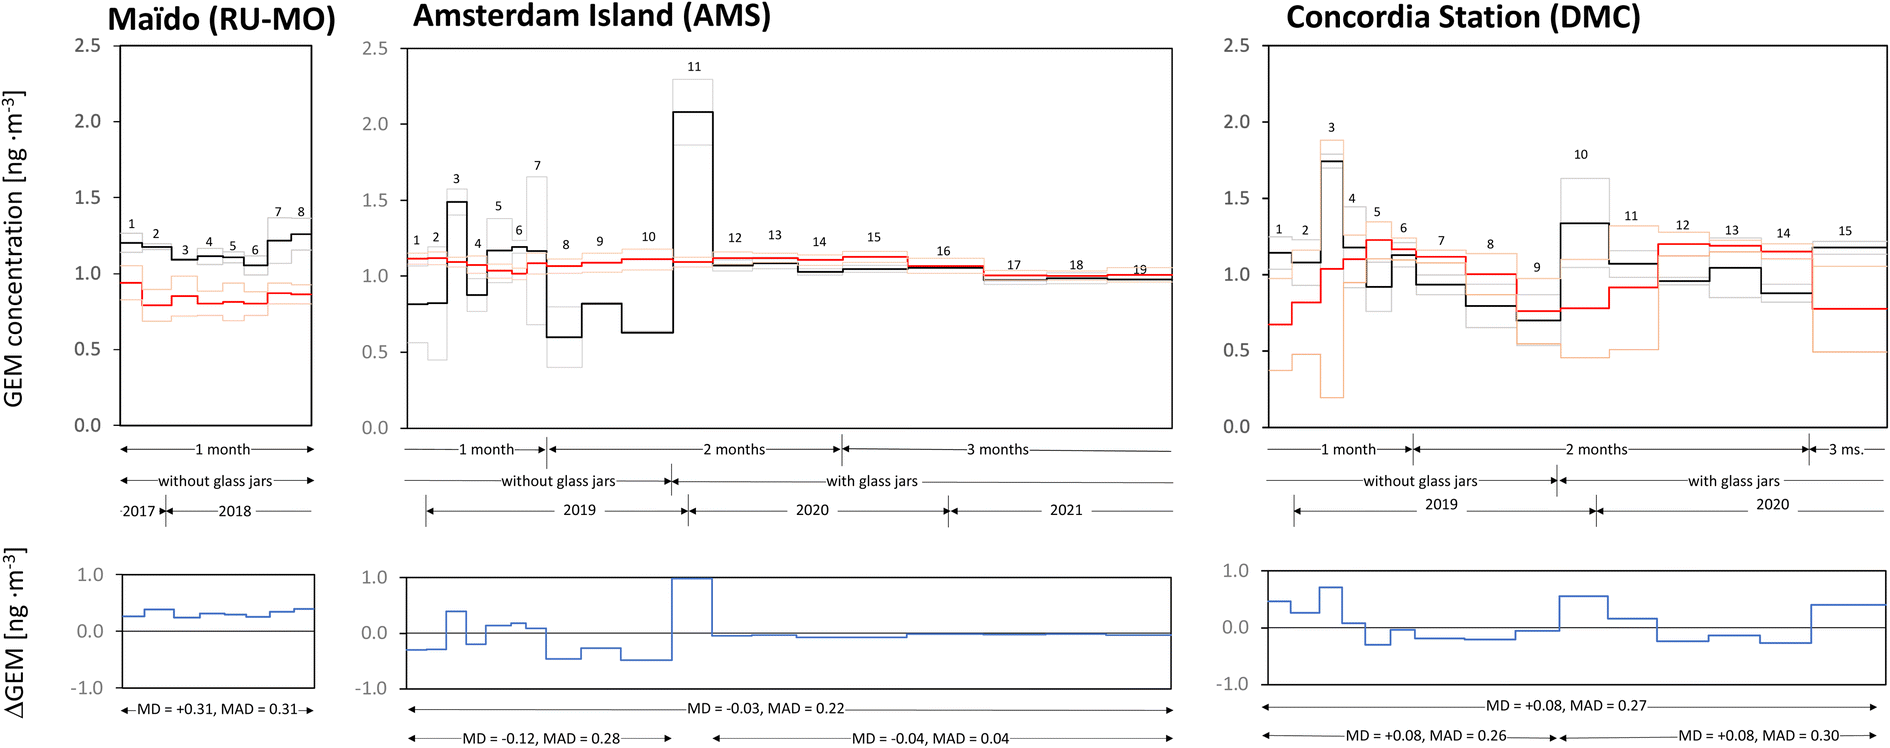 | ||
| Fig. 1 Comparison of GEM concentrations recorded with passive air samplers (PASs, black lines) and Tekran vapour analyzers (red lines) at the Maïdo Observatory on La Réunion, at Point Bénédicte on Amsterdam Island and at the ATMOS shelter of the Concordia station on Dome C in Antarctica. The thick black line indicates the average of duplicate PASs, the thin black lines show the actual values of the duplicates. Missing thin lines indicate that one replicate was lost during analysis or was eliminated as an outlier. The data for DMC were derived with a generic sampling rate, whereas those for RU-MO and AMS used sampling rates adjusted to deployment conditions. Thick and thin red lines designate mean and ± one standard deviation of the Tekran data when averaged over the period of PAS deployment. The arrows designate periods when deployments lasted approximately one, two or three months and when glass jars were or were not used for storage and transport. Numbers refer to consecutive sampling periods. The panels at the bottom display the difference between PAS and Tekran-derived GEM concentrations and report the mean difference (MD) and the mean absolute difference (MAD) for different time periods of sampling. PAS sample 11 at AMS was likely affected by local GEM emissions occurring during vegetation clearing operations in the vicinity of the sampling site. | ||
At AMS, the mean difference (MD) and mean absolute difference (MAD) between the two data sets is −0.03 ng m−3 and 0.22 ng m−3 for the entire period of overlapping measurements. However, there is marked difference in the level of agreement between the earlier measurements (MD = −0.12 ng m−3, MAD 0.28 ng m−3) that suffered from high blank levels and poor precision of the PASs and the latter period of measurements, when the use of glass storage containers and longer deployments greatly improved the quality of the PAS results (MD = −0.04 ng m−3, MAD 0.04 ng m−3, if we disregard the sample AMS-11, when vegetation clearing at the site is suspected to have resulted in contamination of the PAS) (Fig. 1). The PASs deployed at this station between January 2020 and November 2021 gave concentrations that were lower than the Tekran results by a mere 0.04 ng m−3 and showed a similar stable level over time.
The comparison for site DMC in Fig. 1 is based on PAS data that have been calculated with the generic sampling rate. Even though we judged these data to be at best semiquantitative and had to dismiss the possibility to adjust the sampling rate to the extremely low temperatures prevailing at this site, the agreement with the Tekran data is surprisingly good with a MD of +0.08 ng m−3 and a MAD of 0.27 ng m−3. In contrast to the observations at AMS, the level of agreement was the same before and after the adoption of glass storage jars. Tekran measurements indicate that air–snow exchange processes and redox reactions render GEM concentrations at DMC quite variable, reaching levels as high as 4 ng m−3 during austral summer and stabilizing at hemispheric background levels in winter.20 The temporal variability recorded by the two sampling techniques does not agree well with each other. The variability recorded by the PAS does not reflect true variability in the air concentrations of GEM, but is a result of the low reliability of these data, caused by short deployments and high field blank contamination.
The eight consecutive PAS deployments of approximately one month at the Maïdo Observatory gave GEM air concentrations that were higher than the simultaneously recorded Tekran-concentrations by 31 ± 5% (Fig. 1). The eight-months average is 1.15 ng m−3 and 0.84 ng m−3 for PASs and Tekran, respectively. This deviation (MD = MAD = 0.31 ng m−3) is considerably larger than what had been previously observed when PAS-derived concentrations had been compared with the concentrations obtained with co-located Tekran systems. Specifically, the average deviation in the global calibration and evaluation study involving 20 locations with a wide range of climatic circumstances was 8%. The observed MD is also much larger than the precision of the Tekran vapour analyzers, which when operated side by side could show deviations on the order of 10%.7,32,33
Support for the lower concentration values recorded by the Tekran system at Maïdo is provided by measurements elsewhere in the Southern hemisphere. Howard et al.34 reported an average of 0.95 ± 0.12 ng m−3 for two years (2014–2016) in Darwin, Northern Australia, whereas levels in the South of Australia are somewhat lower, averaging around 0.86 ng m−3.7 In the Argentinian Andes, from March 2014 until July 2017, the mean GEM concentration was 0.86 ± 0.16 ng m3; with the highest level in the austral spring (0.95 ± 0.13 ng m−3) and the lowest in the autumn (0.80 ± 0.15 ng m−3).35 An average of 0.89 ± 0.01 ng m−3 measured at Chacaltaya, a high-altitude site in the Bolivian Andes in 2014/15 further lends support to atmospheric background levels of GEM being below 1 ng m−3.36
It is challenging to explain why the PAS-derived data should be too high by ∼30%, as those data passed all of the QA/QC criteria. While blank levels averaging ∼14% of total sequestered amounts and an average replicate precision of ∼11% indicate that the PASs were operating at the limit of their applicability range, all of the data from RU-MO exceeded MDL and PQL (Table 3). The ESI† includes a detailed discussion of whether a number of factors could provide an explanation of the positive bias of the PAS data. These factors included insufficient blank correction, uncertain adjustment to the meteorological conditions prevailing at the Maïdo Observatory, the bias caused by GEM concentrations, temperature and wind speed having synchronised diurnal variability at the sampling site, and the effect of the reduced atmospheric pressure at a sampling site located 2160 m above sea level. None of these factors was judged to be capable of explaining the size of the discrepancy.
We suspect that the positive bias is related to the combination of a short deployment period and very low GEM levels, namely we suspect that sampling rates under such conditions may deviate from those obtained in calibration studies that were longer and/or were conducted at higher concentrations. Zhang and Wania37 described the possibility of a two-stage uptake process in a PAS, when the sampled analyte has a very strong sorption coefficient to the sampling sorbent. In that case, chemical is sorbed to the sorbent surface faster than it diffuses into the sorbent pores. While sorption to the outer surface dominates, diffusion into the pores poses no resistance to uptake, and the sampling rate is determined by the fast sorption rate. As the surface of the sorbent fills up with chemical, the overall uptake kinetics become increasingly dominated by the rate of diffusion into the sorbent, and the sampling rate decreases from its initial value. Consistent with such two-stage uptake, McLagan et al.12 in their initial outdoor calibration study observed a sampling rate that decreased during the first 16 weeks of deployment. This deviation did not notably affect the overall derived sampling rate, because the data points after long deployment periods (several months to one year) strongly controlled the slope of the uptake curve and therefore the reported sampling rate.12 Similarly, the global generic sampling rate derived in McLagan et al.14 and applied in the current study is strongly influenced by long-term deployments lasting between three months and one year.
Using Fig. 2 in McLagan et al.,12 we estimate the initial sampling rate during the first few weeks of the outdoor calibration experiment was around 0.15 m3 day−1 and thus 25% higher than the sampling rate obtained from the entire year long experiment (∼0.12 m3 day−1). We note that the sampling rates displayed in Fig. 2 in McLagan et al.12 are not corrected for temperature. The deployments started in April 8 in Toronto, which implies that during the time period of decreasing sampling rate (the first 15 weeks of deployment), the ambient temperature actually increased, which should have caused sampling rates to increase. The effect thus is of potential importance when sampling for short periods of time at low GEM concentrations and could conceivably be large enough to explain the discrepancy between PASs and Tekran at Maïdo. We note that GEM levels recorded at Piton Bleu (RU-PB) dropped to the concentration range measured with the Tekran analyzer at RU-MO when longer two-months deployment periods were adopted at the end of 2018, whereas the shorter deployments in 2017/18 at RU-PB gave levels in agreement with the passive samplers at RU-MO. Also, three months-long deployments with the commercial MerPAS® conducted at RU-MO from 2020 onwards yielded low GEM concentrations below 1 ng m−3 (unpublished data) and therefore very similar to those recorded by the Tekran analyzer in 2018.
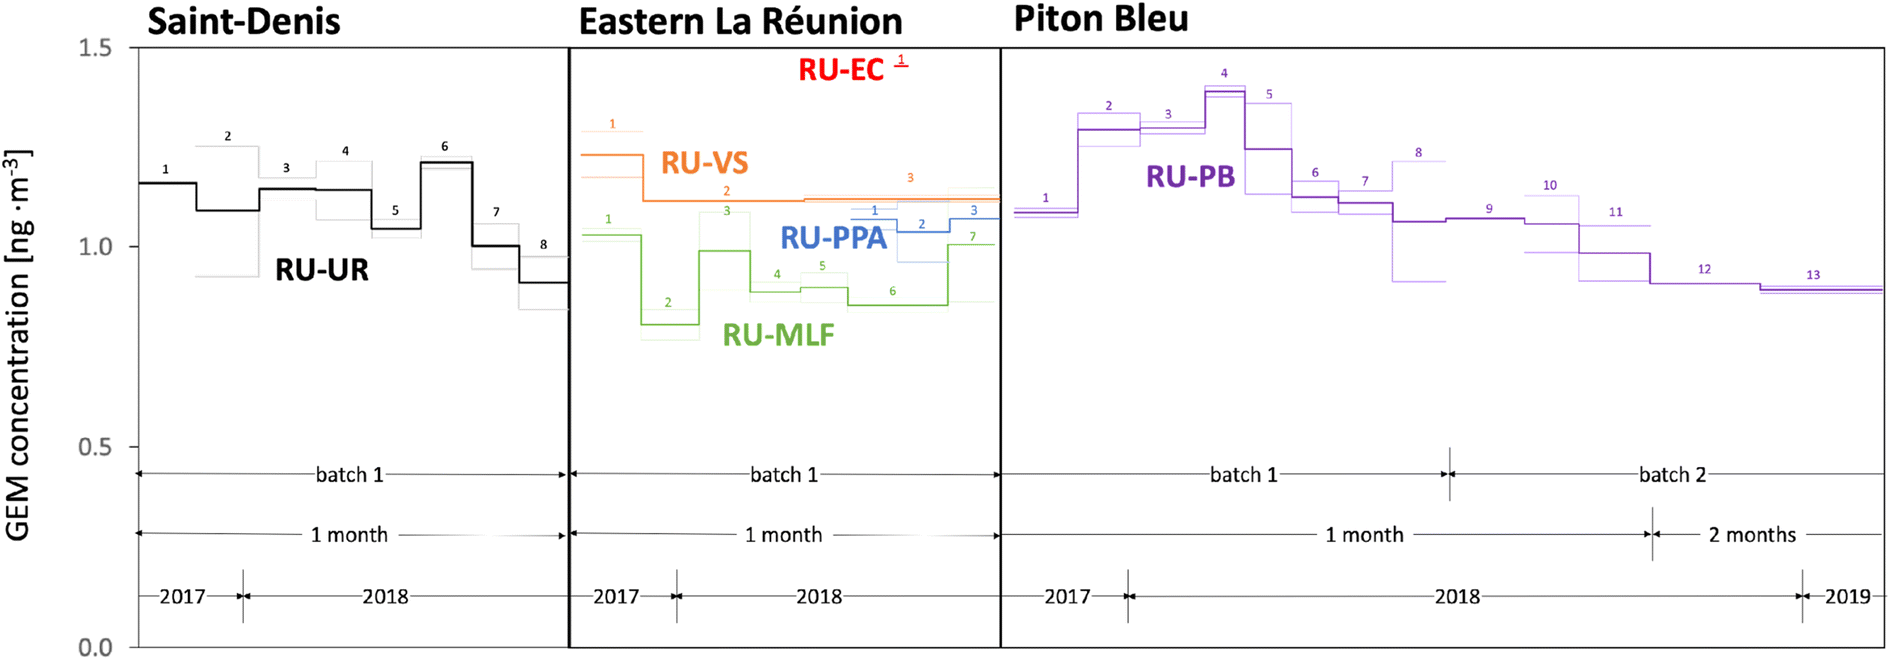 | ||
| Fig. 2 Variability in the passive sampler-derived GEM concentrations at six of the sampling sites on La Réunion (UR, MLF, PPA, VS, PB, EC). Data for the seventh sampling site at the Maïdo Observatory are shown in Fig. 1. Thick lines indicate the average of duplicate samplers, the thin lines show the actual values of the duplicates. Missing thin lines indicate that one replicate was lost during analysis or was eliminated as an outlier. The arrows designate periods when deployments lasted approximately one or two months and when different sampler batches were deployed. Numbers refer to consecutive sampling periods. | ||
Irrespective of the deviating absolute levels, we can compare the month-to-month variability in the GEM concentrations at Maïdo as observed by the Tekran and the PASs (Fig. 1). Some similarities are apparent, specifically higher than average levels during deployments 1 (November), 7 and 8 (May and June) and lower than average levels during deployments 4, 5 and 6 (February to April, i.e., Austral autumn). Only for deployments 2 and 3, are there clear discrepancies between the two sampling approaches. Higher GEM levels during Austral winter may be related to emission from biomass burning in Southern Africa, with long-range transport to the Maïdo Observatory in the lower free troposphere. In other words, despite the positive bias of the PAS deployed at RU-MO, the technique may be able to capture some of the seasonal GEM concentration variability.
Variability in GEM air concentrations on La Réunion
Fig. 2 displays the GEM concentrations derived from the PAS deployed at six of the sites on La Réunion as a function of time. The temporal variability in the PAS-derived air concentrations on La Réunion is small and no consistent seasonal pattern emerges when comparing the trends at the different sites. Piton Bleu potentially had higher GEM levels in the summer of 2017/18 (samples 2 to 5) (Fig. 2), whereas the opposite appears to have been the case at the Maïdo Observatory (Fig. 1). The spatial variability of GEM levels on the island is also generally small. When disregarding sites EC and MLF, the standard deviation in the average levels at UR, MO, VS, PB, and PPA is only 6.5%, which is likely smaller than the uncertainty in these values, when judged based on duplicate precision. The one sample at the eruptive cone (EC) may have recorded slightly higher concentrations than the rest of the island, but this value is highly uncertain because of the extremely short sampling time. Interestingly, the levels in the forest at MLF were consistently lower than elsewhere on the island and MLF stands out as the only densely vegetated site. One possible explanation is efficient uptake of GEM in vegetation.38 The forest at MLF has been found to be a net sink for methane and nitrous oxide39 and the PAS has been shown to be able to decipher the seasonal concentration differences caused by uptake in forest vegetation.28,29Discussion
One of the objectives of this research project was to delineate the realm of what is possible in terms of monitoring GEM with PASs. It has to be concluded that the recording of atmospheric GEM levels under the conditions prevailing on the Antarctic Plateau appears presently not feasible with PASs for a combination of reasons:- The logistics of bringing samplers to and from such a remote sampling site are too complex to completely exclude the possibility of sampler contamination. Along their convoluted shipping routes, the samplers will encounter too many environments (planes, ships, trucks, storage places, etc.) with unknown, but possibly quite high GEM levels (e.g., ref. 30). While we were partially successful in reducing field blank contamination, e.g., be placing samplers in individual glass jars, even this measure proved insufficient in the case of the Concordia station deployments. It is conceivable that container seals may have failed when samplers were exposed to very low temperatures during transit to and from DMC.
- The sampling rate of the PASs at the extremely low temperatures of the plateau is presently unknown and the extrapolation of the temperature dependence of the sampling rate determined at higher temperatures to −40 to −60 °C does not appear to be defensible.
- During several deployments at DMC, hoar frost was observed to form on the PASs, potentially obstructing the air flow into the sampler housing (see photographs in Fig. S14†). On occasion, the extremely low temperatures caused the Radiello diffusive barriers to break apart (Fig. S14†). Such occurrences will have unquantifiable effects on the sampling rate of the PAS.
The deployments on Amsterdam Island, on the other hand, suggest that under more temperate weather conditions, reliable passive air sampling for GEM in the remote atmosphere is possible. Placing individual samplers in well-sealed glass jars during the entire shipping and storage process succeeded in lowering field blank contamination to acceptable levels. Relatively long deployment periods of two months and more meant that blank correction was small and replicate precision very good, despite the very low atmospheric GEM levels in the remote southern hemisphere (see AMS samples 12 to 19). Also, the absolute GEM levels were in excellent agreement with those recorded with the state-of-the art active sampling technique, even though the high winds required an adjustment of the sampling rate to local conditions.
The one-month long deployments on La Réunion likely define more or less the limits of passive air sampling in the remote atmosphere. With reasonably low field blank levels, the required blank adjustment was minor, but not insignificant (∼15%), causing somewhat poorer replicate precision (∼11%) than has been observed for this sampler under more favorable conditions (e.g., ref. 15). We suspect that the short deployment periods in combination with low atmospheric GEM levels led to a positive bias in the GEM levels obtained from those deployment, likely related to faster uptake at the very beginning of a deployment.
In conclusion, when using PASs for recording GEM concentrations at very low background concentrations, (i) great emphasis has to be placed on keeping sampler contamination during transport and storage low and consistent, possibly requiring additional sealed containers for each sampler, (ii) a large number of field blank samples undergoing the same transport and storage as exposed samplers will be required to reliably determine extent and variability in the contamination of those exposed samples, and (iii) sampling times need to be sufficiently long to assure uptake of mercury amounts in exposed samplers that significantly exceed the levels found in field blanks and the impact of potentially faster uptake during the initial deployment phase is minimized. The experience of the current study suggests that deployment times in the remote southern hemisphere should be at least 2 to 3 months.
Research gaps identified in the current study include the need to observe and quantify any potential short-term decrease in the uptake kinetics of the PAS during the initial phases of deployment, as the rate-limiting step possibly transitions from sorption to the activated carbon surface to diffusion into the pores of the carbon. Also, further characterisation of the sampling rate at low sub-zero temperatures will be required for confident application of the PAS in polar and high-altitude regions.
Data availability
Maïdo (https://doi.org/10.25326/352), AMS (https://doi.org/10.25326/168) and DMC (https://doi.org/10.25326/348) L2 GEM data, are freely available40–42 at https://gmos.aeris-data.fr/from a GMOS-FR data portal coordinated by IGE (Institut des Géosciences de l’Environnement—Grenoble, France; technical PI: Olivier Magand) with the support of the French national AERIS-SEDOO partners, data and services center for the atmosphere (last access: 11 August 2022). All of the passive air sampling data are provided in the ESI File.†Conflicts of interest
The authors declare the following competing financial interest(s): the sampler used in the present study has been commercialized as MerPAS® under a licensing agreement between the University of Toronto and Tekran Instruments Corp. A fraction of the licensing fees to the University of Toronto is distributed to F. W.Acknowledgements
Funding from the joint research project program of the Centre national de la recherche scientifique (CNRS) and the University of Toronto and an undergraduate student summer internship from the Centre for Global Change Science of the University of Toronto is gratefully acknowledged. This work was further supported by the project Global Mercury Observation System (GMOS; https://www.gmos.eu/) of the European Union Seventh Framework Programme with funding by the European Commission – H2020, the ERA-PLANET programme (https://www.era-planet.eu) (Contract. No. 689443) within the IGOSP project and LEFE program (CNRS-INSU). Logistical and financial support for work at AMS and DMC has been provided by the GMOstral-1028 program of the Institut polaire français Paul-Émile Victor (IPEV). The Observatoire de Physique de l'Atmosphère à La Réunion is funded by CNRS-INSU and the Université de La Réunion and managed by the Observatoire des Sciences de l'Univers à La Réunion (UMS 3365). The authors also acknowledge the Institut des Sciences de l'Environnement (IGE, UMR 5001/UR 252) for internal funding. The Tekran 2537 systems used in this study are coordinated by the IGE-PTICHA technical platform dedicated to atmospheric chemistry field instrumentation. Finally, the GMOS-FR national data portal is maintained by the French National Center for Atmospheric Data and Services (AERIS). We would like to thank Elisabeth Logeais, Laura Noel, Julien Moye, Ines Ollivier, Pierre Staménoff, and Jean-Marc Metzger for their support in the collection and deployment of the passive samplers.References
- T. W. Clarkson and L. Magos, The toxicology of mercury and its chemical compounds, Crit. Rev. Toxicol., 2006, 36, 609–662 CrossRef PubMed.
- J. Munthe, R. A. Bodaly, B. A. Branfireun, C. T Driscoll, C. C Gilmour, R. Harris, M. Horvat, M. Lucotte and O. Malm, Recovery of mercury-contaminated fisheries, Ambio, 2007, 36, 33–44 CrossRef.
- P. Grandjean, H. Satoh, K. Murata and K. Eto, Adverse effects of methylmercury: Environmental health research implications, Environ. Health Perspect., 2010, 118, 1137–1145 CrossRef PubMed.
- M. S. Bank, The mercury science-policy interface: history, evolution and progress of the Minamata Convention, Sci. Total Environ., 2020, 722, 137832 CrossRef.
- B. Gworek, W. Dmuchowski and A. H. Baczewska-Dabrowska, Mercury in the terrestrial environment: a review, Environ. Sci. Eur., 2020, 32, 128 CrossRef.
- H. Angot, M. Barret, O. Magand, M. Ramonet and A. Dommergue, A 2-year record of atmospheric mercury species at a background Southern Hemisphere station on Amsterdam Island, Atmos. Chem. Phys., 2014, 14, 11461–11473 CrossRef.
- F. Slemr, H. Angot, A. Dommergue, O. Magand, M. Barret, A. Weigelt, R. Ebinghaus, E.-G. Brunke, K. A. Pfaffhuber and G. Edwards, Comparison of mercury concentrations measured at several sites in the Southern Hemisphere, Atmos. Chem. Phys., 2015, 15, 3125–3133 CrossRef CAS.
- F. Sprovieri, N. Pirrone, M. Bencardino, F. D'Amore, F. Carbone, S. Cinnirella, V. Mannarino, M. Landis, R. Ebinghaus, A. Weigelt, E.-G. Brunke, C. Labuschagne, L. Martin, J. Munthe, I. Wangberg, P. Artaxo, F. Morais, H.-M. J. Barbosa, J. Brito, W. Cairns, C. Barbante, M. D. C. Dieguez, E. Garcia, A. Dommergue, H. Angot, O. Magand, H. Skov, M. Horvat, J. Kotnik, K. A. Read, L. M. Neves, B. M. Gawlik, F. Sena, N. Mashyanov, V. A. Obolkin, D. Wip, X. B. Feng, H. Zhang, X. Fu, R. Ramachandran, D. Cossa, J. Knoery, N. Marusczak, M. Nerentorp and C. Norstrom, Atmospheric mercury concentrations observed at ground-based monitoring sites globally distributed in the framework of the GMOS network, Atmos. Chem. Phys., 2016, 16, 11915–11935 CrossRef CAS PubMed.
- H. Angot, O. Magand, D. Helmig, P. Ricaud, P. Quennehen, H. Gallée, M. Del Guasta, F. Sprovieri, N. Pirrone, J. Savarino and A. Dommergue, New insights into the atmospheric mercury cycling in Central Antarctica and implications at a continental scale, Atmos. Chem. Phys., 2016b, 16, 8249–8264 Search PubMed.
- H. Angot, I. Dion, N. Vogel, M. Legrand, O. Magand and A. Dommergue, Multi-year record of atmospheric mercury at Dumont d'Urville, East Antarctic coast: Continental outflow and oceanic influences, Atmos. Chem. Phys., 2016a, 16, 8265–8279 Search PubMed.
- F. Slemr, L. Martin, C. Labuschagne, T. Mkololo, H. Angot, O. Magand, A. Dommergue, P. Garat, M. Ramonet and J. Bieser, Atmospheric mercury in the Southern Hemisphere – Part 1: Trend and inter-annual variations in atmospheric mercury at Cape Point, South Africa, in 2007–2017, and on Amsterdam Island in 2012–2017, Atmos. Chem. Phys., 2020, 20, 7683–7692 CrossRef CAS.
- D. S. McLagan, C. P. J. Mitchell, H. Huang, Y. D. Lei, A. S. Cole, A. Steffen, H. Hung and F. Wania, A high precision passive air sampler for gaseous mercury, Environ. Sci. Technol. Lett., 2016, 3, 24–29 CrossRef CAS.
- D. S. McLagan, C. P. J. Mitchell, H. Huang, B. Abdul Hussain, Y. D. Lei and F. Wania, The effects of meteorological parameters and diffusive barrier reuse on the sampling rate of a passive air sampler for gaseous mercury, Atmos. Meas. Tech., 2017a, 10, 3651–3660 Search PubMed.
- D. S. McLagan, C. P. J. Mitchell, A. Steffen, H. Hung, C. Shin, G. W. Stupple, M. L. Olson, W. T. Luke, P. Kelley, D. Howard, G. C. Edwards, P. F. Nelson, H. Xiao, G.-R. Sheu, A. Dreyer, H. Huang, B. Abdul Hussain, Y. D. Lei, I. Tavchunsky and F. Wania, Global evaluation and calibration of a passive air sampler for gaseous mercury, Atmos. Chem. Phys., 2018b, 18, 5905–5919 Search PubMed.
- A. Naccarato, A. Tassone, M. Martino, S. Moretti, A. Macagnano, E. Zampetti, P. Papa, J. Avossa, N. Pirrone, M. Nerentorp, J. Munthe, I. Wangberg, G. W. Stupple, C. P. J. Mitchell, A. R. Martin, A. Steffen, D. Babi, E. M. Prestbo, F. Sprovieri and F. Wania, A field intercomparison of three passive air samplers for gaseous mercury in ambient air, Atmos. Meas. Tech., 2021, 14, 3657–3672 CrossRef CAS.
- E. Aristidi, K. Agabi, M. Azouit, E. Fossat, J. Vernin, T. Travouillon, J. S. Lawrence, C. Meyer, J. W. V. Storey, B. Halter, W. L. Roth and V. Walden, An analysis of temperatures and wind speed above Dome C, Antarctica, Astron. Astrophys., 2005, 430, 739–745 CrossRef.
- I. Pietroni, S. Argentini, I. Petenko and R. Sozzi, Measurements and parametrizations of the atmospheric boundary-layer height at Dome C, Antarctica, Boundary-Layer Meteorol., 2012, 143, 189–206 CrossRef.
- J. L. Baray, Y. Courcoux, P. Keckhut, T. Portafaix and P. Tulet, et al., Maïdo observatory: a new high-altitude station facility at Reunion Island (21° S, 55° E) for long-term atmospheric remote sensing and in situ measurements, Atmos. Meas. Tech., 2013, 6, 2865–2877 CrossRef.
- M. A. Snow, M. Feigis, Y. D. Lei, C. P. J. Mitchell and F. Wania, Development, characterization, and testing of a personal passive sampler for measuring inhalation exposure to gaseous elemental mercury, Environ. Int., 2021a, 146, 106264 Search PubMed.
- W. R. L. Cairns, C. Turetta, N. Maffezzoli, O. Magand, B. Ferreira Araujo, H. Angot, D. Segato, P. Cristofanelli, F. Sprovieri, C. Scarchilli, P. Grigioni, V. Ciardini, C. Barbante, A. Dommergue and A. Spolaor, Mercury in precipitated and surface snow at Dome C and a first estimate of mercury depositional fluxes during the Austral summer on the high Antarctic plateau, Atmos. Environ., 2021, 262, 118634 CrossRef.
- USEPA: Method 7473: Mercury in solids and solutions by thermal decomposition, amalgamation, and atomic absorption spectrophotometry, United States Environmental Protection Agency, Washington, 2007, p. 17, https://www.epa.gov/sites/default/files/2015-12/documents/7473.pdf Search PubMed.
- D. S. McLagan, H. Huang, Y. D. Lei, F. Wania and C. P. J. Mitchell, Application of sodium carbonate prevents sulphur poisoning of catalysts in automated total mercury analysis, Spectrochim. Acta, Part B, 2017b, 133, 60–62 Search PubMed.
- A. M. Koenig, O. Magand, B. Verreyken, J. Brioude, C. Amelynck, N. Schoon, A. Colomb, B. Ferreira Araujo, M. Ramonet, M. Kumar Sha, J.-P. Cammas, J. E. Sonke, A. Dommergue. Mercury in the free troposphere and bidirectional atmosphere-vegetation exchanges – Insights from Maïdo Mountain Observatory in the Southern Hemisphere tropics, 2022, EGUsphere [preprint], DOI:10.5194/egusphere-2022-903.
- J. Munthe, F. Sprovieri, M. Horvat and R. Ebinghaus. SOPs and QA/QC protocols regarding measurements of TGM, GEM, RGM, TPM and mercury in precipitation in cooperation with WP3, WP4, and WP5, GMOS deliverable 6.1, CNR-IIA, IVL, 2011, available at: https://www.gmos.eu, (23 October 2020).
- F. D'Amore, M. Bencardino, S. Cinnirella, F. Sprovieri and N. Pirrone, Data quality through a web-based QA/QC system: implementation for atmospheric mercury data from the global mercury observation system, Environ. Sci.: Processes Impacts, 2015, 17, 1482–1491 RSC.
- D. S. McLagan, B. Abdul Hussain, H. Huang, Y. D. Lei, F. Wania and C. P. J. Mitchell, Identifying and evaluating urban mercury emission sources through passive sampler-based mapping of atmospheric concentrations, Environ. Res. Lett., 2018a, 13, 074008 Search PubMed.
- M. A. Snow, G. Darko, O. Gyamfi, E. Ansah, K. Breivik, C. Hoang, Y. D. Lei and F. Wania, Characterization of inhalation exposure to gaseous elemental mercury during artisanal gold mining and e-waste recycling through combined stationary and personal passive sampling, Environ. Sci.: Processes Impacts, 2021b, 23, 569–579 Search PubMed.
- M. I. Quant, M. Feigis, S. Mistry, Y. D. Lei, C. P. J. Mitchell, R. Staebler, A. Di Guardo, E. Terzaghi and F. Wania, Using passive air samplers to quantify vertical gaseous elemental mercury concentration gradients within a forest and above soil, J. Geophys. Res.: Atmos., 2021, 126, e2021JD034981 Search PubMed.
- D. S. McLagan, F. Monaci, H. Huang, Y. D. Lei, C. P. J. Mitchell and F. Wania, Characterization and quantification of atmospheric mercury sources using passive air samplers, J. Geophys. Res.: Atmos., 2019, 124, 2351–2362 CrossRef.
- M. Si, D. S. McLagan, A. Mazot, N. Szponar, B. Bergquist, Y. D. Lei, C. P. J. Mitchell and F. Wania, Measurement of atmospheric mercury over volcanic and fumarolic regions on the North Island of New Zealand using passive air samplers, ACS Space Earth Chem, 2020, 4, 2435–2443 CrossRef CAS.
- J. H. Won, J. Y. Park and T. G. Lee, Mercury emissions from automobiles using gasoline, diesel, and LPG, Atmos. Environ., 2007, 41, 7547–7552 CrossRef.
- C. Temme, P. Blanchard, A. Steffen, C. Banic, S. Beauchamp, L. Poissant, R. Tordon and B. Wiens, Trend, seasonal and multivariate analysis study of total gaseous mercury data from the Canadian atmospheric mercury measurement network (CAMNet), Atmos. Environ., 2007, 41, 5423–5441 CrossRef.
- K. Aspmo, P.-A. Gauchard, A. Steffen, C. Temme, T. Berg, E. Bahlmann, C. Banic, A. Dommergue, R. Ebinghaus and C. Ferrari, Measurements of atmospheric mercury species during an international study of mercury depletion events at Ny-Ålesund, Svalbard, spring 2003. How reproducible are our present methods?, Atmos. Environ., 2005, 39, 7607–7619 CrossRef.
- D. Howard, P. F. Nelson, G. C. Edwards, A. L. Morrison, J. A. Fisher, J. Ward, J. Harnwell, M. van der Schoot, B. Atkinson, S. D. Chambers, A. D. Griffiths, S. Werczynski and A. G. Williams, Atmospheric mercury in the Southern Hemisphere tropics: seasonal and diurnal variations and influence of inter-hemispheric transport, Atmos. Chem. Phys., 2017, 17, 11623–11636 CrossRef.
- M. C. Diéguez, M. Bencardino, P. E. García, F. D'Amore, J. Castagna, F. De Simone, C. Soto Cárdenas, S. Ribeiro Guevara, N. Pirrone and F. Sprovieri, A multi-year record of atmospheric mercury species at a background mountain station in Andean Patagonia (Argentina): temporal trends and meteorological influence, Atmos. Environ., 2019, 214, 116819 CrossRef.
- A. M. Koenig, O. Magand, P. Laj, M. Andrade, I. Moreno, F. Velarde, G. Salvatierra, R. Gutierrez, L. Blacutt, D. Aliaga, T. Reichler, K. Sellegri, O. Laurent, M. Ramonet and A. Dommergue, Seasonal patterns of atmospheric mercury in tropical South America as inferred by a continuous total gaseous mercury record at Chacaltaya station (5240 m) in Bolivia, Atmos. Chem. Phys., 2021, 21, 3447–3472 CrossRef CAS.
- X. M. Zhang and F. Wania, Modeling the uptake of semi-volatile organic compounds by passive air samplers: Importance of mass transfer processes within the porous sampling media, Environ. Sci. Technol., 2012, 46, 9563–9570 CrossRef CAS PubMed.
- M. Jiskra, J. E. Sonke, D. Obrist, J. Bieser, R. Ebinghaus, C. Lund Myhre, K. Aspmo Pfaffhuber, I. Wängberg, K. Kyllönen, D. Worthy, L. G. Martin, C. Labuschagne, T. Mkololo, M. Ramonet, O. Magand and A. Dommergue, A vegetation control on seasonal variations in global atmospheric mercury concentrations, Nat. Geosci., 2018, 11, 244–250 CrossRef CAS.
- K. Machacova, L. Borak, T. Agyei, T. Schindler, K. Soosaar, Ü. Mander and C. Ah-Peng, Trees as net sinks for methane (CH4) and nitrous oxide (N2O) in the lowland tropical rain forest on volcanic Réunion Island, New Phytol., 2020, 229, 1983–1994 CrossRef PubMed.
- O. Magand and A. Dommergue, Continuous Measurements of Atmospheric Mercury at Amsterdam Island (L2). [Dataset]. 2021, Aeris. https://doi.org/10.25326/168 Search PubMed.
- O. Magand and A. Dommergue, Continuous Measurements of Atmospheric Mercury at Dome Concordia (L2), [Dataset], 2022a, Aeris, https://doi.org/10.25326/348 Search PubMed.
- O. Magand and A. Dommergue, Continuous Measurements of Atmospheric Mercury at Maido Observatory (L2), [Dataset], 2022b, Aeris, https://doi.org/10.25326/352 Search PubMed.
Footnotes |
| † Electronic supplementary information (ESI) available: It includes maps, photographs of the sampling sites, a discussion of potential factors affecting the agreement between actively and passively determined GEM concentrations and tables with detailed analytical data on all samples. See DOI: https://doi.org/10.1039/d2ea00119e |
| ‡ Current address: Laboratoire de Géologie de Lyon: Terre, Planètes, Environnement, CNRS, UMR 5276, Ecole Normale Supérieure de Lyon, Université de Lyon, Université Claude Bernard Lyon 1, Villeurbanne, France. |
| This journal is © The Royal Society of Chemistry 2023 |