
 Open Access Article
 This Open Access Article is licensed under a Creative Commons Attribution-Non Commercial 3.0 Unported Licence
9-Borafluoren-9-yl and diphenylboron tetracoordinate complexes of F- and Cl-substituted 8-quinolinolato ligands: synthesis, molecular and electronic structures, fluorescence and application in OLED devices†
Carina B.
Fialho
 a,
Tiago F. C.
Cruz
a,
Ana I.
Rodrigues
a,
Maria José
Calhorda
b,
Luís F.
Vieira Ferreira
c,
Piotr
Pander
def,
Fernando B.
Dias
f,
Jorge
Morgado
gh,
António L.
Maçanita
a and
Pedro T.
Gomes
*a
a,
Tiago F. C.
Cruz
a,
Ana I.
Rodrigues
a,
Maria José
Calhorda
b,
Luís F.
Vieira Ferreira
c,
Piotr
Pander
def,
Fernando B.
Dias
f,
Jorge
Morgado
gh,
António L.
Maçanita
a and
Pedro T.
Gomes
*a
aCentro de Química Estrutural, Departamento de Engenharia Química, Instituto Superior Técnico, Universidade de Lisboa, Av. Rovisco Pais, 1049-001 Lisboa, Portugal. E-mail: pedro.t.gomes@tecnico.ulisboa.pt
bBioISI – Instituto de Biossistemas e Ciências Integrativas, Departamento de Química e Bioquímica, Faculdade de Ciências, Universidade de Lisboa, Campo Grande, 1749-016 Lisboa, Portugal
cBSIRG – Biospectroscopy and Interfaces Research Group, IBB-Institute for Bioengineering and Biosciences, Instituto SuperiorTécnico, Universidade de Lisboa, 1049-001 Lisboa, Portugal
dFaculty of Chemistry, Silesian University of Technology, Strzody 9, 44-100 Gliwice, Poland
eCentre for Organic and Nanohybrid Electronics, Silesian University of Technology, Konarskiego 22B, 44-100 Gliwice, Poland
fDepartment of Physics, Durham University, South Road, Durham, DH1 3LE, UK
gInstituto de Telecomunicações, Av. Rovisco Pais, 1049-001 Lisboa, Portugal
hDepartment of Bioengineering, Instituto Superior Técnico, Universidade de Lisboa, Av. Rovisco Pais, 1049-001 Lisboa, Portugal
First published on 10th March 2023
Abstract
Six new four-coordinate tetrahedral boron complexes, containing 9-borafluoren-9-yl and diphenylboron cores attached to orthogonal fluorine- and chlorine-substituted 8-quinolinolato ligand chromophores, have been synthesised, characterised, and applied as emitters in organic light-emitting diodes (OLEDs). An extensive steady-state and time-resolved photophysical study, in solution and in the solid state, resulted in the first-time report of delayed fluorescence (DF) in solid films of 8-quinolinolato boron complexes. The DF intensity dependence on excitation dose suggests that this emission originates from triplet–triplet annihilation (TTA). Density functional theory (DFT) and time-dependent density functional theory (TDDFT) studies give insight into the ground and excited state geometries, electronic structures, absorption energies, and singlet–triplet gaps in these new organoboron luminophores. Finally, given their highly luminescent behaviour, organic light-emitting diode (OLED) devices were produced using the synthesised organoboron compounds as emissive fluorescent dopants. The best OLED displays green-blue (λmaxEL = 489 nm) electroluminescence with an external quantum efficiency (EQE) of 3.3% and a maximum luminance of 6300 cd m−2.
Introduction
Organic light-emitting diodes (OLEDs) are bound by the spin statistics governing charge carrier recombination: only 25% of the created excited states are singlets while the remaining 75% are triplets. In order to overcome the limit imposed by the formation of only 25% singlet excitons upon charge recombination, new strategies involving phosphorescent materials containing iridium and platinum complexes have been explored to allow harvesting of the remaining 75% triplet excitons lost in the electroluminescence process.1 To this end, the heavy atom effect facilitates intersystem crossing (ISC) via a spin–orbit coupling mechanism, thus enabling the use of both singlet and triplet states in emission at room temperature (∼100% light emission efficiency). However, relying on emitters containing precious third-row transition-metals may create additional environmental challenges and additional production costs, particularly in industries that may need these materials in large quantities, such as in the display and illumination sectors. Therefore, alternative triplet-harvesting emitters are highly desired, such as those containing Earth-abundant metal complexes or those that are fully metal-free luminophores.2Other strategies to harvest both triplet and singlet states involve triplet up-conversion mechanisms to generate delayed fluorescence (DF). This type of emission combines the contribution of both singlet and triplet states. The contribution of triplet states is characterised by the observation of fluorescence lifetimes longer than those of prompt fluorescence (PF), which purely originates from singlet states.3 There are two main types of up-conversion mechanisms that can result in DF: triplet–triplet annihilation (TTA) and thermally activated delayed fluorescence (TADF).4 The first route, TTA, occurs predominantly in materials with larger singlet–triplet energy gaps, and is mostly observed in concentrated solutions or at low temperatures when aggregates are formed upon cooling. TTA is also often observed in the condensed phase, where conditions to promote collisions between two triplet species are favoured. In simple terms, these collisions result in the formation of one singlet excited state (S1) and one singlet ground state (S0) from two interacting triplet states (T1): T1 + T1 → S1 + S0. The resultant emissive S1 state decays radiatively to S0, generating delayed fluorescence. The simple balance of two T1 states for one S1 emissive state results in the maximum theoretical internal quantum efficiency (IQE) of TTA-based OLEDs of 25 + ½ × 75 = 62.5%.5 An alternative to TTA is the aforementioned TADF, which relies on a small S1–T1 gap, ΔEST, usually ≤0.2 eV, enabling efficient triplet harvesting by reverse intersystem crossing (RISC), and a maximum theoretical IQE of TADF-based OLEDs of 100%.4b Such a small ΔEST can be achieved by reducing the spatial overlap between the HOMO and LUMO, for example through a popular near-orthogonal donor–acceptor molecular design.6
This geometrical requirement can be intrinsically accomplished in neutral tetra-coordinated boron complexes containing monoanionic chelating chromophores, which exhibit tetrahedral geometries about the boron atom. In fact, growing interest in these types of complexes has been recently observed, with numerous luminescent four-coordinate boron complexes being reported in the literature.7 This appeal is in part due to the low cost and Earth-abundant nature of boron, and to the potential applications of its derivatives, namely in OLEDs. In general, these complexes have the LUMO mostly localised on their π-conjugated chelating ligand, whereas the HOMO may be localised either on the chelating ligand or on the R ancillary ligands (e.g. aryls, alkyls, halides) depending on their nature. Their luminescence properties arise from intra-ligand π–π* electronic transitions and/or charge transfer transitions from the R groups to the orthogonal chelating chromophore. The emission colours can be generally tuned through structural variations on the chelating ligand or R groups, thus affecting the HOMO–LUMO gaps. The observation of DF properties in four-coordinate boron complexes has been relatively rare, including only a restricted number of highly fluorescent complexes exhibiting TADF,8,9 and an even scarcer number of fluorescent BODIPY derivatives displaying TTA-based delayed fluorescence.10
The 8-quinolinolato scaffold has been previously reported with boron complexes, with the very first examples being presented back in 1961 by Douglass,11 later in 2000 by S. Wang et al.,12 and in 2006 by Slugovc and co-workers.13 In these studies, boron-bis(aryl) and boron-(phenyl)(alkyl) derivatives (A and B, Chart 1) were synthesised and their photo- and electroluminescence properties were studied, although DF was not reported. Several authors have also synthesised 8-quinolinolato boron compounds using various boron ancillary ligands, namely by incorporating boron-bis(ethyl) (C),12 substituted -bis(phenyl) (D)14 and -bis(thienyl)15 (E), and 9,10-dihydro-9,10-diboraanthracen-9,10-diyl (F)16 groups, and presented their detailed luminescence studies. However, these experiments recorded in solution have only shown conventional fluorescence. Recently, in the course of this work, Urban, Durka, and co-workers synthesised boron complexes containing the 8-quinolinolato chelating ligand coordinated to the rigid and π-locked 9-borafluoren-9-yl synthon (G), also describing their respective structural and photophysical properties.17 Similarly to the above-mentioned efforts, DF was not reported.
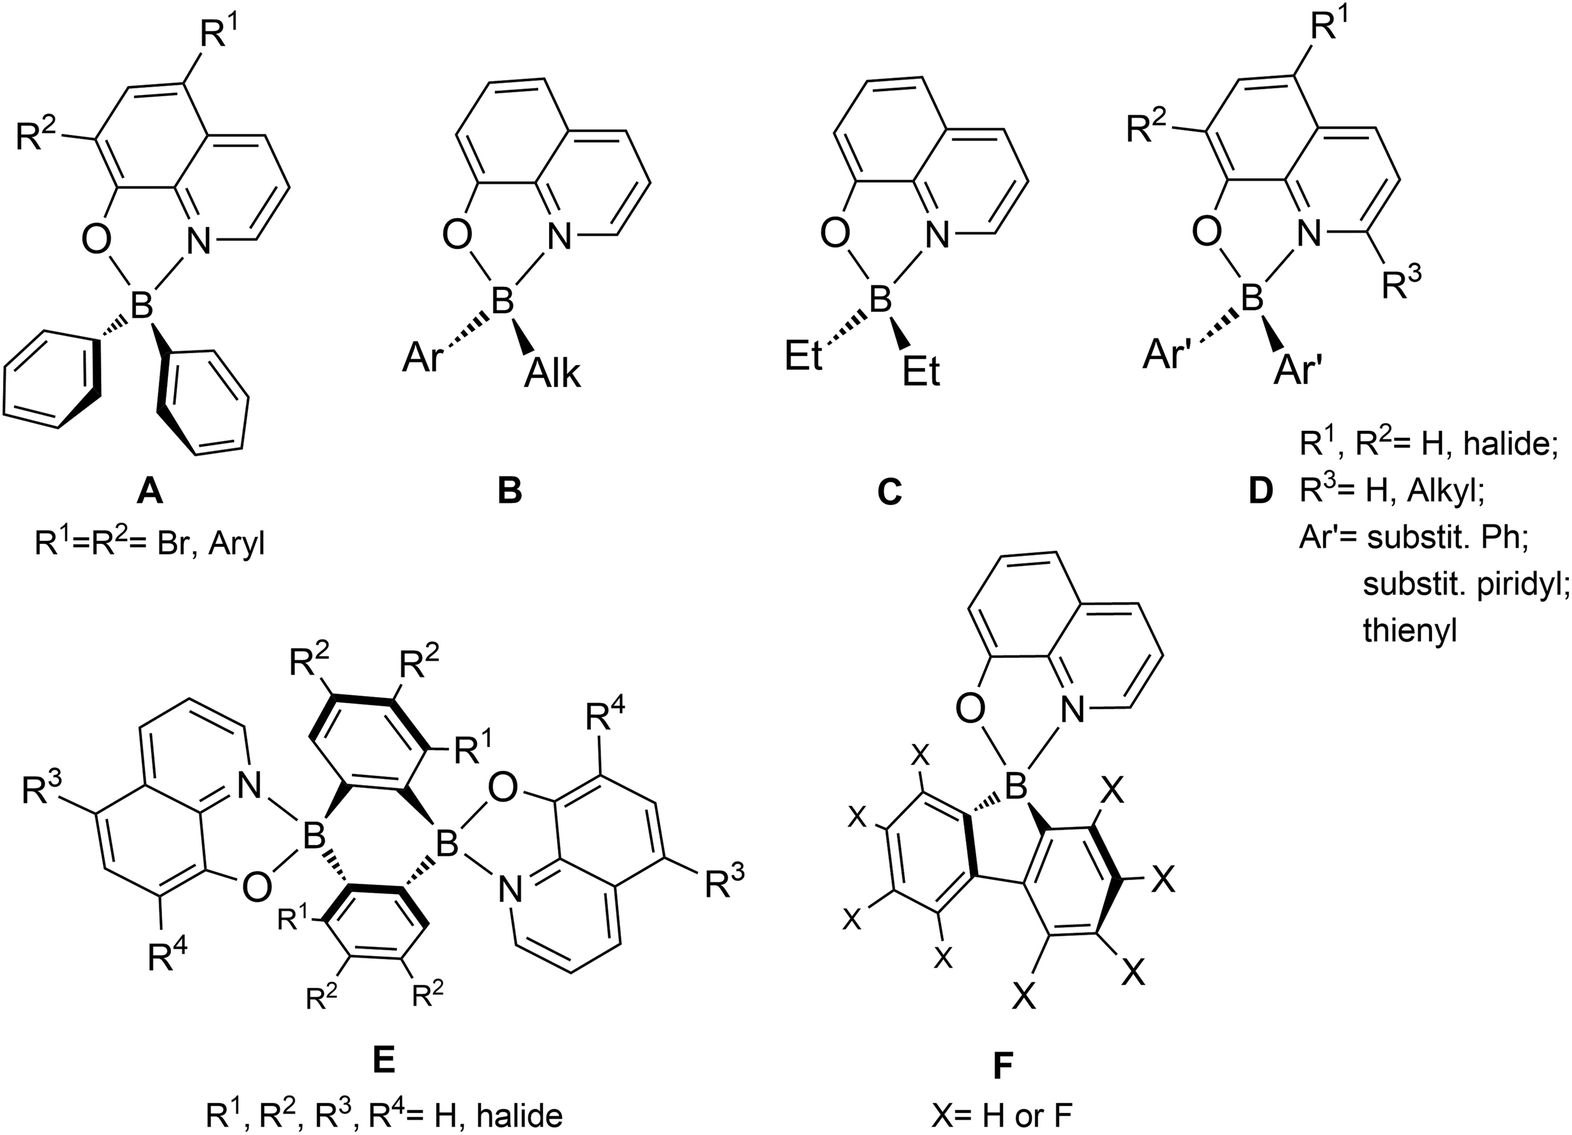 | ||
| Chart 1 Types of 8-quinolinolato boron complexes reported in the literature. | ||
In the present work, we report the synthesis and structural characterisation of a group of new four-coordinate 9-borafluoren-9-yl and diphenylboron fluorescent complexes containing nearly perpendicular 5-fluoro-, 5-chloro- and 5,7-dichloro-8-quinolinolato monoanionic chelating ligands (see Scheme 1) with the aim of altering the electronic nature of the latter fragment, thus evaluating the possibilities of emission colour tuning in these types of compounds. A comparative study of their solution and solid state photophysical features, carried out in steady-state and time-resolved modes, demonstrates delayed fluorescence in the solid state, for the first time in this class of 8-quinolinolato boron complexes. Density functional theory (DFT) and time-dependent density functional theory (TDDFT) studies have been performed to obtain insight into the photoluminescence properties of these new emitters, including the effect of electronegative substituents. Finally, we demonstrate the effective use of our organoboron luminophores in OLEDs with green-blue and green electroluminescence.
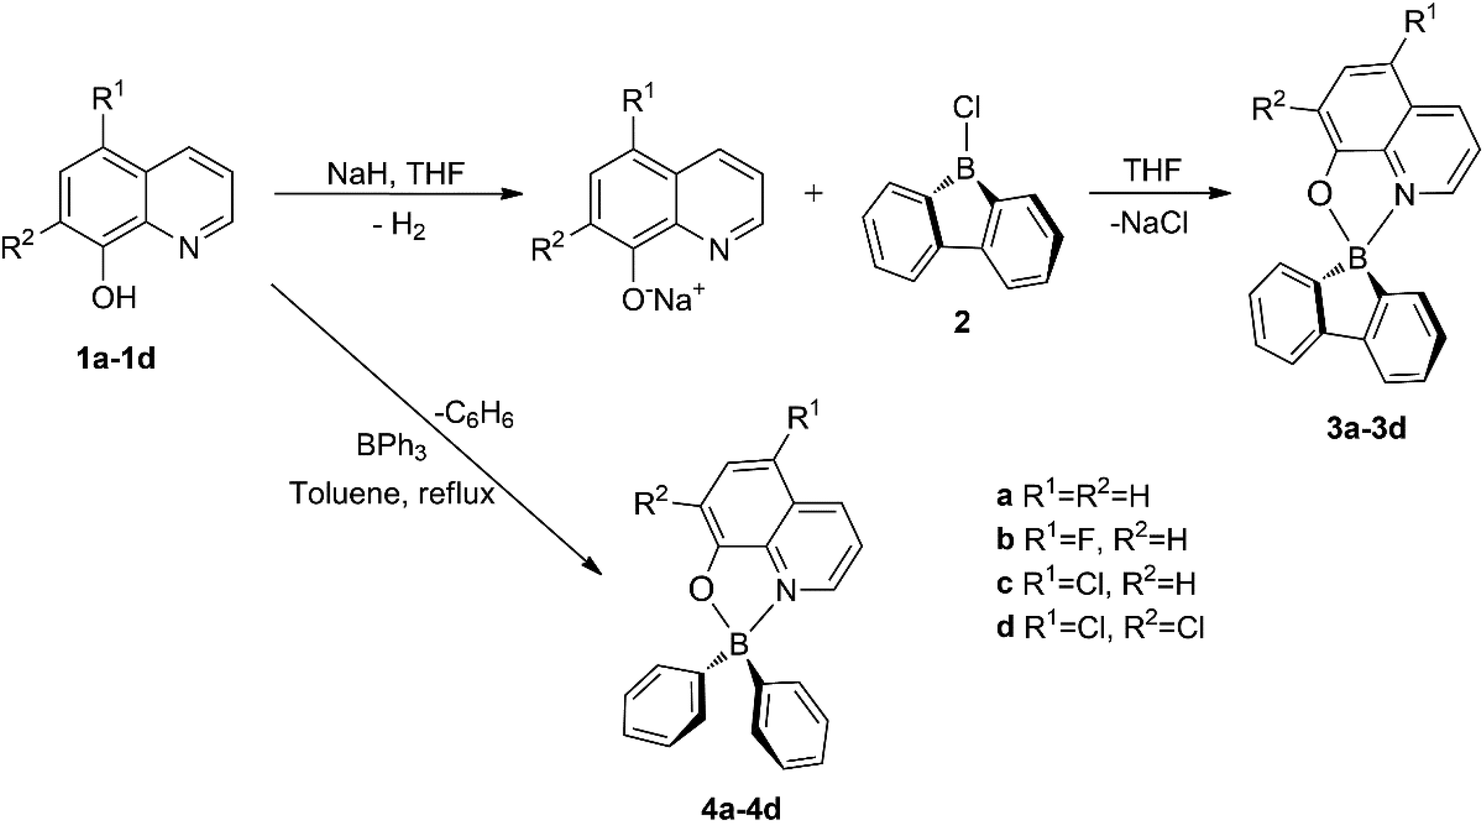 | ||
| Scheme 1 Syntheses of 9-borafluoren-9-yl (3a–3d) and diphenylboron (4a–4d) compounds bearing 8-quinolinolato ligands. | ||
Results and discussion
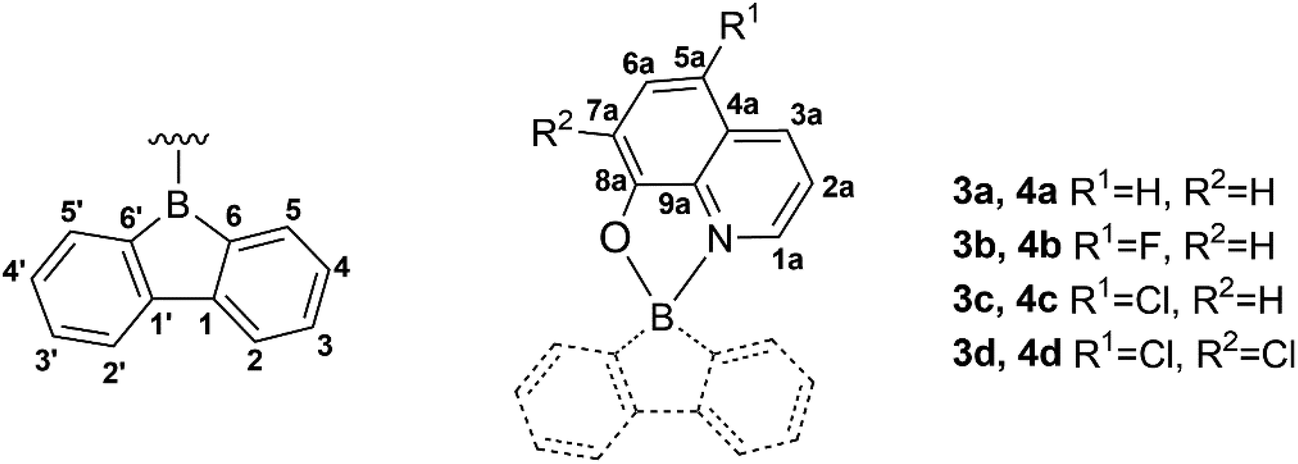
Synthesis and characterisation of boron complexes
The target tetrahedral boron complexes were prepared by coordinating different monoanionic 8-quinolinolato bidentate ligand chromophores to the 9-borafluoren-9-yl and diphenylboron moieties (Scheme 1).The synthesis of 9-borafluoren-9-yl compounds 3a–d started by the in situ deprotonation of the phenol OH protons of the corresponding ligand precursors 1a–d, using a slight excess of sodium hydride in THF at room temperature. Subsequently, the respective suspension containing the deprotonated ligand precursor was added to 9-chloro-9-borafluorene 2![[thin space (1/6-em)]](https://www.rsc.org/images/entities/char_2009.gif) 18 in THF, at a low temperature, giving rise to the desired products 3a–d. The BPh2 analogue complexes 4a–d were synthesised as a reference to study the effect of relative molecular rigidity on their optical properties. Complexes 4b–d were prepared through a modified procedure from that reported for 4a,11,12,17 which involved stirring a mixture of the desired 8-quinolinol (i.e. 8-hydroxyquinoline) 1a–d and triphenylboron in toluene under reflux for 16 h.
18 in THF, at a low temperature, giving rise to the desired products 3a–d. The BPh2 analogue complexes 4a–d were synthesised as a reference to study the effect of relative molecular rigidity on their optical properties. Complexes 4b–d were prepared through a modified procedure from that reported for 4a,11,12,17 which involved stirring a mixture of the desired 8-quinolinol (i.e. 8-hydroxyquinoline) 1a–d and triphenylboron in toluene under reflux for 16 h.
The 9-borafluoren-9-yl 3a–d and diphenylboron 4a–d complexes were obtained in moderate to high yields and were characterised by NMR spectroscopy (1H, 13C, 19F and 11B) – see Fig. S2–S27 in the ESI (ESI†) – elemental analysis and single-crystal X-ray diffraction.
The formation of boron compounds 3 and 4 is evidenced by the absence of OH proton resonances in the corresponding 1H NMR spectra, and the appearance of a 11B singlet in the range of δ 3.6–12.9 (three-coordinate 11B resonances occur at chemical shifts higher than 25 ppm (ref. 19)). Concomitantly, the proton and carbon resonances expected for the 8-quinolinolato and 1,1′-biphenyl-2,2′-diyl (complexes 3) or bis(phenyl) (complexes 4) moieties were also observed.
Known complexes 3a and 4a13,17 were used as reference compounds for their new halogenated derivatives presented in this work.
X-Ray diffraction studies
The crystal structures of compounds 3b, 3c, 3d, 4b and 4d were determined by single-crystal X-ray diffraction. All complexes crystallised in the monoclinic crystal system, in the P21/c (complexes 3b, 3c and 4b) and P21/n (complexes 3d and 4d) space groups. Although the structure of complex 3c was refined to perfect convergence, the crystal diffracted poorly, and is only presented in Fig. S1 in the ESI† as proof of its molecular connectivity, since its crystallographic information file (CIF) presented A-level alerts. Crystallographic data for these complexes and their most significant bond distances and angles are listed in Table S1 in the ESI.† Perspective views of the corresponding molecular structures of the 9-borafluoren-9-yl (3b and 3d) and bis(phenyl) (4b and 4d) complexes can be seen in Fig. 1.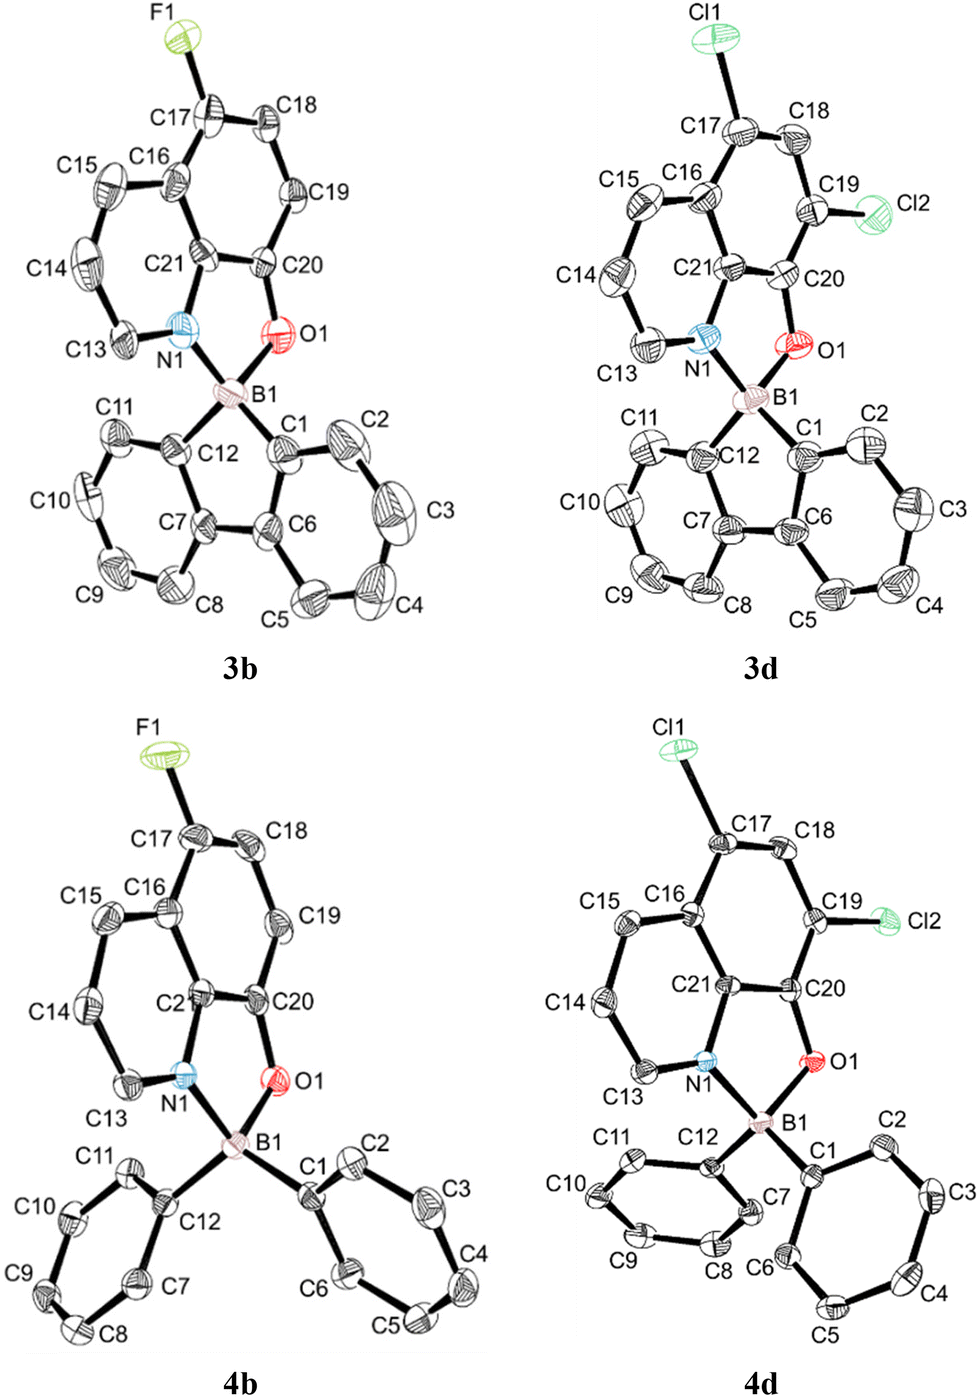 | ||
| Fig. 1 ORTEP-3 perspective views of the molecular structures of complexes 3b, 3d, 4b and 4d. The calculated hydrogen atoms have been omitted for clarity and the ellipsoids are drawn at the 50% probability level. | ||
All complexes display boron centres with tetrahedral coordination geometries, containing a bidentate 8-quinolinolato chelate and the 1,1′-biphenyl-2,2′-diyl (complexes 3b, 3c, Fig. S1 in the ESI,† and 3d) or bis(phenyl) (4b and 4d) moieties. Complexes 3b, 3c, and 3d display nearly flat 9-borafluoren-9-yl cores, with the angles between both phenyl rings (defined by the planes containing C1 to C6 and C7 to C12 carbon atoms) being in the range of 3.28(11)–3.85(10)°. The B1–N1 and B1–O1 bond lengths are between 1.592(8)–1.631(3) and 1.517(7)–1.557(8) Å, respectively. The B1–N1, B1–O1, B1–C1 and B1–C12 bonds are nearly identical in group 3 and group 4 complexes. The 8-quinolinolato and 1,1′-biphenyl-2,2′-diyl chelate bite angles differ by ca. 2°. The 8-quinolinolato and 9-borafluoren-9-yl cores are nearly orthogonal in all crystallographically characterised complexes 3b, 3c, and 3d, with the angles between the respective bite planes being in the range of 89.08(19)–89.36(10)°. This latter observation is a consequence of the coordination rigidity imparted by the effect of the 9-borafluoren-9-yl unit. By contrast, the C1–B1–C12 bond angles in the bis(phenyl) complexes 4b and 4d vary between 116.9(2) and 117.21(16)°, ca. 16° larger than those of the 9-borafluoren-9-yl groups, and the phenyl rings are not coplanar. Similar bond lengths and angles have been reported also for other boron 8-quinolinolato complexes.17,20
The packing arrangements of complexes 3b and 3d are particularly interesting and deserve further discussion. Fig. 2 shows short contacts between adjacent molecules in the crystal packing of complexes 3b (a) and 3d (b) and the packing diagram of complex 3d along the c crystallographic axis (c).
 | ||
| Fig. 2 (a) CH⋯O and CH⋯π hydrogen bonds inside the asymmetric unit of 3b; (b) CH⋯O, CH⋯Cl, Cl⋯π, and π⋯π stacking between the adjacent molecules of complex 3d; and (c) packing diagram of the crystal structure of complex 3d along the c crystallographic axis. | ||
In the case of complex 3b (Fig. 2(a)), there are weak hydrogen bonds between the two molecules in the asymmetric unit. One of the molecules acts as a donor in two interactions: CH⋯O (2.707 Å) and CH⋯π (2.532 Å) and as an acceptor in CH⋯π (2.891 Å) interaction with the other molecule. Other intermolecular interactions between asymmetric units are mainly CH⋯F (2.414, 2.590 Å) and CH⋯π (2.820 Å) hydrogen bonds. Some examples of π⋯π stacking are also observed, but the distances are above 3 Å. When the fluorine atom in 3b is replaced by a chlorine atom in 3c, the nature of short contacts changes and the latter is more loosely packed in the solid state.
In complex 3d (Fig. 2(b)), the CH⋯O hydrogen bonds (2.550 Å) correspond to the shortest distances in its packing. In the CH⋯Cl hydrogen bonds (2.713 Å), the H⋯Cl distance is slightly larger than the H⋯F one in 3b (by ∼0.3 Å), and longer than the difference in atomic radii between Cl and F (0.28 Å).21 Considering also that Cl is less electronegative than F, these bonds should be weaker in 3d. Both Cl⋯π (3.348 Å) and π⋯π stacking (3.384 Å) interactions are expected to be weak, as inter-atomic distances appear in the upper range considered for interactions of this type.22 The molecules of 3d are packed in the crystal structure forming “X-motifs” defining square prismatic channels with a width equal to 2.393 Å running along the c axis (Fig. 2(c)).
Molecular geometries and electronic structures
DFT calculations23 were performed for the ground state of all 9-borafluoren-9-yl (3a–3d) and diphenylboron (4a–4d) complexes using the ADF program,24 considering spin–orbit coupling (SOPERT),25 with solvent effects included (this is method A used in previous studies; further details including other calculations using B3LYP and BP86 functionals, and also with D3 dispersion corrections, can be found in Computational studies). The geometries of the first excited singlet and triplet states, and the electronic absorption spectra, were calculated using TDDFT.26The rigidity of the 8-quinolinolato ligand introduces a challenge: is there a geometric change between the ground state and the lowest excited singlet and triplet states? Previous studies on related boron complexes7n–u demonstrated that 2-iminopyrrolyl ligands undergo a significant distortion, which allows the differentiation of these three electronic states. In 3 and 4, the distances are always very close to each other and the 8-quinolinolato and 1,1′-biphenyl-2,2′-diyl ligands are rigid, as also found in another study17 of related 8-quinolinolato boron complexes including the unsubstituted parents 3a and 4a.
There is a very good agreement between the calculated bond distances and angles for the ground state geometry and the experimental values from the X-ray data for 3a–3d and 4a–4d. The calculated distances and the more relevant angles are collected in Table S2 (ESI†) for complexes 3b and 3d, and in Table S3 (ESI†) for 4d, for easy comparison with the experimental values. The agreement is very good for 3b, 3d and 4b. On the other hand, the optimised geometries of complexes 3a–3d and 4a–4d are shown in Fig. S30,† and the bond distances are almost the same when F and Cl atoms are introduced. The bond distances in the series 4a–4d are very similar, suggesting that the loss of rigidity, when going from the bidentate 1,1′-biphenyl-2,2′-diyl ligand to the two monodentate phenyl ligands, has no influence on them.
The optimised geometries of the first singlet and triplet excited states were obtained from TDDFT calculations as mentioned above. The calculated ground (S0) and the first excited singlet (S1) and triplet (T1) state geometries of 3d and 4d are shown in Fig. 3.
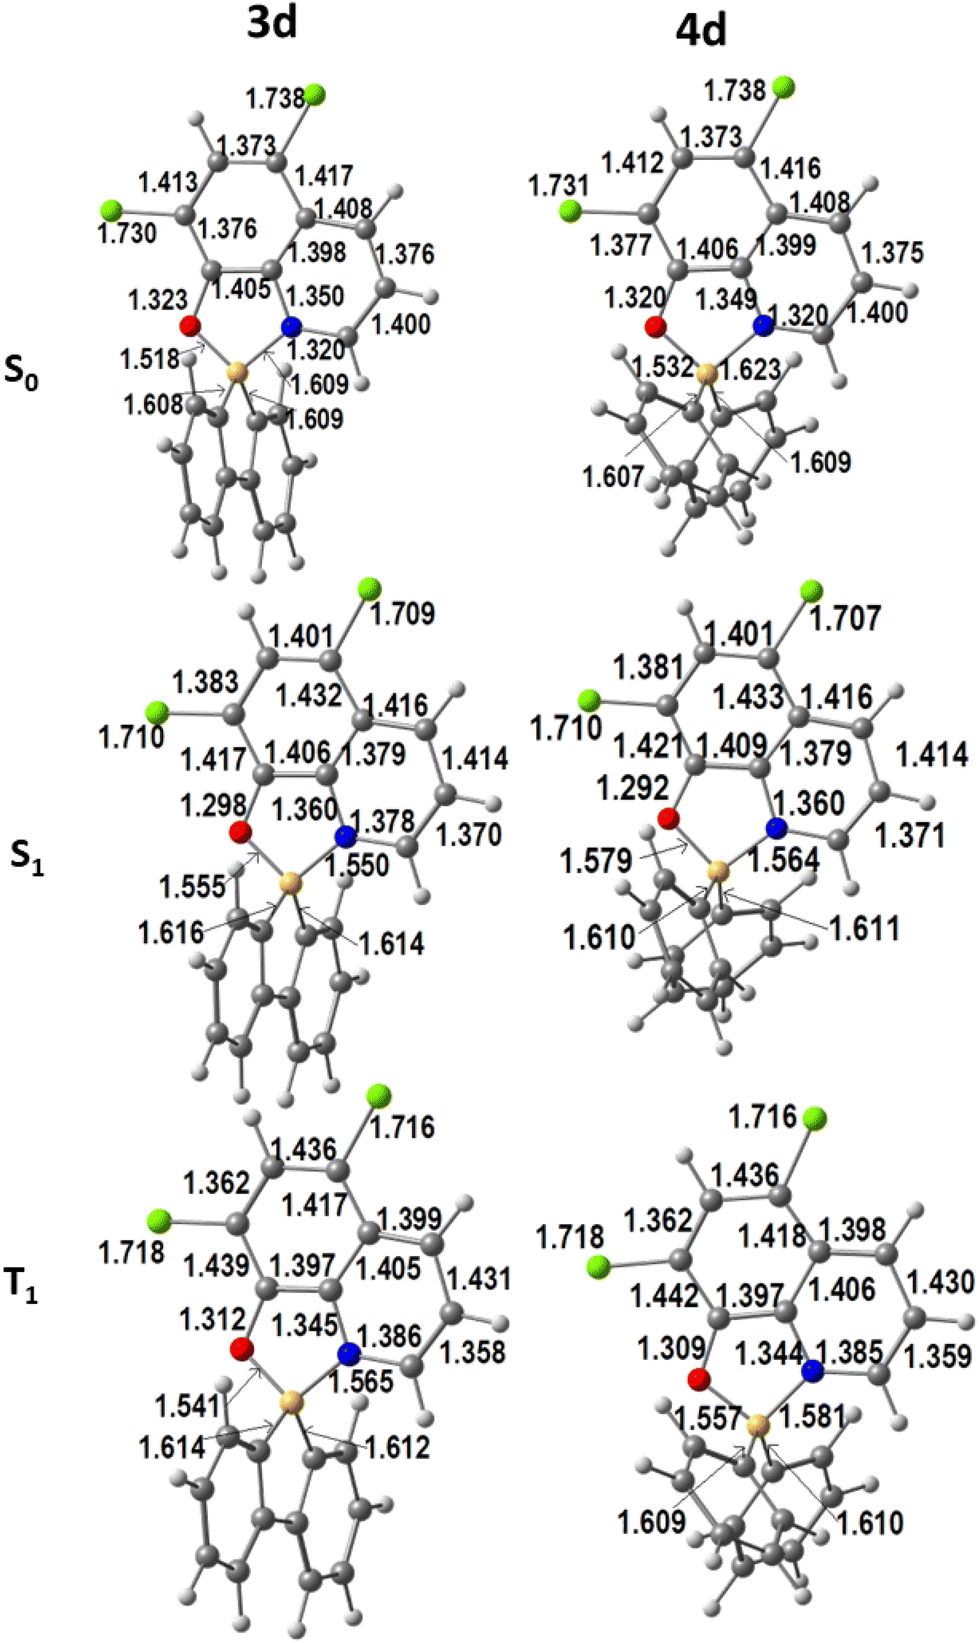 | ||
| Fig. 3 DFT calculated geometries of complexes 3d and 4d in the ground state (S0) and the first excited singlet (S1) and triplet (T1) states (bond lengths in Å). | ||
The changes in bond lengths are very small (below 0.05 Å), with the shift increasing when going to the S1 and then to the T1 states. It is also clear that there is an even smaller difference between the distances in the 1,1′-biphenyl-2,2′-diyl complex 3d than in the bis(phenyl) derivatives 4b. These trends are observed for all the complexes 3a–d and 4a–d (see Fig. S31–S33† for S0, S1, and T1, respectively). A brief look at the more relevant angles provides a similar picture. The chelation angles O–B–N and C–B–C barely change when going from S0 to S1 and T1: O–B–N shifts between 0.2° and 0.4° in 3, and between 0.5° and 0.7° in 4, while the values for C–B–C angles vary from 0.4 to 0.9° (3) and 0.5 to 1.0° (4). In conclusion, changes in the distances and angles between S0 and S1 or T1 are very small, in contrast to what was observed when 2-iminopyrrolyl ligands bound B in analogous complexes.7n–t
Photophysical studies: absorption spectra and steady-state fluorescence
The photophysical properties of the 9-borafluoren-9-yl complexes 3a–d and their BPh2 analogues 4a–d were studied in THF solution and in solid state films, dispersed in a ZEONEX 480R cycloolefin polymer. The absorption and fluorescence spectra, and a photograph of their photoluminescence in solution, are shown in Fig. 4 (and also in Fig. S28 in the ESI†).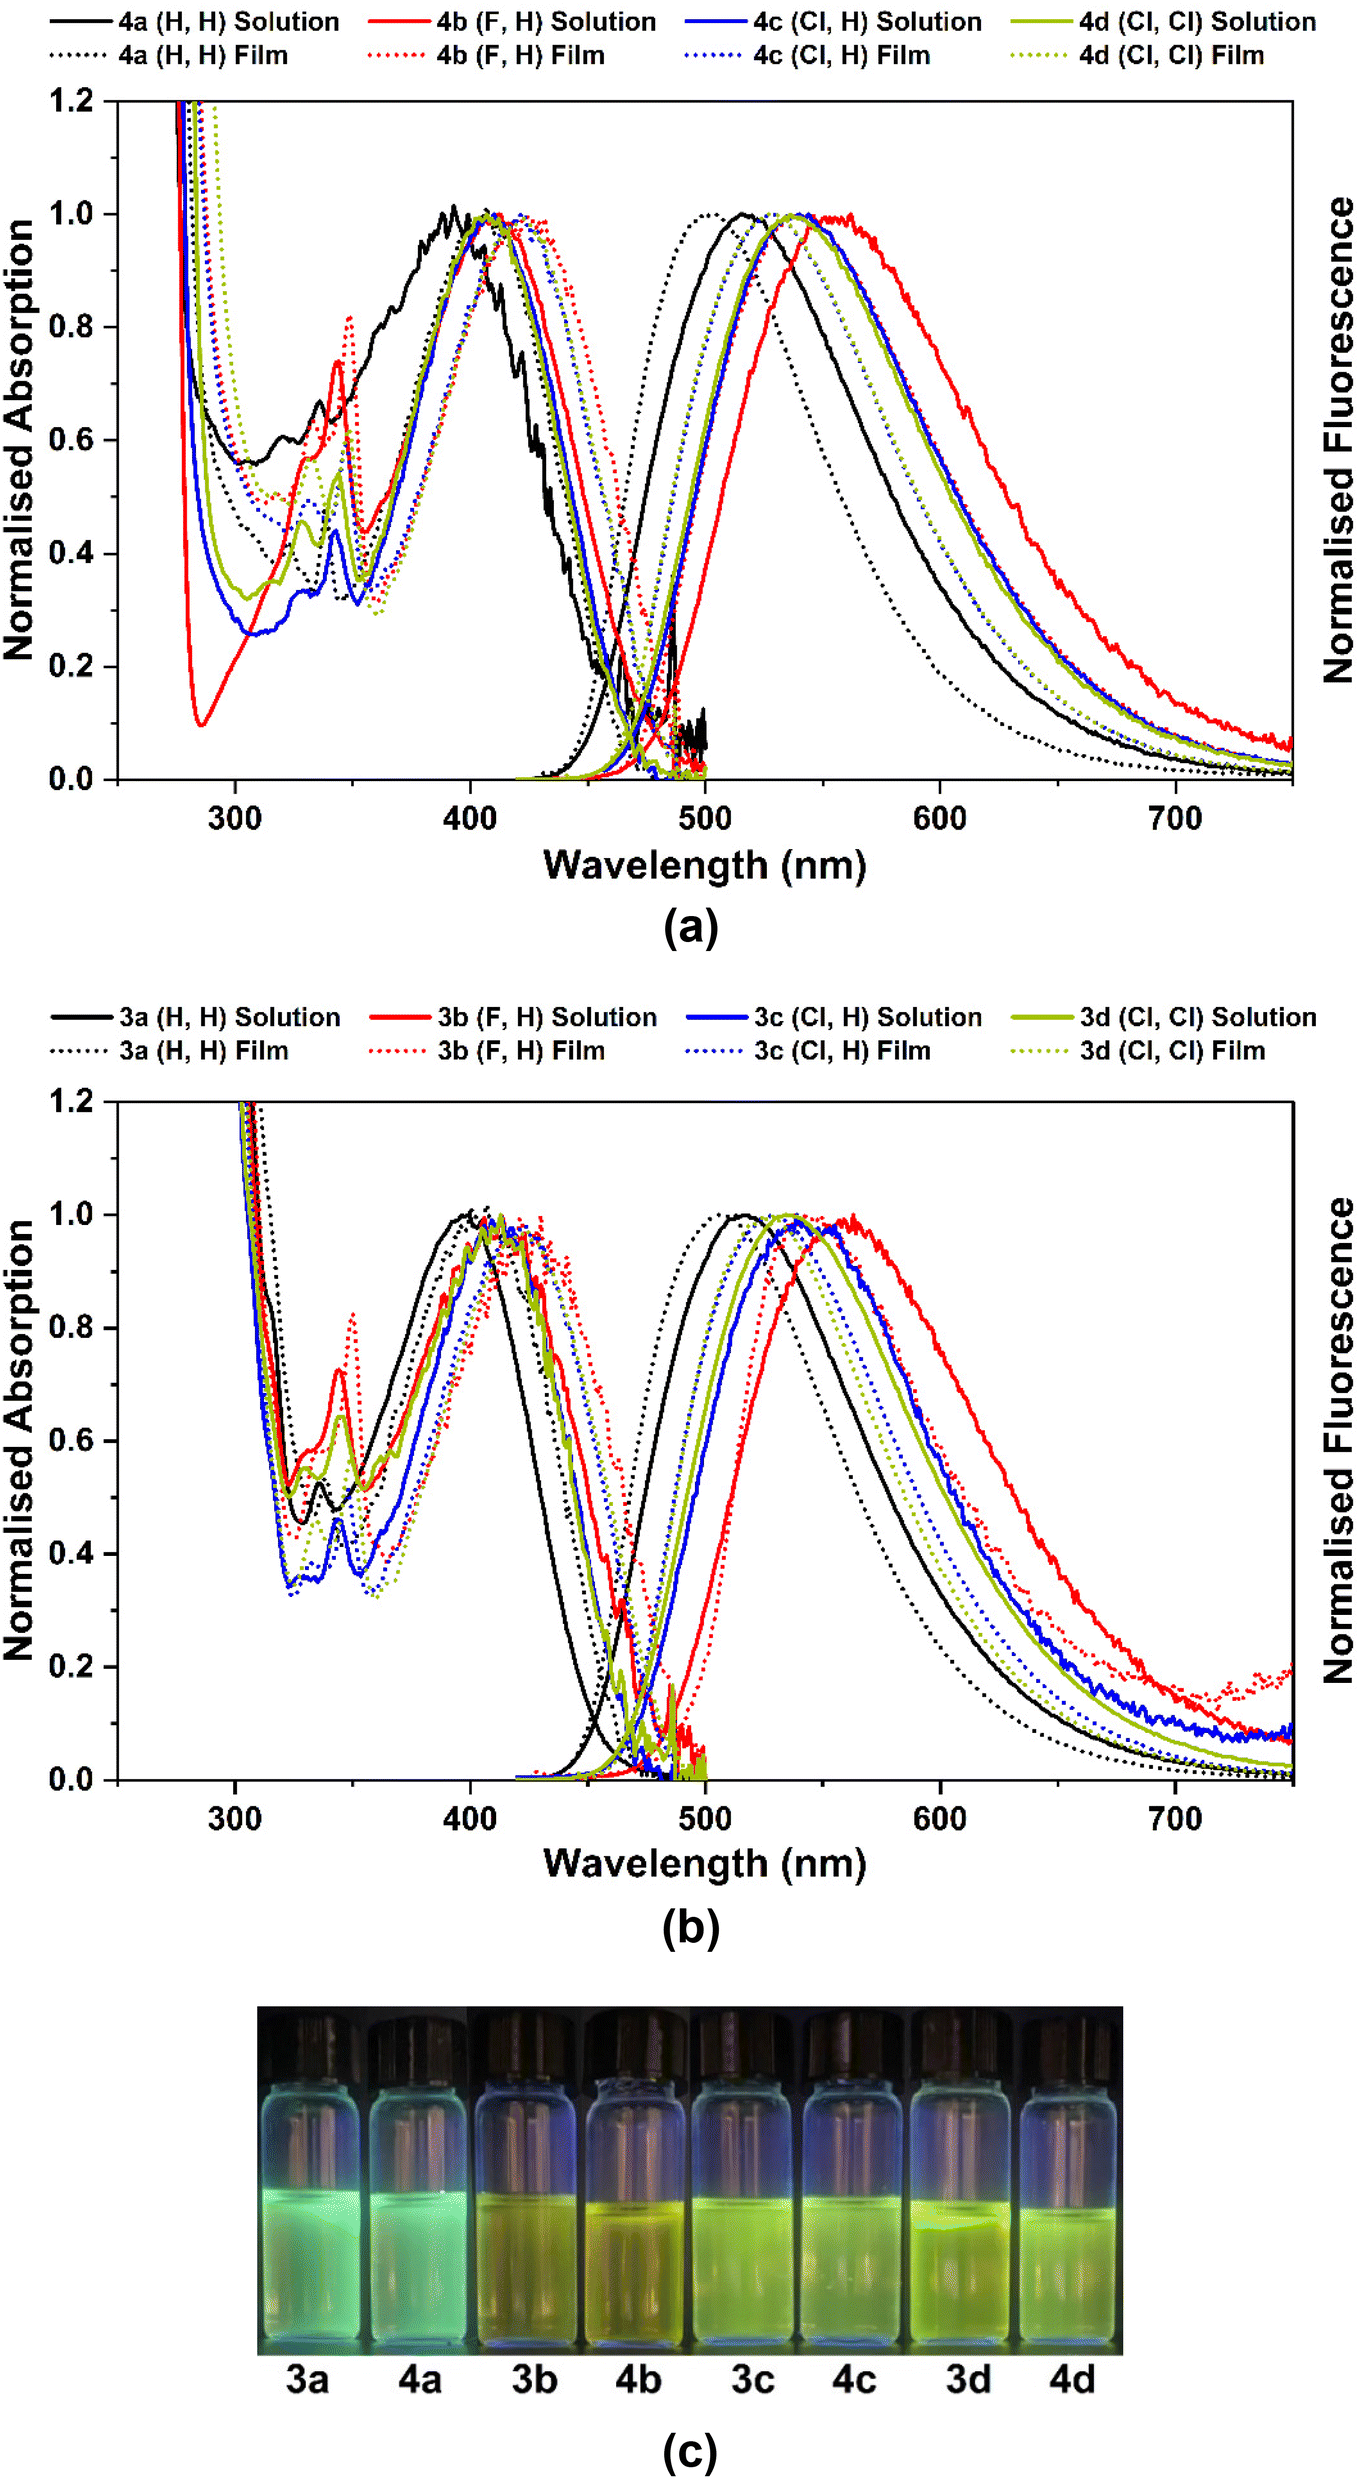 | ||
| Fig. 4 Normalised absorption and emission spectra of complexes: (a) 4a–d and (b) 3a–d in THF solution (ODmax < 0.2 at λmaxabs; c < 8 × 10⁻⁵ M) and in films (ZEONEX 480R, 1% wt), at 293 K. (c) Photoluminescence of the respective compounds in THF solution under 365 nm irradiation. | ||
The absorption and emission wavelength maxima (λmaxabs and λmaxem) of all complexes in THF solution are within the 393–413 nm and 516–560 nm ranges, respectively (Table 1). The emission colours range from green-blue to green-yellow with increasingly electronegative atom substituents. For ZEONEX 480R films the absorption values are slightly red-shifted (405–424 nm) while the emissions are blue-shifted (502–540 nm). The εmax values of compounds 3a–d and 4a–d lay in the range of 4.1–6.2 × 10³ and 4.4–6.3 × 10³ L mol−1 cm−1, respectively.
| Compound | R1 | R2 | Solution (THF) | Solid state (ZEONEX 480R film) | |||||||||||
|---|---|---|---|---|---|---|---|---|---|---|---|---|---|---|---|
|
λ
maxabsa (nm) |
ε
maxb |
λ
maxemc (nm) |
Φ
fd |
τ
fe,f (ns) |
k
fg (ns−1) |
k
nrh (ns−1) |
λ
maxabsa (nm) |
λ
maxemc (nm) |
Φ
fd |
τ
fe (ns) |
k
fg (ns−1) |
k
nrh (ns−1) |
|||
| a Absorption wavelength maxima (λmaxabs). b Molar extinction coefficients (εmax), 103 L mol−1 cm−1. c Photoluminescence wavelength maxima (λmaxem). d Fluorescence quantum yields (Φf). e Fluorescence lifetimes (τf). f From single exponential decays. g Radiative rate constants (kf); kf = Φf/τf. h Sum of non-radiative rate constants (knr). | |||||||||||||||
| 4a | H | H | 393 | 5.6 | 517 | 0.31 | 28.1 | 0.011 | 0.02 | 407 | 502 | 0.39 | 28.2 | 0.014 | 0.02 |
| 3a | H | H | 397 | 5.0 | 516 | 0.29 | 26.3 | 0.011 | 0.03 | 405 | 506 | 0.34 | 27.7 | 0.012 | 0.02 |
| 4b | F | H | 412 | 4.4 | 554 | 0.03 | 6.1 | 0.005 | 0.16 | 423 | 539 | 0.06 | 10.7 | 0.006 | 0.09 |
| 3b | F | H | 413 | 4.7 | 560 | 0.04 | 6.0 | 0.007 | 0.16 | 424 | 540 | 0.13 | 9.8 | 0.013 | 0.09 |
| 4c | Cl | H | 409 | 4.9 | 539 | 0.28 | 13.0 | 0.022 | 0.06 | 422 | 527 | 0.25 | 23.2 | 0.011 | 0.03 |
| 3c | Cl | H | 413 | 4.1 | 541 | 0.25 | 16.5 | 0.015 | 0.05 | 422 | 527 | 0.25 | 22.2 | 0.011 | 0.03 |
| 4d | Cl | Cl | 407 | 6.3 | 535 | 0.27 | 21.7 | 0.012 | 0.03 | 422 | 527 | 0.26 | 23.8 | 0.011 | 0.03 |
| 3d | Cl | Cl | 411 | 6.2 | 535 | 0.19 | 16.3 | 0.012 | 0.05 | 422 | 525 | 0.21 | 20.1 | 0.010 | 0.04 |
When increasing the polarity, from the nonpolar ZEONEX 480R film to the more polar THF, a bathochromic shift is observed in the emission spectra of all complexes 3a–d and 4a–d, whereas a hypsochromic shift is noticed in the absorption spectra (see Fig. S28 in the ESI†). This behaviour is attributed to a higher energy stabilisation of the excited state in the emission process, and of the ground state in the absorption process, respectively, with increasing solvent polarity. However, a hypsochromic shift in the absorption spectra is not characteristic of typical π–π* electronic transitions in conventional organic compounds.27 This result seems not to be determined by changing from the solid state (ZEONEX 480R) to solution, as the same trend is also observed in the absorption spectra of complexes 3a and 4a when using solvents of increasing polarity (see Table S4 and Fig. S29, S30 in the ESI†). This effect will be discussed in more detail at the end of the next section.
The fluorescence quantum yields of complexes in THF solutions lay within the range 0.03–0.29. Substitution at position 5 of the 8-quinolinolato ligands with highly electron-withdrawing fluorine clearly leads to a sharp decrease in the fluorescence quantum yields in 3b and 4b in relation to the unsubstituted complexes 3a and 4a and an increase in the non-radiative rate constants in the former. Substitution with less electronegative chlorines at position 5 (3c and 4c) or positions 5 and 7 (3d and 4d) still leads to a lower photoluminescence quantum yield, but to a less extent than in the F-decorated molecules 3b and 4b. Neither F nor Cl (single- or double-) substitutions promote phosphorescence at room or low temperature emission, as clearly seen in the transient emission spectra (see Fig. 6 below in the section Photophysical studies: time-resolved luminescence).
TDDFT calculation of electronic transitions and excited state energy
To obtain insight into the electronic properties of complexes 3a–d and 4a–d, TDDFT calculations, including spin–orbit coupling and using THF as a solvent, were also performed to determine the absorption spectra and the energies of the first excited singlet and triplet states. The relevant frontier molecular orbitals needed to analyse the spectra and their energies are shown in Fig. 5 for 3c, 3d, and 4d and in Fig. S34 (ESI†) for the remaining complexes. The energies of HOMOs and LUMOs determined by DFT (all methods used) for complexes 3a–d and 4a–d are given in Table S5 (ESI†).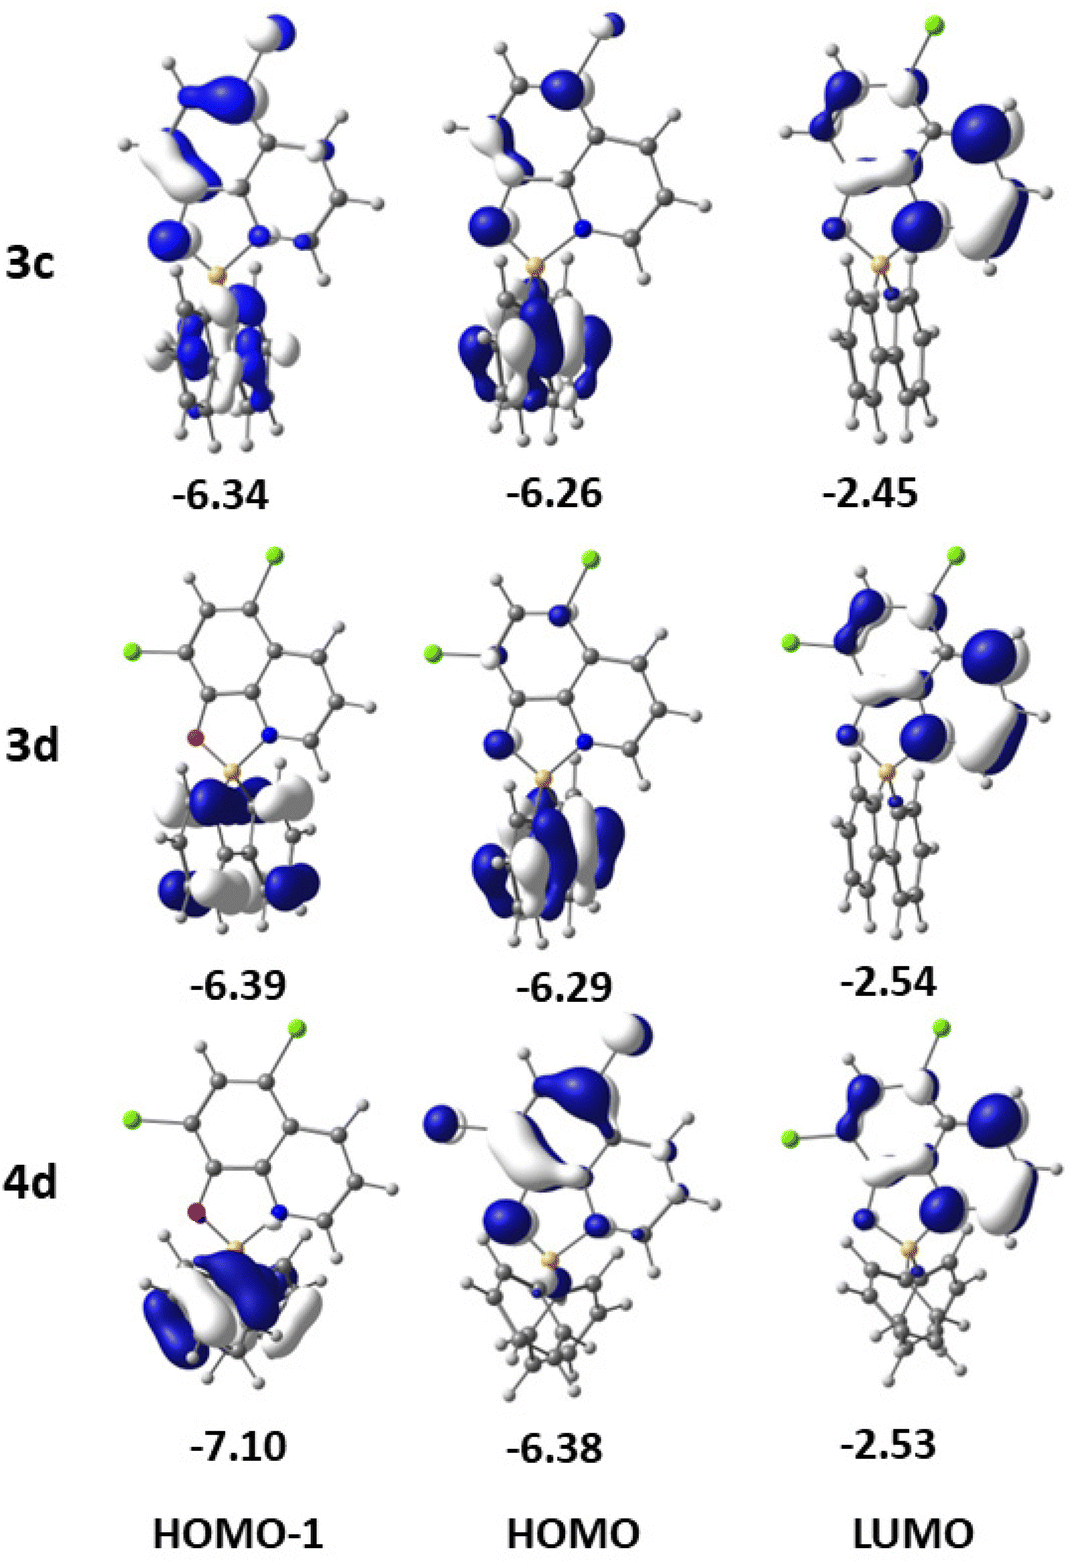 | ||
| Fig. 5 Frontier molecular orbitals (HOMO−1, HOMO and LUMO) of complexes 3c, 3d, and 4d, with their energies in eV. | ||
The calculated values for the lower energy S0 → S1 absorptions for all the complexes (Table 2) reproduce very well the experimental values (Table 1). The largest difference is 17 nm for 3a and the smallest difference is 6 nm for 4d. The lower energy absorption band of 3a (S0 → S1, calculated at 380 nm) results from two excitations from the HOMO and HOMO−1 to the LUMO. While the LUMO is completely localised in the 8-quinolinolato ligand, the HOMO is essentially located in the 1,1′-biphenyl-2,2′-diyl ligand, and the HOMO−1 includes both the ligands. This absorption involves both a charge transfer from the 1,1′-biphenyl-2,2′-diyl to the 8-quinolinolato ligand and an intra-ligand (IL, 8-quinolinolato) π–π* component. With the introduction of fluorine or chlorine in 3b or 3c, the LUMO remains in the 8-quinolinolato moiety while the HOMO and the HOMO−1 are delocalised over the two bidentate ligands with a small contribution of F or Cl atoms. The nature of the S0 → S1 transition is therefore similar to the one in 3a. In complex 3d, with two Cl substituents, the LUMO maintains the same localisation in the 8-quinolinolato ligand, but both the HOMO and HOMO−1 are almost completely localised in the 1,1′-biphenyl-2,2′-diyl ligand. Therefore, the HOMO → LUMO and HOMO−1 → LUMO transitions (S0 → S1) display a charge transfer character (both inter-ligand, 1,1′-biphenyl-2,2′-diyl to 8-quinolinolate).
| Compound | R1 | R2 | λ maxabs | λ maxem | k f | T1 | |||
|---|---|---|---|---|---|---|---|---|---|
| Exp. (nm) | Calc. (nm) | Exp. (nm) | Calc. (eV, nm) | Exp. (ns−1) | Calc. (ns−1) | Calc. (eV, nm) | |||
| 4a | H | H | 393 | 383 | 517 | 2.49 (498) | 0.011 | 0.067 | 1.54 (805) |
| 3a | H | H | 397 | 380 | 516 | 2.49 (498) | 0.011 | 0.034 | 1.53 (810) |
| 4b | F | H | 412 | 399 | 554 | 2.26 (549) | 0.005 | 0.054 | 1.35 (918) |
| 3b | F | H | 413 | 401 | 560 | 2.27 (546) | 0.007 | 0.043 | 1.35 (918) |
| 4c | Cl | H | 409 | 400 | 539 | 2.31 (537) | 0.022 | 0.070 | 1.41 (879) |
| 3c | Cl | H | 413 | 399 | 541 | 2.31 (537) | 0.015 | 0.045 | 1.41 (879) |
| 4d | Cl | Cl | 407 | 401 | 535 | 2.31 (537) | 0.012 | 0.061 | 1.43 (867) |
| 3d | Cl | Cl | 411 | 400 | 535 | 2.32 (534) | 0.012 | 0.025 | 1.43 (867) |
The calculated emission energies presented in Table 2 match very well the experimental data in Table 1. The energies of the T1 state are also included in Table 2, together with the fluorescence radiative rate constants defined as kf = 1/τ, where τ is the calculated lifetime of the S1 state. The calculated values of kf are comparable with the experimental rate constants. The ΔEST of complexes 3a–d and 4a–d is close to ∼1 eV and hence disqualifies TADF as a potential DF mechanism.6 As mentioned in the Introduction section, the ΔEST observed in typical TADF complexes is usually <0.2 eV,4b which is significantly lower than the value calculated for our luminescent systems. Indeed, to obtain a computational reference for this statement, TDDFT calculations were performed using the same methodology (see Computational studies in the Experimental section) in boron related systems that were reported to display TADF.8c The energy differences between the first singlet and triplet states in those systems are ca. 0.05 eV.28
To examine the above-mentioned observed shifts of absorption and emission maxima, namely the hypsochromic shift between the nonpolar ZEONEX 480R film (ε = 2.3429) and the more polar THF, the absorption spectra were calculated either in vacuum (nonpolar) or using a solvent model (THF, ε = 7.58 contained in ADF24) to simulate the solvation effects of a more polar medium. As shown in Table S6 (ESI†), the calculated lowest energy absorption values lay very close to the experimental results. For instance, the experimental λmax in ZEONEX 480R is 407 while the calculated value is 402 nm for 4a, similarly for 3a the values are 405 and 398 nm, respectively. The calculated dipole moments of the S0 structures 3 and 4 vary from 5.79 D in 4c to 8.10 D in 3a (all the dipole moments are collected in Table S6 in the ESI†). After the vertical excitation to the singlet state and before geometrical reorganisation of the molecule, i.e. in the non-relaxed Franck–Condon excited state S′1, they all decrease (values between 4.30 D in 3b and 6.08 D in 4a), namely 5.05 D for 4c and 5.98 D for 3a. Since the ground state is more polar than the excited state, it is energetically more stabilised than the excited state with increasing polarity, therefore explaining the observed absorption shifts to the blue region. The dipole moments increase after the reorganisation of the singlet excited state (relaxed excited state S1), with values ranging from 5.96 D in 4c to 8.81 D in 3a. This increase in polarity is associated with the red shift of the emission energies detected when increasing the polarity of the solvent owing to a higher energy stabilisation of S1 in relation to S0.
Photophysical studies: time-resolved luminescence
The selected transient emission spectra of complexes 3a,d and 4a,d in ZEONEX 480R films (1% wt), at room temperature and at 77 K, are shown in Fig. 6. The remaining spectra of 3b,c and 4b,c are presented in the ESI (Fig. S35†).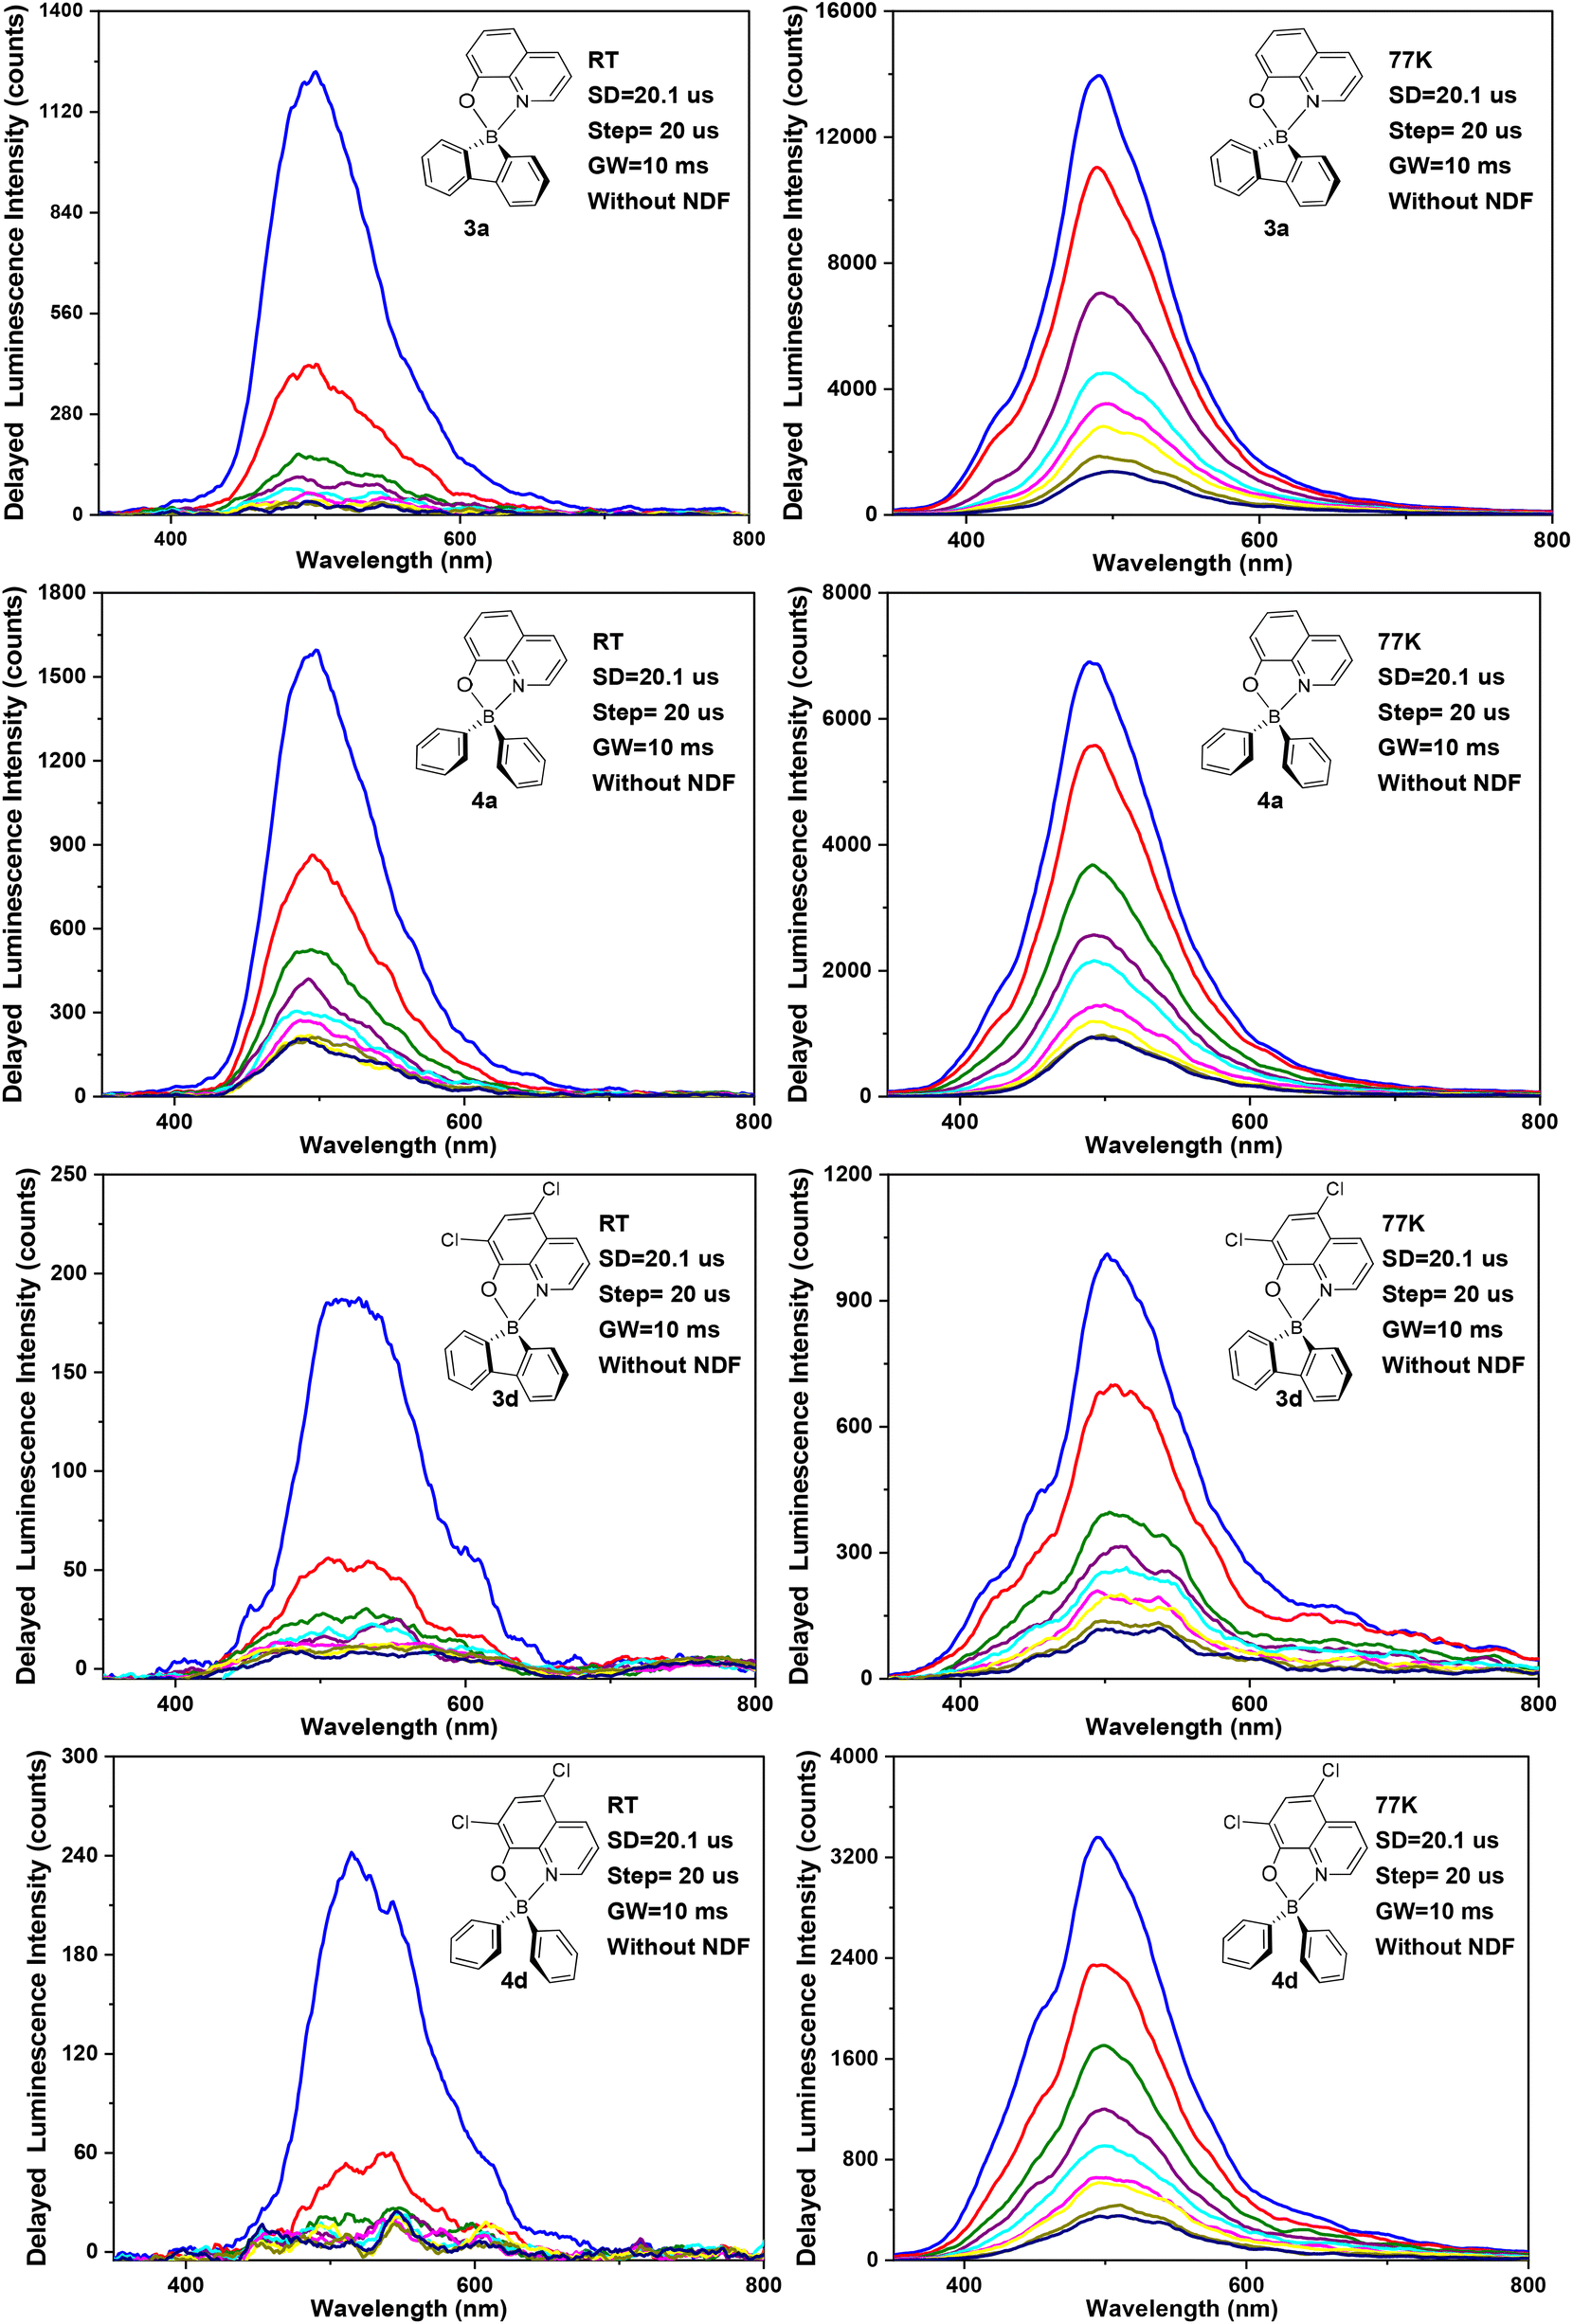 | ||
| Fig. 6 Transient emission spectra of complexes 3a,d and 4a,d in ZEONEX 480R films (1% wt) at room temperature (ca. 293 K) (left) and at 77 K (right). All spectra were recorded with a start delay (SD) of 20.1 μs (blue curve) and with a delay increment of 20 μs (step), with the use of a large gate width (GW = 10 ms). The delayed fluorescence intensity decreases at each delay increment. | ||
Table 3 lists the corresponding delayed fluorescence emission spectrum maxima along with the calculated delayed fluorescence lifetimes (τDF), at room temperature and at 77 K. The minimal delay time of ca. 20.1 μs used in the transient photoluminescence experiments in Fig. 6 and S35† eliminates the possibility of detecting prompt fluorescence (PF). Most of the complexes display delayed fluorescence in ZEONEX 480R films, both at room temperature and at 77 K. Delayed fluorescence quenching caused by oxygen was not observed as air- and argon-equilibrated samples display the same properties. This behaviour indicates that the diffusion of O2 in the polymer films is negligible and thus it does not quench the triplet states involved in the delayed emission process (at least under the conditions and in the timescales used in the experiments).
| Compound | R1 | R2 | PFa | DFb | ||||
|---|---|---|---|---|---|---|---|---|
| r.t.c | r.t.c | 77 K | ||||||
|
λ
maxemd,e (nm) |
τ
fa,e (ns) |
λ maxem (nm) |
τ
DFf (μs) |
λ maxem (nm) |
τ
DFf (μs) |
|||
|
a PF: prompt fluorescence.
b DF: delayed fluorescence.
c r.t. = ca. 293 K.
d Steady-state fluorescence.
e Data reproduced from Table 1.
f τDF values were estimated from the half-life of photoluminescence decay obtained from the transient emission spectra, thus divided by ln(2).
g Not determined, due to a low signal-to-noise ratio.
|
||||||||
| 4a | H | H | 502 | 28.2 | 499 | 29 | 491 | 58 |
| 3a | H | H | 506 | 27.7 | 499 | 61 | 492 | 64 |
| 4b | F | H | 539 | 10.7 | 542 | n.d.g | 492 | 32 |
| 3b | F | H | 540 | 9.8 | 542 | 17 | 529 | 55 |
| 4c | Cl | H | 527 | 23.2 | 522 | n.d.g | 499 | 29 |
| 3c | Cl | H | 527 | 22.2 | 523 | 13 | 520 | 42 |
| 4d | Cl | Cl | 527 | 23.8 | 519 | 13 | 503 | 74 |
| 3d | Cl | Cl | 525 | 20.1 | 525 | 14 | 507 | 42 |
The observed emission intensities at 77 K are significantly higher than those recorded at room temperature. This behaviour is in line with the expected reduction of non-radiative decay of the triplet state T1 contributing to the observed delayed fluorescence. Further studies of delayed emission intensity as a function of excitation dose clarify the nature of this long-lived photoluminescence and are presented in Fig. 7 for complexes 3a,d and 4a,d. By fitting the experimental data in the log–log scale, a linearised form of the general relationship Y = aXb + c is used, where Y = DF intensity, X = excitation dose, and a, b, c are constants.
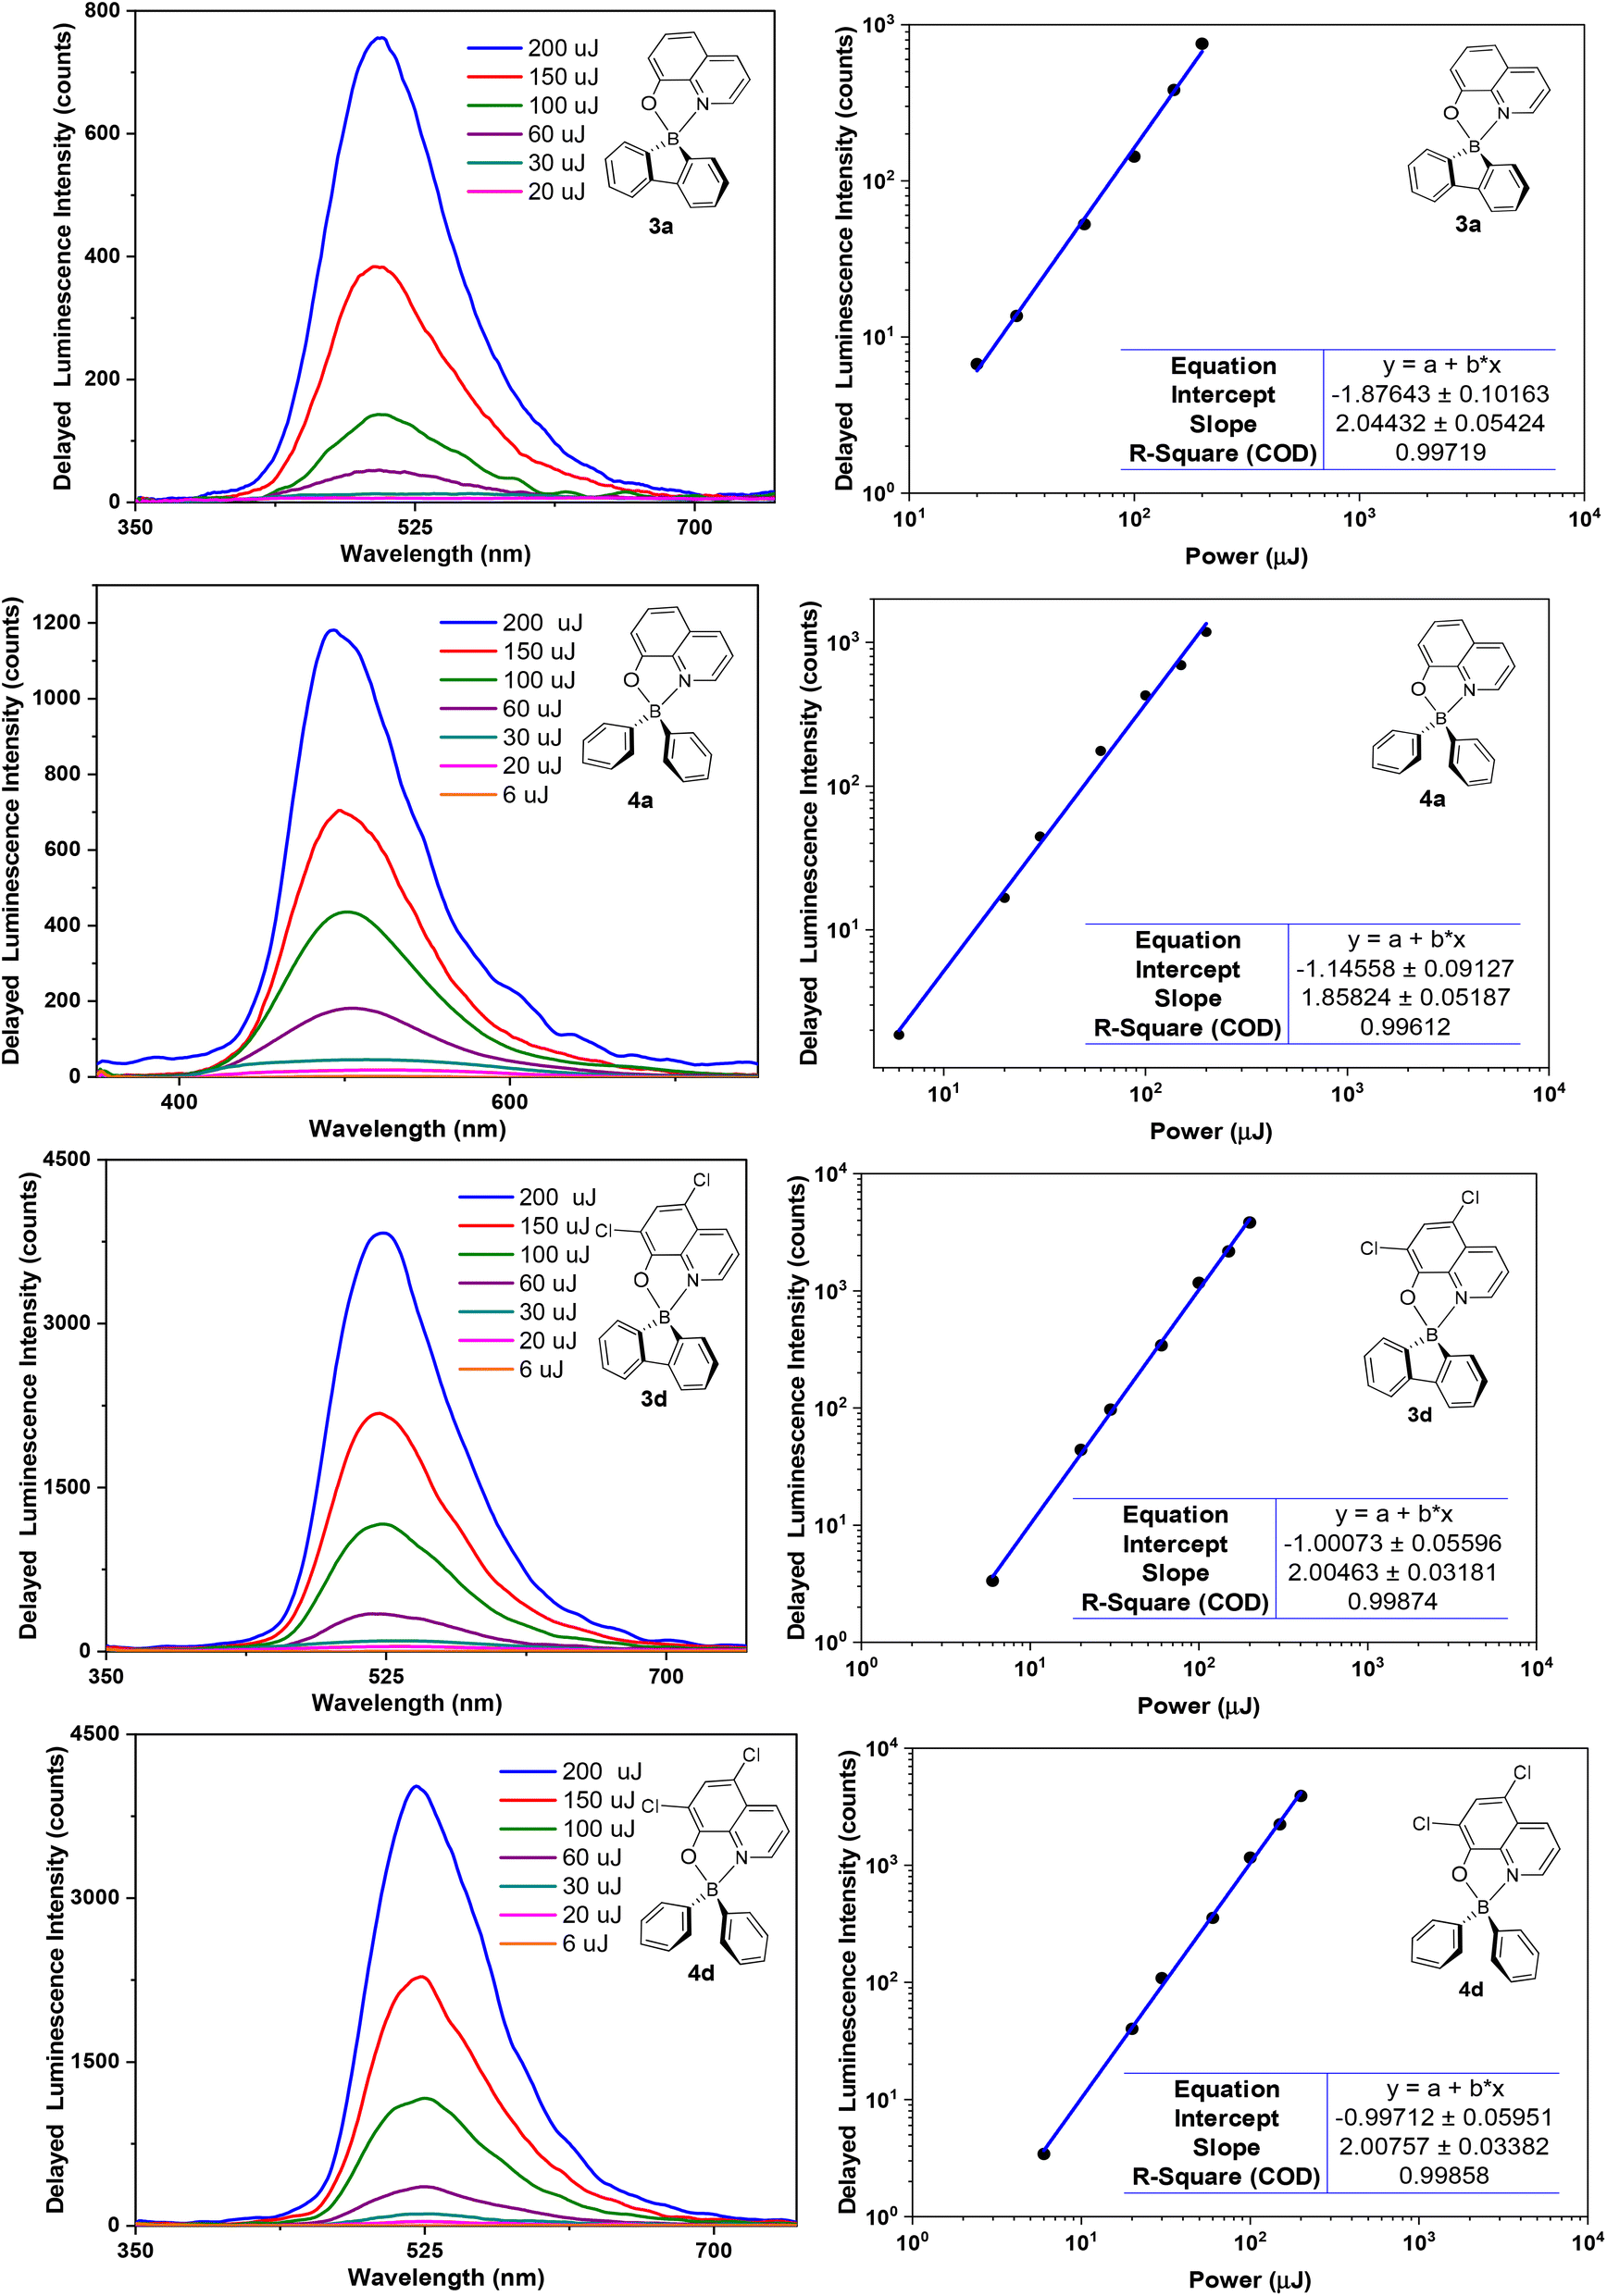 | ||
| Fig. 7 Left: Dependence of DF intensity on the excitation dose for complexes 3a,d and 4a,d in ZEONEX 480R films at room temperature (ca. 293 K). Right: log–log plot of DF intensity as a function of excitation dose. A start delay (SD) of 20 μs was used. | ||
In the fit presented in Fig. 7, ‘slope’ is interpreted as exponent b in the equation above. For intramolecular processes, such as TADF, b = 1, while for a process involving two excited states, such as TTA, b = 2 is expected. A value of b ≈ 2 is observed for all four complexes studied: 3a,d and 4a,d, reflecting a clear quadratic dependence of the delayed luminescence intensity on the concentration of excited species, in accordance with the bimolecular nature of the TTA process occurring in these solid state samples.6b
Electroluminescence studies
A series of OLEDs were produced using complexes 3a, 4a, 3c, 4c, 3d, and 4d as the emissive dopants to study the effect of halogenation of the emitter on the electroluminescence properties of the device. The summarised characteristics of all OLED devices are presented in Table 4 and Fig. 8. Supplementary figures are provided in the ESI (Fig. S36–S38†). Device codes follow emitter names with the exception of 3a opt. and 4a opt., which denote the optimised variants of devices 3a and 4a.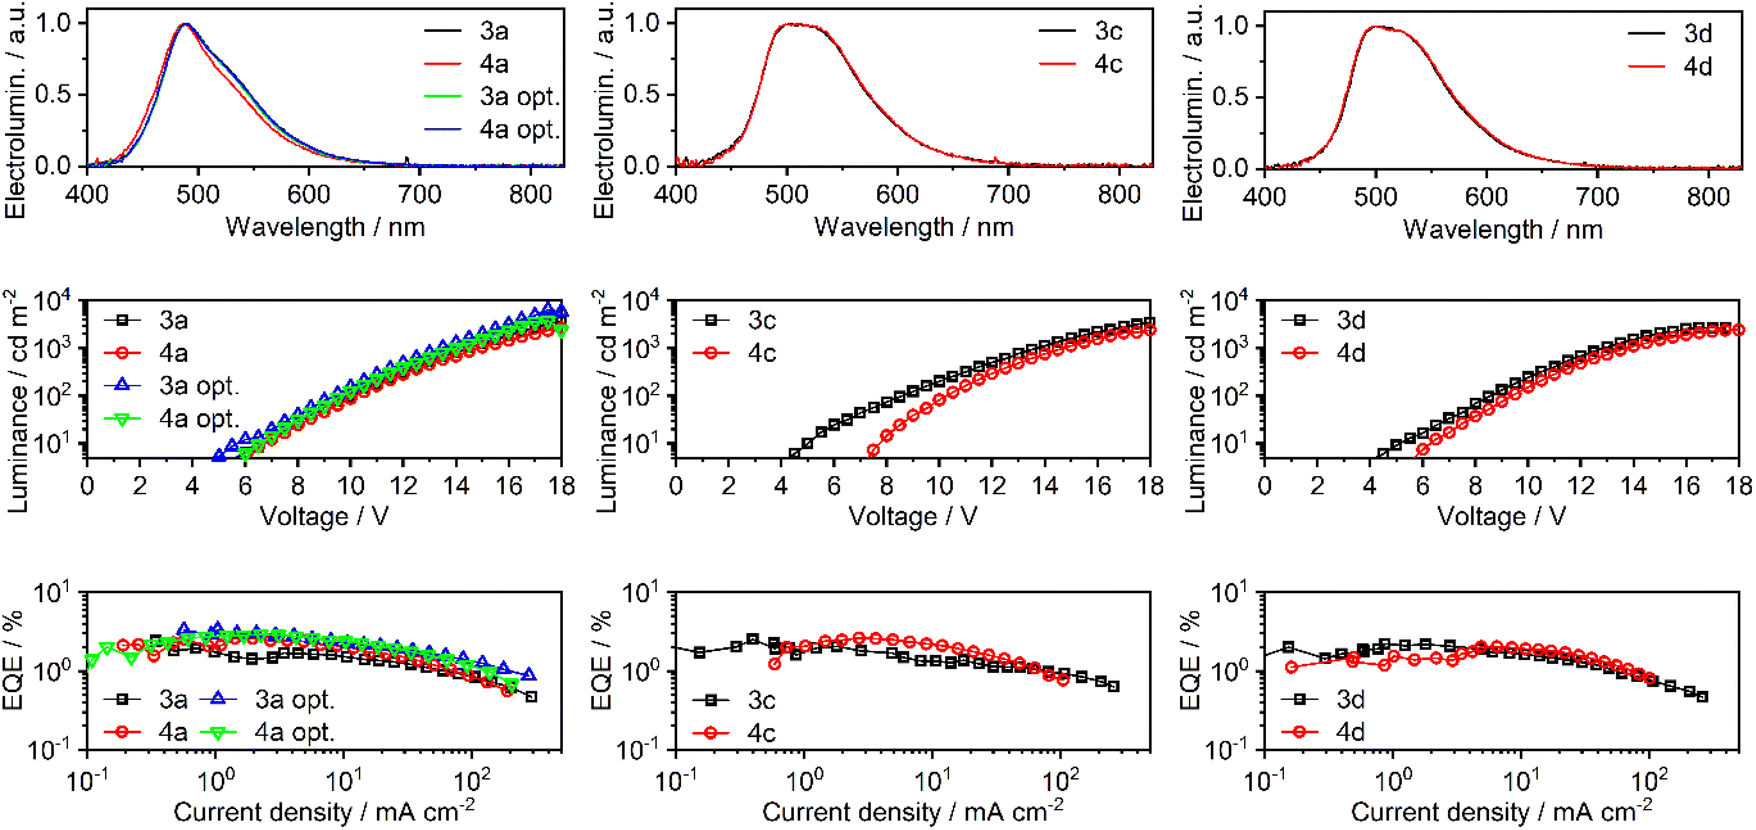 | ||
| Fig. 8 Characteristics of OLED devices: electroluminescence spectra (top); luminance vs. voltage (middle); external quantum efficiency (EQE) vs. current density (bottom). | ||
| Device | Emitter |
V
ONa (V) |
L
maxb (cd m−2) |
λ
maxELc (nm) |
CEmaxd (cd A−1) |
EQEmaxe (%) |
CIE 1931f (x; y) |
|---|---|---|---|---|---|---|---|
| a Turn-on voltage at 10 cd m−2. b Maximum luminance. c Electroluminescence spectrum maxima. d Maximum current efficiency. e Maximum external quantum efficiency. f Colour coordinates of the electroluminescence spectrum as defined in the International Commission on Illumination colour space CIE 1931. | |||||||
| 3a | 3a | 6.5 | 3600 | 490 | 6.0 | 2.4 | (0.21; 0.41) |
| 4a | 4a | 6.5 | 2600 | 488 | 6.2 | 2.6 | (0.19; 0.37) |
| 3a opt. | 3a | 6.0 | 6300 | 489 | 8.0 | 3.3 | (0.21; 0.41) |
| 4a opt. | 4a | 6.5 | 3800 | 489 | 7.4 | 2.9 | (0.21; 0.41) |
| 3c | 3c | 5.0 | 3500 | 503 | 6.4 | 2.5 | (0.27; 0.50) |
| 4c | 4c | 8.0 | 2400 | 501 | 8.3 | 2.6 | (0.27; 0.51) |
| 3d | 3d | 5.0 | 2700 | 502 | 6.5 | 2.2 | (0.27; 0.50) |
| 4d | 4d | 6.0 | 2400 | 499 | 5.8 | 2.0 | (0.27; 0.50) |
At first, a study of the differences between linked and separated phenyl ligands in devices 3a and 4a was attempted with the following general structure (Fig. S39 in the ESI†): ITO | HAT-CN (10 nm) | TSBPA (40 nm) | mCP (2 nm) | mCP co 10% emitter (20 nm) | PO-T2T (5 nm) | TPBi (40 nm) | LiF (0.8 nm) | Al (100 nm). Here HAT-CN {dipyrazino[2,3-f:2′,3′-h]quinoxaline-2,3,6,7,10,11-hexacarbonitrile} served as the hole injection layer, while TSBPA {4,4′-(diphenylsilanediyl)bis(N,N-diphenylaniline)} served as the hole transport layer. A thin layer of mCP {1,3-bis(carbazol-9-yl)benzene} served as an additional hole transport layer and exciton blocking layer. mCP also served as the host material in the emissive layer. PO-T2T {2,4,6-tris[3-(diphenylphosphinyl)phenyl]-1,3,5-triazine} served as the hole blocking layer, while TPBi {1,3,5-tris(1-phenyl-1H-benzimidazol-2-yl)benzene} served as the electron transport layer. LiF was the electron injection layer and Al served as the cathode. Devices 3a and 4a have demonstrated comparable properties with the maximum external quantum efficiency (EQE) of ∼2.5% and near identical electroluminescence spectra (Fig. 8 and Table 4). The maximum luminance of device 3a (3600 cd m−2) was, however, larger than that of 4a (2600 cd m−2). We have attempted to further optimise the structure of devices 3a/4a by introducing an electron-transport layer PO-T2T into the emissive layer, which resulted in devices 3a opt. and 4a opt. (Fig. S40 in the ESI†). The OLED architecture of 3a/4a opt. is similar to that of 3a/4a, but the emissive layer comprises a blend of mCP and PO-T2T:30,31 ITO | HAT-CN (10 nm) | TSBPA (40 nm) | mCP (2 nm) | mCP:PO-T2T (80:20) co 10% emitter | PO-T2T (5 nm) | TPBi (40 nm) | LiF (0.8 nm) | Al (100 nm). Devices 3a opt. and 4a opt. display enhanced electroluminescence characteristics, which can be attributed to an improved hole–electron balance within the emissive layer. The maximum EQE was ca. 3% while the maximum luminance reached 6300 cd m−2 and 3800 cd m−2, respectively, for 3a opt. and 4a opt.
To demonstrate the effect of halogenation of the 8-quinolinolate ligand, a simpler structure of devices 3a/4a was used as a basis for devices 3c/4c and 3d/4d. Addition of a single peripheral chlorine atom results in a change of the electroluminescence spectrum in devices 3c/4c, which remains similar in 3d/4d despite the second chlorine atom added to the emitter. Addition of one chlorine atom does not appear to affect the OLED performance as devices 3c/4c display similar characteristics to 3a/4a. OLEDs with two chlorines in the emitter molecule (3d/4d) display lower EQE and luminance than devices 3a/4a, leading to reduced fluorescence efficiency. In this case the maximum EQE lowers to around 2.0–2.2%. While the respective 3x/4x OLEDs display near identical electroluminescence spectra and similar EQE, it is evident that the 3x devices present higher maximum luminance. Such behaviour is a resultant of the overall higher current density in the 3 series, suggesting that emitter structures 3x have a lower negative effect on the carrier mobility of the emissive layer (via lower trapping) or a positive effect on charge injection.
All the presented OLED devices turn on at ca. 4 V, but only reach a luminance of 10 cd m−2 at around 5–8 V. Overall, the electroluminescence spectra of all devices are consistent with those recorded in a solution or a ZEONEX 480R film, being blue shifted and demonstrating a more resolved vibronic progression.
Conclusions
In summary, a family of six new 9-borafluoren-9-yl and diphenylboron complexes (3b–d and 4b–d, respectively) containing halogen-substituted 8-quinolinolato N,O-bidentate ligands as second chromophores has been synthesised and structurally characterised. They display distorted tetrahedral geometries about the boron atom. These complexes are fluorescent exhibiting emission colours between green-blue and green-yellow. Their photophysical study reveals film photoluminescence quantum yields (Φf) in the range of 0.06 to 0.26 and lifetimes (τf) of 10 to 24 ns, with the lower values corresponding to the more electronegative F-substituted complex 3b and the higher ones to the Cl-disubstituted complex 3d. Nevertheless, these values are smaller than those observed for the reference 8-quinolinolate unsubstituted derivative 3a (0.39 and 28 ns).The calculated absorption and emission energies reproduced very well the experimental energies. The nature of the S0 → S1 transition ranged from 8-quinolinolato π–π* (intra-ligand) to mixed π–π* 8-quinolinolato and inter-ligand charge transfer in 3a and monosubstituted 3b,c. However, the transition in the Cl disubstituted 3d complex exhibited only an inter-ligand charge transfer character between the orthogonal ligands.
Time-resolved luminescence measurements show that complexes 3a–d and 4a–d exhibit delayed fluorescence (DF) in ZEONEX 480R films. The mechanism behind this luminescence behaviour is demonstrated to be TTA rather than TADF, as evidenced by laser fluence experiments. We also argue that the calculated energy gap between S1 and T1 (ΔEST) of ca.1 eV, as calculated from DFT, is too large to consider TADF as the possible reason for the observed delayed fluorescence.
Finally, we fabricated organic light-emitting diode (OLED) devices displaying green-blue and green electroluminescence. The best performing OLED using emitter 3a displays an external quantum efficiency (EQE) of 3.3% and a maximum luminance (Lmax) of 6300 cd m−2.
Experimental section
General
All experiments dealing with air- and/or moisture-sensitive materials were carried out under an inert atmosphere using a dual vacuum/nitrogen line and standard Schlenk and glovebox techniques.32 Nitrogen gas was supplied by Air Liquide and purified by passage through 4 Å molecular sieves. Unless otherwise stated, all reagents were purchased from commercial suppliers (e.g. Acrös, Aldrich, Fluka, and Alfa Aesar) and used without further purification. All solvents to be used under an inert atmosphere were thoroughly deoxygenated and dehydrated before use. They were dried and purified by refluxing over a suitable drying agent followed by distillation under nitrogen. The following drying agents were used: sodium/benzophenone (for toluene, THF and diethyl ether) and calcium hydride (for n-hexane and dichloromethane). Solvents and solutions were transferred using a positive pressure of nitrogen through stainless steel cannulas and mixtures were filtered in a similar way using modified cannulae that could be fitted with glass fibre filter disks.Nuclear magnetic resonance (NMR) spectra were recorded on a Bruker Avance III 300 spectrometer at 300.130 MHz (1H), 75.468 MHz (13C), 96.2712 MHz (11B), and 282.404 (19F) or on a Bruker Avance III 400 spectrometer at 400.130 MHz (1H), 100.613 MHz (13C), 128.3478 (11B) and 376.498 (19F). Deuterated solvents were dried by storage over 4 Å molecular sieves and degassed by the freeze–pump–thaw method. Spectra were referenced internally using the residual protio solvent resonance (1H) and the solvent carbon resonance (13C) relative to tetramethylsilane (δ = 0), and referenced externally using 15% BF3·OEt2 (δ = 0) for 11B, and CFCl3 (δ = 0) for 19F. The labelling of protons and carbons of the 9-borafluoren-9-yl and substituted 8-quinolinolato moieties of complexes 3 and 4 used in the NMR assignments of this work is given in Chart 2. All chemical shifts are quoted in δ (ppm) and coupling constants are given in hertz. Multiplicities are abbreviated as follows: singlet (s), doublet (d), doublet of doublets (dd), triplet (t), triplet of doublets (td) and multiplet (m). For air- and/or moisture-sensitive materials, samples were prepared in J. Young NMR tubes in a glovebox. Elemental analyses were obtained from the IST elemental analysis services.
 | ||
| Chart 2 Labelling of protons and carbons of the 9-borafluoren-9-yl and substituted 8-quinolinolato moieties of complexes 3 and 4 used in the NMR assignments of this work. | ||
The different 8-hydroxyquinolines (i.e. 8-quinolinols) were used as received and the reagents 9-chloro-9-borafluorene (2)18 and BPh333 were prepared according to procedures reported in the literature.
Materials used for device fabrication were purchased from Sigma Aldrich {LiF (99.995%), TAPC}, Lesker {Al pellets (99.9995%)} and LUMTEC (TPBi, mCP, HAT-CN).
Syntheses
X-ray diffraction
The crystallographic data for complexes 3b, 3c, 3d, 4b and 4d were collected using graphite monochromated Mo-Kα radiation (λ = 0.71073 Å) on a Bruker AXS-KAPPA APEX II diffractometer equipped with an Oxford Cryosystem open-flow nitrogen cryostat, at 150 K, and the crystals were selected under an inert atmosphere, stored in polyfluoroether oil and mounted on a nylon loop. Cell parameters were retrieved using Bruker SMART software and refined using Bruker SAINT on all observed reflections. Absorption corrections were applied using SADABS.34 Structure solution and refinement were performed using direct methods with the programs SIR2004,35 SIR201436 and SHELXL,37 included in the package of programs WINGX-Version 2014.1.38 All hydrogen atoms were inserted in idealised positions and allowed to refine riding on the parent carbon atom, with a C–H distance of 0.95 Å for aromatic H atoms and with Uiso(H) = 1.2Ueq(C). Graphical presentations were prepared with ORTEP-3.38 The CIF file corresponding to the molecular structure of complex 3b presented B-level alerts, which were associated with a high Rint (0.248). Due to the poor diffracting power/lack of unique data of the crystal and the corresponding data, although all the atoms were correctly assigned and no twinning or disorder was found, one larger than expected residual density maximum of 1.08 e Å−3 was present close to the boron atom after the completion of the structure refinement. Nevertheless, it was possible to undoubtedly solve the molecular structure. Data were deposited at CCDC under the deposition numbers 2234859 for 3b, 2234860 for 3c, 2234861 for 3d, 2234862 for 4b and 2234863 for 4d.†
Computational studies
Density functional theory calculations23 were performed using the Amsterdam density functional program package (ADF).24 The geometries of complexes 3a–d and 4a–d were modelled after those described above and optimised without symmetry constraints. The Vosko–Wilk–Nusair39 local density approximation of the correlation energy and the PBE0 functional,40,41 including spin-orbit coupling (SOPERT),25 were used, considering solvent effects (THF) according to the COSMO model implemented in ADF. Relativistic effects were described with the ZORA approximation.42 Triple ζ Slater-type orbitals (STO) were used to describe all the electrons of H, C, B, N, and F, augmented with one set of polarization functions (ADF TZP basis set). TDDFT26 calculations were performed to calculate the absorption spectra, with the Tamm–Dancoff approximation (TDA),43 and to optimise the geometries of the first excited singlet and triplet states. The absorption spectra were also calculated in a vacuum to check the role of the polarity of the medium. Unrestricted calculations were carried out for open shell complexes. The calculated fluorescence rate constants were the reciprocal of the excited singlet state lifetimes obtained from the SOPERT calculations (SO). Dipole moments were calculated for the ground state (S0), for the Franck–Condon excited state after vertical excitation (S′1) and before molecular relaxation (the same geometry as S0 with the electronic configuration of S1), and for S1.In order to compare the results of this work with previous ones, and to probe the role of dispersion, the calculations described above (model A) were repeated with the Grimme D3 correction44 (A/D3), with the B3LYP functional45 (method B), and B3LYP with the Grimme D3 correction (B/D3) with the same TZP basis set. Another older approach used Becke's exchange46 and Perdew's47 correlation functionals, with TZ2P (two sets of polarization functions) and a small core in the gas-phase (GP). The structure obtained under these conditions was used to calculate the energy of the HOMO and LUMO in THF and dichloromethane (DCM) with COSMO. The first singlet excited states were obtained by promotion of one electron from the HOMO to the LUMO, with the same spin (T1) or opposite spins (S1) followed by geometry optimisation. The results from these calculations are presented in the ESI.† Geometries and orbitals were visualised with Chemcraft.48
Spectroscopic measurements
Measurements in THF solution were carried out as follows: absorption and fluorescence spectra of 3a–d and 4a–d solutions were recorded with an Agilent Cary 8454 UV-visible spectrophotometer and a SPEX Fluorolog 212I, respectively. The fluorescence spectra were collected with right angle geometry, in the S/R mode, and corrected for instrumental wavelength dependence. Fluorescence quantum yields were determined by comparison with the quantum yields of α-tetrathiophene (for compounds 3a and 4a) and α-pentathiophene (for compounds 3b–d and 4b–d) in dioxane at 25 °C.
The absolute fluorescence quantum yields were obtained using the following equation:
| Φf = (Pc − (1 − A) × Pb)/A × La with A = (1 − Lc/Lb), |
In many cases Pb is negligible and the equation simply becomes:
| Φf = Pc/(La − Lc) |
Using this methodology, the Φf determinations of several standard fluorophores with a known quantum yield were performed for validation purposes. The agreement found between the Φf obtained by the absolute method and the reported literature values validates the photoluminescence quantum yields determined by this absolute approach.
Further details of the use of this time resolved emission spectroscopic technique can be found in ref. 49.
Organic light-emitting diodes
OLEDs were fabricated by vacuum thermal evaporation. Pre-cleaned indium-tin-oxide (ITO) coated glass substrates with a sheet resistance of 20 Ω cm−2 and an ITO thickness of 100 nm were used. The substrates were first washed with acetone and then sonicated in acetone and isopropanol for 15 min. Substrates were dried with compressed air and transferred into an ozone-plasma generator for 6 min at full power. Thermally deposited layers were obtained using a Kurt J. Lesker Spectros II deposition system at 10−6 mbar base pressure. All organic materials and aluminium were deposited at a rate of 1 Å s−1. The LiF layer was deposited at a rate of 0.1–0.2 Å s−1. Characterisation of OLED devices was conducted in a 10 inch integrating sphere (Labsphere) connected to a Source Measure Unit (SMU, Keithley) and coupled with a spectrometer USB4000 (Ocean Optics). Further details are available in ref. 51. Devices of 4 × 2 mm pixel size were fabricated.Substances used for OLED fabrication have been purchased from suppliers indicated in parentheses: HAT-CN – dipyrazino[2,3-f:2′,3′-h]quinoxaline-2,3,6,7,10,11-hexacarbonitrile (sublimed, LUMTEC); TSBPA – 4,4′-(diphenylsilanediyl)bis(N,N-diphenylaniline) (LUMTEC); mCP – 1,3-bis(carbazol-9-yl)benzene (sublimed, LUMTEC); PO-T2T – 2,4,6-tris[3-(diphenylphosphinyl)phenyl]-1,3,5-triazine (LUMTEC); TPBi – 1,3,5-tris(1-phenyl-1H-benzimidazol-2-yl)benzene, (sublimed, LUMTEC); LiF (99.995%, Sigma Aldrich); Al pellets (99.9995%, Lesker).
The fully thermally deposited OLEDs comprised a hole injection layer: HAT-CN, a hole transport layer: TSBPA, an exciton blocking layer: mCP, a hole blocking layer: PO-T2T and an electron transport layer: TPBi, an electron injection layer: LiF and a cathode: Al. The optimised emissive layer comprised a blend host: mCP (hole transport component) and PO-T2T (electron transport component) for a balanced carrier ratio and improved charge injection into the emitter.
Conflicts of interest
There are no conflicts of interest to declare.Acknowledgements
We thank the Fundação para a Ciência e a Tecnologia (FCT) for financial support (project PTDC/QUI-QIN/31585/2017) and for a fellowship to C. B. F. (2021.05622.BD). Centro de Química Estrutural and Institute of Molecular Sciences (IMS), BioISI – Instituto de Biossistemas e Ciências Integrativas, Instituto de Telecomunicações, and IBB-Institute for Bioengineering and Biosciences acknowledge the FCT for financial support (respectively: projects UIDB/00100/2020, UIDP/00100/2020 and LA/P/0056/2020; UIDB/04046/2020 and UIDP/04046/2020; UIDB/50008/2020; and UIDB/04565/2020).References
- For example: (a) M. A. Baldo, D. F. O'Brien, Y. You, A. Shoustikov, S. Sibley, M. E. Thompson and S. R. Forrest, Nature, 1998, 395, 151–154 CrossRef CAS; (b) T. Sajoto, P. I. Djurovich, A. Tamayo, M. Yousufuddin, R. Bau, M. E. Thompson, R. J. Holmes and S. R. Forrest, Inorg. Chem., 2005, 44, 7992–8003 CrossRef CAS PubMed; (c) S. Kappaun, C. Slugovc and E. J. W. List, Int. J. Mol. Sci., 2008, 9, 1527–1547 CrossRef CAS PubMed; (d) C. S. Oh, C. W. Lee and J. Y. Lee, Dyes Pigm., 2013, 98, 372–376 CrossRef CAS; (e) A. Tronnier, A. Risler, N. Langer, G. Wagenblast, I. Münster and T. Strassner, Organometallics, 2012, 31, 7447–7452 CrossRef CAS; (f) C. W. Lee and J. Y. Lee, Adv. Mater., 2013, 25, 596–600 CrossRef CAS PubMed; (g) X.-C. Hang, T. Fleetham, E. Turner, J. Brooks and J. Li, Angew. Chem., Int. Ed., 2013, 52, 6753–6756 CrossRef CAS PubMed; (h) S. Grigalevicius, D. Tavgeniene, G. Krucaite, D. Blazevicius, R. Griniene, Y.-N. Lai, H.-H. Chiu and C.-H. Chang, Opt. Mater., 2018, 79, 446–449 CrossRef CAS; (i) Z. Zhong, X. Wang, Y. Ma, F. Peng, T. Guo, J.-X. Jiang, L. Ying, J. Wang, J. Peng and Y. Cao, Org. Electron., 2018, 57, 178–185 CrossRef CAS; (j) G. Li, D. G. Congrave, D. Zhu, Z. Su and M. R. Bryce, Polyhedron, 2018, 140, 146–157 CrossRef CAS; (k) Y.-X. Hu, X. Xia, W.-Z. He, Z.-J. Tang, Y.-L. Lv, X. Li and D.-Y. Zhang, Org. Electron., 2019, 66, 126–135 CrossRef CAS; (l) M.-C. Tang, M.-Y. Chan and V. W.-W. Yam, Chem. Rev., 2021, 121, 7249–7279 CrossRef CAS PubMed; (m) H. Amouri, Chem. Rev., 2023, 123, 230–270 CrossRef CAS PubMed.
- (a) M. Aydemir, G. Haykir, F. Türksoy, S. Gümüş, F. B. Dias and A. P. Monkman, Phys. Chem. Chem. Phys., 2015, 17, 25572–25582 RSC; (b) K. Goushi, K. Yoshida, K. Sato and C. Adachi, Nat. Photonics, 2012, 6, 253–258 CrossRef CAS; (c) T.-T. Bui, F. Goubard, M. Ibrahim-Ouali, D. Gigmes and F. Dumur, Beilstein J. Org. Chem., 2018, 14, 282–308 CrossRef CAS PubMed.
- (a) R. Delorme and F. Perrin, J. Phys. Rad. Ser., 1929, 10, 177–186 CrossRef CAS; (b) G. N. Lewis, D. Lipkin and T. T. Magel, J. Am. Chem. Soc., 1941, 63, 3005–3018 CrossRef CAS; (c) C. Parker and C. Hatchard, Trans. Faraday Soc., 1961, 57, 1894–1904 RSC.
- (a) H. Sternlicht, G. C. Nieman and G. W. Robinson, J. Chem. Phys., 1963, 38, 1326–1335 CrossRef CAS; (b) Z. Yang, Z. Mao, Z. Xie, Y. Zhang, S. Liu, J. Zhao, J. Xu, Z. Chi and M. P. Aldred, Chem. Soc. Rev., 2017, 46, 915–1016 RSC; (c) N. Chitraningrum, T.-Y. Chu, P.-T. Huang, T.-C. Wen and T.-F. Guo, Org. Electron., 2018, 62, 505–510 CrossRef CAS.
- X. Qiao and D. Ma, Mater. Sci. Eng., R, 2020, 139, 100519 CrossRef.
- (a) T. J. Penfold, F. B. Dias and A. P. Monkman, Chem. Commun., 2018, 54, 3926–3935 RSC; (b) P. L. dos Santos, J. S. Ward, P. Data, A. S. Batsanov, M. R. Bryce, F. B. Dias and A. P. Monkman, J. Mater. Chem. C, 2016, 4, 3815–3824 RSC; (c) F. B. Dias, T. J. Penfold and A. P. Monkman, Methods Appl. Fluoresc., 2017, 5, 012001 CrossRef PubMed; (d) A. Endo, M. Ogasawara, A. Takahashi, D. Yokoyama, Y. Kato and C. Adachi, Adv. Mater., 2009, 21, 4802–4806 CrossRef CAS PubMed; (e) J. Gibson, A. Monkman and T. Penfold, ChemPhysChem, 2016, 17, 2956–2961 CrossRef CAS.
- (a) D. Li, H. Zhang and Y. Wang, Chem. Soc. Rev., 2013, 42, 8416–8433 RSC; (b) D. Frath, J. Massue, G. Ulrich and R. Ziessel, Angew. Chem., Int. Ed., 2014, 53, 2290–2310 CrossRef CAS PubMed; (c) D. Suresh and P. T. Gomes, Advances in Luminescent Tetracoordinate Organoboron Compounds, in Advances in Organometallic Chemistry and Catalysis, ed. A. J. L. Pombeiro, John Wiley & Sons, Inc., Hoboken, NJ, USA, 2014, ch. 36, pp. 485–492 Search PubMed; (d) S.-F. Liu, Q. Wu, H. L. Schmider, H. Aziz, N.-X. Hu, Z. Popovic and S. Wang, J. Am. Chem. Soc., 2000, 122, 3671–3678 CrossRef CAS; (e) H.-Y. Chen, Y. Chi, C.-S. Liu, J.-K. Yu, Y.-M. Cheng, K.-S. Chen, P.-T. Chou, S.-M. Peng, G.-H. Lee, A. J. Carty, S.-J. Yeh and C.-T. Chen, Adv. Funct. Mater., 2005, 15, 567–574 CrossRef CAS; (f) C. C. Vidyasagar, B. M. M. Flores, V. M. Jiménez-Pérez and P. M. Gurubasavaraj, Mater. Today Chem., 2019, 11, 133–155 CrossRef CAS; (g) Y.-L. Rao and S. Wang, Inorg. Chem., 2011, 50, 12263–12274 CrossRef CAS PubMed; (h) Y. Wu, W. Yuan, H. Ji, Y. Qin, J. Zhang, H. Li, Y. Li, Y. Wang, Y. Sun and W. Liu, Dyes Pigm., 2017, 142, 330–339 CrossRef CAS; (i) X. Li, P. Tang, T. Yu, W. Su, Y. Li, Y. Wang, Y. Zhao and H. Zhang, Dyes Pigm., 2019, 163, 9–16 CrossRef CAS; (j) K. Dhanunjayarao, X. Mukundam, R. V. R. N. Chinta and K. Venkatasubbaiah, J. Organomet. Chem., 2018, 865, 234–238 CrossRef CAS; (k) F. Yagishita, T. Kinouchi, K. Hoshi, Y. Tezuka, Y. Jibu, T. Karatsu, N. Uemura, Y. Yoshida, T. Mino, M. Sakamoto and Y. Kawamura, Tetrahedron, 2018, 74, 3728–3733 CrossRef CAS; (l) D. Wang, Y.-P. Wan, H. Liu, D.-J. Wang and G.-D. Yin, Dyes Pigm., 2018, 149, 728–735 CrossRef CAS; (m) H. Zhang, C. Liu, J. Xiu and J. Qiu, Dyes Pigm., 2017, 136, 798–806 CrossRef CAS; (n) D. Suresh, C. S. B. Gomes, P. T. Gomes, R. E. Di Paolo, A. L. Maçanita, M. J. Calhorda, A. Charas, J. Morgado and M. T. Duarte, Dalton Trans., 2012, 41, 8502–8505 RSC. Errata: Dalton Trans., 2012, 41, 14713 and Dalton Trans., 2013, 42, 16969; (o) D. Suresh, P. S. Lopes, B. Ferreira, C. A. Figueira, C. S. B. Gomes, P. T. Gomes, R. E. Di Paolo, A. L. Maçanita, M. T. Duarte, A. Charas, J. Morgado and M. J. Calhorda, Chem. – Eur. J., 2014, 20, 4126–4140 CrossRef CAS PubMed; (p) D. Suresh, C. S. B. Gomes, P. S. Lopes, C. A. Figueira, B. Ferreira, P. T. Gomes, R. E. Di Paolo, A. L. Maçanita, M. T. Duarte, A. Charas, J. Morgado, D. Vila-Viçosa and M. J. Calhorda, Chem. – Eur. J., 2015, 21, 9133–9149 CrossRef CAS PubMed; (q) D. Suresh, B. Ferreira, P. S. Lopes, P. Krishnamoorthy, C. S. B. Gomes, A. Charas, D. Vila-Viçosa, J. Morgado, M. J. Calhorda, A. L. Maçanita and P. T. Gomes, Dalton Trans., 2016, 45, 15603–15620 RSC; (r) P. Krishnamoorthy, B. Ferreira, C. S. B. Gomes, D. Vila-Viçosa, A. Charas, J. Morgado, M. J. Calhorda, A. L. Maçanita and P. T. Gomes, Dyes Pigm., 2017, 140, 520–532 CrossRef CAS; (s) A. I. Rodrigues, C. A. Figueira, C. S. B. Gomes, D. Suresh, B. Ferreira, R. E. Di Paolo, M. J. Calhorda, D. de Sa Pereira, F. B. Dias, J. Morgado, A. L. Maçanita and P. T. Gomes, Dalton Trans., 2019, 48, 13337–13352 RSC; (t) A. I. Rodrigues, P. Krishnamoorthy, C. S. B. Gomes, N. Carmona, R. E. Di Paolo, P. Pander, J. Pina, J. S. Seixas de Melo, F. B. Dias, M. J. Calhorda, A. L. Maçanita, J. Morgado and P. T. Gomes, Dalton Trans., 2020, 49, 10185–10202 RSC; (u) P. Krishnamoorthy, A. I. Rodrigues, C. B. Fialho, C. S. B. Gomes, B. Ferreira, A. Charas, D. Vila-Viçosa, J. M. S. S. Esperança, P. Pander, F. B. Dias, M. J. Calhorda, A. L. Maçanita, J. Morgado and P. T. Gomes, Inorg. Chem. Front., 2021, 8, 3960–3983 RSC; (v) A. C. Murali, P. Nayak and K. Venkatasubbaiah, Dalton Trans., 2022, 51, 5751–5771 RSC.
- (a) Y.-J. Shiu, Y.-C. Cheng, W.-L. Tsai, C.-C. Wu, C.-T. Chao, C.-W. Lu, Y. Chi, Y.-T. Chen, S.-H. Liu and P.-T. Chou, Angew. Chem., Int. Ed., 2016, 55, 3017–3021 CrossRef CAS PubMed; (b) B. M. Bell, T. P. Clark, T. S. De Vries, Y. Lai, D. S. Laitar, T. J. Gallagher, J.-H. Jeon, K. L. Kearns, T. McIntire, S. Mukhopadhyay, H.-Y. Na, T. D. Paine and A. A. Rachford, Dyes Pigm., 2017, 141, 83–92 CrossRef CAS; (c) Y.-J. Shiu, Y.-T. Chen, W.-K. Lee, C.-C. Wu, T.-C. Lin, S.-H. Liu, P.-T. Chou, C.-W. Lu, I.-C. Cheng, Y.-J. Lien and Y. Chi, J. Mater. Chem. C, 2017, 5, 1452–1462 RSC; (d) K. Matsuo and T. Yasuda, Chem. Commun., 2017, 53, 8723–8726 RSC; (e) M. Stanoppi and A. Lorbach, Dalton Trans., 2018, 47, 10394–10398 RSC; (f) P. Li, H. Chan, S.-L. Lai, M. Ng, M.-Y. Chan and V. W.-W. Yam, Angew. Chem., Int. Ed., 2019, 58, 9088–9094 CrossRef CAS PubMed.
- S. S. Kothavale and J. Y. Lee, Adv. Opt. Mater., 2020, 8, 2000922 CrossRef CAS.
- (a) T. N. Singh-Rachford, A. Haefele, R. Ziessel and F. N. Castellano, J. Am. Chem. Soc., 2008, 130, 16164–16165 CrossRef CAS PubMed; (b) F. Deng, A. J. Francis, W. W. Weare and F. N. Castellano, Photochem. Photobiol. Sci., 2015, 14, 1265–1270 CrossRef CAS PubMed.
- J. E. Douglass, J. Org. Chem., 1961, 26, 1312–1313 CrossRef CAS.
- Q. Wu, M. Esteghamatian, N.-X. Hu, Z. Popovic, G. Enright, Y. Tao, M. D'Iorio and S. Wang, Chem. Mater., 2000, 12, 79–83 CrossRef CAS.
- S. Kappaun, S. Rentenberger, A. Pogantsch, E. Zojer, K. Mereiter, G. Trimmel, R. Saf, K. C. Möller, F. Stelzer and C. Slugovc, Chem. Mater., 2006, 18, 3539–3547 CrossRef CAS.
- (a) J. Ugolotti, S. Hellstrom, G. J. P. Britovsek, T. S. Jones, P. Hunt and A. J. P. White, Dalton Trans., 2007, 1425–1432 RSC; (b) Y. Nagata and Y. Chujo, Macromolecules, 2008, 41, 2809–2813 CrossRef CAS; (c) F. Cheng, E. M. Bonder, A. Doshi and F. Jäkle, Polym. Chem., 2012, 3, 596–600 RSC; (d) G. Wesela-Bauman, L. Jastrzębski, P. Kurach, S. Lulinski, J. Serwatowski and K. Woźniak, J. Organomet. Chem., 2012, 711, 1–9 CrossRef CAS; (e) G. Wesela-Bauman, P. Ciećwierz, K. Durka, S. Luliński, J. Serwatowski and K. Woźniak, Inorg. Chem., 2013, 52, 10846–10859 CrossRef CAS PubMed.
- Y. Cui, Q.-D. Liu, D.-R. Bai, W.-L. Jia, Y. Tao and S. Wang, Inorg. Chem., 2005, 44, 601–609 CrossRef CAS PubMed.
- K. Durka, I. Głowacki, S. Luliński, B. Łuszczyńska, J. Smętek, P. Szczepanik, J. Serwatowski, U. E. Wawrzyniak, G. Wesela-Bauman, E. Witkowska, G. Wiosna-Sałyga and K. Woźniak, J. Mater. Chem. C, 2015, 3, 1354–1364 RSC.
- M. Urban, K. Durka, P. Górka, G. Wiosna-Sałyga, K. Nawara, P. Jankowski and S. Luliński, Dalton Trans., 2019, 48, 8642–8663 RSC.
- (a) P. C. J. Kamer, G. P. F. van Strijdonck, J. N. H. Reek and P. W. N. M. van Leeuwen, Hydroformylation and Hydroxycarbonylation of Alkenes; Formation of C–N and C–C Bonds, ed. W. A. Herrmann, in Synthetic Methods of Organometallic and Inorganic Chemistry, Georg Thieme Verlag Stuttgart, New York, 2002, vol. 10, ch. 2, p. 54 Search PubMed; (b) S. Biswas, I. M. Oppel and H. F. Bettinger, Inorg. Chem., 2010, 49, 4499–4506 CrossRef CAS PubMed.
- (a) Z. M. Hudson and S. Wang, Acc. Chem. Res., 2009, 42, 1584–1596 CrossRef CAS PubMed; (b) P. Chen, R. A. Lalancette and F. Jäkle, Angew. Chem., Int. Ed., 2012, 51, 7994–7998 CrossRef CAS PubMed; (c) M. Halik, W. Wenseleers, C. Grasso, F. Stellacci, E. Zojer, S. Barlow, J. L. Bredas, J. W. Perry and S. R. Marder, Chem. Commun., 2003, 1490–1491 RSC; (d) C. D. Entwistle and T. B. Marder, Chem. Mater., 2004, 16, 4574–4585 CrossRef CAS; (e) C. D. Entwistle and T. B. Marder, Angew. Chem., Int. Ed., 2002, 41, 2927–2931 CrossRef CAS; (f) R. Bernard, D. Cornu, J. P. Scharff, R. Chiriac and P. Miele, Inorg. Chem., 2006, 45, 8743–8748 CrossRef CAS PubMed; (g) R. Bernard, D. Cornu, P. L. Baldeck, J. Caslavsky, J. M. Letoffe, J. P. Scharff and P. Miele, Dalton Trans., 2005, 3065–3071 RSC; (h) F. Jäkle, Chem. Rev., 2010, 110, 3985–4022 CrossRef PubMed.
- H. Höpfl, V. Barba, G. Vargas, N. Farfan, R. Santillan and D. Castillo, Chem. Heterocycl. Compd., 1999, 35, 912–927 CrossRef.
- N. N. Greenwood and A. Earnshaw, Chemistry of the Elements, Elsevier Butterworth-Heinemann, 2nd edn, 1997 Search PubMed.
- S. Alvarez, Dalton Trans., 2013, 42, 8617–8636 RSC.
- R. G. Parr and W. Yang, Density Functional Theory of Atoms and Molecules, Oxford University Press, New York, 1989 Search PubMed.
- (a) G. te Velde, F. M. Bickelhaupt, S. J. A. van Gisbergen, C. Fonseca Guerra, E. J. Baerends, J. G. Snijders and T. Ziegler, J. Comput. Chem., 2001, 22, 931–967 CrossRef CAS; (b) C. Fonseca Guerra, J. G. Snijders, G. te Velde and E. J. Baerends, Theor. Chem. Acc., 1998, 99, 391–403 Search PubMed; (c) ADF2013, SCM, Theoretical Chemistry, Vrije Universiteit, Amsterdam, The Netherlands, https://www.scm.com Search PubMed.
- F. Wang and T. Ziegler, J. Chem. Phys., 2005, 123, 154102 CrossRef PubMed.
- (a) S. J. A. van Gisbergen, J. A. Groeneveld, A. Rosa, J. G. Snijders and E. J. Baerends, J. Phys. Chem. A, 1999, 103, 6835–6844 CrossRef CAS; (b) A. Rosa, J. Baerends, S. J. A. van Gisbergen, E. van Lenthe, J. A. Groeneveld and J. G. Snijders, J. Am. Chem. Soc., 1999, 121, 10356–10365 CrossRef CAS; (c) S. J. A. van Gisbergen, A. Rosa, G. Ricciardi and E. J. Baerends, J. Chem. Phys., 1999, 111, 2499–2507 CrossRef CAS; (d) S. J. A. van Gisbergen, J. G. Snijders and E. J. Baerends, Comput. Phys. Commun., 1999, 118, 119–138 CrossRef CAS; (e) J. Moussa, L.-M. Chamoreau, A. D. Esposti, M. P. Gullo, A. Barbieri and H. Amouri, Inorg. Chem., 2014, 53, 6624–6633 CrossRef CAS PubMed.
- For example: (a) L. F. Vieira Ferreira, J. C. Netto-Ferreira, I. V. Khmelinskii, A. R. Garcia and S. M. B. Costa, Langmuir, 1995, 11, 231–236 CrossRef CAS; (b) A. Belay, E. Libnedengel, H. K. Kima and Y.-H. Hwang, Luminescence, 2016, 31, 118–126 CrossRef CAS PubMed.
- M. J. Calhorda, P. T. Gomes, C. B. Fialho and T. C. F. Cruz, unpublished results.
- M. S. Islam, C. M. B. Cordeiro, M. J. Nine, J. Sultana, A. L. S. Cruz, A. Dinovitser, B. W.-H. Ng, H. Ebendorff-Heidepriem, D. Losic and D. Abbott, IEEE Access, 2020, 8, 97204–97214 Search PubMed.
- M. Chapran, P. Pander, M. Vasylieva, G. Wiosna-Salyga, J. Ulanski, F. B. Dias and P. Data, ACS Appl. Mater. Interfaces, 2019, 11, 13460–13471 CrossRef CAS PubMed.
- M. Vasylieva, P. Pander, B. K. Sharma, A. M. Shaikh, R. M. Kamble, F. B. Dias, M. Czichy and P. Data, Electrochim. Acta, 2021, 384, 138347 CrossRef CAS.
- For example: (a) P. T. Gomes, M. L. H. Green and A. M. Martins, J. Organomet. Chem., 1998, 551, 133–138 CrossRef CAS; (b) M. M. Marques, S. Fernandes, S. G. Correia, J. R. Ascenso, S. Caroço, P. T. Gomes, J. F. Mano, S. G. Pereira, T. Nunes, A. R. Dias, M. D. Rausch and J. C. W. Chien, Macromol. Chem. Phys., 2000, 201, 2464–2468 CrossRef CAS; (c) R. Garçon, C. Clerk, J.-P. Gesson, J. Bordado, T. Nunes, S. Caroço, P. T. Gomes, M. E. Minas da Piedade and A. P. Rauter, Carbohydr. Polym., 2001, 45, 123–127 CrossRef; (d) V. Rosa, P. J. Gonzalez, T. Avilés, P. T. Gomes, R. Welter, A. C. Rizzi, M. C. G. Passeggi and C. D. Brondino, Eur. J. Inorg. Chem., 2006, 4761–4769 CrossRef CAS; (e) C. S. B. Gomes, P. T. Gomes and M. T. Duarte, J. Organomet. Chem., 2014, 760, 101–107 CrossRef CAS.
- R. Köster, P. Binger, W. Fenzl, E. R. Wonchoba and G. W. Parshall, Inorg. Synth., 1974, 15, 134–136 Search PubMed.
- G. M. Sheldrick, SADABS, Program for Empirical Absorption Correction, University of Göttingen, Göttingen, Germany, 1996 Search PubMed.
- M. C. Burla, R. Caliandro, M. Camalli, B. Carrozzini, G. L. Cascarano, L. De Caro, C. Giacovazzo, G. Polidori and R. Spagna, J. Appl. Crystallogr., 2005, 38, 381–388 CrossRef CAS.
- M. C. Burla, R. Caliandro, B. Carrozzini, G. L. Cascarano, C. Cuocci, C. Giacovazzo, M. Mallamo, A. Mazzone and G. Polidori, J. Appl. Crystallogr., 2015, 48, 306–309 CrossRef CAS.
- (a) SHELXL: G. M. Sheldrick, Acta Crystallogr., Sect. C: Struct. Chem., 2015, 71, 3–8 Search PubMed; (b) C. B. Hübschle, G. M. Sheldrick and B. Dittrich, J. Appl. Crystallogr., 2011, 44, 1281–1284 CrossRef PubMed.
- L. J. Farrugia, J. Appl. Crystallogr., 2012, 45, 849–854 CrossRef CAS.
- S. H. Vosko, L. Wilk and M. Nusair, Can. J. Phys., 1980, 58, 1200–1211 CrossRef CAS.
- M. Ernzerhof and G. Scuseria, J. Chem. Phys., 1999, 110, 5029–5036 CrossRef CAS.
- C. Adamo and V. Barone, J. Chem. Phys., 1999, 110, 6158–6170 CrossRef CAS.
- E. van Lenthe, A. Ehlers and E.-J. Baerends, J. Chem. Phys., 1999, 110, 8943–8953 CrossRef CAS.
- S. Hirata and M. Head-Gordon, Chem. Phys. Lett., 1999, 314, 291–299 CrossRef CAS.
- S. Grimme, J. Comput. Chem., 2004, 25, 1463–1473 CrossRef CAS PubMed.
- M. Reiher, O. Salomon and B. A. Hess, Theor. Chem. Acc., 2001, 107, 48–55 Search PubMed.
- A. D. Becke, J. Chem. Phys., 1998, 109, 2092–2098 CrossRef CAS.
- (a) J. P. Perdew, Phys. Rev. B: Condens. Matter Mater. Phys., 1986, 33, 8822–8824 CrossRef PubMed; (b) J. P. Perdew , Erratum: Phys. Rev. B, 1986, 34, 7406–7406.
- Chemcraft Program. https://www.chemcraftprog.com/index.html. January 2023.
- (a) L. F. Vieira Ferreira, I. F. Machado, A. Gama, F. Lochte, R. P. Socoteanu and R. Boscencu, J. Photochem. Photobiol., A, 2020, 387, 112152 CrossRef CAS; (b) D. P. Ferreira, D. S. Conceicão, F. Fernandes, T. Sousa, R. C. Calhelha, I. C. F. R. Ferreira, P. F. Santos and L. F. Vieira Ferreira, J. Phys. Chem. B, 2016, 120, 1212–1220 CrossRef CAS PubMed; (c) A. Barbieri and G. Accorsi, EPA Newsl., 2006, 26–34 CAS.
- T. J. F. Branco, A. M. B. do Rego, I. F. Machado and L. F. Vieira Ferreira, J. Phys. Chem. B, 2005, 109, 15958–15967 CrossRef CAS PubMed.
- D. de Sa Pereira, A. P. Monkman and P. Data, J. Visualized Exp., 2018, e56593 Search PubMed.
Footnote |
| † Electronic supplementary information (ESI) available. CCDC 2234859–2234863. For ESI and crystallographic data in CIF or other electronic format see DOI: https://doi.org/10.1039/d3dt00496a |
| This journal is © The Royal Society of Chemistry 2023 |