
 Open Access Article
 This Open Access Article is licensed under a Creative Commons Attribution-Non Commercial 3.0 Unported Licence
Multi-technique structural analysis of zinc carboxylates (soaps)†
Molly
Wagner
 *abc,
Roberta
Pigliapochi
ade,
Valeria
Di Tullio
f,
Jaclyn
Catalano
g,
Nicholas
Zumbulyadis
a,
Silvia A.
Centeno
d,
Xiaoling
Wang
h,
Kuizhi
Chen
h,
Ivan
Hung
h,
Zhehong
Gan
h,
Michael R.
Dworzak
a,
Glenn P. A.
Yap
a and
Cecil
Dybowski
*a
*abc,
Roberta
Pigliapochi
ade,
Valeria
Di Tullio
f,
Jaclyn
Catalano
g,
Nicholas
Zumbulyadis
a,
Silvia A.
Centeno
d,
Xiaoling
Wang
h,
Kuizhi
Chen
h,
Ivan
Hung
h,
Zhehong
Gan
h,
Michael R.
Dworzak
a,
Glenn P. A.
Yap
a and
Cecil
Dybowski
*a
aDepartment of Chemistry and Biochemistry, University of Delaware, Newark, Delaware 19716, USA. E-mail: mollyaw@udel.edu; dybowski@udel.edu
bUS Department of Energy, Ames Laboratory, Ames, Iowa 50010, USA
cDepartment of Chemistry, Iowa State University, Ames, Iowa 50010, USA
dDepartment of Scientific Research, The Metropolitan Museum of Art, New York, New York 10028, USA
eDepartment of Physics, CUNY-City College of New York, New York, NY 10031, USA
fInstitute of Heritage Science, National Council of Research, Rome, Italy 00016
gDepartment of Chemistry and Biochemistry, Montclair State University, Montclair, New Jersey, USA
hNational High Magnetic Field Laboratory, Tallahassee, Florida 32310, USA
First published on 15th April 2023
Abstract
A series of medium- and long-chain zinc carboxylates (zinc octanoate, zinc nonanoate, zinc decanoate, zinc undecanoate, zinc dodecanoate, zinc pivalate, zinc stearate, zinc palmitate, zinc oleate, and zinc azelate) was analyzed by ultra-high-field 67Zn NMR spectroscopy up to 35.2 T, as well as 13C NMR and FTIR spectroscopy. We also report the single-crystal X-ray diffraction structures of zinc nonanoate, zinc decanoate, and zinc oleate—the first long-chain carboxylate single-crystals to be reported for zinc. The NMR and X-ray diffraction data suggest that the carboxylates exist in three distinct geometric groups, based on structural and spectroscopic parameters. The ssNMR results presented here present a future for dynamic nuclear polarization (DNP)-NMR-based minimally invasive methods for testing artwork for the presence of zinc carboxylates.
I. Introduction
Carboxylates of polyvalent metals, colloquially referred to as metallic soaps, are of significant commercial and scientific interest. Palmitates, stearates, oleates, and linoleates of lead, zinc, and aluminum are common additives to paints, varnishes, and lacquers.1–4 Metal salts of fatty acids are widely used as precursors in the formation of colloidal semiconductor nanocrystals.5 Soaps of certain heavy metals, such as those of zinc, form via saponification in oil paintings and are of concern to cultural heritage conservators.6–12Zinc oxide is of particular interest to the technological/industrial sectors and art conservation community. ZnO has many applications such as gas detection for environmental protection,13 modulation of light-emitting diodes,14 and as nanostructures in biomedical sensors.15 Zinc oxide is a widely used pigment commonly known as zinc white.16 Although zinc oxide has been known since antiquity as a byproduct of brass production, it was not used as a pigment until the late 18th century when concerns over the toxicity of its primary predecessor, lead white, began to grow.17 Unlike technological applications that necessitate strict control of composition and environment, paint systems present often unknown environments regarding the form and composition of the zinc components that necessitates further study.
Paintings are non-equilibrium heterogeneous multilayer systems composed of various reactive organic and inorganic materials. Environmental conditions such as fluctuations in temperature (T), relative humidity (RH), and exposure to light, particularly UV, or treatment with aqueous or organic cleaning agents may trigger chemical changes, resulting in deterioration of the paints.18–23 Metal soap formation is the cause of widespread visible deterioration of oil paintings dating from the 15th century to the modern era, including iconic works such as the Anatomy Lesson of Dr. Nicolaes Tulp by Rembrandt van Rijn from the 17th century24 and Couple with Their Heads Full of Clouds by Salvador Dali from the early 20th century.25
Traditional oil paints are basically composed of pigments mixed with a binder. Traditional oil-based binders consist of drying oils, most commonly linseed oil.26 Linseed oil, derived from the flax plant, consists of a mixture of triglycerides containing both unsaturated and saturated fatty acids. A typical composition of fresh pressed linseed oil is shown in Table 1; however composition can vary due to geographic origin of the flax plant.26 The polymerization of unsaturated acyl chains via cross-linking reactions is a relatively rapid process and the paint layer cures (dries) within weeks.27 The hydrolysis of triglyceride ester linkages is a much slower process. Saturated components like palmitic and stearic acid are not immobilized by cross-linking reactions, but rather are “free” to move about the paint matrix. Saponification occurs when these free fatty acids react with metal ions that have leached into the paint matrix or directly from pigment particles or additives. The soaps then aggregate and can form microscopic inclusions that deform the paint layers from within, or erupt through the paint surface as protrusions, or form on the surface as hazy films, or form between paint layers causing delamination and flaking.28–31
| Fatty acid | Percentage |
|---|---|
| Linolenic acid | 57.6 |
| Oleic acid | 17.0 |
| Linoleic acid | 16.4 |
| Palmitic acid | 5.9 |
| Stearic acid | 3.1 |
We32–35 and others36–38 have previously shown that one may identify and quantify lead soaps produced in paints containing lead white, 2PbCO3·Pb(OH)2, and pigments such as lead tin yellow type I (PbSnO4) via solid-state 207Pb NMR spectroscopy, to specify the chemical structure of the lead-containing pigments and soaps, as well as to monitor their reactions with the linseed oil binder. Barannikov et al. have utilized a multi-technique analysis to assess the structure and reactivity of mercury soaps to model paintings containing cinnabar (HgS).39 In this report, we provide the first 67Zn NMR spectra of pure zinc soaps, demonstrating that high-field 67Zn solid-state spectroscopy of soaps is an analytical technique to quantify and follow the formation of zinc soaps in paintings. 67Zn (I = 5/2) is a low-γ quadrupole nuclide with relatively low natural abundance (4.1%) and large quadrupolar moment (Q = 0.122 × 10⁻²⁸ m2), which results in low sensitivity and broad resonances. Despite these difficulties, solid-state NMR studies of metallic zinc,40 zinc salts,41–44 organozinc complexes,45,46 proteins,47,48 and MOFs49,50 have been reported. Although the interest in zinc carboxylates has been growing, there is a lack of single-crystal structural data for such compounds. Crystal growth of these compounds is difficult due to their low solubilities and long carboxylate chains. Furthermore, when crystals are produced, they are often small, thin, fragile plates that are both hard to handle and challenging to mount. We report the first single-crystal X-ray-determined structures of zinc nonanoate, zinc decanoate, and zinc oleate, representative of the distinct groups in which these solid structures may form.
II. Experimental
Synthesis of materials
Zinc carboxylates of octanoic (C8), nonanoic (C9), decanoic (C10), undecanoic (C11), dodecanoic (C12), hexadecenoic (palmitic, C16), octadecanoic (stearic, C18), (9Z)-octadecenoic (oleic, Z-C18), nonanedioic (azelaic, Aze) and 2,2-dimethylpropanoic (pivalic, Piv) acids were synthesized via methods adapted from previously established protocols.18,32,51,52 Typically, an appropriate acid was dissolved in 50 mL (C8, C9, Z-C18, Az) or 100 mL (C10, C11, C12, C18) of ethanol, or 50 mL water (Piv). This solution was mixed with an equimolar amount (5.0 mmol) of NaOH (1.0 M solution). The solution was heated to 70 °C. ZnCl2 (in excess, dissolved in 50 mL water) was added to the reaction flask, at which point the appearance of the solution abruptly changed and a flocculant precipitate agglomerated at the surface of the solution. The solution was heated at 70 °C for 30–60 minutes. The precipitate was filtered and washed with water, ethanol, methanol, and acetone. All resulting materials, except Piv, were dried overnight at 40 °C and recrystallized in ethanol. The resulting material from Piv was washed with water, ethanol, and methanol, then dried overnight at 40 °C. The starting chemicals were purchased from Sigma Aldrich (zinc chloride: purity grade ≥98%; octanoic acid: purity grade 98%; nonanoic acid: purity grade ≥97%; decanoic acid: purity grade ≥98%; undecanoic acid: purity grade 98%; dodecanoic acid: purity grade ≥99%; palmitic acid: purity grade 98%; oleic acid: purity grade 90%; stearic acid: purity grade 95%; 2,2-dimethylpropanoic acid: purity grade 99%), Fisher Scientific (sodium hydroxide: purity grade 99.99%), Acros Organics (azelaic acid, purity grade >98%), and Decon Labs (ethanol: purity grade >99.2%).Analysis of materials
The purity of each compound was verified by attenuated total reflection infrared spectroscopy (ATR-FTIR) and powder X-ray diffraction (PXRD) analysis. The FTIR measurements were carried out with a Thermo Nicolet Nexus 470 FTIR spectrometer with a spectral resolution of 4 cm−1. The PXRD measurements were performed using a Bruker D8 XRD (LynxEye position-sensitive detector) operating with a Cu Kα1 X-ray generator (λ = 1.54 Å) with a 40 kV beam voltage and 40 mA current. The samples were not rotated during measurement and were obtained with Bragg Brentano geometry.Single-crystal X-ray diffraction
X-ray diffraction structures of zinc nonanoate, zinc decanoate, and zinc oleate were determined on single crystals grown in the laboratory through slow evaporation of solvent. Zinc decanoate was recrystallized from methanol. Zinc nonanoate and zinc oleate were recrystallized from ethanol. Crystals were mounted in inert oil. The crystal structures were analyzed in a manner similar to that of lead nonanoate33 and lead octanoate.53 Crystals were mounted using viscous oil onto a plastic mesh and cooled to the data collection temperatures, 150 K. Data were collected on a Bruker-AXS diffractometer with Cu-Kα radiation (λ = 1.54178 Å) focused with Goebel mirrors for zinc oleate, and on a Bruker-AXS D8 Venture Photon diffractometer with Cu-Kα radiation (λ = 1.54178 Å) focused with Goebel mirrors for zinc nonanoate and zinc decanoate. Unit cell parameters were obtained from 48 data frames, 2° ω, from different sections of the Ewald sphere or from 180° ω fast scans (1° s−1).54 The systematic absences in the diffraction patterns were uniquely consistent with Pc or P2/c for zinc oleate and zinc nonanoate; whereas the systematic absences in the pattern gave possible structures for zinc decanoate in C2, Cm or C2/m. In each case, an exhaustive exploration of the data uniquely yielded chemically reasonable and computationally stable results only with the space groups Pc for zinc oleate and zinc nonanoate, and C2 for zinc decanoate. The data were treated with multi-scan absorption corrections.54 The structures were solved using intrinsic phasing methods55 and refined with full-matrix, least-squares procedures on F2.3 Zinc decanoate and zinc nonanoate were refined as 82/18, and 91/9 inversion twinned data sets, respectively. All non-H atoms were refined with anisotropic displacement parameters. H-atoms were constrained to idealized positions with isotropic parameters based on their attached atoms. Atomic scattering factors were contained in the SHELXTL program library.56 The CIFs have been deposited at the Cambridge Structural Database under CCDC 2088849 for zinc oleate, 2088850 for zinc decanoate, and 2088851 for zinc nonanoate.†NMR spectroscopy
Zinc-67 NMR spectra were recorded with Bruker Avance NEO consoles and 3.2 mm probes designed and built at the National High Magnetic Field Laboratory (NHMFL) in Tallahassee, Florida, USA. Spectra at 35.2 T were acquired using the NHMFL series-connected hybrid (SCH) magnet at a frequency of ν0(67Zn) = 93.87 MHz. Spectra at 19.6 T were acquired on a 31 mm bore superconducting magnet at a frequency of ν0(67Zn) = 52.02 MHz. The spectra were recorded at ambient temperature, with either static powder samples or magic-angle spinning (MAS) at 15.625 kHz, and were externally referenced to a saturated solution of Zn(NO3)2 in D2O with δiso = 0 by using the frequency ratios of 17O in tap water and 67Zn reported in the IUPAC recommendations.57 Spectra for ZnC8, ZnC9, and ZnC16 were obtained using a QCPMG sequence with a 4 and 8 μs π/2- and π-pulses and a six-rotor period interpulse delay τ = 640 μs and a recycle delay of 0.5 s. The remaining spectra were obtained with a WURST-QCPMG sequence. For remaining spectra, the π/2- and π-pulses were increased to 5 and 10 μs, respectively, with a WURST pulse applied before the QCPMG for signal enhancement. The WURST pulse was placed at +350 kHz frequency offset with sweep width equal to the MAS frequency of 15.635 kHz (or 16 kHz for ZnPIV) in ∼2 ms. The recycle delay was decreased to 0.2 s. The number of scans varied by sample and ranged from 256 for PIV to 327![[thin space (1/6-em)]](https://www.rsc.org/images/entities/char_2009.gif) 680 for AZE.
680 for AZE.
Fitting of the spikelet patterns was carried out with Ssnake, an open-source NMR data processing software specifically aimed at solid-state NMR.58 These compounds are dominated by quadrupole interactions. Visual fits were determined using SOLA in TopSpin 4.1.4 to establish a starting point for the quadrupole coupling constant (Cq), asymmetry parameter (ηQ), and the isotropic chemical shift (δiso) values. Refinement of the initial parameters were carried out using the quadrupole fitting method in Ssnake. Fitting simulations were carried out until the values remained constant for 5 iterations. For figures, the line shapes of the Ssnake fitting parameters were simulated with solid line shape analysis (SOLA) in TopSpin v4.1. Comparison of the simulated spectra with the envelope of spikelets indicates only one zinc center per unit cell.
Cross polarization magic-angle-spinning (CPMAS) sequences similar to those used for lead soap analysis were used for carbon-13 analysis.32,34 Carbon-13 NMR analyses were performed on a spectrometer with a Bruker AVIII console and a triple resonance 3.2 mm Z-GRD MAS probe. 13C spectra acquired at 14.1 T at a frequency of ν0(1H) = 599.78 MHz, ν0(13C) = 150.81 MHz at 295K with MAS at 14.0 kHz and were externally referenced through adamantane.59 Additional spectra was required for zinc undecanoate and zinc oleate to resolve the doublet in the carboxylate region. These spectra were obtained on a Bruker AVIII console and a 4.0 mm HX MAS probe at 11.7 T at a frequency of ν0(1H) = 500.13 MHz, ν0(13C) = 125.75 MHz at 255K with MAS at 10.0 kHz, and externally referenced to adamantane. Acquisition parameters for these experiments included 1024 scans, 2 ms contact times, 5 s recycle delays, 13C pulse width 2.3 μs, and proton decoupling at 70 kHz.
III. Results and discussion
X-ray diffraction structures
The structures determined by single-crystal X-ray diffraction data for a number of short-chain zinc soaps have been reported.60–67 (Table 2) The local structure around the zinc ion in these structures is nearly tetrahedral, and the first coordination sphere consists of oxygens of four different carbonyl groups. Each carbonyl ligand forms a bidentate bridge with two zinc atoms in a syn–anti arrangement. Variations in the Zn–O bond length indicate an unsymmetrical bonding environment around the zinc centers. Through FTIR spectroscopy as well as single-crystal and powder X-ray diffraction, Taylor et al.80 predicted at least two packing arrangements of hydrocarbon chains in the lattice, with the groups being characteristic of chains with eight or fewer carbons and chains with nine or more carbons. Further discussion of FTIR analysis is presented in the next section. Our single-crystal data presented in Table 3 indicate that nonanoate crystallizes in the monoclinic group Pc, the same space group reported for the octanoate,61 indicating that these two compounds have similar packing arrangements.| Material | Unit formula | Space group | β | Zn–O (Å) | Cell volume (Å3) | Cell parameters (Å) | Ref. |
|---|---|---|---|---|---|---|---|
| Zinc acetate | Zn(C2H3O2)2 | C2/c | 99.49 | 1.952, 1.960, 1.949, 1.965 | 1325.3(3) | a = 30.237(2) | 60 |
| b = 4.799(1) | |||||||
| c = 9.260(1) | |||||||
| Zinc propionate | Zn(C3H5O2)2 | Pna21 | 90 | 1.961, 1.977, 1.939, 1.948 | 849.7(1) | a = 9.2862(9) | 62 |
| b = 4.7937(4) | |||||||
| c = 19.0871(19) | |||||||
| Zinc butanoate | Zn(C4H7O2)2 | P21/c | 90.08 | — | 1056(2) | a = 23.48(3) | 63 |
| b = 4.795(4) | |||||||
| c = 9.380(9) | |||||||
| Zinc pentanoate | Zn(C5H9O2)2 | P21/a | 104.256 | 1.950, 1.947, 1.966, 1.963 | 1267.5(5) | a = 9.389(2) | 64 |
| b = 4.7820(10) | |||||||
| c = 29.126(7) | |||||||
| Zinc hexanoate | C24H44O8Zn2 | P1c1 | 93.73 | 1.972, 1.947, 1.917, 1.945 | 1439.5(3) | a = 32.309(4) | 65 |
| b = 4.7865(6) | |||||||
| c = 9.3292(13) | |||||||
| 1.975, 1.973, 1.980, 1.948 | |||||||
| Zinc heptanoate | Zn(C7H13O2)2 | Pbc21 | 90 | 1.920, 1.946, 1.975, 1.976 | 1649.7(4) | a = 4.7651(6) | 67 |
| b = 9.3404(15) | |||||||
| c = 37.066(6) | |||||||
| Zinc octanoate | Zn(C8H15O2)2 | Pc | 101.343 | 1.965, 1.966, 1.971, 1.988 | 897.78(1) | a = 21.093(2) | 61 |
| b = 4.6905 | |||||||
| c = 9.2544(9) |
| Zinc(II) nonanoate | Zinc(II) decanoate | Zinc(II) oleate | |
|---|---|---|---|
| Chemical formula | Zn(C9H17O2)2 | Zn(C10H19O2)2 | Zn(C18H33O2)2 |
| Formula weight, g mol−1 | 379.82 | 407.87 | 1010.61 |
| Temperature, K | 100(2) | 100(2) | 150(2) |
| Crystal system | Monoclinic | Monoclinic | Monoclinic |
| Space group | Pc | C2 | Pc |
| Cell dimensions | |||
| a, Å | 23.001(3) | 7.7771(6) | 41.827(3) |
| b, Å | 4.6615(7) | 5.5309(4) | 4.6881(3) |
| c, Å | 9.2225(14) | 24.5099(17) | 9.2475(5) |
| α, ° | 90 | 90 | 90 |
| β, ° | 95.957(3) | 92.418(3) | 90.714(4) |
| γ, ° | 90 | 90 | 90 |
| Volume, Å3 | 983.5(3) | 1053.34(13) | 1813.2(2) |
| Z | 2 | 2 | 2 |
| ρ calc, g cm−3 | 1.283 | 1.28 | 1.151 |
| μ/mm−1 | 1.860 | 1.1771 | 1.190 |
| F(000) | 408.0 | 440.0 | 688.0 |
| Reflections collected | 7412 | 6074 | 21258 |
| Independent collections | 2695 | 1839 | 6535 |
| Data/restraints/parameters | 2695/2/211 | 1839/1/116 | 6535/2/372 |
| Goodness-of-fit | 1.132 | 1.196 | 1.044 |
| R [I ≥ 2σ (I)] R1/wR2 | 0.0480/0.1357 | 0.0337/0.0918 | 0.0761/0.1977 |
| R indexes [all data] R1/wR2 | 0.0483/0.1359 | 0.0344/0.0934 | 0.0811/0.2016 |
| Absolute structure parameter | 0.09(8) | 0.18(6) | 0.01(5) |
| CCDC | 2088851 | 2088850 | 2088849 |
Interestingly, we found that the oleate also crystallizes in the monoclinic Pc group. The structures are non-centrosymmetric, characterized by two crystallographically independent chains parallel to the ac plane. No evidence of interdigitation of sheets, as suggested by Nelson et al.,68 was found for the nonanoate or the oleate. We therefore grouped zinc octanoate (ZnC8), zinc nonanoate (ZnC9), and zinc oleate (ZnZ-C18) together as group I.
Single-crystal X-ray data for the zinc decanoate (ZnC10) indicate a non-centrosymmetric structure with one crystallographically independent chain characterized by a lamellar stacking of sheets perpendicular to the c axis. As with the nonanoate and the oleate, there is no indication of interdigitation of sheets. ZnC10 was thus placed in group II. Rietveld-refined synchrotron powder X-ray diffraction data of the dodecanoate and tetradecanoate predict a monoclinic C2 space group for both solids.69 These structures match the crystallographically determined structure of the decanoate from this study. The undecanoate was also refined using the Rietveld-refined method, from which it was suggested that it crystallizes in a structure, with two crystallographically independent chains in a manner similar to the short-chain carboxylates (group I).69
Spacing between CH3–CH3 tail groups in opposite layers in the lamellae averaged 4.115 Å for the nonanoate and 4.119 Å for the oleate. In comparison, the CH3–CH3 spacing was found to be substantially smaller at 3.741 Å for the decanoate. The smaller void spaces for the even-numbered chains allow more efficient packing and reduced distances between lamellar sheets seen in the crystal packing for the decanoate. Molecular structures are presented in Fig. 1. Group packing diagrams are presented in Fig. 2.
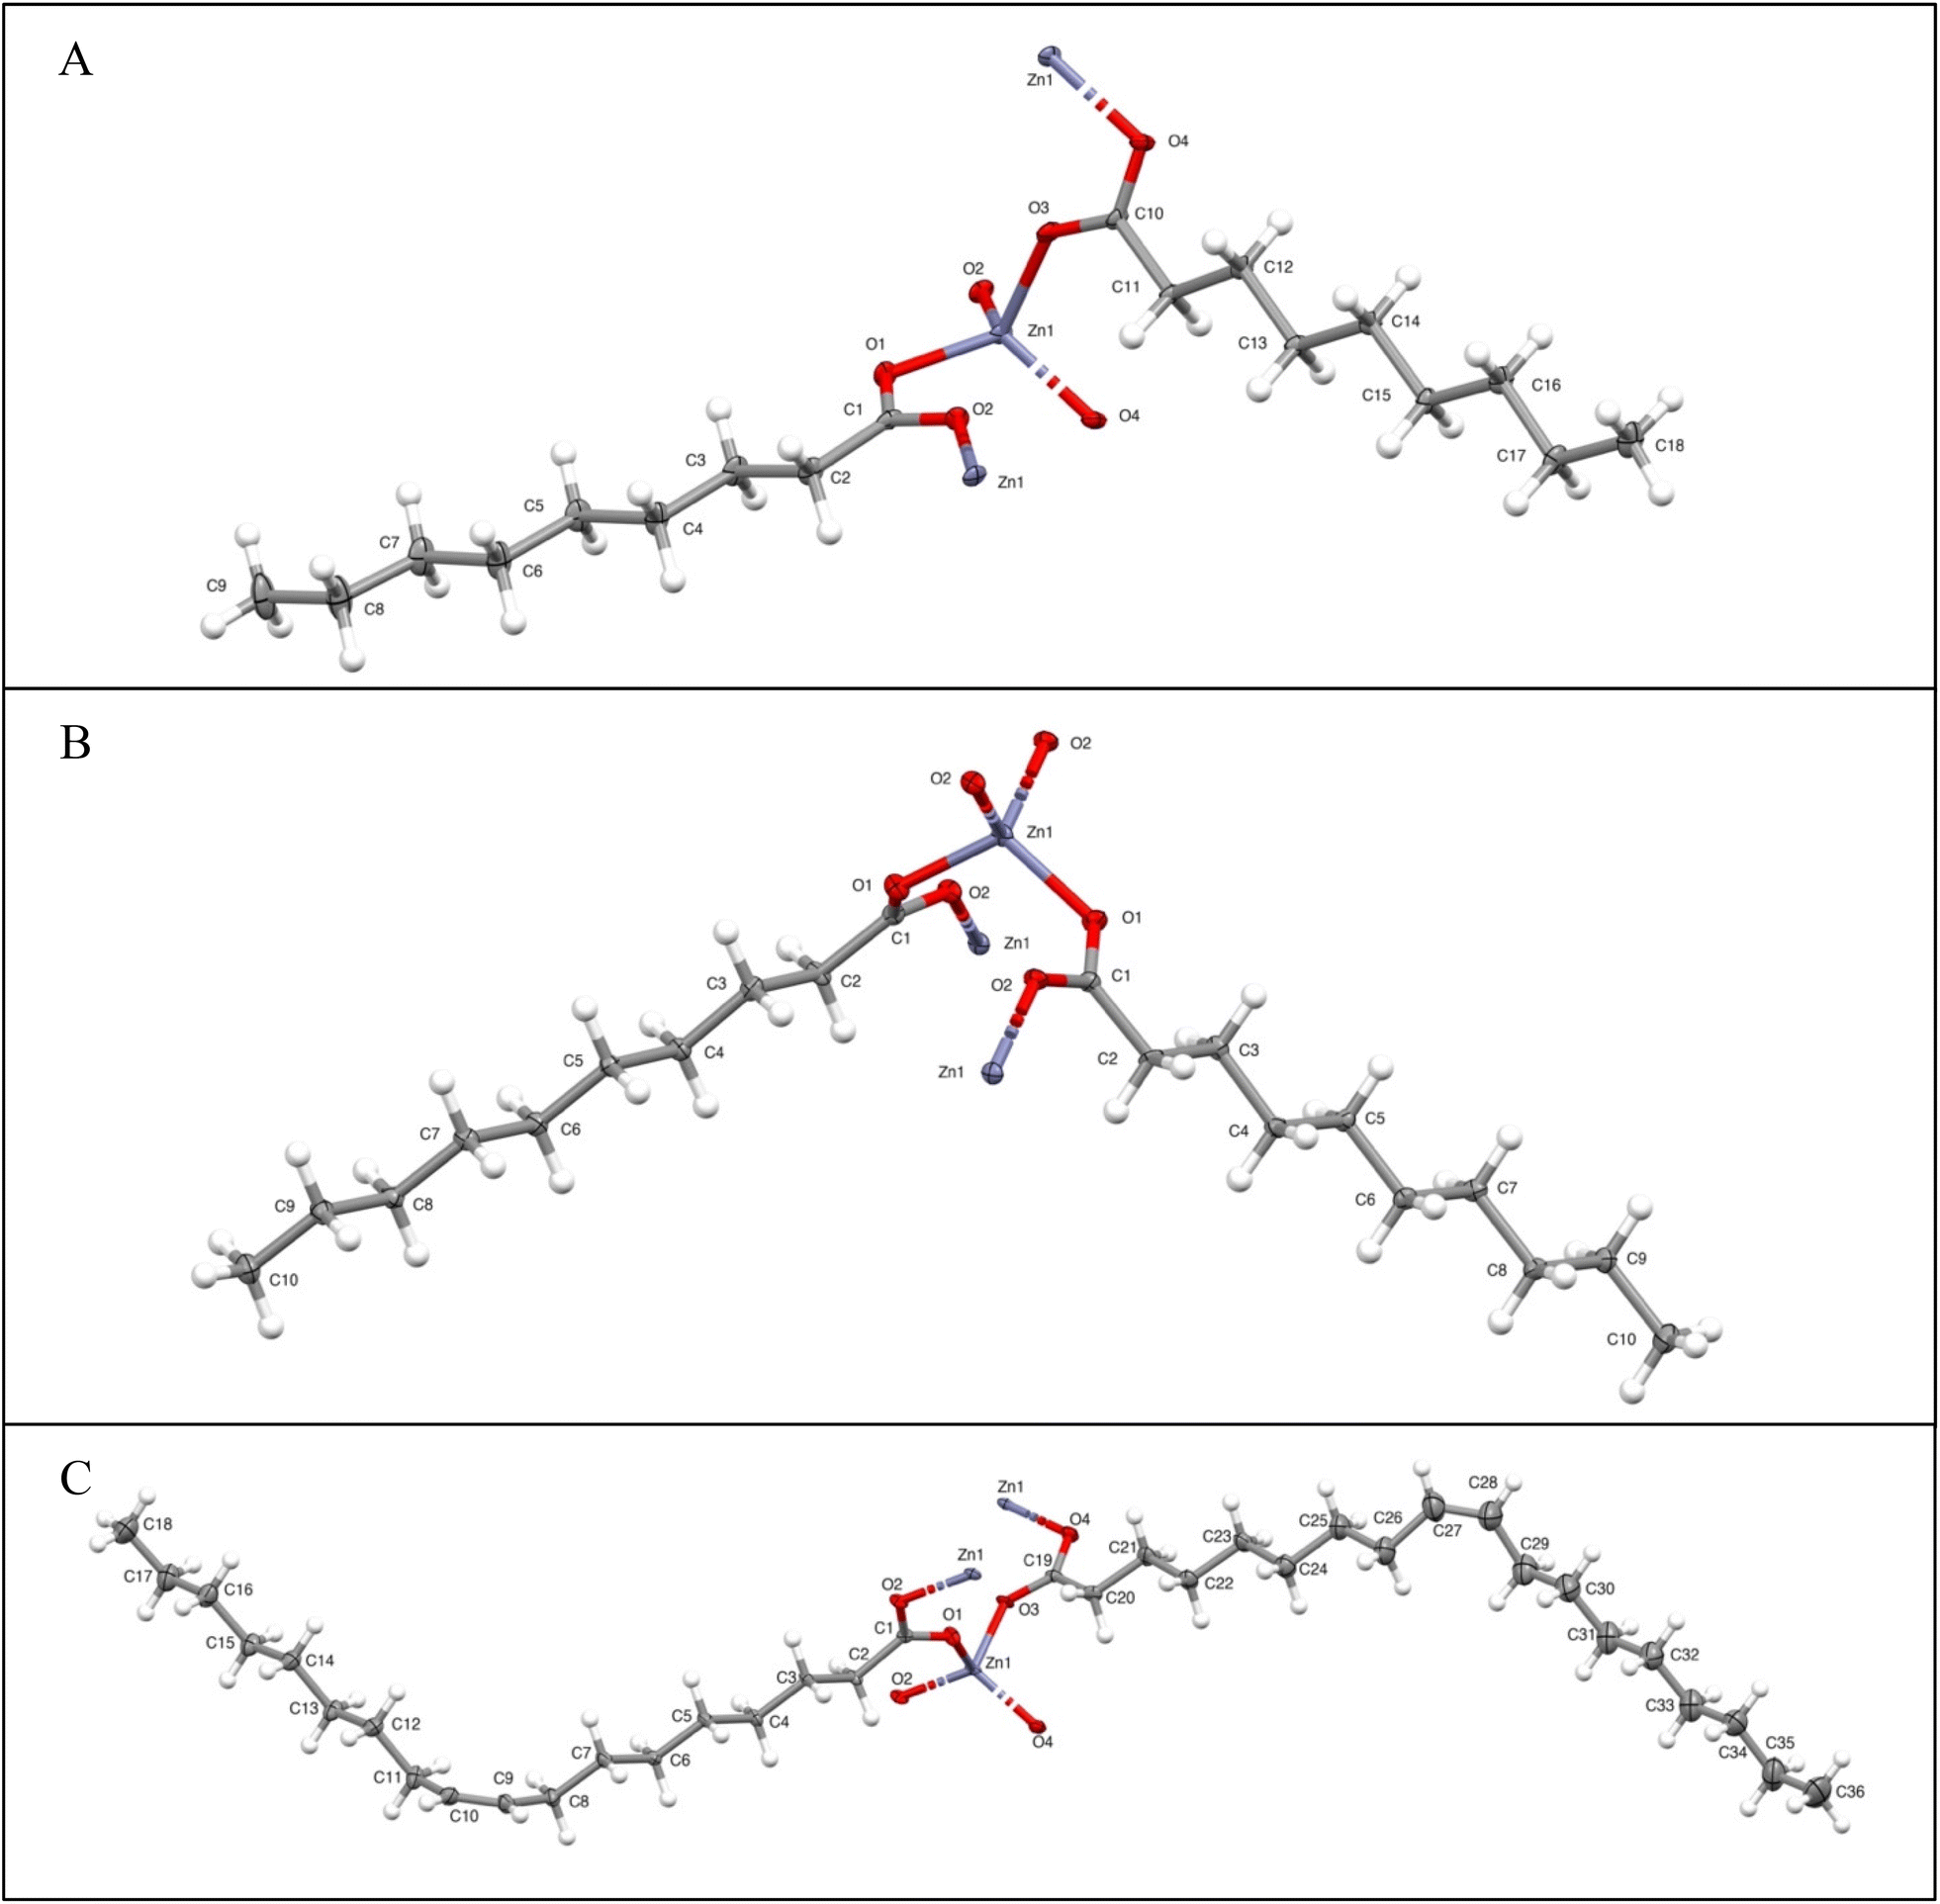 | ||
| Fig. 1 X-ray-derived molecular structures of (A) zinc nonanoate, (B) zinc decanoate, and (C) zinc oleate, with 30% probability ellipsoids. H-atoms are depicted with standard bond lengths. | ||
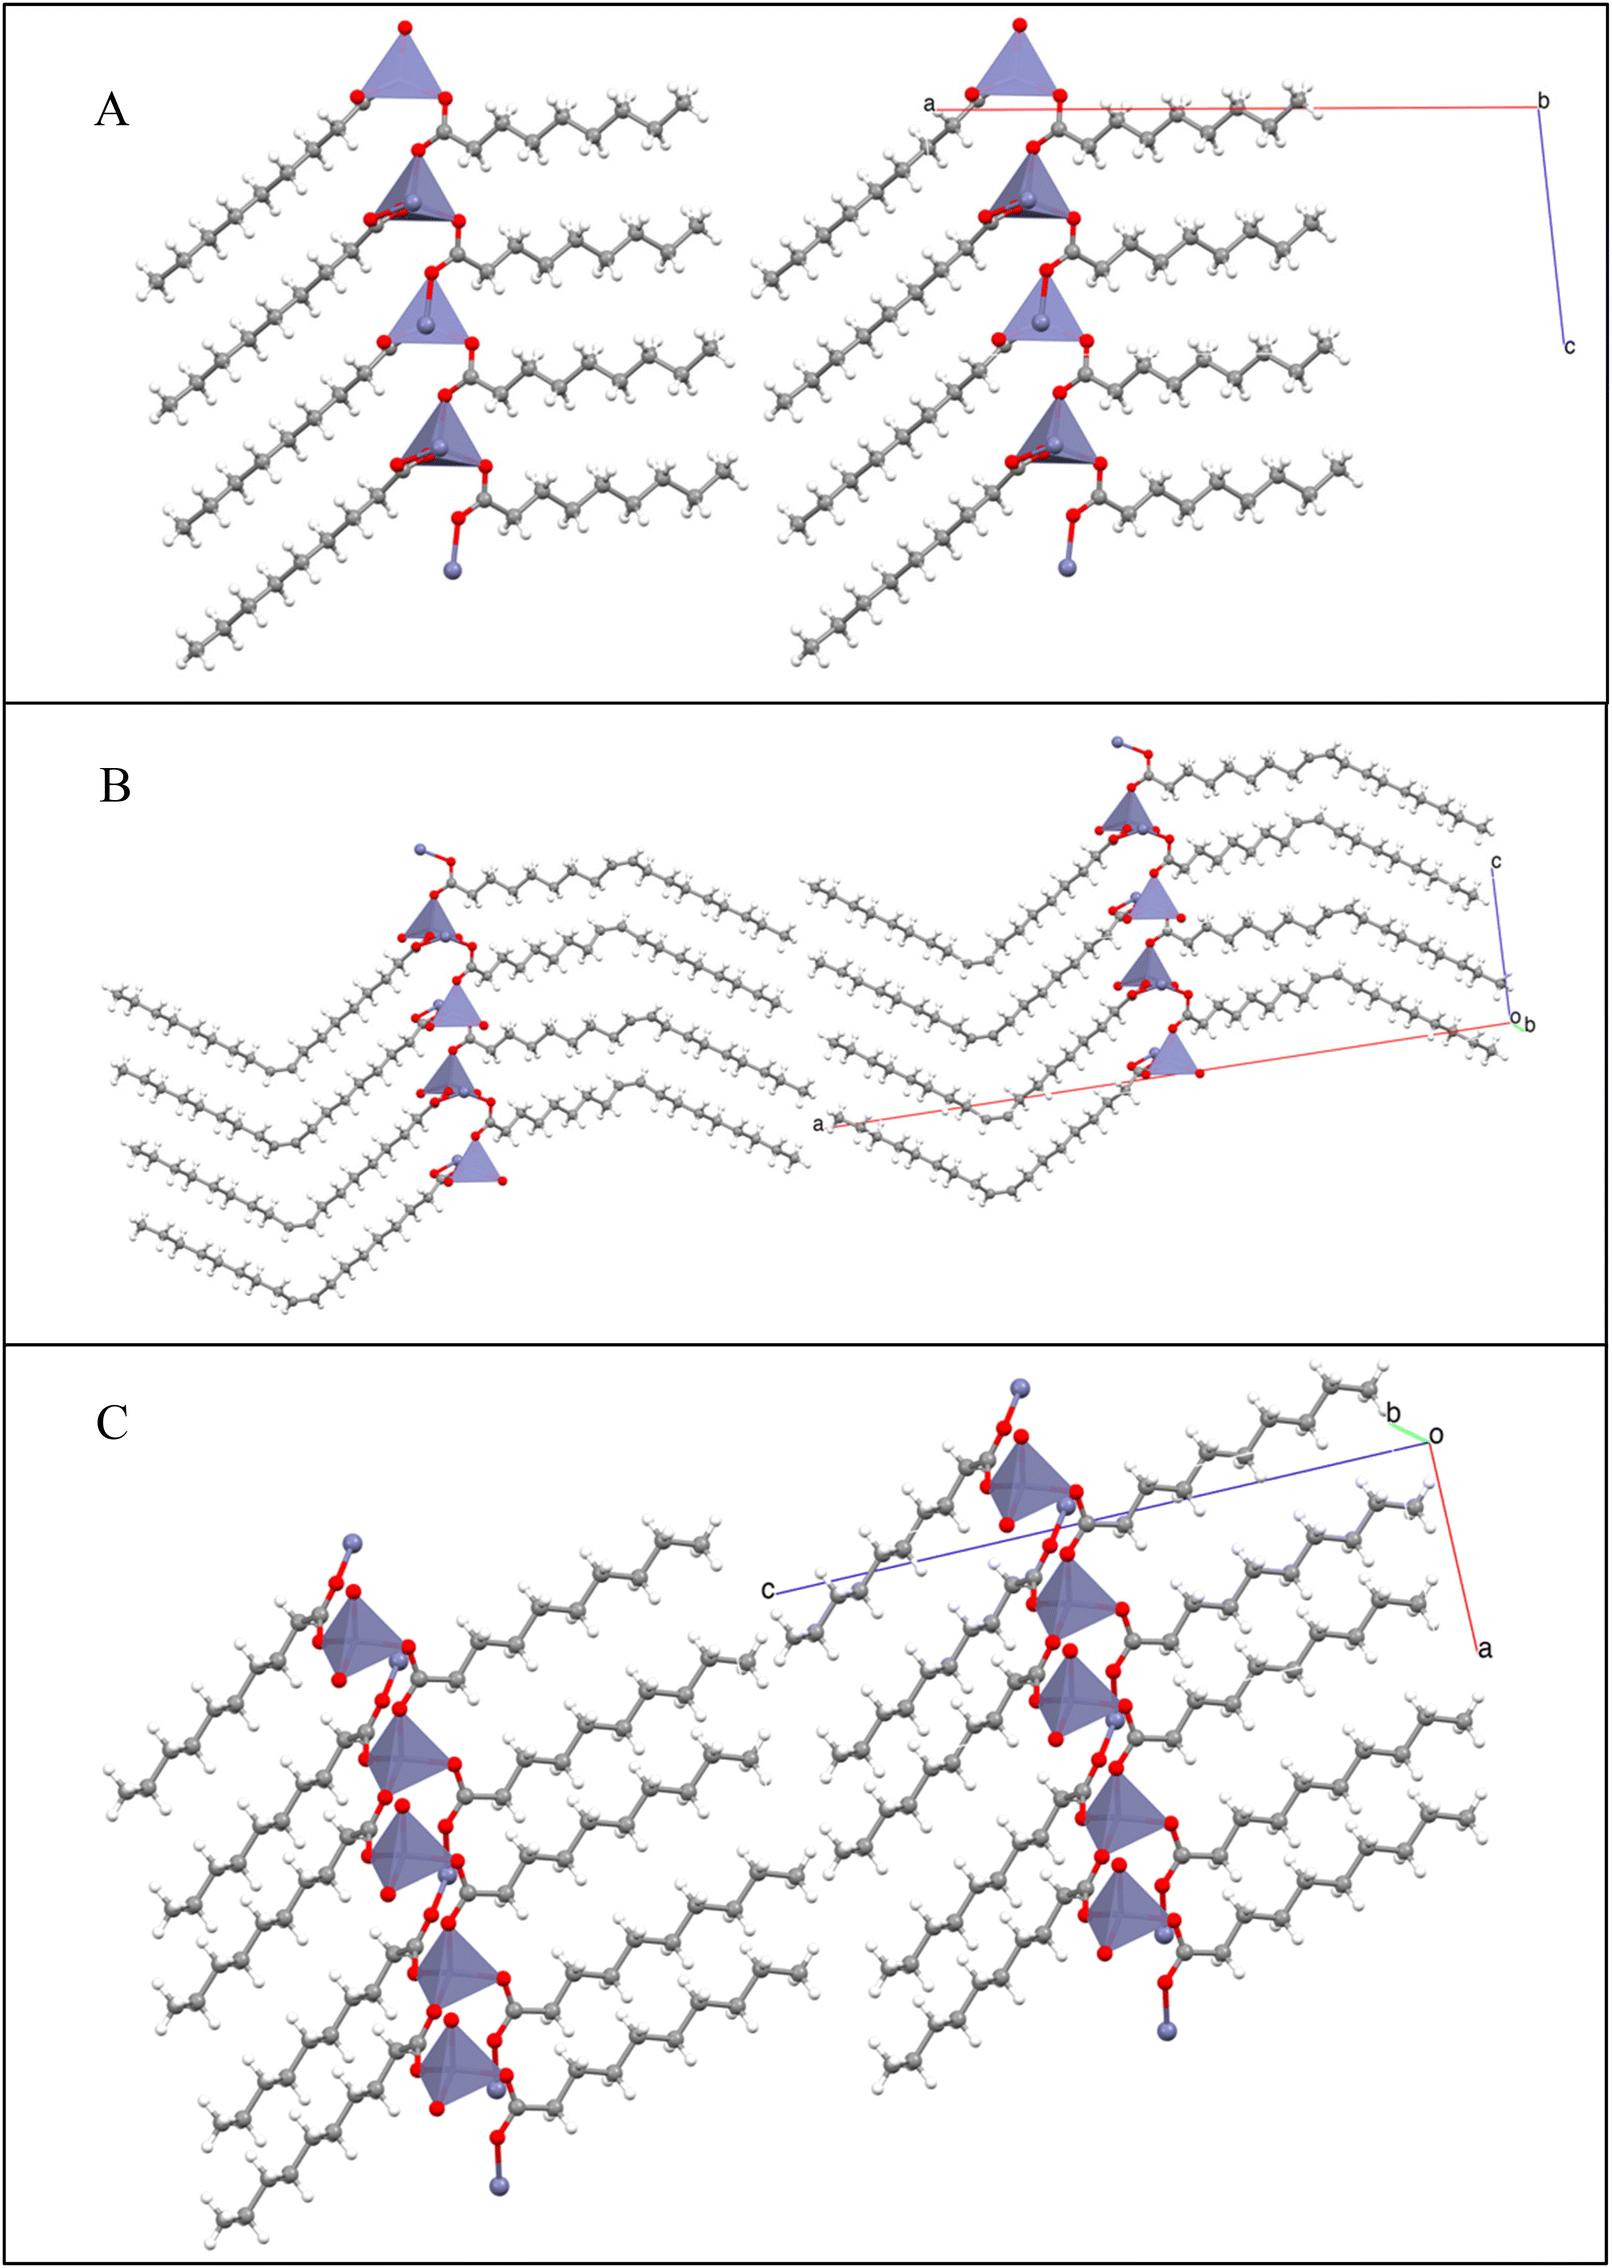 | ||
| Fig. 2 Structures of group I represented by ZnC9 (A) and ZnZ-C18 (B), and group II represented via ZnC10 (C) highlighting the arrangement of tetrahedron about the zinc in each crystal type. Hydrogens have been removed for visual clarity. | ||
Mesbah et al. state that the separation between structural archetypes occurs between ZnC9 (group I) and ZnC10 (group II), with the suggestion that odd-numbered chains with C > 10 fall into the collection of group I structures.69 Group I structures possess two orientations of the zinc tetrahedra within the unit cell. Group II structures possess only one orientation of the zinc tetrahedron. Both groups crystalize in an AB arrangement between layers. Expanded packing diagrams for each group are provided in the ESI Fig. S1–S3† for visualization of the AB packing arrangement. Visualizations of group I and group II arrangements are given in Fig. 2. The oleate, although distinctly in the longer-chain category by number of carbons, falls within the group I crystal structure due to the fact that the chains on either side of the trans-double bond are nine carbons in length. This observation is particularly relevant for the chain bonded to the zinc center. The combination of the short chain around the immediate zinc center and the steric bulk of the bent oleyl chain results in a group I twisted tetrahedral arrangement, rather than the more ordered group II typical of the longer chains. The packing arrangement of the zinc oleate is also provided in Fig. 2B. The single-crystal X-ray-diffraction-derived structural parameters of zinc(II) nonanoate, zinc(II) decanoate, and zinc(II) oleate are given in Table 3. The presence of two structural motifs has also been confirmed by FTIR, discussed further in the next section.70,71
X-ray powder patterns for the compounds are characterized by regularly spaced, higher-order 00l reflections for low angles (2Θ < 15°). Reflections at mid and higher angles are irregularly spaced and of low intensity and match literature reports for metal soaps.3,19 These variations are most notable in the comparisons of the single-crystal-generated and powder patterns for the ZnC9, ZnC10, and ZnZ-C18 compounds. It should be noted that the bulk powders were measured at room temperature while the single-crystal data was acquired at 150 K. The low-temperature acquisition reduces thermal motion, dynamic disorder, and librational effects.72 The resulting patterns are of better resolution than those obtained at higher temperatures. This is most notable in the diffraction patterns of ZnZ-C18. The simulated pattern from the single-crystal data has clear resolution for the 20° ≤ 2Θ ≤ 25°. The peaks in that region are greatly suppressed in the bulk, room temperature data likely due to a combination of thermal motion and multiple polytypes present in the powder sample. The single-crystal lattice parameters were used to generate powder patterns in excellent agreement with the experimental data in the main peaks below 15°. Experimental PXRD patterns for all compounds and their comparisons to the simulated patterns of the single crystals, where applicable, are found in the ESI (Fig. S4–S12†).
FTIR spectroscopy
Hermans et al. observed both crystalline and amorphous domains of Zn carboxylates, zinc ions loosely coordinated to the ionomeric network of the cross-linked network, in a painting by van Gogh with infrared spectroscopy.73,74 Similar results have been reported for paintings by Jackson Pollock75 and Salvador Dalí.25 The structural chemistry of zinc carboxylates has clear implications for art conservation.71,76Several previous studies have used FTIR spectroscopy in conjunction with powder X-ray diffraction analysis to assess the coordination environment around the metal center in zinc carboxylates of varying lengths.63,65,68,70,71,77,78 These studies have identified the characteristics of the bridging bidentate coordination of the carbonyl groups in these compounds. Splitting in the symmetric, νs, and antisymmetric, νas, vibrational bands of the carbonyl group is indicative of asymmetry in the zinc–oxygen bonds. The differences between the vibrational modes, tabulated in Table 4, agree with literature values for bidentate bridging ligands.79
| Compound | Frequency of bands cm−1 | |
|---|---|---|
| ν as COO | ν s COO | |
| (vs) very strong; (s) strong; (m) medium; (w) weak; (b) broad. | ||
| ZnC8 | 1544, 1527 (s) | 1408, 1396 (m, b) |
| ZnC9 | 1544, 1525 (vs) | 1410, 1398 (m) |
| ZnC10 | 1535 (vs) | 1396 (m) |
| ZnC11 | 1542, 1529 (vs) | 1408, 1398 (m) |
| ZnC12 | 1535 (vs) | 1408, 1394 (m, b) |
| ZnC16 | 1537 (s) | 1396 (m, b) |
| ZnC18 | 1537 (vs) | 1396 (m) |
| ZnZ-C18 | 1542, 1525 (s) | 1408, 1398 (m, b) |
| ZnPiv | 1550, 1521 (m) | 1415 (m, b) |
| ZnAze | 1544, 1592 (vs) | 1405, 1392 (s) |
Several studies have looked at the νasCOOH (∼1540–1520 cm−1) as an indicator of zinc coordination.70,71,80 Hermans et al. reported that short chain structures display split νasCOOH band indicating the presence of two distinct carboxylate groups, while the longer chain (C > 9) structures display a single νasCOOH band. They theorize that the difference in packing is due to energetically zinc-coordination favored (short chain) versus van der Waals-favored (long chain) packing.70 Nelson, Taylor, and Ellis propose a related theory also suggesting that the long chains pack in the group II arrangement due to increased van der Waals forces between the alkyl chains; however, the packing for the short chains is attributed to the electrostatic repulsion between the methyl tail groups of the chains.81
FTIR spectra of the zinc carboxylates in our study (Fig. 3 and S10;†Tables 4 and S1†) show a similar trend, with two marked differences from the literature. Both the undecanoate (ZnC11) and the oleate (ZnZ-C18) show splitting characteristic of an asymmetric zinc center. Consistent values for the rocking vibrations, ρ, of the carbonyl group (Table S1†) imply similar molecular structures for the entire series, which agrees with previously established literature values.80 From analysis of the νasCOOH band, we confirm the placement of ZnC8, ZnC9, and ZnZ-C18 in group I and add ZnC11, ZnPIV, and ZnAZE to the group considering the splitting of the band. ZnC10 remains in group II while ZnC12, ZnC16, and ZnC18 are added due to the single band presented in their FTIR spectra.
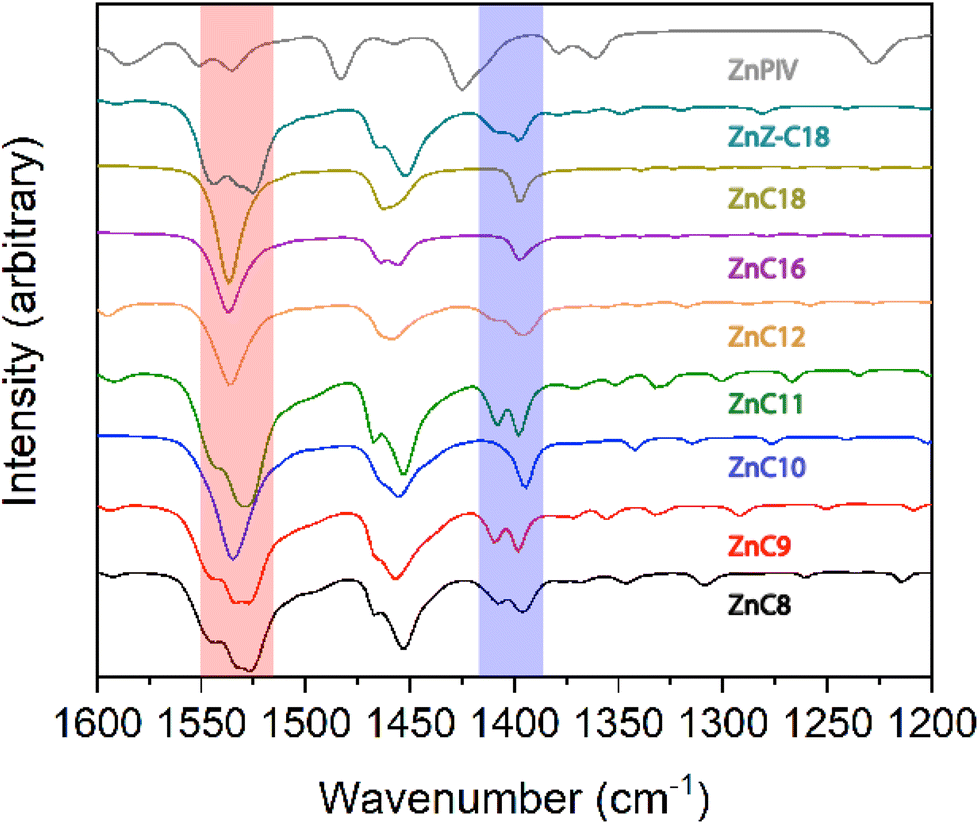 | ||
| Fig. 3 FTIR spectra of the zinc carboxylates, highlighting the νs COO (∼1540–1520 cm−1) highlighted in red and νas COO (1410–1395 cm−1) region highlighted in blue. Δν for all samples is characteristic of bidentate ligands. The splitting of the resonances is indicative of asymmetric zinc centers. | ||
Nelson et al.82 found a variation in intensities of the νasCH3 (∼2960 cm−1) and νsCH3 (∼2970 cm−1) band between the short- and long-chain methyl tail groups. These variations were attributed to increased methyl–methylene interactions, and increasing bilayer overlap, with increasing chain length. We find no indication of this phenomenon in these FTIR spectra. All νas(CH3) intensities are more intense than the corresponding νs(CH3) intensities. Additionally, single-crystal X-ray diffraction data, discussed above, indicate a lack of overlap in the chain ends during packing. Medium to strong broad bands centered around 1460 cm−1 are present for all compounds, except the pivalate, indicative of the mixing of CH3 bending and CH2 scissoring modes of different polymorphic forms, as discussed for the 13C NMR data. The absence of bands in the 3500–3300 cm−1 region indicates that these materials are anhydrous. The absence of a carbonyl peak around 1730 cm−1 and a shift of carbonyl peaks to lower frequencies implies the absence of free acid in these samples.
NMR spectroscopy
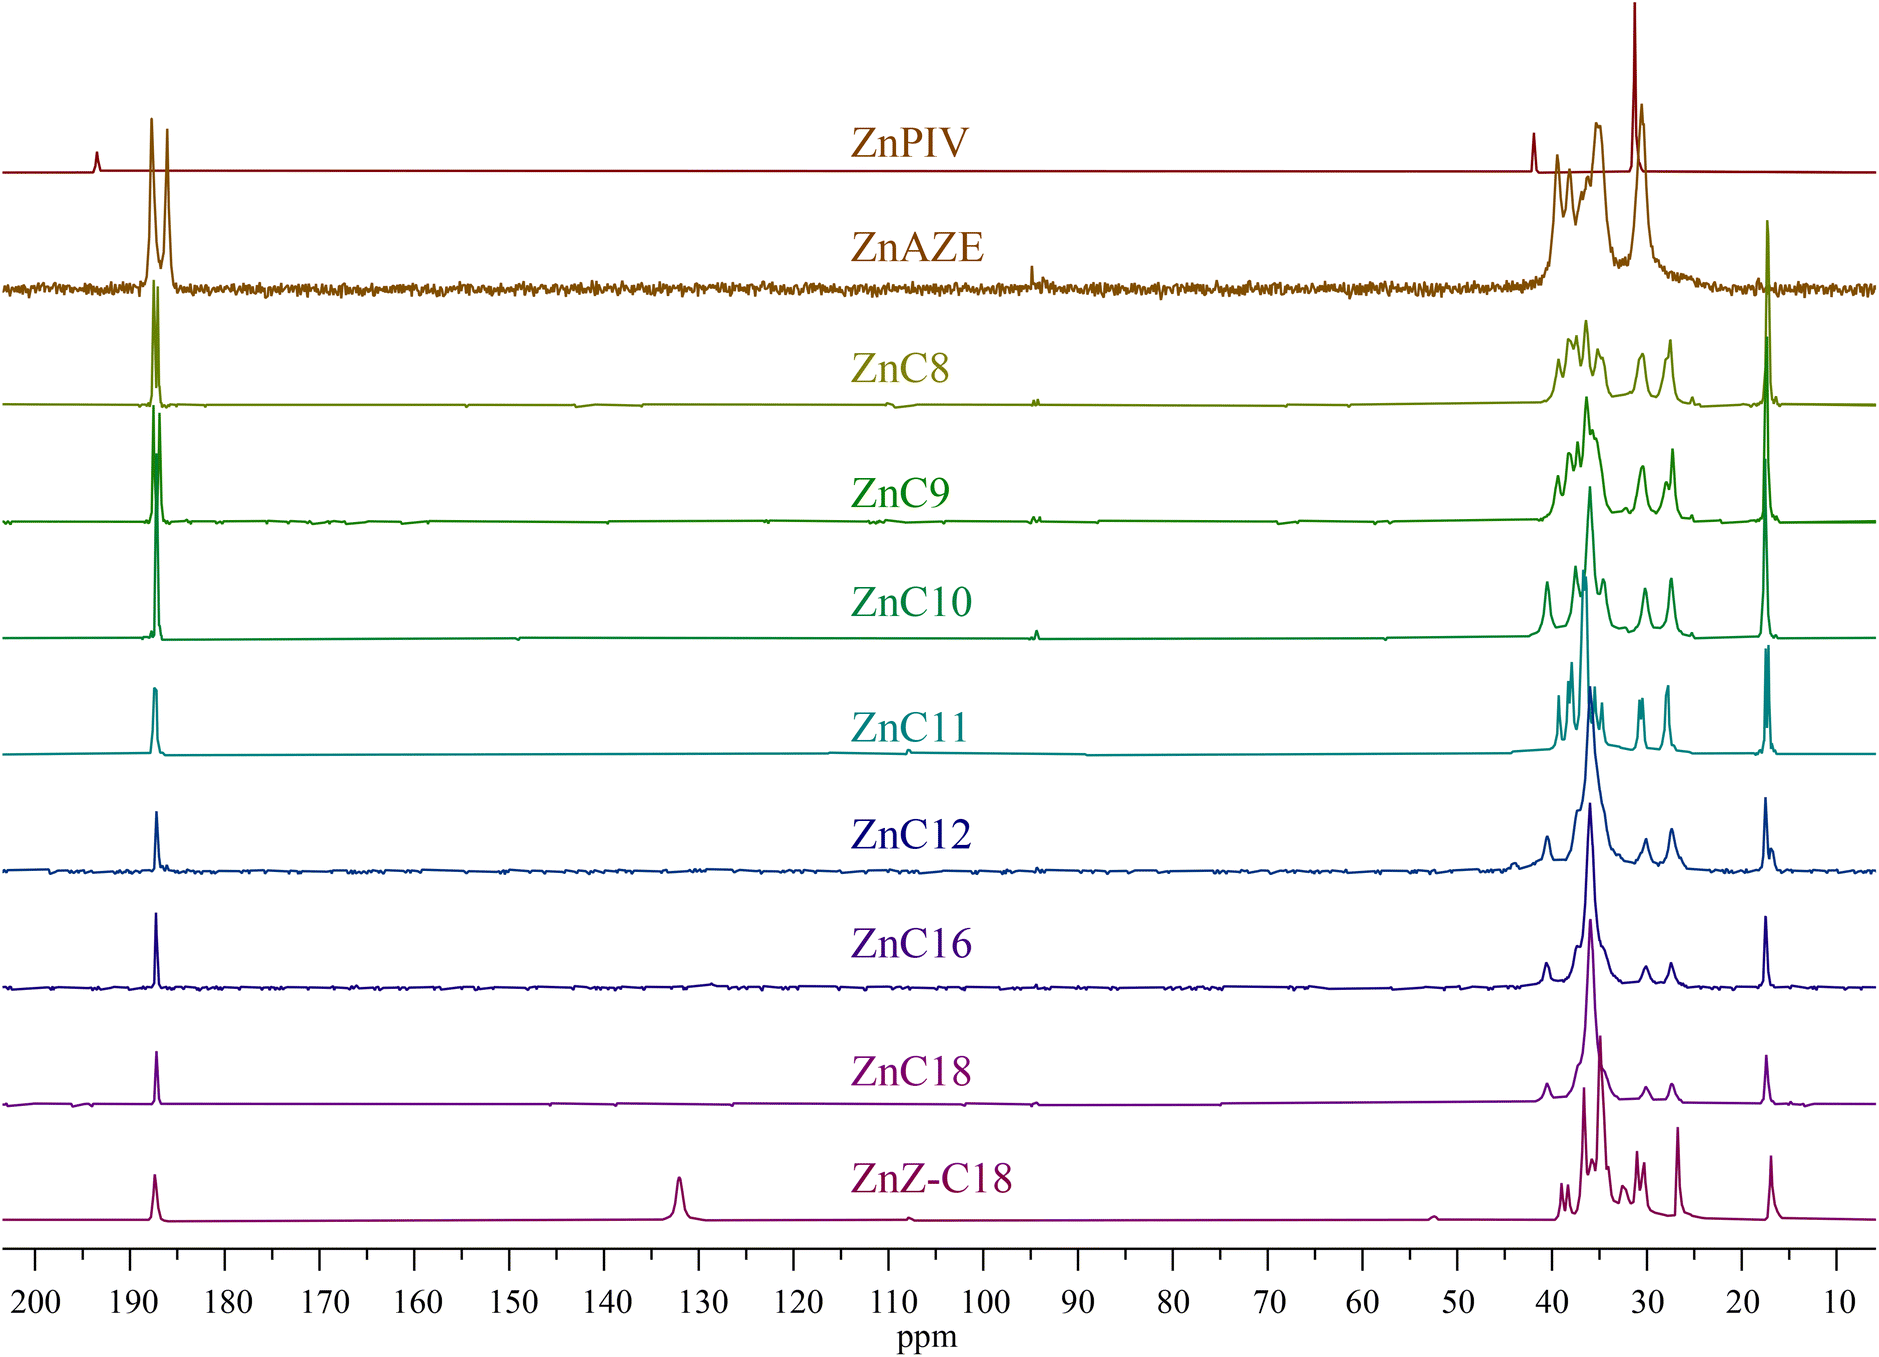
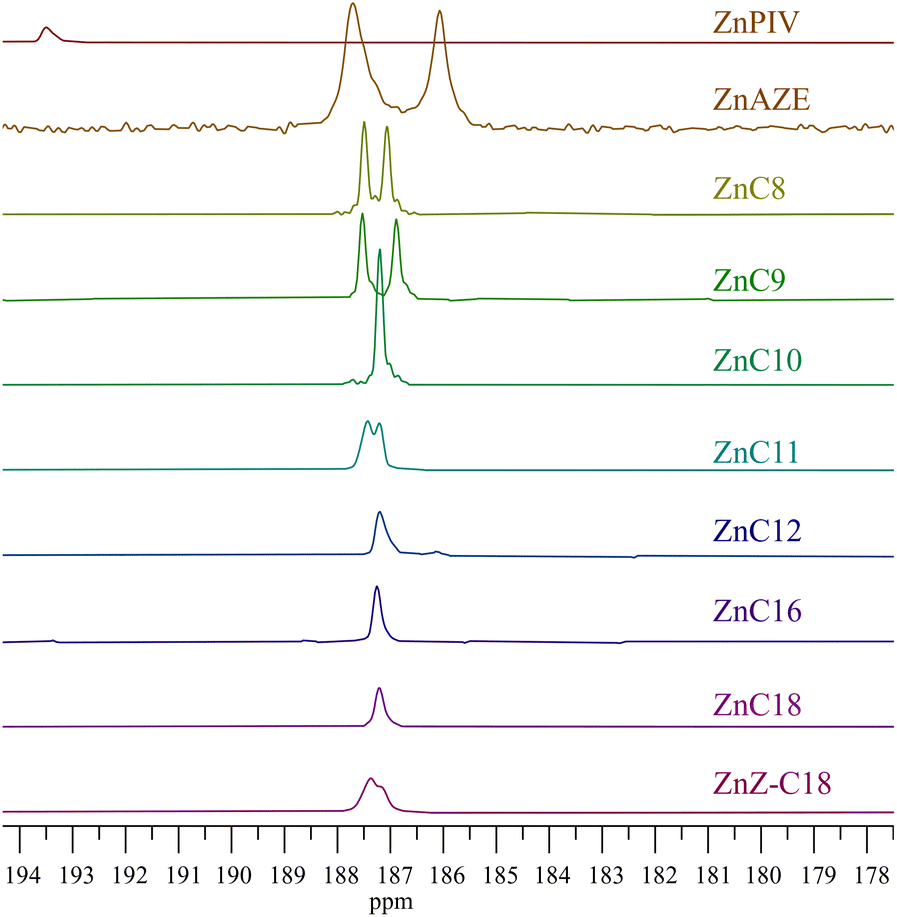
13C NMR also provides information regarding the crystal packing of the zinc carboxylates (Fig. 4). ZnPIV exhibits a 13C spectrum distinct from the rest of the carboxylates, in agreement with the distinctive 67Zn NMR parameters. All 13C resonances for ZnPIV are less shielded than those of the pure acid and of the other zinc carboxylates. ZnAZE also exhibits a slightly different spectrum than the other carboxylates. The structure of azelaic acid consists of a carbon chain capped on each end with a carboxylic acid group producing two clear carboxylate resonances, one for each the bridging and terminal carboxylate groups. Fig. 5 shows a zoomed in view of the carboxylate region, spanning 195–180 ppm. The bridging carboxylate resonance for ZnAZE at 187.5 ppm shows a shoulder not present in the resonance for the terminal carboxylate at 186 ppm. This can be attributed to an unresolved doublet due to two carboxylate conformations around the zinc center. The carboxyl resonances for the short-chain (C ≤ 9) homologues around 187 ppm are doubled, with a relative ratio of 1:1, indicating two unique carboxyl configurations in the unit cell. Doubling is also seen for the ZnZ-C18; however full resolution of the doublet was not possible. The carboxyl resonance is a singlet for the long-chain (C > 9) molecules, indicating a single carboxylate configuration for these compounds.
 | ||
| Fig. 4 13C NMR spectra for the zinc carboxylate series. | ||
 | ||
| Fig. 5 13C NMR data for the carboxylate series, focusing on the carboxylate region. | ||
These results are in agreement with the crystal structures of zinc nonanoate, zinc decanoate, and zinc oleate discussed above. Variations in the intensities and broadness of the resonances for the methylene carbons, between ∼45–25 ppm, as well as shifts and doubling of the methyl carbon resonance at ∼17 ppm indicate the possibility of multiple polymorphic forms in the powdered samples. This fact is corroborated by FTIR and PXRD data discussed above. While the 13C NMR data confirm the group placement for the majority of the carboxylates, the substantial variation in the ZnPIV spectrum necessitates separating it from the established grouping. A new group, group III, was thus established for ZnPIV.
Early model studies of Zn-soap formation in commercial linseed oil paints identified two distinct Zn oleate polymorphs, depending on reaction conditions.8,70 Unlike the corresponding free acids, zinc stearate and zinc oleate are miscible across the entire compositional range.83 To accommodate the kink in the oleyl chain, neighboring palmitoyl chains were determined to be conformationally disordered, while more-distant palmitoyl chains remained in the all-trans conformation. Maines et al. have reported the intralayer cleavage (cohesive failure, rather than adhesive failure) of paint layers in modern paintings due to the formation of a Zn soap deposit, determined to be Zn oleate.84 Lead oleate soaps, on the other hand, have not been observed, because oleic acid is rapidly converted to azelaic acid through oxidative cleavage. The structure of Zn oleate must somehow protect the double bond from oxidation.
Zinc-67 NMR parameters (quadrupolar coupling constant, anisotropic chemical shift) are diagnostic of non-spherical local electronic structure at the nuclear site, as is true for the lead nuclei in lead-based soaps.32,3467Zn NMR spectroscopy has been used to characterize the coordination geometry around Zn+2 ions in pure compounds.49,85–89 In particular, the natural-abundance 67Zn NMR spectra of ZnO at 11.7 and 14.1 T have been reported.86,87 The line shape of the central-transition is determined by second-order quadrupole effects, and for ZnO CQ = 2.4 MHz, ηQ = 0, and δiso = 240 ppm relative to a 0.1 M ZnCl2 aqueous solution. Comparison of various zinc-containing materials demonstrates that the NMR parameters are particularly sensitive to the local electronic environment.87
The electric-field gradient (EFG), as defined by the parameters CQ and ηQ, is sensitive to the position and orientation changes in the local environment of the zinc center, particularly the placement of surrounding oxygen atoms. 67Zn NMR results for the series of carboxylates reported here indicate that the zinc environments fall into three groups. (Table 5) Fig. 6, 7, and 8 shows spikelet spectra for molecules representative of the three distinct groups, together with their respective simulated powder patterns. Group I, which includes shorter-chain homologues as well as zinc undecanoate and zinc oleate, evinces a quadrupole coupling constant ∼8 MHz with a moderate asymmetry parameter (∼0.30). Group II is characterized by smaller quadrupole coupling constants (∼2.5 MHz) with a larger asymmetry parameter (∼0.60) and includes the longer chain carboxylates (C > 9). The large quadrupole coupling constant for groups I and II are indicative of strongly asymmetric local environments around the zinc center. Group III is characterized by the largest quadrupole coupling constant (∼11.0 MHz) and includes only zinc pivalate.
| Material | B 0 (T) | δ iso (ppm) | C Q (MHz) | η Q | LB (Hz) |
|---|---|---|---|---|---|
| ZnAZE | 19.6 | 101.3 ± 0.3 | 6.92 ± 0.02 | 0.375 ± 0.003 | 1400 ± 8 |
| ZnC8 | 35.2 | 96.0 ± 0.5 | 8.04 ± 0.04 | 0.2979 ± 0.004 | 740 ± 27 |
| ZnC9 | 35.2 | 92.1 ± 0.6 | 8.06 ± 0.05 | 0.342 ± 0.006 | 530 ± 16 |
| ZnC11 | 19.6 | 86.0 ± 0.9 | 8.2 ± 0.1 | 0.26 ± 0.01 | 1500 ± 100 |
| ZnZ-C18 | 19.6 | 51.3 ± 0.2 | 7.109 ± 0.005 | 0.217 ± 0.006 | 484 ± 4 |
| ZnC10 | 19.6 | 103.9 ± 0.3 | 2.44 ± 0.06 | 0.51 ± 0.02 | 229 ± 30 |
| ZnC12 | 19.6 | 104.1 ± 0.1 | 2.454 ± 0.003 | 0.4469 ± 0.0001 | 232 ± 2 |
| ZnC16 | 35.2 | 102.1 ± 0.5 | 2.57 ± 0.06 | 0.67 ± 0.02 | 200 ± 35 |
| ZnC18 | 19.6 | 80.3 ± 0.4 | 2.63 ± 0.04 | 0.63 ± 0.01 | 160 ± 28 |
| ZnPIV | 35.2 | 95 ± 3 | 11.0 ± 0.1 | 0.799 ± 0.008 | 500 ± 80 |
 | ||
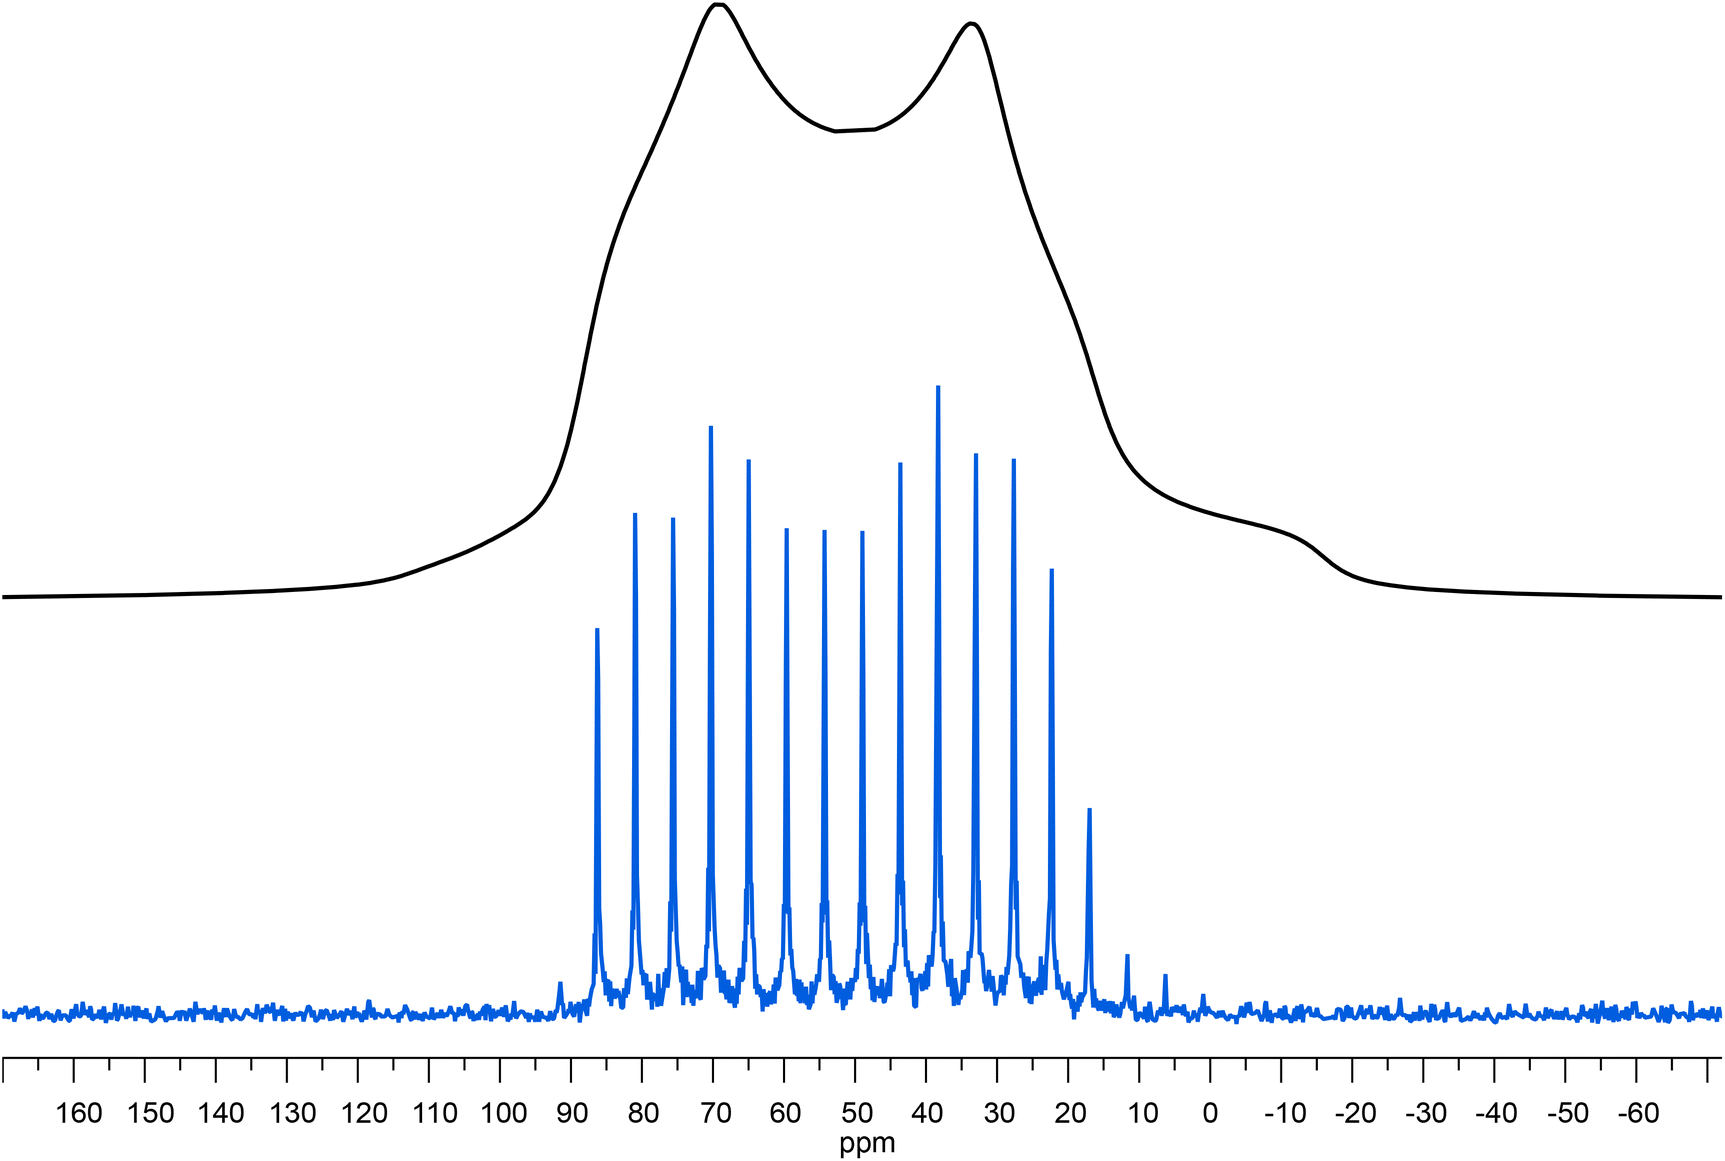
| Fig. 6
67Zn spectra for ZnC8. (Top, Black) Ssnake fitting parameters visualized in TopSpin; (Bottom, Blue) WURST-QCPMG spectrum at 15625 Hz MAS. B0 35.2 T. | ||
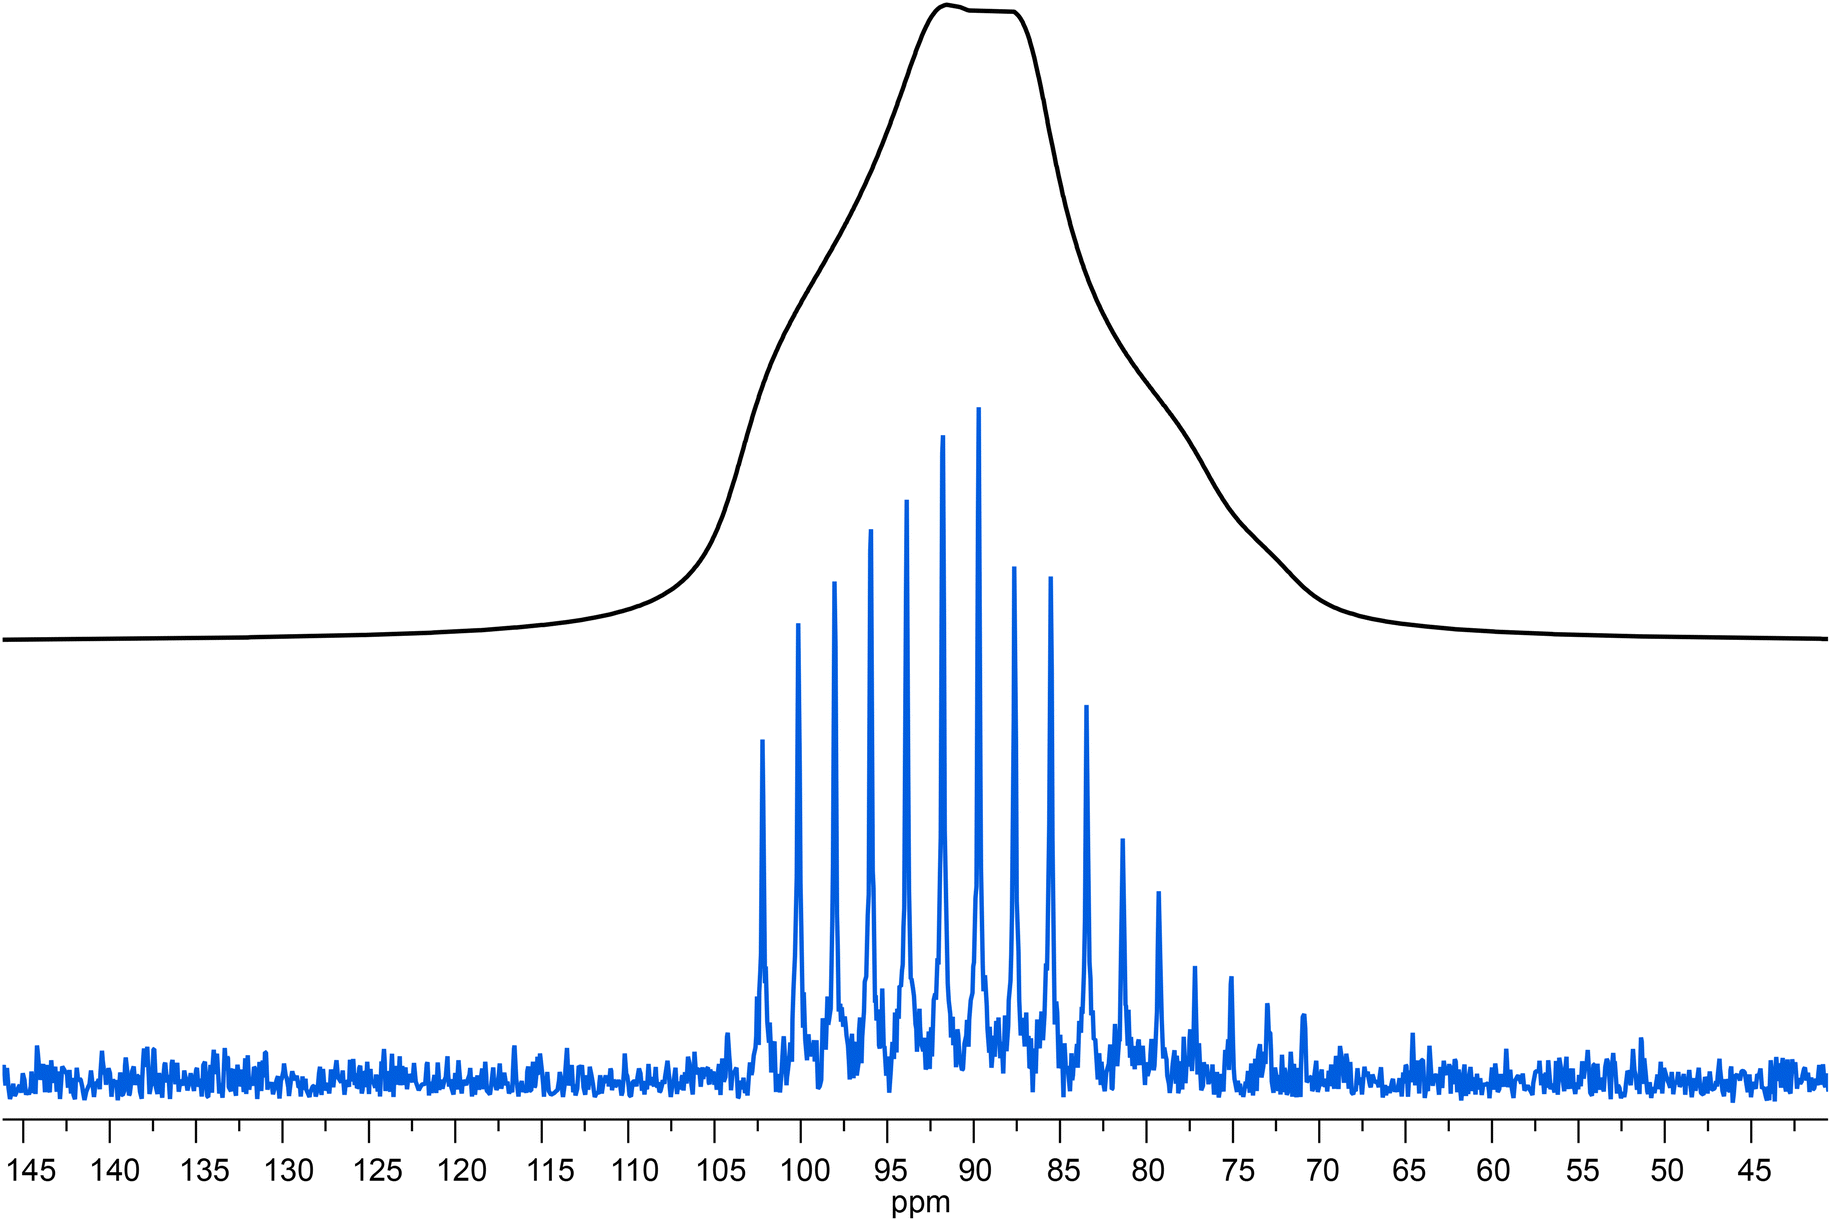 | ||
| Fig. 7
67Zn spectra for ZnC10. (Top, Black) Ssnake fitting parameters visualized in TopSpin; (Bottom, Blue) WURST-QCPMG spectrum at 15625 Hz MAS. B0 19.6 T. | ||
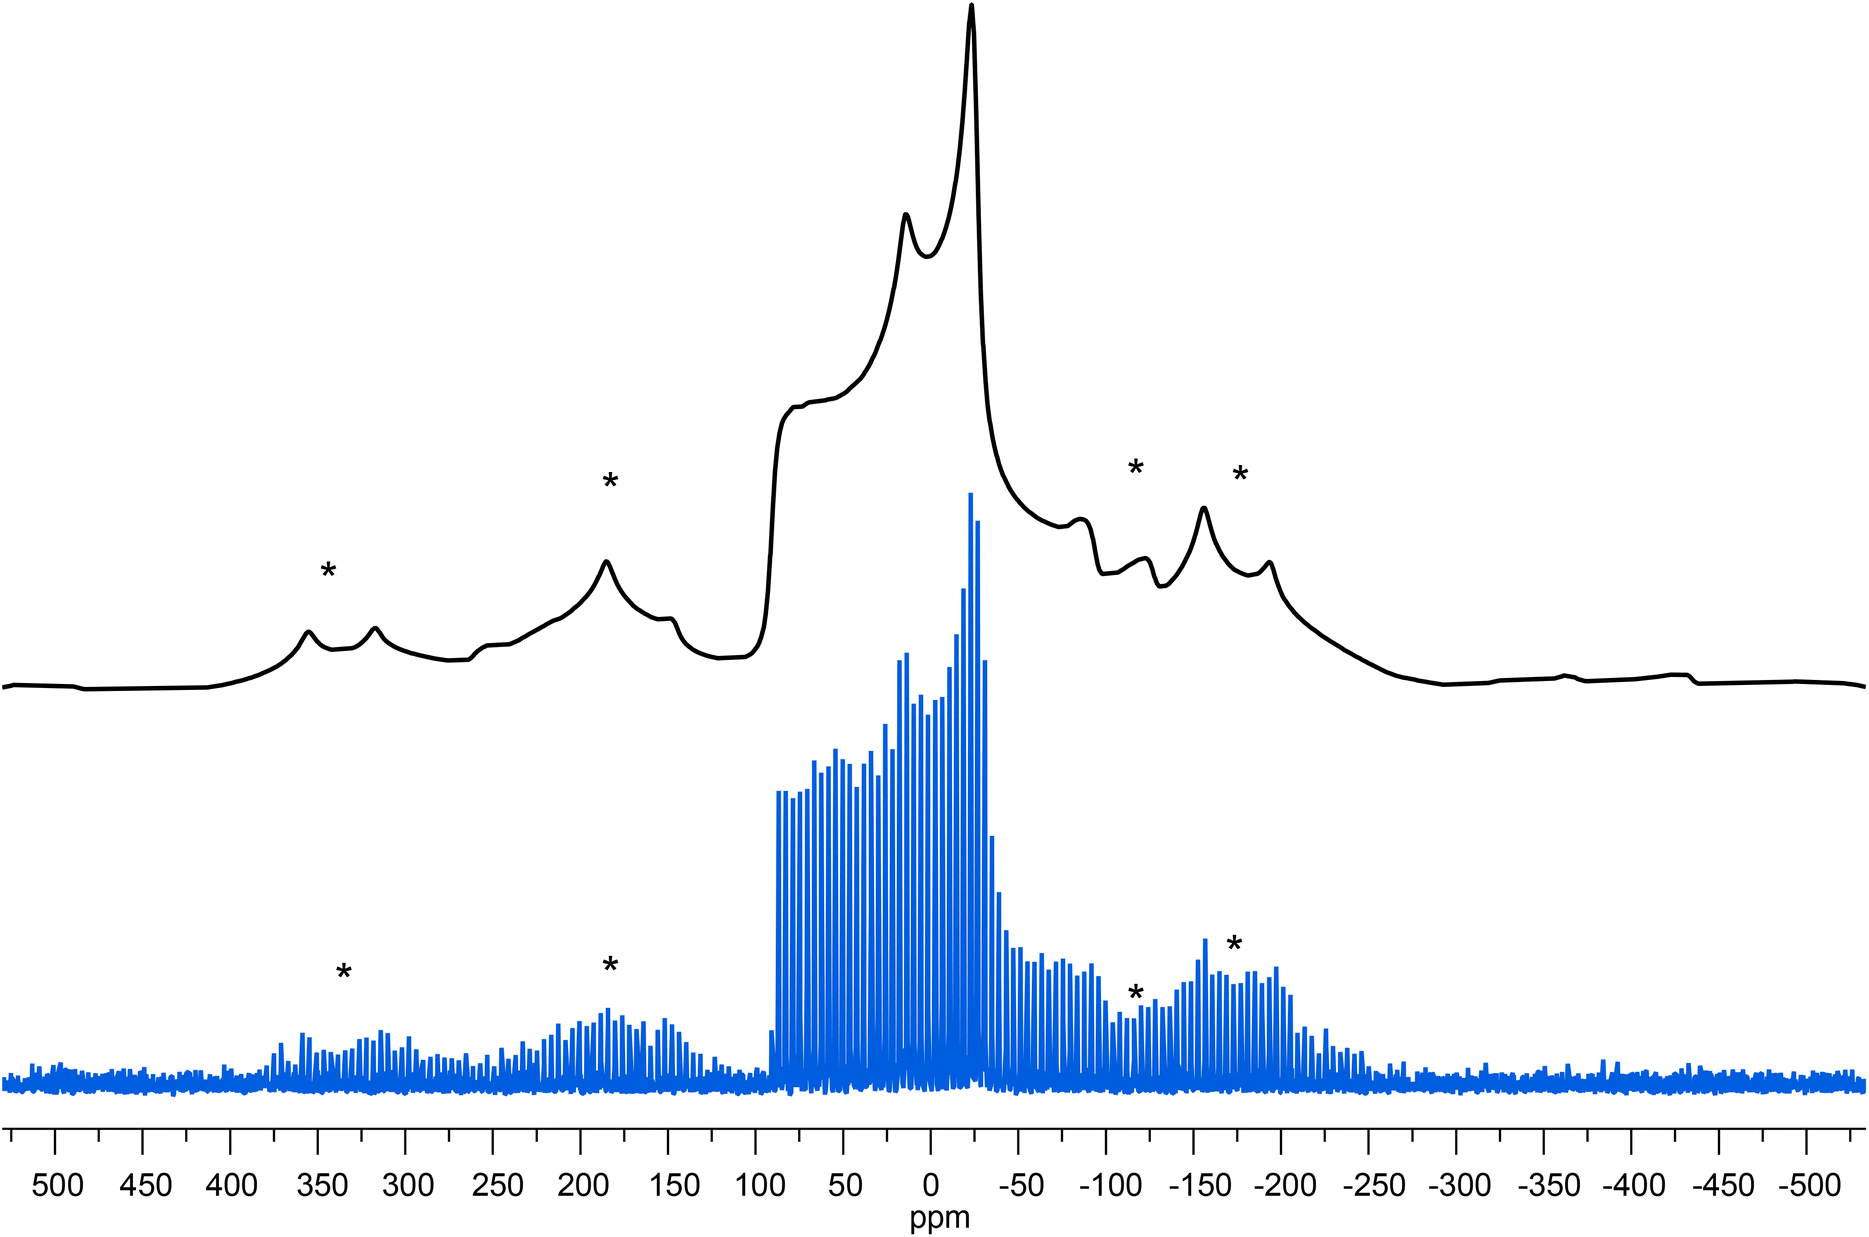 | ||
| Fig. 8
67Zn spectra for ZnPIV. (Top, Black) Ssnake fitting parameters visualized in TopSpin; (Bottom, Blue) WURST-QCPMG spectrum at 16000 Hz MAS. Sideband regions denoted with asterisks. B0 35.2 T. | ||
Similarly, the NMR spectra of group I compounds (Fig. 6, S14–S16†) suggest an asymmetric placement of oxygens around the zinc center, but the smaller magnitude of CQ suggests a lesser effect than for the pivalate. The large CQ indicates a distorted electronic environment around the metal centers. This supports the theory that these structures are likely influenced by methylene–methylene interactions between layers of the lamellae in the structures as suggested by Nelson, Taylor, and Ellis81 rather than a preferential coordination geometry for zinc as proposed by Hermans et al.70 The relatively short chain lengths of molecules of group II result in structures dominated by electrostatic repulsion between the methyl tail groups of the chains, as can be seen in the single-crystal diffraction information discussed above. The methyl tail groups necessitate a distortion of the tetrahedral arrangement around zinc to accommodate these repulsive forces.81 In zinc oleate, the cis-double bond between C9 and C10 prevents the all trans arrangement of the aliphatic chains found in the other long-chain carboxylates, which affects the structural alignment.
Group II consists of even-numbered long-chain (C > 9) carboxylates (Fig. 7, S17–S19†). The structures of these carboxylates are dominated by geometric packing. The straight, all trans arrangement of the chains allows relatively easy packing with only minimal distortion of the tetrahedral structure around the zinc. This arrangement increases the van der Waals interactions between the chains which outweighs the electrostatic repulsion from the methyl tail groups. The longer chains allow greater distribution of electrostatic charge, minimizing the effect on the structure. Literature calculations of the molecular spacing for the long chain carboxylates indicate that the void spacing between chains is greater for the odd-numbered chains.68 This increase in spacing would result in disorder in the packing and thus distortions in the tetrahedral structure. This effect can be seen in the spectrum of zinc undecanoate, whose 67Zn spectrum falls within group I.
Zinc pivalate (Fig. 8) consists of a small, but sterically bulky t-butyl ligand connected to the carboxylate group which, in turn, bridges two zinc centers. The steric hindrance caused by the four bridging groups bonded to each zinc results in a distorted tetrahedron around the zinc centers, which gives a rather large CQ. This is consistent with the crystallographic data obtained by Clegg et al.52
IV. Conclusions
Insight into the structure of medium and long chain zinc carboxylates can be obtained via spectroscopic and X-ray diffraction analysis. The series can be subdivided into three groups based on their spectroscopic and diffraction parameters.From the spectroscopic and X-ray diffraction analysis, we conclude that group I consists of short chain (C < 9) carboxylates, odd-numbered long chain (C > 10) carboxylates, and zinc oleate; group II consists of even-numbered long chain (C > 10) carboxylates; and group III consists of a relatively small molecule (ZnPIV) containing sterically bulky ligands. Based on the similarity of the NMR parameters, FTIR resonances, and powder X-ray diffraction data, we propose that the crystal structures of zinc nonanoate and zinc oleate can serve as models for group I compounds and the crystal structure of zinc decanoate can serve as a model for group II compounds.
For the group I compounds, the 67Zn NMR spectra have large CQ (∼8 MHz) indicating a distorted arrangement around the zinc center. The 13C NMR resonances for the carboxylate carbon present as a doublet centered at ∼187 ppm and show that there are two unique carboxylates around the zinc center. FTIR spectra show doubling in the symmetric and asymmetric carboxylate stretches at 1550–1525 cm−1 and 1408–1394 cm−1, respectively, also indicative of multiple carboxylate environments. The X-ray crystal structures of both zinc nonanoate and zinc oleate confirm these findings. Both crystals possess structures with slightly distorted tetrahedra around the zinc centers as shown by the varying Zn–O bond lengths and two crystallographically independent chains.
The 67Zn NMR spectra for the group II compounds display much smaller values of CQ (∼2.5 MHz) than group I indicating a more symmetric arrangement around the zinc center. The 13C NMR resonance for the carboxylate carbon is a singlet indicating a single carboxylate environment. FTIR spectra show no doubling in the symmetric or asymmetric carboxylate stretches. The single crystal structure of zinc decanoate displays a symmetric tetrahedron around the zinc center with essentially equivalent Zn–O bond lengths and two crystallographically equivalent chains. Regular progression is seen in the region assigned to CH2 twisting modes (1350–1150 cm−1) for all chain lengths, with the exception of zinc pivalate, suggesting systematic vibrational motion as expected for chains in the all trans conformation.
Group III consists of zinc pivalate—a short, but sterically bulky ligand. The 67Zn NMR data ar4e consistent with a large CQ value (∼11.0 MHz) indicating a distorted arrangement around the zinc center. The 13C NMR resonance for the carboxylate carbon is a singlet more deshielded than the corresponding resonances for the other compounds in the series. The FTIR spectrum shows characteristics of a bridging bidentate ligand with νs − νas = ∼140 cm−1.
The addition of solid-state NMR analyses to the traditional FTIR and X-ray diffraction techniques allows for the more exclusive grouping of the zinc carboxylates studied here. The CQ is highly sensitive to the local environment around the zinc center for each carboxylate. The application of this technique and the expansion into dynamic nuclear polarization (DNP)-based NMR techniques to enhance the zinc signal in zinc white containing paint films could provide invaluable information to the conservation community by probing the local zinc structure relating to the formation of the zinc-ionomer network and the subsequent formation of zinc soaps.
Author contributions
Molly Wagner: Writing-original draft; conceptualization; formal analysis; investigation; visualization; Roberta Pigliapochi: conceptualization; writing-review & editing; Valeria Di Tullio: conceptualization; writing-review & editing; Jaclyn Catalano: conceptualization; writing-review & editing; Nicholas Zumbulyadis: conceptualization; funding acquisition; writing-review & editing; Silvia A. Centeno: conceptualization; funding acquisition; writing-review & editing; Xiaoling Wang: investigation; writing-review & editing; Kuizhi Chen: investigation; writing-review & editing; Ivan Hung: investigation; writing-review & editing; Zhehong Gan Funding acquisition; investigation; supervision; writing-review & editing; Michael R. Dworzak: investigation; formal analysis; writing-review & editing; Glenn P. A. Yap: funding acquisition; formal analysis; supervision; writing-review & editing; Cecil Dybowski: conceptualization; funding acquisition; supervision; writing-review & editing.Conflicts of interest
There are no conflicts of interest to declare.Acknowledgements
The work described here was supported by the National Science Foundation under grants DMR-1608594 and DMR-1608366 to The Metropolitan Museum of Art and the University of Delaware. A portion of this work was performed at the National High Magnetic Field Laboratory, which is supported by the National Science Foundation Cooperative Agreement No. DMR-1644779 and the State of Florida. Development of the SCH magnet and NMR instrumentation was supported by NSF (DMR-1039938 and DMR-0603042) and NIH P41 GM122698. GPAY thanks the National Institutes of Health for grant S10 OD026896A. The authors acknowledge Gerald E. Decker and Casey A. Rowland for assistance in obtaining the X-ray structures.References
- R. Bossert, J. Chem. Educ., 1950, 27(1), 10–15 CrossRef CAS.
- E. Ordonez and J. Twilley, Anal. Chem., 1997, 69(13), 416A–422A CrossRef CAS.
- M.-C. Corbeil and L. Robinet, Powder Diffr., 2002, 17(1), 52–60 CrossRef CAS.
- . M. L. Kastens and F. R. Hansen, Ind. Eng. Chem., 1949, 41(10), 2080–2090 CrossRef.
- S. Basel, K. Bhardwaj, S. Pradhan, A. Pariyar and S. Tanang, ACS Omega, 2020, 5, 6666–6675 CrossRef CAS PubMed.
- C. Higgit, M. Spring and D. Saunders, Natl. Gallery Tech. Bull., 2003, 24, 75–95 Search PubMed.
- J. van der Weerd, M. Geldof, L. S. van der Loeff, R. M. A. Heern and J. J. Boon, Zeitschrift für Kunsttechnologie und Konservierung., 2003, 17, 407–416 Search PubMed.
- A. E. Jacobsen and W. H. Gardner, Ind. Eng. Chem., 1941, 33, 1254–1256 CrossRef CAS.
- K. Helwig, J. Poulin, M.-C. Corbeil, E. Moffatt and D. Duguay, in Issues in Contemporary Oil Paint, ed. K. Jan van den Berg, A. Burnstock, M. de Keijzer, J. Krueger, T. Learner, A. de Tagle and G. Heydenreich, Springer, Switzerland, 2014, pp. 167–184 Search PubMed.
- G. Osmond, Zinc Soaps: An Overview of Zinc Oxide Reactivity and Consequences of Soap Formation in Oil-Based Paintings, in Metal Soaps in Art, Conservation and Research, ed. F. Casadio, K. Keune, P. Noble, A. Van Loon, E. Hendriks, S. A. Centeno and G. Osmond, Springer, Switzerland, 2019, pp. 25–46 Search PubMed.
- P. Noble, in Metal Soaps in Art, Conservation and Research, ed. F. Casadio, K. Keune, P. Noble, A. Van Loon, E. Hendriks, S. A. Centeno and G. Osmond, Springer, Switzerland, 2019, pp. 1–22 Search PubMed.
- A. Burnstock, in Metal Soaps in Art, Conservation and Research, ed. F. Casadio, K. Keune, P. Noble, A. Van Loon, E. Hendriks, S. A. Centeno and G. Osmond, Springer, Switzerland, 2019, pp. 243–262 Search PubMed.
- . A. Sadek, S. Choopun, W. Wlodarski, S. Ippolito and K. Kalantar-zadeh, IEEE Sens. J., 2007, 7, 919–924 Search PubMed.
- A. Tsukazaki, A. Ohtomo, T. Onuma, M. Ohtani, T. Makino, M. Sumiya, K. Ohtani, S. Chichibu, S. Fuke, Y. Segawa, H. Ohno, H. Koinuma and M. Kawaski, Nat. Mater., 2005, 4, 42–46 CrossRef CAS.
- V. P. Shetti, S. D. Bukkitgar, K. R. Reddy, C. V. Reddy and T. M. Aminabhavi, Biosens. Bioelectron., 2019, 141, 111417 CrossRef PubMed.
- H. Kühn, in Artists’ Pigments A Handbook of Their History and Characteristics, ed. R. Feller, Archetype Publications, London, 1986, vol. 1, pp. 169–186 Search PubMed.
- N. Eastaugh, V. Walsh, T. Chaplin and R. Siddall, Pigment Compendium. A Dictionary of Historical Pigments, Elsevier Butterworth-Heinemann, Burlington, 2004 Search PubMed.
- J. Catalano, A. Murphy, Y. Yao, N. Zumbulyadis, S. Centeno and C. Dybowski, Understanding the Dynamics and Structure of Lead Soaps in Oil Paintings Using Multinuclear NMR in Metal Soaps in Art: Conservation and Research, ed. F. Casadio, K. Keune, P. Noble, A. van Loon, E. Hendriks, S. Centeno and G. Osmond, Springer, Heidelberg, 2019. DOI:10.1007/978-3-319-90617-1.
- L. Robinet and M.-C. Corbeil, Stud. Conserv., 2003, 48, 23–40 CrossRef CAS.
- J. van der Weerd, A. van Loon and J. J. Boon, Stud. Conserv., 2005, 50, 3–22 CrossRef CAS.
- M. J. Plater, B. De Silva, T. Gelbrich, M. B. Hursthouse, C. L. Higgitt and D. R. Saunders, Polyhedron, 2003, 22, 3171–3179 CrossRef CAS.
- L. Baij, J. Hermans, B. Ormsby, P. Noble, P. Iedema and K. Keune, Heritage Sci., 2020, 8, 1–23 Search PubMed.
- S. Garrappa, E. Koči, S. Švarcová, P. Bedzička and D. Hradil, Microchem. J., 2020, 156, 104842 CrossRef CAS.
- K. Keune and J. J. Boon, Stud. Conserv., 2007, 52, 161–176 CrossRef CAS.
- K. Keune and G. Boevé-Jones, in Issues in Contemporary Oil Paint, ed. K. J. van den Berg, A. Burnstock, M. de Keijzer, J. Kruger, T. Learner, A. de Tagle and G. Heydenreich, Springer International Publishing, Switzerland, 2014, pp. 283–294 Search PubMed.
- J. D. J. van den Berg, N. D. Vermist, L. Carlyle, M. Holcapek and J. J. Boon, J. Sep. Sci., 2004, 27, 181–199 CrossRef CAS PubMed.
- M. Lazzari and O. Chiantore, Polym. Degrad. Stab., 1999, 65, 303–313 CrossRef CAS.
- J. J. Boon, F. Hoogland and K. Keune, in 34th Annual Meeting of the American Institute for Conservation of Historic and Artistic Works. Ed. P. H. Mar, AIC Postprints, Providence, RI, 2006, pp. 16–23 Search PubMed.
- S. A. Centeno and D. Mahon, The Metropolitan Museum of Art Bulletin, Summer, The Metroplitan Museum of Art, New York, 2009, pp. 12–19 Search PubMed.
- K. Keune, A. van Loon and J. J. Boon, Microsc. Microanal., 2011, 17, 690–701 CrossRef PubMed.
- A. Artesani, Mater. Chem. Phys., 2020, 255, 123640 CrossRef CAS.
- J. Catalano, Y. Yao, A. Murphy, N. Zumbulyadis, S. A. Centeno and C. Dybowski, Appl. Spectrosc., 2014, 68, 280–286 CrossRef CAS PubMed.
- J. Catalano, A. Murphy, Y. Yao, F. Alkan, N. Zumbuladis, S. A. Centeno and C. Dybowski, J. Phys. Chem. A, 2014, 118, 7952–7958 CrossRef CAS PubMed.
- J. Catalano, A. Murphy, Y. Yao, G. P. A. Yap, N. Zumbylyadis, S. A. Centeno and C. Dybowski, Dalton Trans., 2015, 44, 2340–2347 RSC.
- T. Kobayashi, F. A. Perras, A. Murphy, Y. Yao, J. Catalano, S. A. Centeno, C. Dybowski, N. Zumbulyadis and M. Pruski, Dalton Trans., 2017, 46, 3535–3540 RSC.
- E. Kočí, J. Rohlíček, L. Kobera, J. Plocek, S. Švarocová and P. Bezdička, Dalton Trans., 2019, 48, 12531 RSC.
- S. Švarcová, E. Kočí, P. Bezdička, S. Garrappa, L. Kobera, J. Plocek, J. Brus, M. Št'astny and D. Hradil, Dalton Trans., 2020, 49, 5044 RSC.
- S. Švarcová, E. Koči, J. Plocek, A. Zhankina, J. Hradilová and P. Bezdička, J. Cult. Herit., 2019, 38, 8–19 CrossRef.
- R. Barannikov, E. Kočí, P. Bezdička, L. Kobera, A. Mahun, J. Rohlíček, J. Plocek and S. Švarcová, Dalton Trans., 2022, 51, 4019 RSC.
- T. J. Bastow, J. Phys.: Condens. Matter, 1996, 8, 11309–11315 CrossRef CAS.
- G. Wu, S. Kroeker and R. E. Wasylishen, Inorg. Chem., 1995, 34, 1595–1598 CrossRef CAS.
- A. C. Kunwar, G. L. Turner and E. Oldfield, J. Magn. Reson., 1986, 69, 124–127 CAS.
- S. Sham and G. Wu, Can. J. Chem., 1999, 77, 1782–1787 CrossRef CAS.
- R. Ida and G. Wu, J. Phys. Chem. A, 2002, 106, 11234–11239 CrossRef CAS.
- F. H. Larsen, A. S. Lipton, H. J. Jakobsen, N. C. Nielsen and P. D. Ellis, J. Am. Chem. Soc., 1999, 121, 3783–3784 CrossRef CAS.
- A. S. Lipton, C. Bergquist, G. Parkin and P. D. Ellis, J. Am. Chem. Soc., 2003, 125, 3768–3772 CrossRef CAS PubMed.
- A. S. Lipton, R. W. Heck and P. D. Ellis, J. Am. Chem. Soc., 2004, 126, 4735–4739 CrossRef CAS PubMed.
- A. S. Lipton, R. W. Heck, G. R. Staeheli, M. Valiev, W. A. De Jong and P. D. Ellis, J. Am. Chem. Soc., 2008, 130, 6224–6230 CrossRef CAS PubMed.
- A. Sutrisno, V. Terskikh, Q. Shi, Z. Song, J. Dong, S. Ding, W. Wang, B. Provost, T. Daff, T. Woo and Y. Huang, Chem. – Eur. J., 2012, 18, 12251–12259 CrossRef CAS PubMed.
- R. Madsen, A. Qiao, J. Sen, I. Hung, K. Chen, Z. Gan, S. Sen and Y. Yue, Science, 2020, 367, 1473–1476 CrossRef CAS PubMed.
- M.-C. Corbeil and L. Robinet, Powder Diffr., 2002, 17, 52–60 CrossRef CAS.
- W. Clegg, D. Harbron, C. Homan, P. Hunt, I. Little and B. Straughan, Inorg. Chim. Acta, 1991, 186, 51–60 CrossRef CAS.
- Y. Yao, G. P. A. Yap, J. Catalano, N. Zumbulyadis, S. A. Centeno and C. Dybowski, CSD Commun., 2018, 1576707 Search PubMed.
- Apex3, Bruker AXS Inc., Madison, WI, 2015 Search PubMed.
- G. M. Sheldrick, Acta Crystallogr., Sect. A: Found. Adv., 2015, 71, 3–8 CrossRef PubMed.
- G. M. Sheldrick, Acta Crystallogr., Sect. C: Struct. Chem., 2015, 71, 3–8 Search PubMed.
- R. K. Harris, E. D. Becker, S. M. C. De Menezes, R. Goodfellow and P. Granger, Pure Appl. Chem., 2001, 73, 1795–1818 CrossRef CAS.
- S. G. J. van Meerten, W. M. J. Franssen and A. P. M. Kentgens, J. Magn. Reson., 2019, 301, 56–66 CrossRef CAS PubMed.
- C. Morcombe and K. Zilm, J. Magn. Reson., 2003, 162, 479–486 CrossRef CAS PubMed.
- W. Clegg, I. Little and B. P. Straughan, Acta Crystallogr., Sect. C: Cryst. Struct. Commun., 1986, 42, 1701–1703 CrossRef.
- F. Lacouture, J. Peultier, M. Francois and J. Steinmetz, Acta Crystallogr., Sect. C: Cryst. Struct. Commun., 2000, 56, 556–557 CrossRef PubMed.
- W. Clegg, I. R. Little and B. R. Straughan, Acta Crystallogr., Sect. C: Cryst. Struct. Commun., 1987, 43, 456–457 CrossRef.
- J. Blair, R. A. Howie and J. L. Wardell, Acta Crystallogr., Sect. C: Cryst. Struct. Commun., 1993, 49, 219–221 CrossRef.
- R. A. Taylor and H. A. Ellis, Acta Crystallogr., Sect. E: Struct. Rep. Online, 2008, 64, m895 CrossRef CAS PubMed.
- R. A. Taylor, H. A. Ellis, P. Maragh and N. White, J. Mol. Struct., 2006, 787, 113–120 CrossRef CAS.
- P. Segedin, N. Lah, M. Zefram, I. Leba and L. Golic, Acta Chim. Slov., 1999, 46, 173–184 CAS.
- J. Peultier, M. Francois and J. Steinmetz, Acta Crystallogr., Sect. C: Cryst. Struct. Commun., 1999, 55, 2064–2065 CrossRef.
- P. Nelson and R. Taylor, Appl. Petrochem. Res., 2014, 4, 253–285 CrossRef CAS.
- A. Mesbah, C. Juers, E. François, R. Steinmetz and J. Steinmetz, Z. Kristallogr., 2007, 26, 593–598 CrossRef.
- J. J. Hermans and K. Helwig, Appl. Spectrosc., 2020, 74(12), 1505–1514 CrossRef CAS PubMed.
- M. Beerse, K. Keune, P. Iedema, S. Wouterson and J. Hermans, ACS Appl. Polym. Mater., 2020, 2, 5674–5685 CrossRef CAS.
- A. E. Goeta and J. A. K. Howard, Chem. Soc. Rev., 2004, 33, 490–500 RSC.
- J. Hermans, K. Keune, A. van Loon and P. D. Iedema, J. Anal. At. Spectrom., 2015, 30, 1600–1608 RSC.
- J. Hermans, K. Keune, A. van Loon and P. D. Iedema, Phys. Chem. Chem. Phys., 2016, 18, 10896–10905 RSC.
- F. Gabrieli, F. Rosi, A. Vichi, L. Cartechini, L. P. Buemi, S. G. Kazarian and C. Miliani, Anal. Chem., 2017, 89, 1283–1289 CrossRef CAS PubMed.
- J. J. Hermans, L. Baij, M. Koenis, K. Keune, P. Iedema and S. Woutersen, Sci. Adv., 2019, 5, EAAW3592 CrossRef CAS PubMed.
- T. Ishioka, K. Maeda and I. Kanesaka, in Spectroscopy of Biological Molecules: New Directions, ed. J. Greve, G. J. Puppels and C. Otto, Springer, Dordrecht, 1999, pp. 313–314 Search PubMed.
- T. Ishioka, K. Maeda, I. Watanabe, S. Kawauchi and M. Harada, Spectrochim. Acta, Part A, 2000, 56, 1731–1737 CrossRef PubMed.
- N. Alcock, V. Tracy and T. Waddington, Dalton Trans., 1976, 21, 2243–2246 RSC.
- R. Taylor and H. Ellis, Spectrochim. Acta, Part A, 2007, 68, 99–107 CrossRef PubMed.
- P. Nelson, R. Taylor and H. Ellis, J. Mol. Struct., 2013, 1034, 75–83 CrossRef CAS.
- P. Nelson, H. Ellis and R. Taylor, J. Mol. Struct., 2010, 982, 10–15 Search PubMed.
- S. Barman and S. Vasudevan, J. Phys. Chem. B, 2007, 111, 5212–5217 CrossRef CAS PubMed.
- C. A. Maines, D. Rogala, S. Lake and M. Mecklenberg, Deterioration in Abstract Expressionist Paintings: Analysis of Zinc Oxide Paint Layers in Works from the Collection of the Hirshhorn Museum and Sculpture Garden, Smithsonian Institution, MRS Proc. Online, 2011, 1319 DOI:10.1557/opl.2011.733.
- Y. Huang and A. Sutrisno, Annu. Rep. NMR Spectrosc., 2014, 81, 1–46 CrossRef CAS.
- S. F. Dec, M. F. Davis, G. E. Maciel and C. E. Bronniman, Inorg. Chem., 1993, 32, 955–959 CrossRef CAS.
- G. Wu, Chem. Phys. Lett., 1998, 298, 375–380 CrossRef CAS.
- F. H. Larsen, J. Skibsted, H. J. Jakobsen and N. Nielsen, J. Am. Chem. Soc., 2000, 122, 7080–7086 CrossRef CAS.
- K. H. Mroué and W. P. Power, J. Phys. Chem. A, 2010, 114, 324–335 CrossRef PubMed.
Footnote |
| † Electronic supplementary information (ESI) available. CCDC 2088849–2088851. For ESI and crystallographic data in CIF or other electronic format see DOI: https://doi.org/10.1039/d3dt00184a |
| This journal is © The Royal Society of Chemistry 2023 |