
 Open Access Article
 This Open Access Article is licensed under a Creative Commons Attribution-Non Commercial 3.0 Unported Licence
A novel 2,6-bis(benzoxazolyl)phenol macrocyclic chemosensor with enhanced fluorophore properties by photoinduced intramolecular proton transfer†
Daniele
Paderni
 a,
Giampaolo
Barone
*b,
Luca
Giorgi
*a,
Mauro
Formica
a,
Eleonora
Macedi
a and
Vieri
Fusi
a
a,
Giampaolo
Barone
*b,
Luca
Giorgi
*a,
Mauro
Formica
a,
Eleonora
Macedi
a and
Vieri
Fusi
a
aDipartimento di Scienze Pure e Applicate (DiSPeA), Università di Urbino “Carlo Bo”, Piazza Rinascimento 6, I-61029 Urbino, Italy. E-mail: luca.giorgi@uniurb.it
bDipartimento di Scienze e Tecnologie Biologiche, Chimiche e Farmaceutiche (STeBiCeF), Università degli Studi di Palermo, Viale delle Scienze, Edificio 17, 90128 Palermo, Italy. E-mail: giampaolo.barone@unipa.it
First published on 17th February 2023
Abstract
Macrocyclic ligand L, in which a 2,6-bis(2-benzoxazolyl)phenol (bis-HBO) group is incorporated in triethylenetetramine, was designed and synthesized with the aim of creating a chemosensor with high selectivity and specificity for metal cations in an aqueous environment. The availability of several proton acceptors and donors, and amine and phenol hydroxy groups, respectively, affects the keto–enol equilibrium in both the ground and excited states, and the ligand properties show dependence on the pH of the solution. L is fluorescent in the visible range, through an excited-state intramolecular proton transfer (ESIPT) mechanism. The results of an exhaustive characterization of L by spectroscopic techniques and DFT calculations, as well as of its Zn(II), Cd(II) and Pb(II) complexes, show promising properties of L as a ratiometric metal cation chemosensor, since metal coordination prevents the ESIPT and gives rise to a peculiar displacement of the fluorescence emission from green to blue with Zn(II) and Cd(II), while with Pb(II) the fluorescence is quenched.
Introduction
One of the most active research fields in host–guest chemistry is the synthesis of molecular systems suitable for the recognition, sequestration and/or activation of metal cations, anions or molecules of biological interest.1–3 Among the systems useful for this purpose, chemosensors based on polyazamacrocycles are of particular relevance.4–6 These molecules contain a macrocyclic polyamine capable of binding an analyte and a fluorophore acting as the signaling unit, which could be linked to the macrocyclic scaffold as a side arm or integrated into the macrocyclic structure; the interaction of the analyte with the receptor leads to a change in the emission properties of the fluorophore (namely, signal transduction) constituting the output response of the system.7 In the design of fluorescence sensors, particular attention must be devoted to the comprehension of the signal transduction mechanism, which is regulated by specific physical–chemical processes occurring when a ligand interacts with an analyte. The most common mechanisms include photoinduced electron transfer (PET), photoinduced charge transfer (PCT), twisted intramolecular charge transfer (TICT), photoinduced energy transfer (PeT) and excited-state intramolecular proton transfer (ESIPT). The latter (Fig. 1 left) consists of a four-level photochemical process in which a fluorophore undergoes a photoinduced keto–enol tautomerization equilibrium in the excited state, giving rise to a high Stokes shift.8,9 Molecules suitable for this process generally undergo intramolecular hydrogen bond interaction between a H-bond donor, such as –OH or –NH–, and an unsaturated H-bond acceptor, such as C![[double bond, length as m-dash]](https://www.rsc.org/images/entities/char_e001.gif) N– or CO. The most common ESIPT fluorophores are based on systems containing a phenol group as the H-bond donor and an N-heterocycle as the H-bond acceptor, such as 2-(2-hydroxyphenyl)benzimidazole (HBI), 2-(2-hydroxyphenyl)benzoxazole (HBO) and 2-(2-hydroxyphenyl)benzothiazole (HBT) (Fig. 1). In the ground state, these fluorophores are stable in the enol form (E), but upon photoexcitation (E*), a redistribution of the electronic density takes place, resulting in higher acidity of the hydrogen bond donor group and increased basicity of the hydrogen bond acceptor. This determines in turn the transfer of the acidic proton from the H-bond donor to the acceptor, giving rise to the keto-tautomer which is the most stable form in the first excited state (K*). In case the excited keto-form decays radiatively, fluorescence emission is detected. The emission wavelength is strongly red-shifted with respect to the excitation one, since in the ground state, the enol form is more stable than the keto form, while in the excited state, the stability of the two tautomers is reversed, resulting in a higher absorption energy gap between E and E* than the emission energy gap between K* and K. After the emission, in the ground state, the keto form K converts into the enol tautomer E through a thermic reverse proton transfer (RPT) process (Fig. 1, left).8
N– or CO. The most common ESIPT fluorophores are based on systems containing a phenol group as the H-bond donor and an N-heterocycle as the H-bond acceptor, such as 2-(2-hydroxyphenyl)benzimidazole (HBI), 2-(2-hydroxyphenyl)benzoxazole (HBO) and 2-(2-hydroxyphenyl)benzothiazole (HBT) (Fig. 1). In the ground state, these fluorophores are stable in the enol form (E), but upon photoexcitation (E*), a redistribution of the electronic density takes place, resulting in higher acidity of the hydrogen bond donor group and increased basicity of the hydrogen bond acceptor. This determines in turn the transfer of the acidic proton from the H-bond donor to the acceptor, giving rise to the keto-tautomer which is the most stable form in the first excited state (K*). In case the excited keto-form decays radiatively, fluorescence emission is detected. The emission wavelength is strongly red-shifted with respect to the excitation one, since in the ground state, the enol form is more stable than the keto form, while in the excited state, the stability of the two tautomers is reversed, resulting in a higher absorption energy gap between E and E* than the emission energy gap between K* and K. After the emission, in the ground state, the keto form K converts into the enol tautomer E through a thermic reverse proton transfer (RPT) process (Fig. 1, left).8
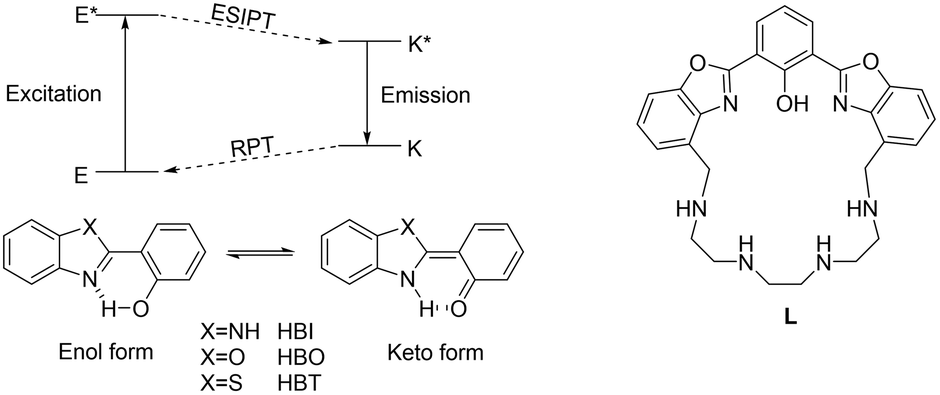 | ||
| Fig. 1 Left: the schematic of the ESIPT and the RPT processes in 2-(2-hydroxyphenyl)benzimidazole (HBI), 2-(2-hydroxyphenyl)benzoxazole (HBO) and 2-(2-hydroxyphenyl)benzothiazole (HBT).8 Right: the structure of the ligand L, containing the bis-HBO fluorophore. | ||
Several receptors employing the ESIPT paradigm have been synthesized, by linking a suitable ESIPT fluorophore to a receptor unit. In this paper we describe a preliminary study on a new receptor based on the ESIPT fluorophore 2,6-bis(2-benzoxazolyl)phenol (bis-HBO) incorporated into a polyamine macrocycle (L, Fig. 1, right). The photochemical behavior of L in aqueous solution, in both ground and excited states, was investigated by several spectroscopic techniques and by DFT calculations. The advantage of macrocyclic ligands is in fact the combination of high selectivity and specificity for metal cations, making them suitable for sensing in aqueous solution.
Synthesis of ligand L
The synthesis of L is reported in Scheme 1. The macrocyclic structure of L contains a bis-HBO fluorophore in which the two benzoxazole groups are connected by a triethylenetetramine chain through two methylene spacers; L was synthesized using the Richman–Atkins annulation10 of 2,6-bis(4-bromomethylbenzoxazol-2-yl)anisole (6) with 1,4,7,10-tetrakis(4-toluensulfonyl)-1,4,7,10-tetraazadecane (7)11 followed by the removal of the methyl group of anisole and the four sulfonyl groups on the amines by treatment with HBr in acetic acid in the presence of phenol as a scavenger. The ligand was purified as a tetraperchlorate salt (L·4HClO4) by re-crystallization from a hot ethanol/70% aqueous perchloric acid mixture. The key intermediate 6 was synthesized by radical bromination with NBS of the dimethyl-analogue 2,6-bis(4-methylbenzoxazol-2-yl)anisole (5), which was obtained in turn by condensation of 2-methoxyisophthalic acid (2) with two equivalents of 2-amino-3-methylphenol (3) in polyphosphoric acid (PPA) at 160 °C. This reaction led to the de-methylation of the phenol group (4); thus, a further methylation step was necessary to obtain the protected fluorophore (5). 2 has been synthesized by the oxidation of 2,6-dimethylanisole (1) with potassium permanganate in an alkaline aqueous suspension.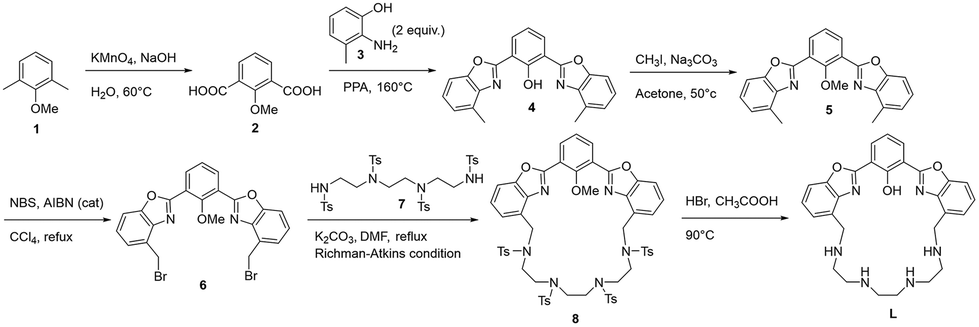 | ||
| Scheme 1 Synthetic pathway to obtain L. | ||
Solution studies
Acid–base properties
L contains four secondary amines and a phenol group; thus it can in principle behave as a tetraprotic base and a monoprotic acid in aqueous solution, giving rise to six possible protonation forms ranging from the fully protonated H4L4+ to the deprotonated H−1L− species. The acid–base behavior of the ligand was studied using absorption and emission spectrophotometry and NMR spectroscopy.Spectrophotometric titrations
UV-Vis absorption and fluorescence electronic spectra of L were acquired in aqueous solution at different pH values (Fig. 2), in order to obtain information about the photophysical properties of the ligand in solution. At pH values below 2.0, the absorption spectrum exhibits two main bands at 293 nm (ε = 23![[thin space (1/6-em)]](https://www.rsc.org/images/entities/char_2009.gif) 700 cm−1 mol−1 dm3) and 342 nm (ε = 16600 cm−1 mol−1 dm3). Upon increasing the pH, by adding a little amount of NaOH solution, these two bands decrease in intensity and totally disappear at pH = 12, while starting from pH = 6, a new absorption band at 405 nm appears, which reaches its maximum intensity at pH = 12 (ε = 8700 cm−1 mol−1 dm3); along the titration, a well-defined isosbestic point at 367 nm is observed (Fig. 2). The two absorption bands at 293 and 342 nm were attributed to the π* ← π and π* ← n transitions of the protonated forms of the fluorophore, i.e., L and HL+, while the band at 405 nm was attributed to the π* ← n transition of the corresponding deprotonated form, i.e., H−1L− (vide infra).
700 cm−1 mol−1 dm3) and 342 nm (ε = 16600 cm−1 mol−1 dm3). Upon increasing the pH, by adding a little amount of NaOH solution, these two bands decrease in intensity and totally disappear at pH = 12, while starting from pH = 6, a new absorption band at 405 nm appears, which reaches its maximum intensity at pH = 12 (ε = 8700 cm−1 mol−1 dm3); along the titration, a well-defined isosbestic point at 367 nm is observed (Fig. 2). The two absorption bands at 293 and 342 nm were attributed to the π* ← π and π* ← n transitions of the protonated forms of the fluorophore, i.e., L and HL+, while the band at 405 nm was attributed to the π* ← n transition of the corresponding deprotonated form, i.e., H−1L− (vide infra).
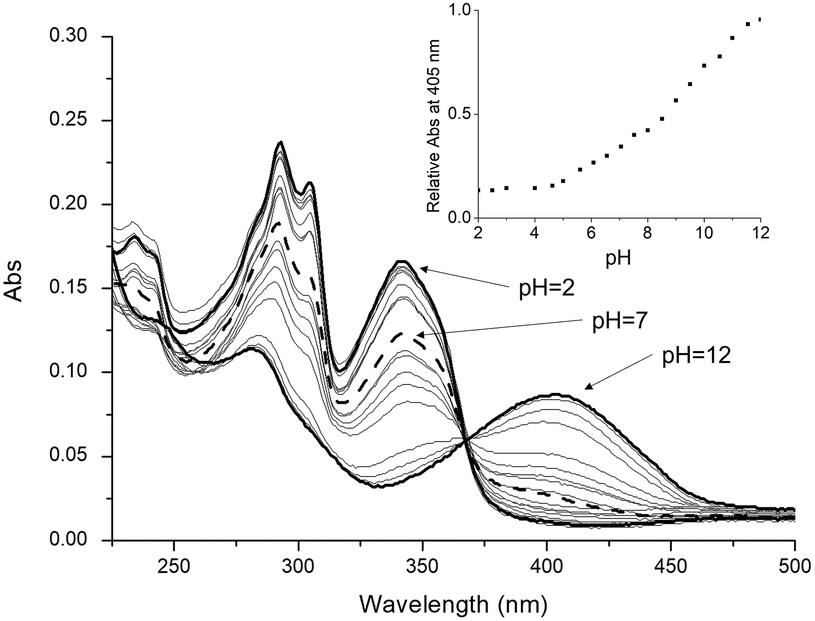 | ||
| Fig. 2 UV-Vis absorption spectra of L registered in aqueous solution in the pH range 2.0–12.0, at 298 K. Experimental conditions: [L] = 1.0 × 10⁻⁵ mol dm−3 and pH adjusted by adding HCl or NaOH aqueous solutions. The intensity increase at 405 nm as a function of pH is shown in the inset. | ||
The absorption trend at 405 nm as a function of pH (inset of Fig. 2) shows that since its appearance at pH = 6.0, this band steeply grows up to pH = 8.5, and then a decrease in the slope occurs, followed by a further increase in the absorption intensity up to alkaline pH values. This trend indicates that moving from pH 6 to alkaline pH values, two consecutive deprotonation steps involving the fluorophore occur, presumably from HL+ to H–1L– (vide infra).
To investigate this behavior more in depth, pH-dependent fluorescence spectra were acquired by exciting at 405 nm, 342 nm and 367 nm, i.e., corresponding to the deprotonated and protonated forms of the fluorophore and the isosbestic point of the pH-metric titration, respectively (Fig. 3). In alkaline solution (pH = 12.0), when the fluorophore is deprotonated, by exciting at 405 nm, a single emission band at 476 nm is detected (Stokes shift = 3683 cm−1, Φ = 0.23) (Fig. 3C), which is attributed to the radiative decay of the deprotonated H–1L− species. In acidic solution (pH = 2.0), when the fluorophore is in the fully protonated form, upon excitation at 342 nm two emission bands appear at 380 nm (Stokes shift = 2924 cm−1, Φ = 0.05) and 507 nm (Stokes shift = 9516 cm−1, Φ = 0.28) (Fig. 3A), with the second band being six times more intense than the first one. This double-band emission suggests that under these conditions the ligand undergoes an ESIPT process: signals at 380 nm and 507 nm can be indeed attributed to the radiative relaxation of the enol form and the keto form of the fluorophore, respectively. The high intensity of the keto-form emission band means that the ESIPT process is fast and occurs when the fluorophore is in the protonated phenolic form. Upon increasing the pH and keeping the excitation wavelength constant, both bands decrease in emission intensity due to the drop in absorptivity in the UV-Vis spectrum, and the band at 380 nm disappears at pH = 6. Going towards alkaline pH values, the band of the keto form at 507 nm shifts towards higher energy, reaching 476 nm at pH = 12, corresponding to the emission of the anionic H–1L– form (Fig. 3A).
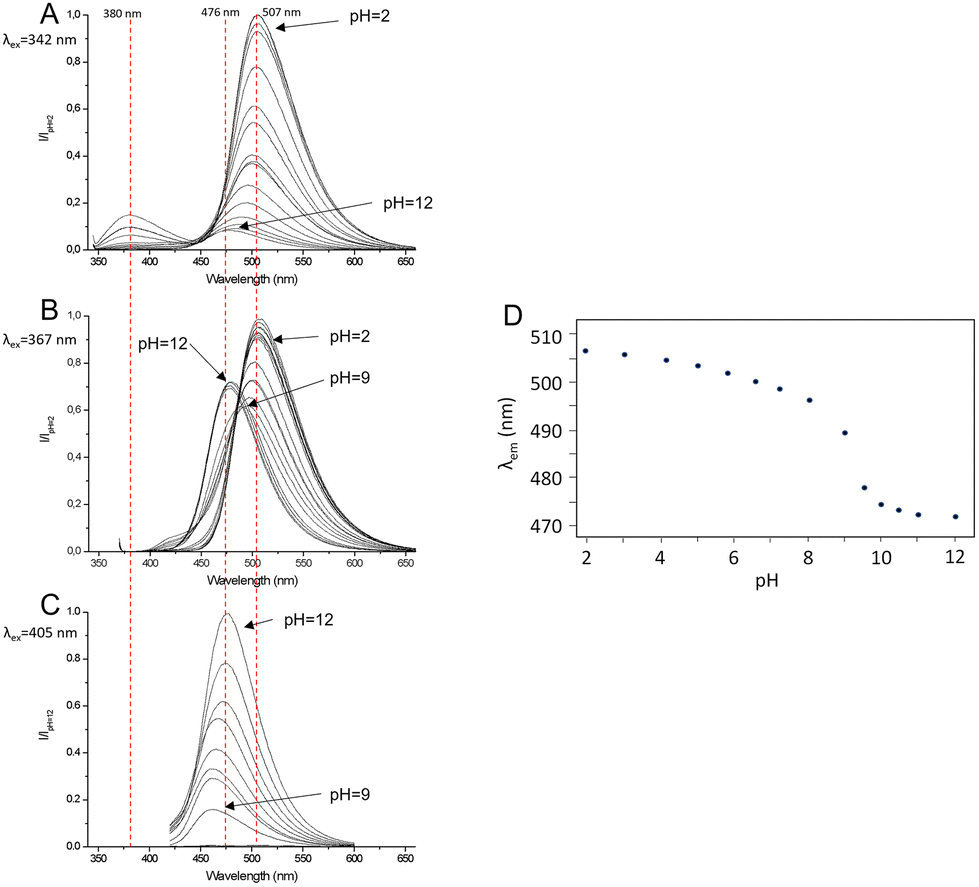 | ||
| Fig. 3 Emission spectra of L at different pH values obtained by exciting at 342 nm (A), 367 nm (B) and 405 nm (C). (D) Trend of the observed emission maximum wavelength of L as a function of pH by exciting at the isosbestic point (367 nm). | ||
This apparent shift of the maximum of the emission band is the result of the simultaneous and gradual decrease in the intensity of the keto-band and the increase in the deprotonation band, partially superimposed and occurring at the same time. The excitation at the isosbestic point (λex = 367 nm, Fig. 3B) allows one to appreciate the transition between the keto emission band at 507 nm, related to the species L or HL+, and the deprotonation emission band at 476 nm, related to H–1L–. Fig. 3D shows the trend of the maximum emission wavelength of the fluorophore as a function of pH and shows that the deprotonation of the phenolic group takes place at pH = 9. The deconvolution of the emission spectrum at pH = 9 collected by excitation at the isosbestic point confirms that the apparent continuous transition from 507 nm to 476 nm of the emission band is in fact attributable to the superimposition of the band at 507 nm, which decreases in intensity, and that at 476 nm increases in intensity (Fig. S1†).
NMR studies
The proton distribution in the acid–base species of the ligand was assessed by combining the absorption and fluorescence spectroscopy results with NMR data. In detail, 1H-NMR spectra at different pH values were acquired in D2O/acetonitrile-d6 40/60 v/v, in the same pH range of the spectroscopic measurements (Fig. S2†). The experiments were not conducted in pure D2O due to the low solubility of the ligand at pH > 8 at the NMR sample concentrations. The initial pH was adjusted to 11.6 directly in the NMR tube, by adding a KOD solution in D2O, and successively the pH was decreased step-by step by adding dropwise a DCl solution in D2O. Due to the presence of acetonitrile, the pH values were corrected as described in the literature, by subtracting the constant 0.9.12 2D standard correlation experiments were performed to assign all signals. At pH = 11.6, the 1H-NMR spectrum shows three aliphatic and five aromatic resonances: a multiplet at δ = 2.80 ppm, integrating eight protons (8H) attributed to the resonances of H1 and H2 (H1 + H2, m, 8H); a triplet at 2.87 ppm (H3, t, J = 5.5 Hz, 4H); a singlet at 4.06 ppm (H4, s, 4H); a triplet at 6.91 ppm (H9, t, J = 8.0 Hz, 1H); a doublet at 7.28 (H5, d, J = 7.7 Hz, 2H); a triplet at 7.36 ppm (H6, t, J = 7.8 Hz, 2H); a doublet at 7.57 ppm (H7, d, J = 8.0 Hz, 2H); and a doublet at 8.13 ppm (H8, d, J = 7.8 Hz, 2H). The 13C-NMR spectrum exhibits a total of fifteen signals (see the Experimental section): eleven for the aromatic and four for the aliphatic resonances, suggesting, together with the 1H spectrum, the presence of a C2v symmetry for the ligand in solution, mediated on the NMR time scale due to the flexibility of the aliphatic chain at room temperature. The trend of the 1H-NMR signals as a function of pH is shown in Fig. 4A, while the values of the chemical shift for all protons as a function of pH are reported in Table S1.†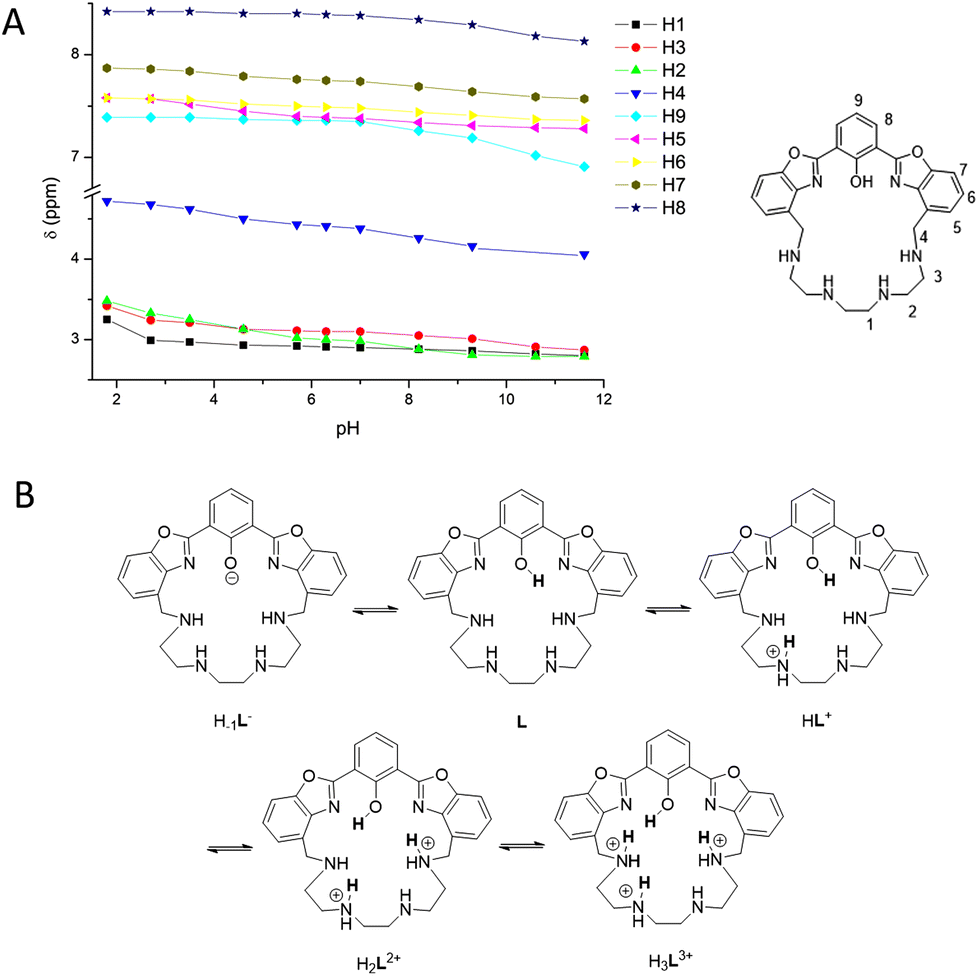 | ||
| Fig. 4 (A) Trend of the 1H-NMR signals of L as a function of pH. Proton labels are shown in the structure on the right. (B) Proposed disposition of acidic protons in the species from H–1L− to H3L3+. | ||
Starting from pH = 11.6, where the presence of the deprotonated H–1L− species can be hypothesized (see the Spectrophotometric titrations section), and going towards acidic pH values, a general down-field shift of all the aromatic signals and of the two aliphatic H4 and H3 protons occurs, until pH = 9.3. This shift is particularly evident for the signals of the H8 and H9 atoms of the phenolate ring. This result indicates that the first protonation step to give the neutral L species mainly involves the phenolate oxygen atom and that the OH proton is strongly shared with the benzylic amines. In the pH range 9.3–7.0, all signals continue to shift downfield with the main aliphatic shift observed for H2, H3 and H4, suggesting that the second protonation step mainly involves one of the non-benzylic amines, to give the HL+ species. Upon lowering the pH up to 5.6, no significant changes were noticed, indicating the prevalence in the 7.0–5.7 pH range of the HL+ species. A further lowering of the pH from 5.7 to 2.7 induces a downfield shift of the signals of benzylic H4, aliphatic H2 and H3 and aromatic H5 protons, the latter being in the ortho-position to the macrocyclic structure, suggesting that a third protonation step occurs mainly involving a benzyl amine to form the H2L2+ species. The last protonation step of the polyamine chain to give the H3L3+ species is detectable only at strongly acidic pH (<2.7), as indicated by the marked down-field displacement of the three aliphatic H1, H2 and H3 signals. Therefore, by combining the UV-Vis and NMR studies, it is possible to conclude that under the experimental conditions used, the ligand exists as the tri-protonated species H3L3+ in strong acidic media and in the deprotonated H−1L− form at pH > 9.3. Under neutral conditions, a mixture of the monoprotonated HL+ and neutral L species is present in solution. Fig. 4B presents the proposed proton distribution in the L species as a function of pH.
DFT calculations
DFT calculations have been carried out on the species H−1L−, L and HL+, with the aim of explaining the observed absorption and emission behavior of the ligand in aqueous solution as a function of pH. The structures and the corresponding relative energy values of the most stable conformations, showing the disposition of acidic protons in the species envisaged by spectroscopic investigations, are reported in Fig. S3.† The three aromatic rings of the macrocyclic ligand adopt an almost coplanar conformation in the most stable species of the anionic, neutral and cationic ligands. The most stable species of the neutral and cationic ligands show a non-deprotonated phenol group, in agreement with the NMR and UV-Vis absorption data. The absorption spectra calculated for the most stable isomers of each protonated form (Fig. S4†), although being red-shifted by about 50 nm compared to the corresponding experimental spectra, allowed one to clearly indicate that at higher pH the existing species is indeed the enolate H−1L− species. On the other hand, the calculated spectra of L and HL+ can be essentially superimposed.To support the interpretation of the 1H-NMR experiments, the chemical shift values of the benzylic and aromatic protons (H4 and H9 in Fig. 4, respectively) have been calculated for the three H−1L−, L and HL+ species (Fig. 5). The four values of the H4 protons have been averaged and reported in Table 1 and, together with those of H9, they are in good agreement with the corresponding experimental data, confirming the reliability of the calculated structures.
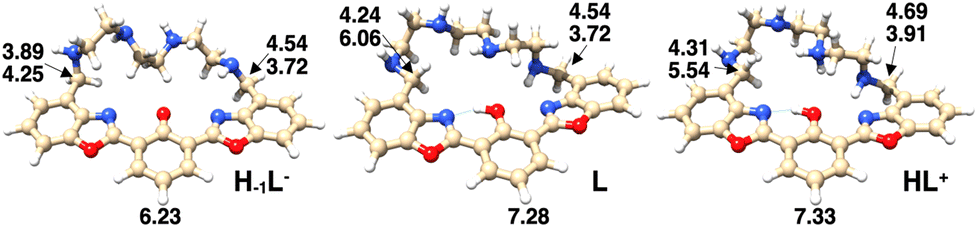 | ||
| Fig. 5 Chemical shift values for the benzylic protons (H4) and for the protons in the para position to the hydroxy phenol group (H9), obtained by DFT calculations for the most stable isomers of the H−1L−, L and HL+ species. | ||
| Species | H4 | H9 | ||
|---|---|---|---|---|
| Calculated (average) | Experimental | Calculated | Experimental | |
| H–1L− | 4.00 | 4.06 (pH = 11.6) | 6.23 | 6.91 (pH = 11.6) |
| L | 4.64 | 4.38 (pH = 7.2) | 7.28 | 7.35 (pH = 7.0) |
| HL+ | 4.61 | 4.62 (pH = 5.6) | 7.33 | 7.39 (pH = 5.7) |
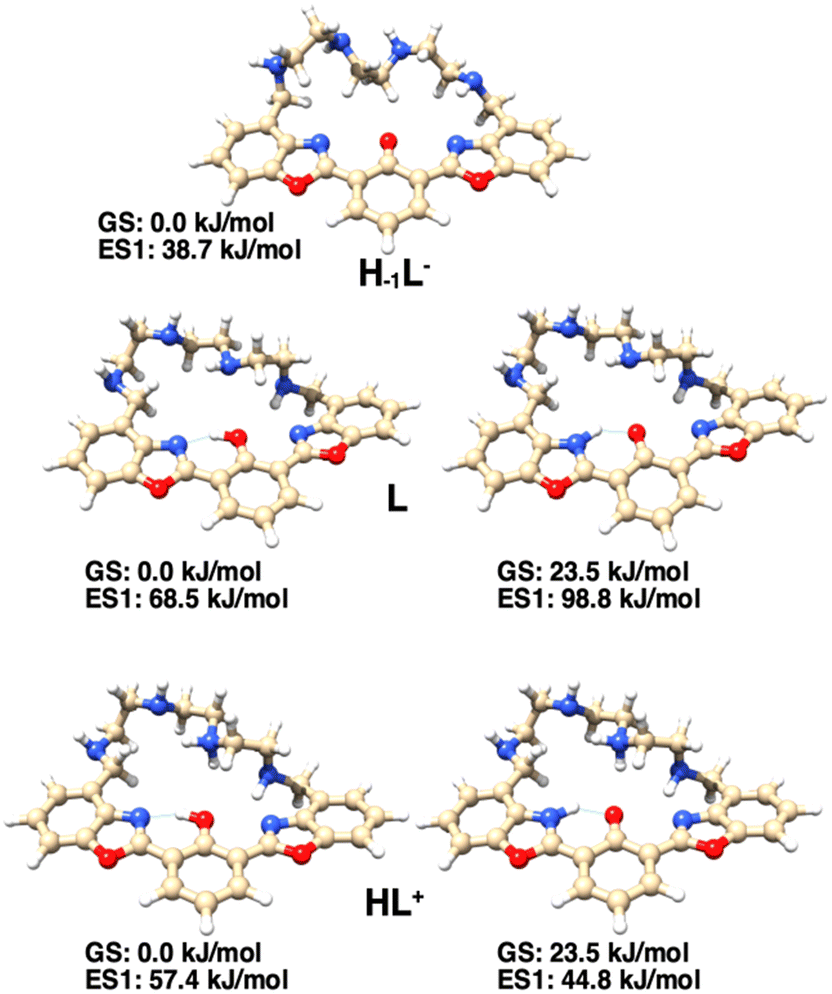
The presence of the ESIPT mechanism in the excited state is also confirmed by the DFT calculation on the protonated form of the ligand, HL+. In fact, for this species, while in the ground state, the enol form is more stable than the keto one by 23.5 kJ mol−1; in the single electron excited state, the keto form is more stable than the enol one by 12.6 kJ mol−1 (Fig. 6). As for the neutral ligand L, the excited state of the keto form is still less stable than that of the corresponding enol form.
 | ||
| Fig. 6 Excited-state structures and relative energies of the most stable enol forms of H–1L−, L and HL+ (left) and of their keto tautomers (right), obtained by TD-DFT calculations. For L and HL+ species, the reported energy values are relative to the enolic ground state on the left. | ||
Altogether, spectroscopic and theoretical studies confirm the occurrence of an ESIPT mechanism regulating the emission of the species in which the fluorophore is in the protonated phenolic form HL+, whose formation starts at pH < 9.3.
The photochemical behavior of the ligand is outlined in Fig. 7: when the phenolic proton is present (L and HL+ species), the ligand may undergo a keto–enol tautomerism, in which in the ground state the enol form is the most stable. However, only in the excited state of HL+, the keto form (K*, 44.8 kJ mol−1), responsible for the characteristic ESIPT-mediated four-level double emission, is more stable than the corresponding enol form (E*, 57.4 kJ mol−1). Such stabilization of the keto form in the excited state is not observed for the neutral species L (K*, 98.8 kJ mol−1vs. E*, 68.5 kJ mol−1), so the emission of the enol form is observed. Moreover, when the fluorophore is deprotonated (H–1L– species), such tautomerism cannot occur and the system acts as a normal two-level emitter, with the emission of the deprotonated form being observed.
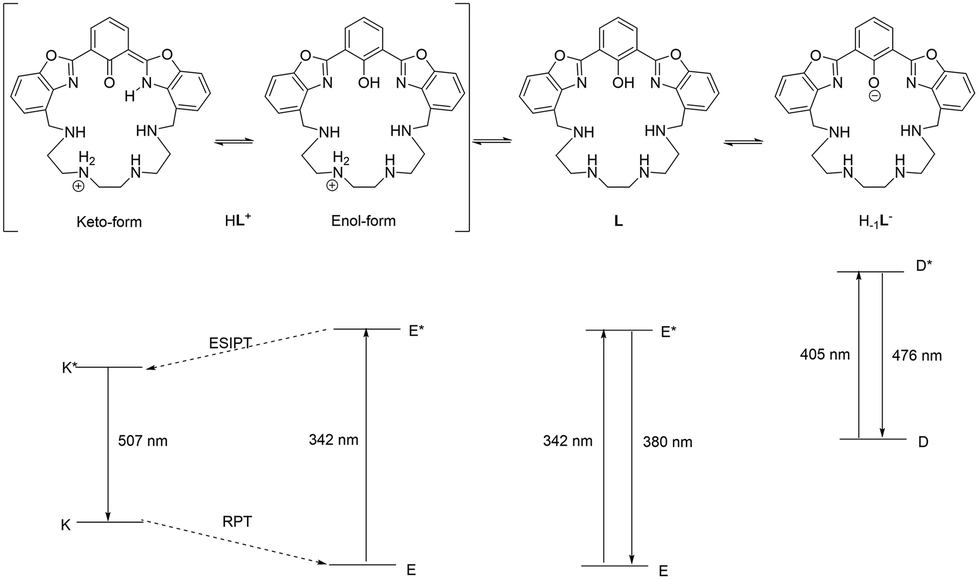 | ||
| Fig. 7 Schematic of the photophysical processes occurring in the excited states of HL+, L and H–1L− (E = enol form, K = keto form, D = deprotonated form, and * indicates the corresponding first singlet excited state). | ||
Metal coordination
Spectrophotometric titrations
Ligand–metal ion interaction studies were conducted through spectrophotometric and spectrofluorimetric titrations, by adding Zn(II), Cd(II) and Pb(II) ions as perchlorate salts to an aqueous solution of the ligand, buffered at pH = 7.0 using 0.001 mol dm−3 Tris-HCl (Fig. 8). The aim of the experiments was to evaluate the photophysical changes of the ligand upon interaction with closed-shell metal ions, such as d10 Zn(II) and Cd(II), with different sizes, and with a heavy metal ion such as Pb(II), which possesses slight reducing properties. The employment of these metal ions allows for any change to be attributed only to the involvement of the donor atoms of L in the bonds with the metal ions, without paramagnetic interactions and/or ML/LM charge transfer contributions. Under these conditions, the neutral L and protonated HL+ species prevail in solution. The addition of the metal ions caused a decrease in the absorption band at 342 nm, attributed to the ligand enol form, and the growth of the band at 405 nm, attributed to the deprotonated form of the fluorophore, suggesting the involvement of the phenolic OH group in the coordination, whose acidity is increased by the interaction with the metal ion. The addition of Zn(II) ions caused a linear increase in the absorbance of the band at 405 nm up to two equivalents, and then a plateau is reached, suggesting the formation of the species with a 1:2 L to Zn(II) ratio (Fig. 8A, left), as observed for an analogous ligand lacking the OH group recently reported by our research group.13
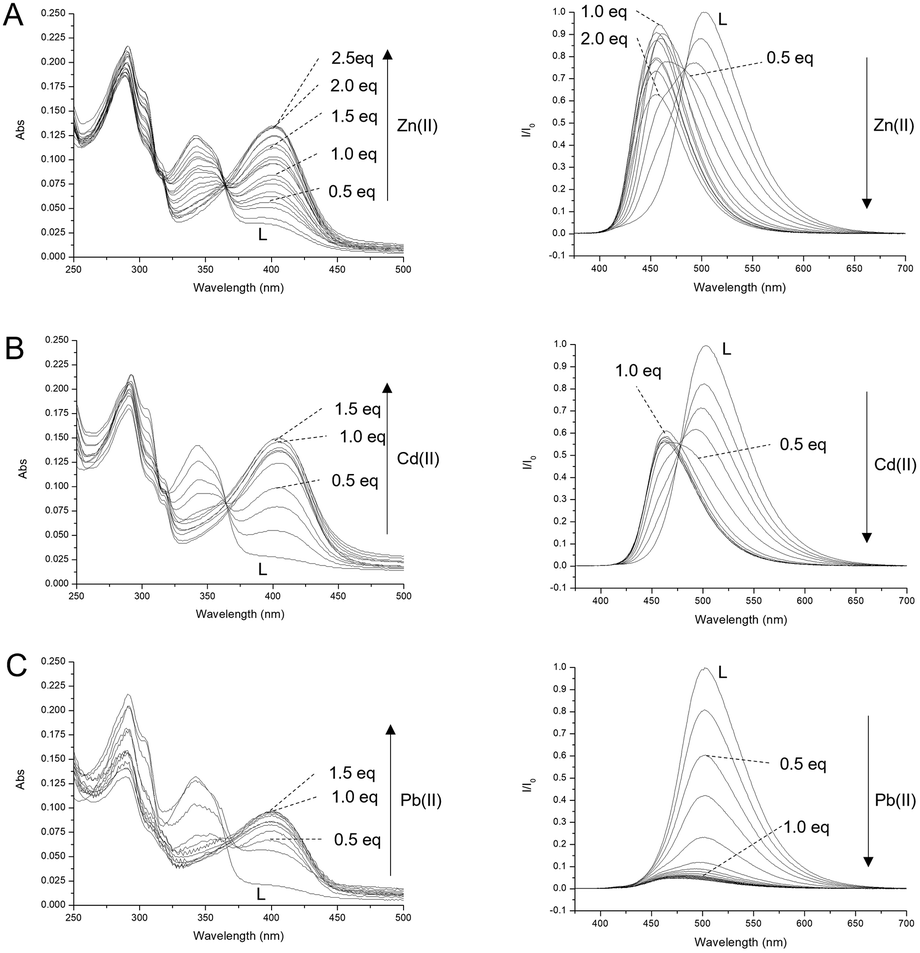 | ||
| Fig. 8 UV-Vis absorption (left column) and emission (right column) titrations of L with Zn(II) (A), Cd(II) (B) and Pb(II) (C), added as perchlorate salts, registered in aqueous solution at pH = 7.0 (Tris-HCl 1.0 × 10⁻³ mol dm−3) at 298 K. [L] = 1.0 × 10⁻⁵ mol dm−3; excitation at the isosbestic points 367 nm (A), 369 nm (B) and 366 nm (C). | ||
The addition of Cd(II) and Pb(II) ions caused an increase in the absorbance of the deprotonation band only up to one equivalent, suggesting the formation of mononuclear complexes (Fig. 8B and C left). These trends are confirmed by the fluorescence titrations performed by adding the metal ions to a buffered solution of L at pH = 7.0, and exciting at the isosbestic points (λex = 367 nm, 369 nm and 366 nm for Zn(II), Cd(II) and Pb(II), respectively). Under these conditions, the spectrum of L shows an intense emission band at 507 nm, attributed to the ESIPT band of the fluorophore (see above), which decreases upon the addition of all three metal ions tested due to the deprotonation of the OH group involved in the metal coordination, which finally prevents the ESIPT. Together with the decrease in the emission band at 507 nm, the addition of Zn(II) caused the growth of a fluorescence band at 463 nm, significantly blue shifted with respect to the deprotonation band of the free anionic ligand (476 nm), whose emission increases up to two equivalents of Zn(II) and then remains constant (Fig. 8A right). Similarly, the addition of Cd(II) up to 1 equivalent caused a decrease in the keto band and the appearance of a band at 462 nm (Fig. 8B right), while the addition of Pb(II) caused only the quenching of the band at 507 nm without the appearance of any deprotonation band (Fig. 8C right). In both cases, Cd(II) and Pb(II) ions induce no variation in the emission spectrum after the addition of 1 equivalent of metal ions. Job plot experiments performed to monitor the intensity of emission at 463 nm for Zn(II), 462 nm for Cd(II) and 507 nm in the case of Pb(II) clearly indicate the formation of a dinuclear Zn(II) complex and mononuclear Cd(II) and Pb(II) complexes (Fig. S5†). These results confirm the stoichiometry already suggested by the UV-Vis studies. The Pb(II) complex is not fluorescent, probably due to the reducing nature of Pb(II) which can quench the emission of the fluorophore by the metal-to-ligand PET mechanism. In the case of Zn(II) and Cd(II) ions, the ligand acts as a ratiometric sensor, since the metal ion can be quantified considering the ratio of the emission intensity at 463 for Zn(II) or 462 nm for Cd(II) to the emission at 507 nm.
Finally, the interaction of L with the metal ions can be evaluated with the naked eye by lighting up an aqueous solution of L at pH = 7 with a UV lamp at 365 nm. Under these conditions, the free L appears green. Due to the ratiometric nature of the ESIPT signal, the presence of Zn(II) and Cd(II) ions brings a clear change in color from green to blue, while Pb(II) basically quenches the fluorescence emission (Fig. S6†).
DFT calculations
The number of donor atoms of the ligand is not sufficient to saturate the coordination requirements of two Zn(II) cations in the dinuclear species. Thus, additional information about the possible structures of the complexes in aqueous solution was obtained by DFT calculations. Since all experiments were conducted in 0.15 mol dm−3 KCl aqueous solution, the Zn(II) ions could presumably complete their coordination sphere with chloride anions and/or water molecules. DFT calculations on the hypothesized species [Zn2(H−1L)]3+, [Zn2(H−1L)Cl]2+, [Zn2(H−1L)Cl2]+ and [Zn2(H−1L)(H2O)Cl2]+ have been carried out (Fig. 9) for both the ground and first singlet excited states, to obtain also an estimate of their absorption spectra and the first emission band. The calculated UV-Visible spectra (Fig. S7†) of the three models, presenting one or two chloride anions, are in good agreement with the experimental spectrum of the zinc complex, whose maximum absorption is at 405 nm (Fig. 8A). Taking into account the experimental emission wavelength (463 nm), the probable candidate structure is the [Zn2(H−1L)Cl2]+ species (calculated emission wavelength: 462 nm), in which one chloride bridges the two Zn(II) centers and the other is coordinated to one metal cation (Fig. 9). Interestingly, a similar arrangement was found in the dinuclear nickel(II) complex of a polyamino phenolic macrocycle.14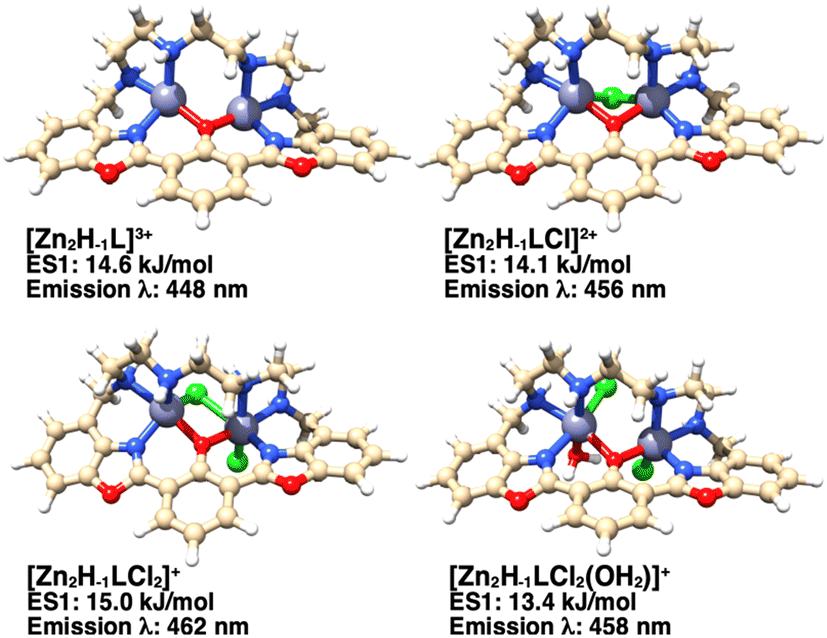 | ||
| Fig. 9 Structure of the considered dinuclear zinc(II) complexes of H−1L−, also including Cl− and H2O, as indicated, obtained by DFT calculations. The relative energy of the corresponding excited state structure and the wavelength of the first emission transition are also shown. | ||
Experimental
Synthesis
All chemicals were purchased from Aldrich, Fluka and Lancaster in the highest quality commercially available. 1,4,7,10-tetrakis(4-methylbenzensulfonyl)-1,4,7,10-tetraazadecane (7) was prepared as reported.11Computational details
The geometries of the ligand (L) and of its anion (H–1L−) and protonated cation (HL+) were fully optimized by DFT calculations, by using the M06-L functional15 and the 6–31G(d,p)16,17 basis set. Vibrational frequency calculations, within the harmonic approximation, were performed to confirm that the optimized geometries represented a minimum in the potential energy surface and also to calculate the relative standard Gibbs free energy. The implicit water solvent effects were evaluated by using the “conductor-like polarized continuum model” (CPCM).18 Time-dependent (TD) DFT calculations19,20 were performed on the most stable isomers found for H–1L−, L and HL+, with the aim of calculating the UV-Vis absorption spectra and also to obtain the optimized structure of their first singlet excited state. The latter was also exploited to estimate their lowest-energy electronic transition. 1H NMR chemical shift values of the selected hydrogen atoms, in water solution, have been calculated by using the GIAO method,21 by subtracting the isotropic shift of each hydrogen atom from the isotropic shift of the hydrogen atom of tetramethylsilane. All calculations were performed using the Gaussian 16 program package.22UV-Vis and fluorescence measurements
Spectrophotometric measurements were carried out at 298.1 K using a Varian Cary 100 spectrophotometer equipped with a temperature control unit. Uncorrected emission spectra were obtained with a Varian Cary Eclipse fluorescence spectrophotometer. Luminescence quantum yields were determined using 2,2′-biphenol in acetonitrile (Φ = 0.29).23NMR studies
1H and 13C NMR spectra were recorded on a Bruker Avance 400 instrument, operating at 400.13 and 100.61 MHz, respectively, and equipped with a variable temperature controller. The temperature of the NMR probe was calibrated using 1,2-ethanediol as a calibration sample. Chemical shifts (δ scale) are presented in ppm and referenced to the residual solvent peak. Coupling constants (J values) are given in hertz (Hz). 1H–1H and 1H–13C correlation experiments were performed to assign the signals.pH titrations were performed at 298.1 K, in a mixed acetonitrile-d3/D2O 60:40 v/v solution to prevent solubility issues.
Concluding remarks
The photophysical properties of a new macrocyclic ligand containing the 2,6-bis(benzoxazole-2-yl)phenol fluorophore (bis-HBO) inserted in a tetraaminomacrocyclic structure have been investigated. In aqueous solution, at pH < 9, the ligand absorbs at 342 nm and its emission is characterized by an ESIPT double band at 380 and 507 nm, the lower energy band being much more intense than the higher energy one, denoting that the ESIPT mechanism in the excited state is efficient and fast, as confirmed by DFT calculation. DFT calculations also allowed us to explore the conformational/protonation space of the three species of the ligand, namely, H−1L−, L and HL+, and to obtain the excited state structures of the most stable isomers of each species, as well as an estimate of their UV-Vis absorption and 1H-NMR spectra, which resulted in good agreement with the corresponding experimental data. Finally, the occurrence in solution of chloride coordination to the dinuclear Zn(II) complex was also inferred by a comparison between experimental and calculated UV-Vis absorption spectra. In fact, Zn(II), Cd(II) and Pb(II) coordination of L induced the occurrence of slight but significant changes in both absorption and fluorescence spectra of the ligand, attributable to the deprotonation of the OH phenol group following metal coordination. Interestingly, the new ligand revealed a ratiometric behavior upon metal ion coordination, due to the activation or deactivation of the ESIPT process. Further studies are necessary to test the possibility of using it as a specific and/or selective fluorescent chemosensor.Author contributions
The manuscript was written through contributions of all authors. All authors have given approval to the final version of the manuscript.Conflicts of interest
There are no conflicts to declare.Acknowledgements
We gratefully acknowledge COST Action CA18202, NECTAR – Network for Equilibria and Chemical Thermodynamics Advanced Research, supported by COST (European Cooperation in Science and Technology), and the financial support of the University of Urbino (Department of Pure and Applied Sciences, Grants DISPEA_GIORGI_PROG20 and DISPEA_FORMICA_PROG2021) and of the Italian Ministero dell'Istruzione dell'Università e della Ricerca (MIUR) (project 2017EKCS35). G. B. gratefully acknowledges the CINECA award no. IsC93, year 2021, under the ISCRA initiative, for providing the high-performance computing resources and support.References
- S. B. Khan and S. L. Lee, Supramolecular Chemistry: Host-Guest Molecular Complexes, Molecules, 2021, 26, 3995 CrossRef CAS PubMed.
- J. Park, J. Park, J. Lee, C. Lim and D. W. Lee, Size Compatibility and Concentration Dependent Supramolecular Host–Guest Interactions at Interfaces, Nat. Commun., 2022, 13, 112 CrossRef CAS PubMed.
- L. Escobar and P. Ballester, Molecular Recognition in Water Using Macrocyclic Synthetic Receptors, Chem. Rev., 2021, 121, 2445 CrossRef CAS PubMed.
- B. Verdejo, M. Inclan, M. P. Clares, I. Bonastre-Sabater, M. Ruiz-Gasent and E. García-España, Fluorescent Chemosensors Based on Polyamine Ligands: A Review, Chemosensors, 2022, 10, 1 CrossRef CAS.
- F. Pina, M. A. Bernardo and E. García-España, Fluorescent Chemosensors Containing Polyamine Receptors, Eur. J. Inorg. Chem., 2000, 2143 CrossRef CAS.
- C. Lodeiro and F. Pina, Luminescent and Chromogenic Molecular Probes Based on Polyamines and Related Compounds, Coord. Chem. Rev., 2009, 253, 1353 CrossRef CAS.
- M. Formica, V. Fusi, L. Giorgi and M. Micheloni, New Fluorescent Chemosensors for Metal Ions in Solution, Coord. Chem. Rev., 2012, 256, 170 CrossRef CAS.
- Y. Li, D. Dahal, C. S. Abeywickrama and Y. Pang, Progress in Tuning Emission of the Excited-State Intramolecular Proton Transfer (ESIPT)-Based Fluorescent Probes, ACS Omega, 2021, 6, 6547 CrossRef CAS PubMed.
- H. C. Joshi and L. Antonov, Excited-State Intramolecular Proton Transfer: A Short Introductory Review, Molecules, 2021, 26, 1475 CrossRef CAS PubMed.
- J. E. Richman and T. J. Atkins, Nitrogen Analogs of Crown Ethers, J. Am. Chem. Soc., 1974, 96, 2268 CrossRef CAS.
- A. Bencini, A. Bianchi, E. Garcia-Espana, M. Giusti, S. Mangani, M. Micheloni, P. Orioli and P. Paoletti, Synthesis and Complexing Properties of the Large Polyazacycloalkane 1,4,7,10,13,16,19,22,25,28-Decaazacyclotriacontane (L). Crystal Structure of the Monoprotonated Dicopper(II) Complex [Cu2(L)HCl2](ClO4)3.4H2O, Inorg. Chem., 1987, 26, 1243 CrossRef CAS.
- L. G. Gagliardi, C. B. Castells, C. Ràfols, M. Rosés and E. Bosch, δ Conversion Parameter between PH Scales (WSpH and SSPH) in Acetonitrile/Water Mixtures at Various Compositions and Temperatures, Anal. Chem., 2007, 79, 3180 CrossRef CAS PubMed.
- D. Paderni, L. Giorgi, M. Voccia, M. Formica, L. Caporaso, E. Macedi and V. Fusi, A New Benzoxazole-Based Fluorescent Macrocyclic Chemosensor for Optical Detection of Zn2+ and Cd2+, Chemosensors, 2022, 10, 1 CrossRef.
- P. Dapporto, M. Formica, V. Fusi, M. Micheloni, P. Paoli, R. Pontellini, P. Romani and P. Rossi, Polyamine Macrocycles Incorporating a Phenolic Function: Their Synthesis, Basicity, and Coordination Behavior toward Metal Cations. Crystal Structure of a Binuclear Nickel Complex, Inorg. Chem., 2000, 39, 2156 CrossRef CAS PubMed.
- Y. Zhao and D. G. Truhlar, The M06 Suite of Density Functionals for Main Group Thermochemistry, Thermochemical Kinetics, Noncovalent Interactions, Excited States, and Transition Elements: Two New Functionals and Systematic Testing of Four M06-Class Functionals and 12 Other Functionals, Theor. Chem. Acc., 2008, 120, 215 Search PubMed.
- P. C. Hariharan and J. A. Pople, The Influence of Polarization Functions on Molecular Orbital Hydrogenation Energies, Theor. Chim. Acta, 1973, 28, 213 CrossRef CAS.
- M. M. Francl, W. J. Pietro, W. J. Hehre, J. S. Binkley, M. S. Gordon, D. J. DeFrees and J. A. Pople, Self-Consistent Molecular Orbital Methods. XXIII. A Polarization-Type Basis Set for Second-Row Elements, J. Chem. Phys., 1982, 77, 3654 CrossRef CAS.
- V. Barone and M. Cossi, Quantum Calculation of Molecular Energies and Energy Gradients in Solution by a Conductor Solvent Model, J. Phys. Chem. A, 1998, 102, 1995 CrossRef CAS.
- M. E. Casida and M. Huix-Rotllant, Progress in Time-Dependent Density-Functional Theory, Annu. Rev. Phys. Chem., 2012, 63, 287 CrossRef CAS PubMed.
- C. Adamo and D. Jacquemin, The Calculations of Excited-State Properties with Time-Dependent Density Functional Theory, Chem. Soc. Rev., 2013, 42, 845 RSC.
- J. R. Cheeseman, G. W. Trucks, T. A. Keith and M. J. Frisch, A Comparison of Models for Calculating Nuclear Magnetic Resonance Shielding Tensors, J. Chem. Phys., 1996, 104, 5497 CrossRef CAS.
- M. J. Frisch, G. W. Trucks, H. B. Schlegel, G. E. Scuseria, M. A. Robb, J. R. Cheeseman, G. Scalmani, V. Barone, G. A. Petersson, H. Nakatsuji, X. Li, M. Caricato, A. V. Marenich, J. Bloino, B. G. Janesko, R. Gomperts, B. Mennucci, H. P. Hratchian, J. V. Ortiz, A. F. Izmaylov, J. L. Sonnenberg, D. Williams-Young, F. Ding, F. Lipparini, F. Egidi, J. Goings, B. Peng, A. Petrone, T. Henderson, D. Ranasinghe, V. G. Zakrzewski, J. Gao, N. Rega, G. Zheng, W. Liang, M. Hada, M. Ehara, K. Toyota, R. Fukuda, J. Hasegawa, M. Ishida, T. Nakajima, Y. Honda, O. Kitao, H. Nakai, T. Vreven, K. Throssell, J. A. Montgomery Jr., J. E. Peralta, F. Ogliaro, M. J. Bearpark, J. J. Heyd, E. N. Brothers, K. N. Kudin, V. N. Staroverov, T. A. Keith, R. Kobayashi, J. Normand, K. Raghavachari, A. P. Rendell, J. C. Burant, S. S. Iyengar, J. Tomasi, M. Cossi, J. M. Millam, M. Klene, C. Adamo, R. Cammi, J. W. Ochterski, R. L. Martin, K. Morokuma, O. Farkas, J. B. Foresman and D. J. Fox, Gaussian 16, Gaussian, Inc., Wallingford CT, 2016 Search PubMed.
- Fluorescent Signal Transduction in Molecular Sensors and Dosimeters, ed. W. A. Czarnik, ACS Symposium Series, 1993, p. 538 Search PubMed.
Footnote |
| † Electronic supplementary information (ESI) available: Absorption and NMR spectra and data trends, calculated structures of tautomers and conformers, and light change of metal complex solutions under irradiation. See DOI: https://doi.org/10.1039/d3dt00140g |
| This journal is © The Royal Society of Chemistry 2023 |