 Open Access Article
Creative Commons Attribution 3.0 Unported Licence
Towards hydrogen-rich ionic (NH4)(BH3NH2BH2NH2BH3) and related molecular NH3BH2NH2BH2NH2BH3†‡
Rafał
Owarzany
 *a,
Tomasz
Jaroń
 b,
Krzysztof
Kazimierczuk
 a,
Przemysław J.
Malinowski
 a,
Wojciech
Grochala
 a and
Karol J.
Fijalkowski
 *a
*a
aCentre of New Technologies, University of Warsaw, ul. Banacha 2c, 02-097 Warsaw, Poland. E-mail: r.owarzany@cent.uw.edu.pl; karol.fijalkowski@cent.uw.edu.pl
bFaculty of Chemistry, University of Warsaw, ul. Pasteura 1, 02-089 Warsaw, Poland
First published on 26th January 2023
Abstract
Attempts of the synthesis of ionic (NH4)(BH3NH2BH2NH2BH3) via a metathetical approach resulted in a mixture of the target compound and partly dehydrogenated molecular NH3BH2NH2BH2NH2BH3 product. The mixed specimen was characterised by NMR and vibrational spectroscopies, and the cocrystal structure was analyzed from powder X-ray diffraction data supported by theoretical density functional theory calculations. The compound crystallises in a P21/c unit cell with the lattice parameters of a = 13.401(11) Å, b = 13.196(8) Å, c = 17.828(12) Å, β = 128.83(4)°, V = 2556(3) Å3 and Z = 16. Despite their impressive hydrogen content, similar to ammonia borane, both title compounds release hydrogen substantially polluted with borazine and traces of ammonia and diborane.
Introduction
Protic-hydridic compounds constitute an important family of solid-state hydrogen storage materials with the potential to be applied as onboard fuel systems required in hydrogen economy. The presence of both positively and negatively charged hydrogen atoms results in the formation of a network of dihydrogen bonds governing the crystal structure and facilitating the process of thermal decomposition.1 These features were observed and thoroughly described for ammonia borane2 and metal amidoboranes3 and further explored for NH4BH4.4Ammonia borane is one of the best-researched materials in this group, being an air- and water-insensitive solid containing ca. 19.6% of hydrogen by weight.5,6 Unfortunately, ammonia borane releases only 1/3 of the stored hydrogen below 120 °C.7,8 Moreover, the hydrogen released is contaminated with ammonia, diborane, borazine, aminoborane and aminodiborane, which excludes its use as a direct H2 source for low-temperature fuel cells.9 Such high gravimetric H content, however, provides significant room for modifications; even if relatively heavy elements are introduced, the system still should be able to fulfil gravimetric DOE requirements for hydrogen storage materials (Fig. 1).10
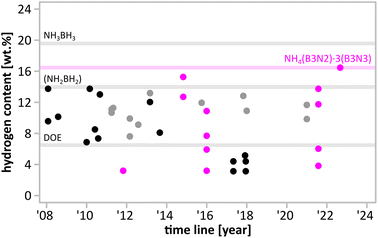 | ||
| Fig. 1 Hydrogen content of monometallic amidoboranes (black), bimetallic amidoboranes (grey), and M(B3N2) salts (magenta) as a function of reporting date. Hydrogen content of NH3BH3 (19.6%) polymeric (NH2BH2) (14.0%) and DOE ultimate target (6.5%) are given as a reference. A detailed figure with references to each point is given in ESI (Fig. S1.1†). | ||
Among the derivatives of ammonia borane, amidoborane salts of general formula M(NH2BH3)n [abbreviated here as MAB or M(AB)n] constitute the largest group.11,12 Two dozens of mono- and bimetallic amidoborane salts have been reported. Some of them [i.e. KAB,13 RbAB,14,15 CsAB,14,15 Mg(AB)2,16 Ba(AB)2,17 Al(AB)3,18 LiAl(AB)4,19 Li2Mg(AB)420] evolve pure H2 upon thermal decomposition at ca. 100 °C. Nonetheless, all these materials suffer from a lack of reversibility and relatively low hydrogen content available at moderate temperatures.11,12
Recently, a novel group of ammonia borane derivatives containing five-membered chain anions of general formula M(BH3NH2BH2NH2BH3) [abbreviated here as M(B3N2)] have been reported.21–25 Among them, one can list two allotropes of Verkade's base salt,22,23 five alkali metal salts21,23,24,26,27 and four ionic liquids.25 Although three of them [i.e. Li(B3N2),23,24 (Bu4N)(B3N2)25 and (Et4N)(B3N2)25] meet the target H wt% content and release pure hydrogen below 150 °C, none of them fulfils all the DOE targets simultaneously.10
Results and discussion
Synthesis
Synthesis of (NH4)(B3N2) was attempted employing Jaroń et al.'s metathetical approach mediated by precursors containing weakly coordinating ions.28–30 The reaction was conducted in dry THF similarly to the previous syntheses of all alkali metal M(B3N2) salts23 according to eqn (1): | (1) |
Unexpectedly, during the reaction, we observed the evolution of a small amount of gas, which should not occur in a metathetical reaction. Since the expected main product contains ammonium cation and B3N2− anion (essentially, a derivative of a borohydride anion), we assumed that – similarly to what is observed for NH4BH431 – hydrogen might be evolved upon reaction of these ions according to eqn (2):
| (NH4)(BH3NH2BH2NH2BH3) → NH3BH2NH2BH2NH2BH3 + H2↑. | (2) |
Confirmation that this surmise is correct is presented below.
Synthesis led to a mixture of well-THF-soluble products, which were separated by precipitation of the side product (VBH)[B(C6H5)4] in dry DCM. Both products were subjected to spectroscopic analyses (Fig. 2) and powder X-ray diffraction (Fig. 3) to demonstrate successful ion exchange according to eqn (1). Indeed, IR spectra (Fig. 2) of the products show that the target product contains NH and BH groups, while the side product contains CH groups. Unfortunately, complete separation of the main and side products was not achieved, as documented by very weak CH bands at ca. 3000 cm−1 from B(C6H5)4− anions for the former, and very weak BH bands at ca. 2400 cm−1 from (B3N2)− anions for the latter product. X-ray diffraction points to the same conclusion, showing that two new distinct crystalline species formed during the reaction (Fig. 3). The diffraction patterns of the products are free from reflections coming from the substrates, which suggests at least 95% purity of the former, considering the crystalline phases. However, as the PXRD pattern of the main product contains significant contribution from the amorphous phase (seen as broad humps), such analysis must be treated with care and backed up with the spectroscopic data discussed below.
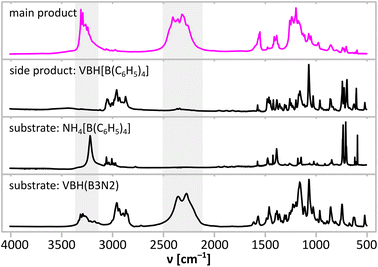 | ||
| Fig. 2 Comparison of IR absorption spectra of precursors and products of metathetical synthesis performed according to eqn (1). NH stretching and BH stretching regions are marked with grey fields. | ||
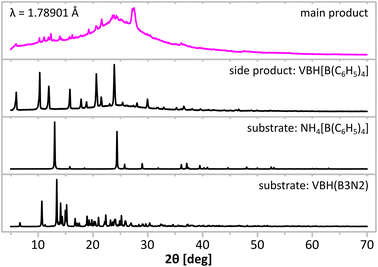 | ||
| Fig. 3 Comparison of powder X-ray diffraction patterns of precursors and products of metathetical synthesis performed according to eqn (1). CoKα1,2, λ = 1.78901 Å. | ||
NMR spectra
A detailed 11B NMR investigation of the main product dissolved in THF-d8 was performed (Fig. 4). A typical spectrum of M(B3N2) salt consists of a triplet at ca. −8.5 ppm from [BH2] groups and a quartet at ca. −22.5 ppm from [BH3] groups, having a relative intensity of 1![[thin space (1/6-em)]](https://www.rsc.org/images/entities/char_2009.gif) :
:![[thin space (1/6-em)]](https://www.rsc.org/images/entities/char_2009.gif) 2.20,21 Here, the spectrum of the main product is more complicated and contains two triplets (δ = −10.4 ppm, J = 101 Hz; δ = −12.3 ppm, and J = 102 Hz) and a quartet (δ = −22.2 ppm and J = 91 Hz) in an intensity ratio that varies from batch to batch (in average ca. 4
2.20,21 Here, the spectrum of the main product is more complicated and contains two triplets (δ = −10.4 ppm, J = 101 Hz; δ = −12.3 ppm, and J = 102 Hz) and a quartet (δ = −22.2 ppm and J = 91 Hz) in an intensity ratio that varies from batch to batch (in average ca. 4![[thin space (1/6-em)]](https://www.rsc.org/images/entities/char_2009.gif) :
:![[thin space (1/6-em)]](https://www.rsc.org/images/entities/char_2009.gif) 3
3![[thin space (1/6-em)]](https://www.rsc.org/images/entities/char_2009.gif) :
:![[thin space (1/6-em)]](https://www.rsc.org/images/entities/char_2009.gif) 5). These features altogether suggest that the main product formed according to (eqn (1)) partially undergoes a subsequent dehydrogenation reaction (eqn (2)). Variation in the observed intensity ratio of the signals may be caused by the partial decomposition of the main product, thus changing the ratio between the components of the product. We note that a 1
5). These features altogether suggest that the main product formed according to (eqn (1)) partially undergoes a subsequent dehydrogenation reaction (eqn (2)). Variation in the observed intensity ratio of the signals may be caused by the partial decomposition of the main product, thus changing the ratio between the components of the product. We note that a 1![[thin space (1/6-em)]](https://www.rsc.org/images/entities/char_2009.gif) :
:![[thin space (1/6-em)]](https://www.rsc.org/images/entities/char_2009.gif) 3 mixture of (NH4)(B3N2) and NH3BH2NH2BH2NH2BH3 (abbreviated as N3B3) would yield four BH2 triplets from units coordinated by two NH2 groups, three BH2 triplets from units coordinated by NH2 and NH3, and five BH3 quartets of the terminal units altogether. This result would suggest that ca. ¾ of (NH4)(B3N2) decomposed to N3B3 while dissolved in THF.
3 mixture of (NH4)(B3N2) and NH3BH2NH2BH2NH2BH3 (abbreviated as N3B3) would yield four BH2 triplets from units coordinated by two NH2 groups, three BH2 triplets from units coordinated by NH2 and NH3, and five BH3 quartets of the terminal units altogether. This result would suggest that ca. ¾ of (NH4)(B3N2) decomposed to N3B3 while dissolved in THF.
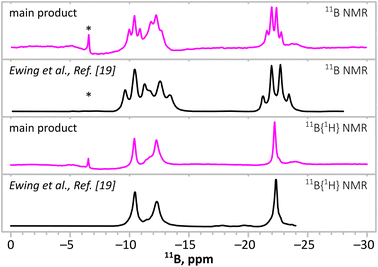 | ||
| Fig. 4 Comparison of the 11B NMR spectra of the main product of the synthesis according to eqn (1) (magenta lines) with the spectra of a product of reaction according to eqn (2) reported by Ewing et al.21 (black lines) both with bottom spectra. Boron spectra show with and without 1H decoupling. * indicates [B(C6H5)4]− anions. | ||
To get more insights into the processes occurring during the synthesis, we conducted in situ11B{1H} NMR measurements in THF-d8 to monitor signals of the products and substrates (Fig. 5). The monitoring showed that all three signals from the product(s) (marked with #) arise simultaneously, testifying to the simultaneous progress of reactions described by eqn (1) and (2). Apart from the signals assigned to the substrates and the main product, numerous additional signals which do not change during the reaction are present. These signals come from the moieties that do not play a direct role in the formation of the main product, e.g. [B(C6H5)4]−, in which the chemical neighbourhood of the boron atom does not change during the synthesis. The monitored reaction (Fig. 4) was not completed (i.e. signals of the substrates were still intense) because of the local depletion of the substrates (no mixing was applied in the NMR test tube inside the spectrometer).
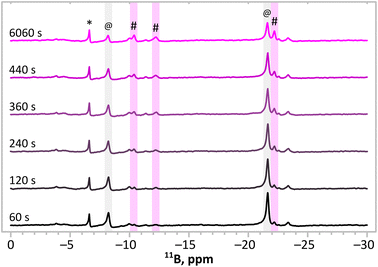 | ||
| Fig. 5 Sequence of the 11B{1H} NMR spectra collected in situ upon synthesis according to eqn (1). The bottom spectrum shows the mixture of substrates (t = 60 s). The top spectrum shows the final mixture of products and substrates (t = 6060 s). @ indicates signals from substrates. # indicates signals of the main product. * indicates [B(C6H5)4]− anions. | ||
It is worth mentioning that the 11B NMR spectrum of the main product(s) is very similar to the spectrum reported by Ewing et al. in 2013, having the same pattern of three signals: two triplets (δ = −10.5 ppm, J = 95 Hz; δ = −12.4 ppm, and J = 104 Hz) and a quartet (δ = −22.3 ppm and J = 95 Hz)21 with 4.1![[thin space (1/6-em)]](https://www.rsc.org/images/entities/char_2009.gif) :
:![[thin space (1/6-em)]](https://www.rsc.org/images/entities/char_2009.gif) 3.2
3.2![[thin space (1/6-em)]](https://www.rsc.org/images/entities/char_2009.gif) :
:![[thin space (1/6-em)]](https://www.rsc.org/images/entities/char_2009.gif) 5.0 intensity ratio of the signals (according to our analysis of graphical data shown in that study, Fig. 9a in ref. 19). The report of Ewing et al. was focused on the synthesis of a neutral 6-membered chain molecule, B3N3, via a direct reaction between Na(B3N2) and ammonium chloride, according to the following equation:21
5.0 intensity ratio of the signals (according to our analysis of graphical data shown in that study, Fig. 9a in ref. 19). The report of Ewing et al. was focused on the synthesis of a neutral 6-membered chain molecule, B3N3, via a direct reaction between Na(B3N2) and ammonium chloride, according to the following equation:21
| Na(BH3NH2BH2NH2BH3) + NH4Cl → NH3BH2NH2BH2NH2BH3 + H2↑ + NaCl↓. | (3) |
The reaction, performed in a glyme solution, was accompanied by evolution of hydrogen gas, similarly to our observations.
Ewing et al. assumed that the solid product obtained was B3N3, which was based on an NMR study of this material only.21 The three signals observed were assigned to three boron-containing groups present in the molecule (two BH2 and one BH3). In the case of successful synthesis of B3N3, however, all signals observed should be equally intense (1![[thin space (1/6-em)]](https://www.rsc.org/images/entities/char_2009.gif) :
:![[thin space (1/6-em)]](https://www.rsc.org/images/entities/char_2009.gif) 1
1![[thin space (1/6-em)]](https://www.rsc.org/images/entities/char_2009.gif) :
:![[thin space (1/6-em)]](https://www.rsc.org/images/entities/char_2009.gif) 1), while their intensity ratio was clearly different (Fig. 4). Our analysis suggests that the reaction towards B3N3 is in fact a two-step process (eqn (1) and (2)) and some (NH4)(B3N2) intermediate (i.e. our main target compound) remains in the product. The resulting assignment of NMR signals for both products is given in Table 1.
1), while their intensity ratio was clearly different (Fig. 4). Our analysis suggests that the reaction towards B3N3 is in fact a two-step process (eqn (1) and (2)) and some (NH4)(B3N2) intermediate (i.e. our main target compound) remains in the product. The resulting assignment of NMR signals for both products is given in Table 1.
| Compound | –NH2–BH2–NH2– | NH3–BH2–NH2– | BH 3 –NH2– | |||
|---|---|---|---|---|---|---|
| δ [ppm] | J [Hz] | δ [ppm] | J [Hz] | δ [ppm] | J [Hz] | |
| main product | −10.4 | 101 | −12.3 | 102 | −22.2 | 91 |
| Ewing et al.21 | −10.5 | 95 | −12.4 | 104 | −22.3 | 95 |
| (VBH)(B3N2)23 | −8.2 | 100 | — | — | −21.6 | 91 |
| Li(B3N2)23 | −8.4 | 103 | — | — | −22.6 | 90 |
| Na(B3N2)23 | −8.7 | 99 | — | — | −22.4 | 91 |
| K(B3N2)23 | −8.6 | 101 | — | — | −22.0 | 89 |
| Rb(B3N2)23 | −8.4 | 100 | — | — | −21.7 | 90 |
| Cs(B3N2)23 | −8.4 | 101 | — | — | −21.2 | 94 |
To further support our claim, we performed more thorough characterisation of the reaction product.
IR and Raman analysis
Two preeminent sets of bands in the vibrational spectra (IR absorption, Fig. 6; Raman scattering, Fig. 7) of the main product originate from the stretching vibrations of NH (3000–3400 cm−1) and BH (2150–2400 cm−1) groups. They are accompanied by bands coming from the deformation vibrations of NHx moieties (1400–1600 cm−1) as typical of M(B3N2) salts, BHx deformation modes (below 1350 cm−1) and BN stretching (700–800 cm−1).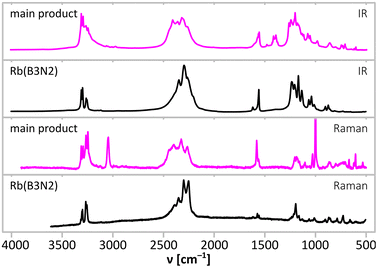 | ||
| Fig. 6 Comparison of IR absorption (top in each bracket) and Raman scattering (bottom in each bracket) spectra of the main product of the synthesis according to eqn (1) (magenta) and the spectra of alkali metal M(B3N2) salts. Regions magnified in Fig. 7 (NH stretching and NH bending) are marked with grey fields. | ||
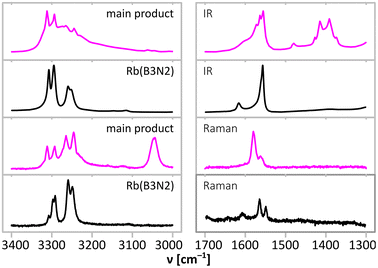 | ||
| Fig. 7 Comparison of NH stretching (3000–3400 cm−1) and NH bending (1300–1700 cm−1) regions of IR absorption (top in each bracket) and Raman scattering (bottom in each bracket) spectra of the main product of the synthesis according to eqn (1) (magenta) and alkali metal M(B3N2) salts. Full spectra are presented in Fig. 6. | ||
Aside from the bands typical for M(B3N2) salts, the NH stretching region of the Raman spectrum (Fig. 7) contains a relatively low frequency band (peaking at 3041 cm−1) originating from ammonium cations. The ammonium cations are known to give a strong Raman band at much lower energies than the [NH2] and [NH3] groups, e.g. ammonium chloride gives a single band at 3052 cm−1,32 while ammonium borohydride yields two bands at somewhat higher energies of 3118 cm−1 and 3178 cm−1.4,33
In the higher energy part of NH stretching region, in both IR and Raman spectra, we observe at least 6 distinct bands and a broad band covering the region above 3000 cm−1. Four of the bands (3306 cm−1, 3288 cm−1, 3259 cm−1, and 3239 cm−1 in IR; 3307 cm−1, 3288 cm−1, 3260 cm−1, and 3240 cm−1 in Raman) form a doublet of doublets seen also for heavy alkali metal M(B3N2) salts (Table 2 and Tables S4, S5 in ESI†). It is characteristic for M(B3N2) salts that the higher energy doublet is more intense in the IR spectra, while the lower energy one is stronger in the Raman spectra.23 The presence of such doublets is caused by Davydov splitting,34i.e. the interaction of [NH2] groups coexisting within one crystallographic unit cell (resonance of the corresponding oscillators removing their degeneration). A similar split of NH bands was observed in the spectra of Rb(B3N2) and Cs(B3N2), which contain gauche-form of (B3N2)− anions, unlike the lighter analogues featuring straight anions and not showing Davidov split.23 The split observed here equals ± 9 cm−1, which is intermediate between those of ± 4 cm−1 and ± 14 cm−1 seen for Rb(B3N2) and Cs(B3N2), respectively.23
| Li(B3N2) | Na(B3N2) | K(B3N2) | Rb(B3N2) | Cs(B3N2) | Main product |
|---|---|---|---|---|---|
| 3310 s | 3302 vs | 3305 vs | 3308 m | 3313 w | 3306 vs |
| 3295 m | 3287 m | 3288 vs | |||
| 3273 m | 3256 m | 3261 m | 3261 w | 3261 w | 3259 m |
| 3252 w | 3235 m | 3239 m |
Interestingly, the NH stretching bands of the [NH2] groups of the main product exhibit lower energies than similar bands in the spectra of alkali metal M(B3N2) salts21 (Table 2 and Table S4 in ESI†). This very likely results from strong dihydrogen bonds forming a network of interactions between [NHx] and [BHx] moieties of neighbouring (B3N2)− anions and B3N3 molecules, which stabilise the crystal structure of the main product. A similar effect is observed for two polymorphs of ammonia borane, where orthorhombic LT forms having relatively weak dihydrogen bonds show sharp higher energy bands in the IR spectrum, while tetragonal HT form having relatively strong dihydrogen bonds show broad lower energy bands in the IR spectrum.35 In general, it is expected that H⋯H interactions would not only weaken the N–H and B–H bonds but also broaden the absorption bands, which is observed here for the main product.
Two remaining bands observed in the NH stretching region (3224 cm−1 and 3268 cm−1 in IR) are weaker than the doublets of doublets, and they must originate from the vibrations of terminal [NH3] groups of B3N3. Indeed, they fall in a spectral region typical for terminal [NH3] groups, as observed for ammonia borane (3196 cm−1, 3253 cm−1 and 3311 cm−1). Naturally, it is expected that signals originating from the terminal [NH3] of B3N3 are weaker than those from more numerous [NH2] groups present in both (NH4)(B3N2) and B3N3.
The region of the IR absorption spectrum associated with deformations of the NHx moieties (Fig. 7) is consistent with these conclusions. One can clearly distinguish signals at ca. 1530–1600 cm−1, typical for [NH2] and [NH3] groups,23 from the signals at ca. 1250–1500 cm−1, characteristic for ammonium cations (cf. 1402 cm−1 for NH4Cl).36 It is worth to notice that the IR spectra in the 1350–1500 cm−1 region show five bands (1374 cm−1, 1392 cm−1, 1415 cm−1, 1427 cm−1, and 1479 cm−1), and this agrees with the number of deformation modes expected for NH4+ cations in a low-symmetry environment.
The spectroscopic analysis clearly shows that both (NH4)(B3N2) and B3N3 moieties constitute the main product, thus confirming the reactions according to eqn (1) and (2).
Crystal structure of the side product
The chemical composition of the side product of metathesis was confirmed by single-crystal X-ray diffraction measurements (cf. ESI†). This compound contains protonated Verkade's base cations and tetraphenylborate anions, (VBH)[B(C6H5)4], proving successful ion exchange in reactions according to eqn (1). The compound crystallises in the P![[1 with combining macron]](https://www.rsc.org/images/entities/char_0031_0304.gif) space group with the constituent ions of different polarities, showing no significant interactions, as expected for large ions with a small charge smeared over the entire ion.
space group with the constituent ions of different polarities, showing no significant interactions, as expected for large ions with a small charge smeared over the entire ion.
Crystal structure of the main product
As we could not obtain a single crystal of the main product, we were forced to use powder X-ray diffraction (PXRD), supported by DFT calculations and the above-mentioned results of spectroscopic analysis.Indexing of the PXRD pattern leads to a P21/c unit cell with the refined lattice parameters of a = 13.391(10) Å, b = 13.195(8) Å, c = 17.822(12) Å, β = 125.86(4)° and V = 2552(3) Å3. Assuming (NH4)(B3N2) as a product, such unit cell volume would suggest Z = 16 (multiplicity of the general atomic position) and V/Z = 159.5 Å3. However, this V/Z value is too small as the values for K and Rb analogues are larger (167.7 Å3 and 174.3 Å3 respectively),23 while the size of NH4+ falls between these two alkali metal cations. Somewhat smaller than the expected V/Z volume suggests that the crystalline phase should contain also the partially dehydrogenated molecules of the product of condensation presented in eqn (2).
To test such scenario, structural models were derived for (NH4)(B3N2), B3N3 and the (NH4)(B3N2)·3(B3N3) cocrystal with the components in the 1![[thin space (1/6-em)]](https://www.rsc.org/images/entities/char_2009.gif) :
:![[thin space (1/6-em)]](https://www.rsc.org/images/entities/char_2009.gif) 3 molar ratio as indicated by NMR data. Initial positions of heavy atoms came from simulated annealing using the experimental diffraction data, and refined using Rietveld method. The models were then fully optimised using periodic DFT calculations (Table 3 and ESI†). The theoretical unit cell volume calculated for (NH4)(B3N2) is significantly larger than those for the models containing B3N3 moieties and the latter are only 4.0–4.5% larger than the experimental value. This degree of overestimation is rather typical for the GGA calculations.
3 molar ratio as indicated by NMR data. Initial positions of heavy atoms came from simulated annealing using the experimental diffraction data, and refined using Rietveld method. The models were then fully optimised using periodic DFT calculations (Table 3 and ESI†). The theoretical unit cell volume calculated for (NH4)(B3N2) is significantly larger than those for the models containing B3N3 moieties and the latter are only 4.0–4.5% larger than the experimental value. This degree of overestimation is rather typical for the GGA calculations.
| Compound | V [Å3] | ΔV [%] | d(H⋯H)min cell opt. [Å] | d(H⋯H)min cell fix [Å] |
|---|---|---|---|---|
| a Experimental data with the lower constrain on the H⋯H separation. | ||||
| NH4(B3N2) | 2832.0 | 11.0 | 1.40 | 1.42 |
| (NH4)(B3N2)·3(B3N3) | 2666.1 | 4.5 | 1.60 | 1.62 |
| 2552.2(30) | — | 1.92 | — | |
| B3N3 | 2654.7 | 4.0 | 1.68 | 1.65 |
Importantly, the closest H⋯H contacts in the optimised structure of (NH4)(B3N2) remain unreasonably short (1.40 Å), and outside the distribution observed experimentally for the dihydrogen bonds (usually > 1.80 Å), as shown in Fig. 9. This reconfirms that the main product is not a pure (NH4)(B3N2). The minimum H⋯H contacts in the optimised crystal structures containing B3N3 are significantly longer (1.60–1.68 Å), and closer to typical values for very strong dihydrogen interactions. Therefore, we have used a theoretical model of the (NH4)(B3N2)·3(B3N3) cocrystal to refine its crystal structure using the best experimental dataset, Fig. 8 and Fig. S9.3 (ESI).†
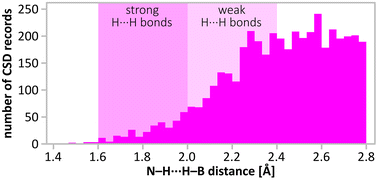 | ||
| Fig. 9 Distribution of H⋯H distances in –N–H⋯H–B– moieties found in CSD database search (accessed by the end of 2022). The distances < 2.8 Å were found for 904 crystal structures. Note the distances: 2.4 Å (double H van der Waals radius)1 and 1.92 Å present in the structure. | ||
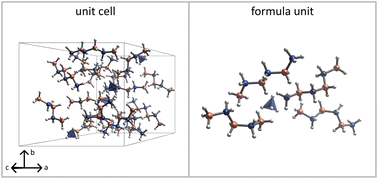
The obtained structural model of (NH4)(B3N2)·3(B3N3) contains four formula units in the unit cell (Z = 4) with one asymmetric unit (Z′ = 1).
The structure is stabilised by strong dihydrogen interactions. Two B3N3 chains adopt gauche geometry, and resemble the B3N2 anions in the heavier M(B3N2) salts, M = Rb, Cs.23 The third B3N3 moiety and (B3N2)− anion are more straight, closer to the geometry of anionic moieties in the light M(B3N2) salts, M = Li–K.23,24 The B–N distances of 1.56(2)–1.58(2) Å remain within the range observed in other compounds from this group.
Further improvements of our preliminary experimental structure model, and in particular positions of hydrogen atoms, would require application of neutron diffraction methods, and are beyond the scope of this work.
Thermal decomposition
The theoretical gravimetric hydrogen content of the 1![[thin space (1/6-em)]](https://www.rsc.org/images/entities/char_2009.gif) :
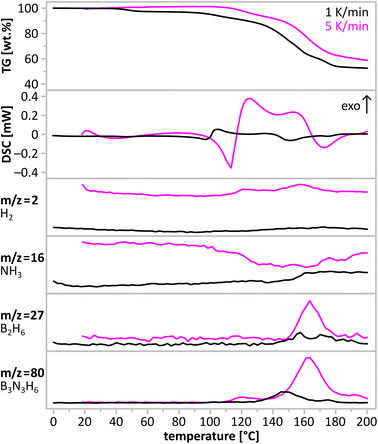
:![[thin space (1/6-em)]](https://www.rsc.org/images/entities/char_2009.gif) 3 cocrystals is very large (16.4%). We have studied thermal decomposition of this new compound to assess its hydrogen storage properties. In Fig. 10, we present the results of a simultaneous thermogravimetric and calorimetric analysis of the main product together with gas evolution curves (hydrogen, ammonia, diborane, and borazine) acquired in mass spectrometry experiment of the evolved gases.
3 cocrystals is very large (16.4%). We have studied thermal decomposition of this new compound to assess its hydrogen storage properties. In Fig. 10, we present the results of a simultaneous thermogravimetric and calorimetric analysis of the main product together with gas evolution curves (hydrogen, ammonia, diborane, and borazine) acquired in mass spectrometry experiment of the evolved gases.
The main product is thermally stable below 50 °C. At higher temperatures, one can observe a multistep exothermic decomposition preceded by an endothermic process. During decomposition, a mixture of gases containing borazine, hydrogen, diborane and ammonia is being evolved. Close analysis of TGA/DSC/MS curves suggests that decomposition proceeds in at least 3 steps below 200 °C, but each of them seems to have a similar profile of evolved gases. Interestingly, borazine and hydrogen are the main gaseous products of thermal decomposition, just as in the case of NH3BH3,7 but dissimilarly to alkali metal M(B3N2) salts.23,24 Facile evolution of borazine may be related to the stoichiometry of two components of the main product. (NH4)(B3N2) and B3N3, both contain 3 boron atoms and 3 nitrogen atoms, just like borazine molecules. Dehydrogenation of NH4(B3N2) proceeds according to eqn (2), while dehydrogenation of the B3N3 molecule proceeds with formation of a new B–N bond at [BH3] and [NH3] terminals according to eqn (4). This reaction was also proposed as the final step of borazine evolution during thermal decomposition of ammonia borane.37 The formation of pseudo-aromatic borazine is accompanied by dehydrogenation of the elusive head-to-tail cyclohexane-like intermediates, according to eqn (4).
| NH3BH2NH2BH2NH2BH3 → c-N3B3H12 + H2 → B3N3H6 + 4H2↑ | (4) |
We also observed the formation of B2H6 and NH3, similarly as in decomposition of Na(B3N2),23,24 K(B3N2),23 Rb(B3N2)23 and Cs(B3N2),23 which come from fragmentation of (B3N2)− anions.
As mentioned above, the thermal decomposition of the main product is preceded by an endothermic process. Analogies to ammonia borane7 and amidoboranes12 might suggest melting of the sample. However, direct visual observations ruled out this possibility. Endothermic event is related either to an intermolecular reorganisation or a structural phase transition.
Depending on the heating rate, the decomposition temperature reaches the fastest rate at ca. 145 °C and ca. 152 °C for 1 K min−1 and 5 K min−1 scans, respectively. The observed mass loss upon thermal decomposition in the range up to 200 °C, equals ca. 45% and surpasses those of alkali metal M(B3N2) salts23 and parent ammonia borane.7 Such large observed mass loss may be attributed to the evolution of borazine and other volatiles. The solid residue is amorphous, and consists of boron nitride and polymeric BXNYHZ phases as deduced from IR analysis (cf. ESI†).
The above-mentioned observations lead to the following overall equations describing thermal decomposition of the two components of the main product:
 | (5) |
 | (6) |
Theoretical mass losses as explained in eqn (5) and (6) are 43% and 42%, respectively, which reasonably agree with the observed experimental mass loss of ca. 45%.
Theoretical considerations on decomposition pathways
As shown in the previous works, the mechanistic investigation of the decomposition of seemingly simple B–N–H compounds (e.g. NH3BH3 or MNH2BH3) is a highly demanding task since there are several alternative pathways of their decomposition, which – depending on experiment conditions – may simultaneously affect this process.38–41 Therefore, we attempted to address in this work only selected aspects influencing thermal decomposition of the examined system, NH4(B3N2), and of closely related NH4BH4 and NH3BH3.NH4(B3N2) may be viewed as a derivative of NH4BH4 where one hydridic hydrogen atom from the borohydride anion is substituted by a –[NH2BH2NH2BH3] moiety. Such substitution allows for better delocalisation of the anion's negative charge, which should hinder the H⋯H coupling. This is in good agreement with the differences in thermal stability of these materials, where NH4BH4 decomposes at ca. −40 °C,31 while decomposition of NH4(B3N2) can be observed only above +50 °C. NH3BH3 is the most stable among the considered systems with dehydrogenation onset at +72 °C and rapid decomposition at +112 °C.8
The results of our calculations qualitatively reproduce the experimentally observed trend of relative stability of the discussed systems: NH4BH4 < NH4(B3N2) < NH3BH3 (Table 4). The decomposition of NH4BH4 in THF requires a small activation barrier of ca. 14 kcal mol−1, while the reaction barrier for the coupling of NH4+ cations with (B3N2)− anions (eqn (2)) in THF is larger, i.e. ca. 17 kcal mol−1. This translates to ca. 100 times slower decomposition of NH4(B3N2) in comparison to NH4BH4 under ambient temperature conditions. As known from the literature, dehydrogenation of NH3BH3 experiences an even higher activation barrier of ca. 30 kcal mol−1, rendering it stable at room temperature.39 Thus, NH4(B3N2) is stabilised with respect to NH4BH4 and destabilised as compared to NH3BH3.
| Dehydrogenation process | E a [kcal mol−1] |
|---|---|
| (NH4)+(BH4)− → NH3BH3 + H2↑ | 14 |
| (NH4)+(B3N2)− → B3N3 + H2↑ | 17 |
| 3B3N3·(NH4)+(B3N2)− → 4B3N3 + H2↑ | 38 |
| B3N3 → c-N3B3H12 + H2↑ | 42 |
| 2NH3BH3 → NH3BH2NH2BH3 + H2↑ | 56 |
The calculations regarding NH4(B3N2) also explain a rather slow rate of its decomposition towards B3N3, which permits NMR monitoring of this reaction in real time. In this respect, formation of the 3![[thin space (1/6-em)]](https://www.rsc.org/images/entities/char_2009.gif) :
:![[thin space (1/6-em)]](https://www.rsc.org/images/entities/char_2009.gif) 1 mixture of B3N3 and NH4(B3N2) could be explained by complexation of NH4+ cations in the reaction mixture by three bulky B3N3 molecules (formed in the initial stages). Importantly, DFT shows that such complex should be kinetically very stable in the THF solution (cf. ESI†). B3N3 molecules partially shield NH4+ cations making the approach of (B3N2)− anions more difficult. Additionally, surrounding of the NH4+ cation by the three large N3B3 molecules lowers its Lewis acidity, making it thermodynamically less reactive towards (B3N2)−. Indeed, according to our calculations, ligation of NH4+ with three B3N3 molecules results in an increase in the activation energy of H2 release to 38 kcal mol−1, which makes the further decomposition of NH4(B3N2) towards B3N3 nearly impossible at room temperature. Obviously, such stabilisation is not present in the case of parent NH4BH4. cf. ESI† for further details of the calculated reaction paths.
1 mixture of B3N3 and NH4(B3N2) could be explained by complexation of NH4+ cations in the reaction mixture by three bulky B3N3 molecules (formed in the initial stages). Importantly, DFT shows that such complex should be kinetically very stable in the THF solution (cf. ESI†). B3N3 molecules partially shield NH4+ cations making the approach of (B3N2)− anions more difficult. Additionally, surrounding of the NH4+ cation by the three large N3B3 molecules lowers its Lewis acidity, making it thermodynamically less reactive towards (B3N2)−. Indeed, according to our calculations, ligation of NH4+ with three B3N3 molecules results in an increase in the activation energy of H2 release to 38 kcal mol−1, which makes the further decomposition of NH4(B3N2) towards B3N3 nearly impossible at room temperature. Obviously, such stabilisation is not present in the case of parent NH4BH4. cf. ESI† for further details of the calculated reaction paths.
Noteworthy, our estimation of reaction barrier (in THF) for cyclisation of B3N3 or intramolecular H2 evolution from NH3BH3 gives values higher than decomposition of the NH4+ complex with B3N3 (Table 4), which is in agreement with experimental findings that these systems are stable.
Conclusions
Synthesis of hydrogen-rich (NH4)(B3N2) salts was attempted via a metathetical approach using precursors which contained weakly coordinating ions. The obtained product, however, corresponds to a mixture of ionic (NH4)(B3N2) and neutral B3N3 forming cocrystals in a molar ratio of 1![[thin space (1/6-em)]](https://www.rsc.org/images/entities/char_2009.gif) :
:![[thin space (1/6-em)]](https://www.rsc.org/images/entities/char_2009.gif) 3. Based on available 11B NMR data, the main product was found to be very similar to the samples reported earlier by Ewing et al.21 as B3N3. The B3N3 moiety forms due to partial decomposition of (NH4)(B3N2) occurring in situ during the synthesis.
3. Based on available 11B NMR data, the main product was found to be very similar to the samples reported earlier by Ewing et al.21 as B3N3. The B3N3 moiety forms due to partial decomposition of (NH4)(B3N2) occurring in situ during the synthesis.
Despite its high hydrogen content of 16.4%, the new compound cannot act ‘as prepared’ as a self-standing solid-state hydrogen reservoir as it decomposes via a set of exothermic events while evolving a mixture of volatile gaseous products such as borazine, diborane and ammonia, aside from hydrogen. Thus, the spontaneous, gradual decomposition cannot easily be avoided via pressurisation, and deeper chemical modifications, like formation of mixed-cation salts, would be required to stabilise such compounds. However, it is possible that templating our product in porous matrixes could result in a substantial improvement in the purity of the evolved hydrogen, similarly as it was observed for ammonia borane.42
Experimental
Reagents
All operations were performed in an inert Ar atmosphere inside gloveboxes, MBRAUN Labmaster DP or Vigor SG1200 (O2, H2O < 1.0 ppm). Commercially available reagents and solvents were used: NH3BH3 (98%, JSC Aviabor), NH4B(C6H5)4 (99%, Sigma-Aldrich (later denoted as SA), C4H8O (99%, SA), and CH2Cl2 (99%, SA). The synthesis of (C18H39N4PH)(BH3NH2BH2NH2BH3) was performed according to the route described in our earlier paper.23 For NMR measurements, we used THF-d8 (99.5 atom% D, SA).Infrared absorption spectroscopy
IR spectra were measured in the standard range of 400–4000 cm−1 using a Fourier Transform IR spectrometer Vertex 80v from Bruker. Samples were examined using KBr pellets prepared using anhydrous KBr (99%, SA) additionally dried at 150 °C for 24 h.Raman spectroscopy
Raman scattering measurements were done using a Raman microscopy setup from Jobin Yvon T64000 with a Si CCD detector and a Kr–Ar gas laser from Spectraphysics. We used green 514.5 nm excitation line. For the measurements, small doses of samples were placed in 0.5 mm-thick quartz capillaries sealed in an inert gas atmosphere.Nuclear magnetic resonance
1B NMR spectra with and without 1H decoupling were recorded using an Agilent 700 MHz spectrometer with a Direct Drive 2 console and a 5 mm room temperature broadband probe. We used deuterated tetrahydrofuran (d8-THF) as a solvent. The number of scans has been set to 256, the interscan delay to 1 s and the acquisition time to 200 ms. The spectra were acquired at 25 °C. The exponential apodisation has been used during processing (line broadening of 5 Hz).Thermogravimetric analysis
Thermal decomposition was investigated using a STA 410 thermal analyser from Netzsch, in the temperature range from −10 °C to +200 °C. A STA 449 allows for simultaneous thermogravimetric analysis, differential scanning calorimetry and evolved gas analysis by means of mass spectrometry. The samples were loaded into alumina crucibles inside a glovebox. Helium was used as a carrier gas. Evolved gases were analysed using a QMS 403C Aëolos MS from Pfeiffer–Vacuum. The transfer line was preheated to 100 °C to avoid condensation of residues.Powder X-ray diffraction
PXRD measurements were conducted on samples sealed in 0.5 mm thick quartz capillaries in an inert atmosphere. Two diffractometers were used: a Panalytical X'Pert Pro with a linear PIXcel Medipix2 detector (parallel beam; the CoKα12 radiation) and a Bruker D8 Discover with a 2D Vantec detector (parallel beam; the CuKα12 radiation).Crystal structure solution of the main product
Diffraction signals were indexed using a X-cell43 and the initial structural model was obtained using the FOX software,44 while the Rietveld refinement has been performed using a Jana2006.45 Pseudovoigt functions with the Berar–Baldinozzi asymmetry were used for the modelling of diffraction profiles. The restraints were used during refinement for the N–H and B–H distances (at 0.900(10) Å and 1.100(10) Å, respectively, Fig. S9. 2†), and the angles related to hydrogen atoms (to 109.47° with tolerance of ca. 0.5°). The N–B distances were set to the value 1.57(1) Å. The atomic displacement parameters of B and N atoms were set equal, while those of H atoms were constrained according to the riding model. The bottom constraint of 1.91 Å for H⋯H distances was applied for the final refinement. Further details on the crystal structure may be obtained from CCDC/FIZ Karlsruhe on quoting the CSD deposition no. 2193624.Crystal structure solution of the side product
The crystal of the compound was covered with perfluorinated oil (Krytox 1531). Data collection and reduction were performed using an Agilent Supernova X-ray diffractometer with Kα-Cu radiation (microsource), data reduction being performed using the CrysAlisPro software (v. 40.99).46 Structure solution: SHELXT,47 refinement against F2 in Shelxl-2018, with ShelXle as GUI software.48 The disorder of the –OC(CF3)3 groups was resolved using DSR.49 Further details on the crystal structure may be obtained from CCDC/FIZ Karlsruhe on quoting the CSD deposition no. 2195203.Density functional theory
DFT calculations for the solid state were performed using the CASTEP.50 The initial structural models were derived from the experimental data, as described above. Generalised gradient approximation (GGA) was used with the PBE functional and Tkatchenko–Scheffler dispersive correction.51 A cutoff value of 500 eV was applied to achieve good energy convergence. The density of the k-point grid was set below 0.1 Å−1 and ultrasoft generated on the fly pseudopotentials was used as they provide more accurate lattice parameters.The molecular DFT calculations were performed using the Orca 5.0.3 package52 by the r2SCAN-3c method used for structure optimisations and thermochemistry calculations. THF solvation was simulated using the CPCM model. Reaction barriers were determined using the nudged elastic bond method (NEB) with transition state optimised with r2SCAN-3c.53 To achieve a better accuracy, single-point energies for the optimised structures were calculated with ωB97X-V functional54 with def2-TZVP basis set,55 def2/J auxiliary basis set56 and D4 dispersion correction.57
Graphical presentation
Visualisations of crystal structures were performed with Vesta.58 Illustrations have been prepared using Inkscape 0.92.1.59Conflicts of interest
There are no conflicts of interests to declare.Acknowledgements
This research was funded by Polish National Science Centre within the projects Preludium 13 (UMO/2017/25/N/ST5/01977) and Sonata Bis 8 (UMO/2018/30/E/ST5/00854). Research was carried out with the use of CePT infrastructure financed by the European Union – the European Regional Development Fund within the Operational Programme “Innovative economy” for 2007–2013 (POIG.02.02.00-14-024/08-00).References
- T. Richardson, S. de Gala, R. H. Crabtree and P. E. M. Siegbahn, J. Am. Chem. Soc., 1995, 117, 12875–12876 CrossRef CAS.
- W. T. Klooster, T. F. Koetzle, P. E. M. Siegbahn, T. B. Richardson and R. H. Crabtree, J. Am. Chem. Soc., 1999, 121, 6337–6343 CrossRef CAS.
- E. Magos-Palasyuk, T. Palasyuk, P. Zaleski-Ejgierd and K. Fijalkowski, CrystEngComm, 2014, 16, 10367–10370 RSC.
- S. Filippov, J. B. Grinderslev, M. S. Andersson, J. Armstrong, M. Karlsson, T. R. Jensen, J. Klarbring, S. I. Simak and U. Häussermann, J. Phys. Chem. C, 2019, 123, 28631–28639 CrossRef CAS.
- S. G. Shore and R. W. Parry, J. Am. Chem. Soc., 1955, 77, 6084–6085 CrossRef CAS.
- U. B. Demirci, Energies, 2020, 13, 3071 CrossRef CAS.
- F. Baitalow, J. Baumann, G. Wolf, K. Jaenicke-Rößler and G. Leitner, Thermochim. Acta, 2002, 391, 159–168 CrossRef CAS.
- J. Baumann, F. Baitalow and G. Wolf, Thermochim. Acta, 2005, 430, 9–14 CrossRef CAS.
- A. Al-Kukhun, H. T. Hwang and A. Varma, Int. J. Hydrogen Energy, 2013, 38, 169–179 CrossRef CAS.
- DOE Technical Targets for Onboard Hydrogen Storage for Light-Duty Vehicles.
- Y. S. Chua, P. Chen, G. Wu and Z. Xiong, Chem. Commun., 2011, 47, 5116 RSC.
- R. Owarzany, P. Leszczyński, K. Fijalkowski and W. Grochala, Crystals, 2016, 6, 88 CrossRef.
- H. V. K. Diyabalanage, T. Nakagawa, R. P. Shrestha, T. A. Semelsberger, B. L. Davis, B. L. Scott, A. K. Burrell, W. I. F. David, K. R. Ryan, M. O. Jones and P. P. Edwards, J. Am. Chem. Soc., 2010, 132, 11836–11837 CrossRef CAS PubMed.
- I. V. Kazakov, A. V. Butlak, P. A. Shelyganov, V. V. Suslonov and A. Y. Timoshkin, Polyhedron, 2017, 127, 186–190 CrossRef CAS.
- R. Owarzany, T. Jaroń, P. J. Leszczyński, K. J. Fijalkowski and W. Grochala, Dalton Trans., 2017, 46, 16315–16320 RSC.
- J. Luo, X. Kang and P. Wang, Energy Environ. Sci., 2013, 6, 1018–1025 RSC.
- N. A. Shcherbina, I. V. Kazakov and A. Y. Timoshkin, Russ. J. Gen. Chem., 2017, 87, 2875–2877 CrossRef CAS.
- M. F. Hawthorne, S. S. Jalisatgi, A. V. Safronov, H. B. Lee and J. Wu, Chemical Hydrogen Storage Using Polyhedral Borane Anions and Aluminum-Ammonia-Borane Complexes, 2010 Search PubMed.
- G. Xia, Y. Tan, X. Chen, Z. Guo, H. Liu and X. Yu, J. Mater. Chem. A, 2013, 1, 1810–1820 RSC.
- N. Biliškov, A. Borgschulte, K. Užarević, I. Halasz, S. Lukin, S. Milošević, I. Milanović and J. G. Novaković, Chem. – Eur. J., 2017, 23, 16274–16282 CrossRef PubMed.
- W. C. Ewing, P. J. Carroll and L. G. Sneddon, Inorg. Chem., 2013, 52, 10690–10697 CrossRef CAS PubMed.
- W. C. Ewing, A. Marchione, D. W. Himmelberger, P. J. Carroll and L. G. Sneddon, J. Am. Chem. Soc., 2011, 133, 17093–17099 CrossRef CAS PubMed.
- R. Owarzany, K. J. Fijalkowski, T. Jaroń, P. J. Leszczyński, Ł. Dobrzycki, M. K. Cyrański and W. Grochala, Inorg. Chem., 2016, 55, 37–45 CrossRef CAS PubMed.
- K. J. Fijalkowski, T. Jaroń, P. J. Leszczyński, E. Magos-Palasyuk, T. Palasyuk, M. K. Cyrański and W. Grochala, Phys. Chem. Chem. Phys., 2014, 16, 23340–23346 RSC.
- X. Chen, X. Jiang, Y. Jing and X. Chen, Chem.– Asian J., 2021, 16, 2475–2480 CrossRef CAS PubMed.
- I. C. Evans, Dissertation, University of Birmingham, 2011.
- K. R. Ryan, Dissertation, University of Oxford, 2011.
- A. Starobrat, M. J. Tyszkiewicz, W. Wegner, D. Pancerz, P. A. Orłowski, P. J. Leszczyński, K. J. Fijalkowski, T. Jaroń and W. Grochala, Dalton Trans., 2015, 44, 19469–19477 RSC.
- T. Jaroń, W. Wegner, K. J. Fijałkowski, P. J. Leszczyński and W. Grochala, Chem. – Eur. J., 2015, 21, 5689–5692 CrossRef PubMed.
- T. Jaroń, P. A. Orłowski, W. Wegner, K. J. Fijałkowski, P. J. Leszczyński and W. Grochala, Angew. Chem., Int. Ed., 2015, 54, 1236–1239 CrossRef PubMed.
- R. W. Parry, D. R. Schultz and P. R. Girardot, J. Am. Chem. Soc., 1958, 80, 1–3 CrossRef CAS.
- R. S. Krishnan, Proc. Ind. Acad. Sci., A, 1947, 26, 432 CrossRef.
- A. Karkamkar, S. M. Kathmann, G. K. Schenter, D. J. Heldebrant, N. Hess, M. Gutowski and T. Autrey, Chem. Mater., 2009, 21, 4356–4358 CrossRef CAS.
- A. S. Davydov, Theory of Molecular Excitons, Springer, 1971 Search PubMed.
- A. Paolone, F. Teocoli, S. Sanna, O. Palumbo and T. Autrey, J. Phys. Chem. C, 2013, 117, 729–734 CrossRef CAS.
- W. E. Wallace, in NIST Standard Reference Database Number 69, ed. P. Linstrom and W. Mallard, National Institute of Standards and Technology, 2018 Search PubMed.
- H. Wu, W. Zhou and T. Yildirim, J. Am. Chem. Soc., 2008, 130, 14834–14839 CrossRef CAS PubMed.
- M. T. Nguyen, V. S. Nguyen, M. H. Matus, G. Gopakumar and D. A. Dixon, J. Phys. Chem. A, 2007, 111, 679–690 CrossRef CAS PubMed.
- P. M. Zimmerman, Z. Zhang and C. B. Musgrave, J. Phys. Chem. Lett., 2011, 2, 276–281 CrossRef CAS.
- C. W. Hamilton, R. T. Baker, A. Staubitz and I. Manners, Chem. Soc. Rev., 2009, 38, 279–293 RSC.
- J. Li, S. M. Kathmann, H.-S. Hu, G. K. Schenter, T. Autrey and M. Gutowski, Inorg. Chem., 2010, 49, 7710–7720 CrossRef CAS PubMed.
- A. Gutowska, L. Li, Y. Shin, C. M. Wang, X. S. Li, J. C. Linehan, R. S. Smith, B. D. Kay, B. Schmid, W. Shaw, M. Gutowski and T. Autrey, Angew. Chem., Int. Ed., 2005, 44, 3578–3582 CrossRef CAS PubMed.
- M. A. Neumann, J. Appl. Crystallogr., 2003, 36, 356–365 CrossRef CAS.
- V. Favre-Nicolin and R. Černý, J. Appl. Crystallogr., 2002, 35, 734–743 CrossRef CAS.
- V. Petříček, M. Dušek and L. Palatinus, Z. Kristallogr. - Cryst. Mater., 2014, 229, 345–352 CrossRef.
- Agilent, 2014.
- G. M. Sheldrick, Acta Crystallogr., Sect. A: Found. Adv., 2015, 71, 3–8 CrossRef PubMed.
- C. B. Hübschle, G. M. Sheldrick and B. Dittrich, J. Appl. Crystallogr., 2011, 44, 1281–1284 CrossRef PubMed.
- D. Kratzert, J. J. Holstein and I. Krossing, J. Appl. Crystallogr., 2015, 48, 933–938 CrossRef CAS PubMed.
- S. J. Clark, M. D. Segall, C. J. Pickard, P. J. Hasnip, M. I. J. J. Probert, K. Refson and M. C. Payne, Z. Kristallogr., 2005, 220, 567–570 CAS.
- A. Tkatchenko and M. Scheffler, Phys. Rev. Lett., 2009, 102, 073005 CrossRef PubMed.
- F. Neese, F. Wennmohs, U. Becker and C. Riplinger, J. Chem. Phys., 2020, 152, 224108 CrossRef CAS PubMed.
- S. Grimme, A. Hansen, S. Ehlert and J.-M. Mewes, J. Chem. Phys., 2021, 154, 064103 CrossRef CAS PubMed.
- N. Mardirossian and M. Head-Gordon, Phys. Chem. Chem. Phys., 2014, 16, 9904 RSC.
- F. Weigend and R. Ahlrichs, Phys. Chem. Chem. Phys., 2005, 7, 3297 RSC.
- F. Weigend, Phys. Chem. Chem. Phys., 2006, 8, 1057 RSC.
- E. Caldeweyher, S. Ehlert, A. Hansen, H. Neugebauer, S. Spicher, C. Bannwarth and S. Grimme, J. Chem. Phys., 2019, 150, 154122 CrossRef PubMed.
- K. Momma and F. Izumi, J. Appl. Crystallogr., 2011, 44, 1272–1276 CrossRef CAS.
- Inkscape project, 2017.
Footnotes |
| † This work is dedicated to Prof. Roald Hoffmann at his 85th birthday |
| ‡ Electronic supplementary information (ESI) available: Synthesis, NMR, IR, Raman, PXD, crystal structures, TGA/DSC/MS, DFT results and comparison with other M(B3N2) salts. Detailed data for the main product and reference data for M(BH3NH2BH2NH2BH3) salts. See DOI: https://doi.org/10.1039/d2dt03674f |
| This journal is © The Royal Society of Chemistry 2023 |

