 Open Access Article
From M6 to M12, M19 and M38 molecular alloy Pt–Ni carbonyl nanoclusters: selective growth of atomically precise heterometallic nanoclusters†
Cristiana
Cesari
 a,
Beatrice
Berti
a,
Marco
Bortoluzzi
a,
Beatrice
Berti
a,
Marco
Bortoluzzi
 b,
Cristina
Femoni
 a,
Tiziana
Funaioli
c,
Federico Maria
Vivaldi
 c,
Maria Carmela
Iapalucci
a and
Stefano
Zacchini
 *a
*a
aDipartimento di Chimica Industriale “Toso Montanari”, Università di Bologna, Viale Risorgimento 4, 40136 Bologna, Italy. E-mail: stefano.zacchini@unibo.it
bDipartimento di Scienze Molecolari e Nanosistemi, Ca’ Foscari University of Venice, Via Torino 155, 30175 Mestre (Ve), Italy
cDipartimento di Chimica e Chimica Industriale, Università di Pisa, Via G. Moruzzi 13, 56124, Pisa, Italy
First published on 28th February 2023
Abstract
Heterometallic Chini-type clusters [Pt6−xNix(CO)12]2− (x = 0–6) were obtained by reactions of [Pt6(CO)12]2− with Ni-clusters such as [Ni6(CO)12]2−, [Ni9(CO)18]2− and [H2Ni12(CO)21]2−, or from [Pt9(CO)18]2− and [Ni6(CO)12]2−. The Pt/Ni composition of [Pt6−xNix(CO)12]2− (x = 0–6) depended on the nature of the reagents employed and their stoichiometry. Reactions of [Pt9(CO)18]2− with [Ni9(CO)18]2− and [H2Ni12(CO)21]2−, as well as reactions of [Pt12(CO)24]2− with [Ni6(CO)12]2−, [Ni9(CO)18]2− and [H2Ni12(CO)21]2−, afforded [Pt9−xNix(CO)18]2− (x = 0–9) species. [Pt6−xNix(CO)12]2− (x = 1–5) were converted into [Pt12−xNix(CO)21]4− (x = 2–10) upon heating in CH3CN at 80 °C, with almost complete retention of the Pt/Ni composition. Reaction of [Pt12−xNix(CO)21]4− (x ≈ 8) with HBF4·Et2O afforded the [HPt14+xNi24−x(CO)44]5− (x ≈ 0.7) nanocluster. Finally, [Pt19−xNix(CO)22]4− (x = 2–6) could be obtained by heating [Pt9−xNix(CO)18]2− (x = 1–3) in CH3CN at 80 °C, or [Pt6−xNix(CO)12]2− (2–4) in DMSO at 130 °C. The molecular structures of these new alloy nanoclusters have been determined by single crystal X-ray diffraction. The site preference of Pt and Ni within their metal cages has been computationally investigated. The electrochemical and IR spectroelectrochemical behavior of [Pt19−xNix(CO)22]4− (x = 3.11) has been studied and compared to the isostructural homometallic nanocluster [Pt19(CO)22]4−.
Introduction
Alloying metals in the nano and sub-nano domain is attracting an increasing interest from both a fundamental and applicative point of view.1–7 Different chemical and physical properties may arise, and these can find several applications particularly regarding catalysis, biology, biomedicine and sensors.8–18 From the structural perspective, alloying may occur randomly or in an ordered way.19–26 In the latter case, “ordered” may correspond to site-specific doping, formation of well defined ordered phases, segregation or related phenomena where the different metals occupy well defined positions. Often, in the real systems, intermediate behaviors between “random” and “ordered” are observed, that is, the different metals display a preference for some sites, but some level of disorder is present. In order to get an atomic insight into these phenomena, the study of perfectly defined molecular systems is required.27–29 This is the domain of atomically precise metal alloy nanoclusters.Several types of atomically precise metal alloy nanoclusters are known, depending on the nature of the metals and the ligands involved. Among these, the chemistry of molecular heterometallic (alloy) carbonyl clusters is well developed, particular regarding group 10 metals. Indeed, several homoleptic Ni–Pd and Ni–Pt carbonyl nanoclusters have been reported,19,21,22,30–32 as well as heteroleptic CO/phosphine Pd–Pt nanoclusters.33 Beside their beauty, the molecular structures of these alloy nanoclusters, fully unraveled by single-crystal X-ray diffraction (SC-XRD), have revealed a subtle balance between metal segregation, site preference, substitutional and positional disorder. Very recently, the first case of perfect random alloy clusters has been reported for hexanuclear Ni–Pt Chini type carbonyl clusters of general formula [Pt6−xNix(CO)12]2− (x = 0–6). As a prosecution of this work, we herein report the selective growth of these alloy M6 clusters to yield M12, M19 and M38 molecular alloy nanoclusters. Their structures have been determined by SC-XRD and alloying has been also computationally studied by DFT methods. Moreover, electrochemical and spectroelectrochemical studies revealed that larger nanoclusters behave as electron-sinks, displaying several reversible or quasi-reversible redox processes.34–38
In order to help the reader, the molecular structures of homometallic Ni and Pt carbonyl clusters relevant to this work are represented in Fig. 1. The syntheses, chemical, spectroscopic and structural characterizations of all these species have been previously described.37–42 [Ni6(CO)12]2−, [Ni9(CO)18]2−, [H2Ni12(CO)21]2−, [Pt6(CO)12]2−, [Pt9(CO)18]2− and [Pt12(CO)24]2− will be used as starting materials for the preparation of heterometallic Pt–Ni clusters in the following sections. [Pt19(CO)22]4− and [Pt38(CO)44]2−, as well as [HNi12(CO)21]3− and [Ni12(CO)21]4−, are reported because they are structurally related to some of the heterometallic Pt–Ni clusters described in this paper. [H2Ni12(CO)21]2− and [HNi12(CO)21]3− are hydride species as confirmed by 1H NMR spectroscopy. Their hydrogen atoms have been located by SC-XRD and neutron diffraction on single crystals.41,42 The hydrides of [H4−nNi12(CO)21]n− (n = 2, 3) are located within distorted octahedral cavities.
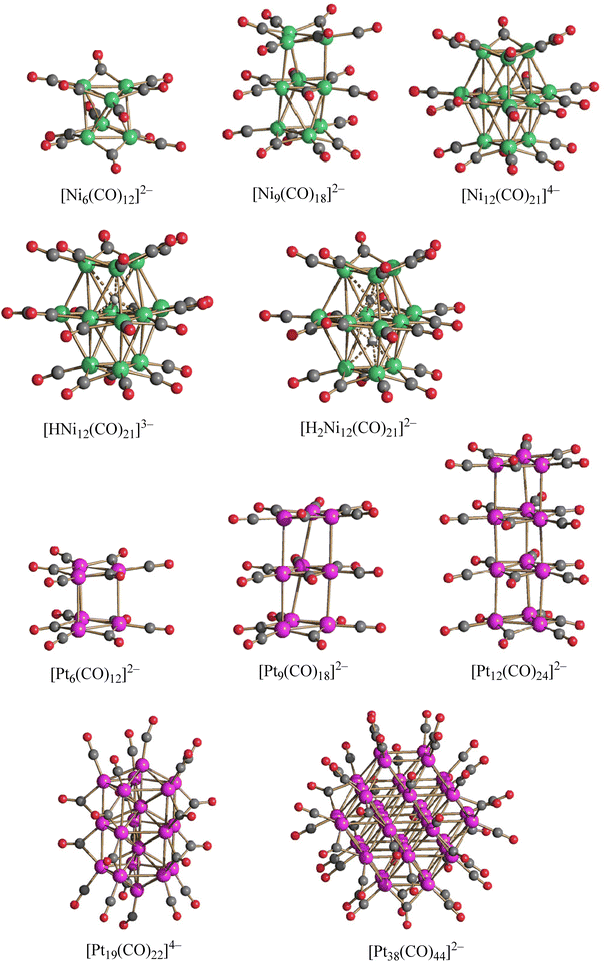 | ||
| Fig. 1 Molecular structure of [Ni6(CO)12]2−, [Ni9(CO)18]2−, [H4−nNi12(CO)21]n− (n = 2–4), [Pt6(CO)12]2−, [Pt9(CO)18]2−, [Pt12(CO)24]2−, [Pt19(CO)22]4− and [Pt38(CO)44]2− (green, Ni; purple, Pt; red, O; grey, C; white H). Ni–H bonds are represented as dotted lines. All these species have been previously described in the literature.37–42 | ||
The problems related to the assignment of the number of hydrides and their location within metal carbonyl clusters of increasing sizes have been previously discussed.28,29,31,39,43,44 In the case of lower nuclearity metal carbonyl clusters (that is, those with up to 20–25 metal atoms), the presence of H-atoms, their number and often also their location can be inferred from 1H NMR spectroscopy and SC-XRD analyses. In some fortunate cases, e.g. [HNi12(CO)21]3− and [H2Ni12(CO)21]2−, single crystals suitable for neutron diffraction have been also obtained, fully corroborating their hydride nature.41,42 Moreover, due to the π-acceptor property of CO, H-atoms within metal carbonyl clusters behave like protons. Thus, these can be added with strong acids such as HBF4·Et2O, and removed using strong bases, such as NaOH or NaOMe. Such protonation/deprotonation reactions can be monitored by IR spectroscopy in the νCO region, since they decrease (protonation) or increase (deprotonation) the negative charge of the cluster anions affecting the νCO stretching frequencies. For instance, the reaction of [Ni12(CO)21]4− with HBF4·Et2O affords [HNi12(CO)21]3− (one mole equivalent of acid) and [H2Ni12(CO)21]2− (two mole equivalent of acid).
In the case of higher nuclearity metal carbonyl clusters (that is, those with more than 20–25 metal atoms), H-atoms cannot be located by SC-XRD, due to the presence of several heavy atoms, and their crystals are usually not suitable for single crystal neutron diffraction. Nonetheless, SC-XRD studies give a direct evidence of the charge of the cluster anion, by counting the number of counterions. If two clusters have the same structure (excluding H-atoms) and different charges, there are two possibilities:21,43,44
(1) They are the same species with a different oxidation state. In this case, the cyclic voltammetric (CV) profiles of the two differently charged anion should be identical, being the same species with a different oxidation state.
(2) They are different species, because of the presence of a different number of hydrides. In this case, their CV profiles should be different.
Thus, combining SC-XRD, electrochemistry, protonation/deprotonation reactions and IR spectroscopy, it is possible to indirectly determine the presence (and number) of H-atoms also in larger clusters. It must be remarked that the hydride resonances in the 1H NMR spectra of larger metal carbonyl clusters become very broad and often they are lost on the baseline of the spectra.43
Results and discussion
Synthesis of [Pt6−xNix(CO)12]2− (x = 1–5) and [Pt9−xNix(CO)18]2− (x = 1–3)
All the reactions reported on this paper involve anionic metal carbonyl clusters. Their charge is balanced by tetraalkylammonium cations such as [NMe4]+, [NEt4]+ and [NBu4]+. The nature of the [NR4]+ cation (R = Me, Et, Bu) does not affect the outcome of the reactions nor the chemical and spectroscopic properties of the cluster anions. Thus, the cation is not explicitly reported along the text when describing the reactions or, generally speaking, the chemical, spectroscopic and electrochemical properties of the clusters. Different cations have been employed only in order to help the obtainment of single crystals suitable for SC-XRD. Thus, the nature of the cation is explicitly indicated in the formulas of the crystals used for SC-XRD.The reactions of [Pt6(CO)12]2− with [Ni6(CO)12]2− in different stoichiometric ratios result in mixtures of the heterometallic clusters [Pt6−xNix(CO)12]2− (x = 1–5), as previously reported (Scheme 1 and Table 1).19 The nature of the obtained products can be controlled by the stoichiometry of the reaction, even though mixtures of products differing solely for the value of x are always obtained.19 The stoichiometric ratio of [Pt6(CO)12]2− and [Ni6(CO)12]2− can be varied in a continuous way between 5![[thin space (1/6-em)]](https://www.rsc.org/images/entities/char_2009.gif) :
:![[thin space (1/6-em)]](https://www.rsc.org/images/entities/char_2009.gif) 1 to 1
1 to 1![[thin space (1/6-em)]](https://www.rsc.org/images/entities/char_2009.gif) :
:![[thin space (1/6-em)]](https://www.rsc.org/images/entities/char_2009.gif) 5 allowing to obtain all the species [Pt6−xNix(CO)12]2− (x = 1–5), as previously reported.19 In particular: stoichiometric ratio 5
5 allowing to obtain all the species [Pt6−xNix(CO)12]2− (x = 1–5), as previously reported.19 In particular: stoichiometric ratio 5![[thin space (1/6-em)]](https://www.rsc.org/images/entities/char_2009.gif) :
:![[thin space (1/6-em)]](https://www.rsc.org/images/entities/char_2009.gif) 1, main product [Pt5Ni(CO)12]2− (x = 1); stoichiometric ratio 2
1, main product [Pt5Ni(CO)12]2− (x = 1); stoichiometric ratio 2![[thin space (1/6-em)]](https://www.rsc.org/images/entities/char_2009.gif) :
:![[thin space (1/6-em)]](https://www.rsc.org/images/entities/char_2009.gif) 1, main product [Pt4Ni2(CO)12]2− (x = 2); stoichiometric ratio 1
1, main product [Pt4Ni2(CO)12]2− (x = 2); stoichiometric ratio 1![[thin space (1/6-em)]](https://www.rsc.org/images/entities/char_2009.gif) :
:![[thin space (1/6-em)]](https://www.rsc.org/images/entities/char_2009.gif) 1, main product [Pt3Ni3(CO)12]2− (x = 3); stoichiometric ratio 1
1, main product [Pt3Ni3(CO)12]2− (x = 3); stoichiometric ratio 1![[thin space (1/6-em)]](https://www.rsc.org/images/entities/char_2009.gif) :
:![[thin space (1/6-em)]](https://www.rsc.org/images/entities/char_2009.gif) 2, main product [Pt2Ni4(CO)12]2− (x = 4); stoichiometric ratio 1
2, main product [Pt2Ni4(CO)12]2− (x = 4); stoichiometric ratio 1![[thin space (1/6-em)]](https://www.rsc.org/images/entities/char_2009.gif) :
:![[thin space (1/6-em)]](https://www.rsc.org/images/entities/char_2009.gif) 5, main product [PtNi5(CO)12]2− (x = 5); intermediate stochiometric ratios result in mixtures of these products, that is, intermediate values of x.19
5, main product [PtNi5(CO)12]2− (x = 5); intermediate stochiometric ratios result in mixtures of these products, that is, intermediate values of x.19
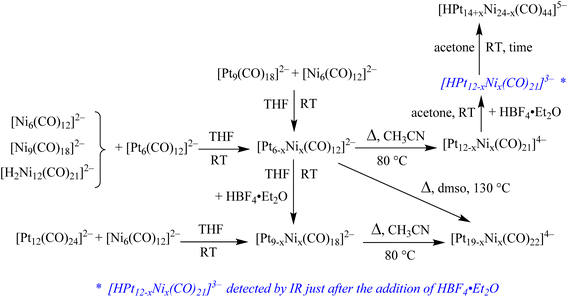 | ||
| Scheme 1 Synthesis of Pt–Ni carbonyl clusters. The reactions reported are not affected by the nature of the tetraalkylammoniun cation employed, that is [NMe4]+, [NEt4]+ and [NBu4]+. | ||
| [Ni6(CO)12]2− | [Ni9(CO)18]2− | [H2Ni12(CO)21]2− | |
|---|---|---|---|
a For each entry of the table, the stoichiometric ratio of the two homometallic Ni and Pt carbonyls may be varied in an almost continuous way, and this determines the value of x in the resulting heterometallic cluster. For instance, the reaction of [Pt6(CO)12]2− with [Ni6(CO)12]2− affords [Pt6−xNix(CO)12]2− (x = 1–5): stoichiometric ratio 5![[thin space (1/6-em)]](https://www.rsc.org/images/entities/char_2009.gif) : :![[thin space (1/6-em)]](https://www.rsc.org/images/entities/char_2009.gif) 1, [Pt5Ni(CO)12]2− (x = 1); stoichiometric ratio 2 1, [Pt5Ni(CO)12]2− (x = 1); stoichiometric ratio 2![[thin space (1/6-em)]](https://www.rsc.org/images/entities/char_2009.gif) : :![[thin space (1/6-em)]](https://www.rsc.org/images/entities/char_2009.gif) 1, [Pt4Ni2(CO)12]2− (x = 2); stoichiometric ratio 1 1, [Pt4Ni2(CO)12]2− (x = 2); stoichiometric ratio 1![[thin space (1/6-em)]](https://www.rsc.org/images/entities/char_2009.gif) : :![[thin space (1/6-em)]](https://www.rsc.org/images/entities/char_2009.gif) 1, [Pt3Ni3(CO)12]2− (x = 3); stoichiometric ratio 1 1, [Pt3Ni3(CO)12]2− (x = 3); stoichiometric ratio 1![[thin space (1/6-em)]](https://www.rsc.org/images/entities/char_2009.gif) : :![[thin space (1/6-em)]](https://www.rsc.org/images/entities/char_2009.gif) 2, [Pt2Ni4(CO)12]2− (x = 4); stoichiometric ratio 1 2, [Pt2Ni4(CO)12]2− (x = 4); stoichiometric ratio 1![[thin space (1/6-em)]](https://www.rsc.org/images/entities/char_2009.gif) : :![[thin space (1/6-em)]](https://www.rsc.org/images/entities/char_2009.gif) 5, [PtNi5(CO)12]2− (x = 5); intermediate stochiometric ratios result in intermediate values of x.19 When homometallic clusters of different nuclearities are employed, e.g., [Pt9(CO)18]2− + [Ni6(CO)12]2−, or [Pt6(CO)12]2− + [Ni9(CO)18]2−, the composition (value of x) of the heterometallic products depends on the stoichiometry, but the dependence is not linear as above, since some Ni is usually lost. Details can be found in the text and Experimental section. 5, [PtNi5(CO)12]2− (x = 5); intermediate stochiometric ratios result in intermediate values of x.19 When homometallic clusters of different nuclearities are employed, e.g., [Pt9(CO)18]2− + [Ni6(CO)12]2−, or [Pt6(CO)12]2− + [Ni9(CO)18]2−, the composition (value of x) of the heterometallic products depends on the stoichiometry, but the dependence is not linear as above, since some Ni is usually lost. Details can be found in the text and Experimental section.
|
|||
| [Pt6(CO)12]2− | [Pt6−xNix(CO)12]2− | [Pt6−xNix(CO)12]2− | [Pt6−xNix(CO)12]2− |
| [Pt9(CO)18]2− | [Pt6−xNix(CO)12]2− | [Pt6−xNix(CO)12]2− + [Pt9−xNix(CO)18]2− | [Pt6−xNix(CO)12]2− + [Pt9−xNix(CO)18]2− |
| [Pt12(CO)24]2− | [Pt9−xNix(CO)18]2− | [Pt9−xNix(CO)18]2− | [Pt9−xNix(CO)18]2− |
The [Pt6−xNix(CO)12]2− (x = 1–5) clusters can be also obtained by reaction of [Pt9(CO)18]2− with [Ni6(CO)12]2−, as well as from the reaction of [Pt6(CO)12]2− with [Ni9(CO)18]2−. In these cases, the obtained [Pt6−xNix(CO)12]2− (x = 1–5) clusters are always richer of Pt compared to the reagents, since some Ni is lost as side products such as Ni(CO)4, [Ni9(CO)18]2−, or Ni(II) salts.
Similarly, the reaction of [Pt6(CO)12]2− with [H2Ni12(CO)21]2− affords [Pt6−xNix(CO)12]2− (x = 1–5). The nature of [Pt6−xNix(CO)12]2− (x = 1–5) clusters has been confirmed by IR spectroscopy (Fig. S1–S7 in the ESI†) and compared to literature data.19 Moreover, crystals of [NBu4]4[Pt6−xNix(CO)12] (x = 4.20) have been obtained from the reaction of [Pt6(CO)12]2− with [H2Ni12(CO)21]2− in a 1![[thin space (1/6-em)]](https://www.rsc.org/images/entities/char_2009.gif) :
:![[thin space (1/6-em)]](https://www.rsc.org/images/entities/char_2009.gif) 1 stoichiometric ratio after work-up (Fig. 2). It must be remarked that using [Pt6(CO)12]2− as Pt source, [Pt6−xNix(CO)12]2− (x = 1–5) clusters are always formed regardless of the Ni-source, that is, [Ni6(CO)12]2−, [Ni9(CO)18]2− or [H2Ni12(CO)21]2−. Also the combination of [Pt9(CO)18]2− with [Ni6(CO)12]2− affords the same hexanuclear heterometallic clusters. The choice of such reagents mainly depends on the desired Pt/Ni ratio of [Pt6−xNix(CO)12]2− (x = 1–5). Thus, if Pt-rich species are required, the best synthesis involves [Pt9(CO)18]2− and [Ni6(CO)12]2−. Conversely, the reactions of [Pt6(CO)12]2− with [Ni9(CO)18]2− or [H2Ni12(CO)21]2− are the most suited for the preparation of Ni-rich species. Then, equimolar amounts of [Pt6(CO)12]2− and [Ni6(CO)12]2− can be employed for the preparation of species containing Pt/Ni ≈ 1. The structures and nature in solution of [Pt6−xNix(CO)12]2− (x = 1–5) have been previously reported and,19 therefore, they will not be discussed any further.
1 stoichiometric ratio after work-up (Fig. 2). It must be remarked that using [Pt6(CO)12]2− as Pt source, [Pt6−xNix(CO)12]2− (x = 1–5) clusters are always formed regardless of the Ni-source, that is, [Ni6(CO)12]2−, [Ni9(CO)18]2− or [H2Ni12(CO)21]2−. Also the combination of [Pt9(CO)18]2− with [Ni6(CO)12]2− affords the same hexanuclear heterometallic clusters. The choice of such reagents mainly depends on the desired Pt/Ni ratio of [Pt6−xNix(CO)12]2− (x = 1–5). Thus, if Pt-rich species are required, the best synthesis involves [Pt9(CO)18]2− and [Ni6(CO)12]2−. Conversely, the reactions of [Pt6(CO)12]2− with [Ni9(CO)18]2− or [H2Ni12(CO)21]2− are the most suited for the preparation of Ni-rich species. Then, equimolar amounts of [Pt6(CO)12]2− and [Ni6(CO)12]2− can be employed for the preparation of species containing Pt/Ni ≈ 1. The structures and nature in solution of [Pt6−xNix(CO)12]2− (x = 1–5) have been previously reported and,19 therefore, they will not be discussed any further.
The reactions of [Pt12(CO)24]2− with [Ni6(CO)12]2−, [Ni9(CO)18]2− or [H2Ni12(CO)21]2− result in [Pt9−xNix(CO)18]2− (x = 1–3). The nature of the new products has been inferred from IR spectroscopy and the Pt/Ni composition ascertained by microwave plasma-atomic emission spectrometry (MP-AES) analyses. The obtained [Pt9−xNix(CO)18]2− (x = 1–3) clusters are always richer in Pt compared to the reagents, since some Ni is lost during the reaction and work-up (see above). Moreover, thermal decomposition of [Pt9−xNix(CO)18]2− (x = 1–3) affords [Pt19−xNix(CO)22]4− (x = 2–6) as described below, further supporting the heterometallic nature of these species. Indeed, it is well known that [Pt9(CO)18]2− is transformed into [Pt19(CO)22]4− after refluxing in CH3CN.38,39 Unfortunately, all the attempts to obtain crystals of [Pt9−xNix(CO)18]2− (x = 1–3) suitable for SC-XRD failed. Finally, the reactions of [Pt9(CO)18]2− with [Ni9(CO)18]2− or [H2Ni12(CO)21]2− result in mixtures of [Pt6−xNix(CO)12]2− (x = 1–5) and [Pt9−xNix(CO)18]2− (x = 1–3) (Fig. S8–S10 in the ESI†).
It is noteworthy that the reaction of [Pt12(CO)24]2− with [Ni6(CO)12]2− to give [Pt9−xNix(CO)18]2− (x = 1–3) is not a simple comproportionation as it might be inferred from eqn (1), which would predict the formation of [Pt9−xNix(CO)18]2− (x = 3), that is, [Pt6Ni3(CO)18]2−:
| [Pt12(CO)24]2− + [Ni6(CO)12]2− → 2[Pt6Ni3(CO)18]2− | (1) |
Indeed, MP-AES analyses of the product isolated after work-up of a 1![[thin space (1/6-em)]](https://www.rsc.org/images/entities/char_2009.gif) :
:![[thin space (1/6-em)]](https://www.rsc.org/images/entities/char_2009.gif) 1 reaction mixture of [Pt12(CO)24]2− and [Ni6(CO)12]2− result in an experimental Pt/Ni ratio of 4.47 (corresponding to x = 1.65) instead of 2.00 (x = 3) as it would have been expected based on eqn (1). Thus, during the reaction some Ni is lost, probably as [Ni9(CO)18]2−, and the final product is richer of Pt compared to the reagents.
1 reaction mixture of [Pt12(CO)24]2− and [Ni6(CO)12]2− result in an experimental Pt/Ni ratio of 4.47 (corresponding to x = 1.65) instead of 2.00 (x = 3) as it would have been expected based on eqn (1). Thus, during the reaction some Ni is lost, probably as [Ni9(CO)18]2−, and the final product is richer of Pt compared to the reagents.
As an alternative for the preparation of larger heterometallic Pt–Ni Chini-type clusters, the reactions of [Pt6−xNix(CO)12]2− (x = 1–5) with strong acids, such as HBF4·Et2O, have been investigated. It is well documented that homometallic Chini clusters are oxidized by strong acids through the H+/H2 couple.39 Thus, the step-wise addition of HBF4·Et2O to [Pt6(CO)12]2− affords [Pt9(CO)18]2−, [Pt12(CO)24]2−, [Pt15(CO)30]2−, [Pt18(CO)36]2−, up to the formation of the insoluble “Pt-carbonyl” [Pt∼30(CO)∼60]2−.40 Oxidation of these clusters is accompanied by the reduction of H+, produced by HBF4·Et2O, to H2.40 In contrast, the reaction of [Ni6(CO)12]2− with increasing amounts of HBF4·Et2O results in [Ni7(CO)15]2−, [Ni9(CO)18]2− and [H2Ni12(CO)21]2−. Oxidation of Ni carbonyl anions is accompanied by the formation of Ni(CO)4.
A similar behavior has been observed in the case of the reactions of [Pt6−xNix(CO)12]2− (x = 1–5) with HBF4·Et2O (Fig. 3 and Fig. S11–S13 in the ESI†) which are accompanied by formation of Ni(CO)4. As a result, the final products are richer of Pt than the starting materials, and usually only crystals of [Pt9(CO)18]2− and [Pt12(CO)24]2− can be isolated after work-up of the reaction mixtures.
Synthesis and molecular structure of [Pt12−xNix(CO)21]4− (x = 2–10) and [HPt14+xNi24−x(CO)44]5− (x = 0.70)
Heterometallic [Pt6−xNix(CO)12]2− (x = 1–5) clusters are less stable in solution compared to homometallic [Pt6(CO)12]2− and [Ni6(CO)12]2− species. Indeed, [Pt6−xNix(CO)12]2− (x = 1–5) spontaneously lose CO after standing in solution for several days under N2 atmosphere. The process is favored in polar solvents such as CH3CN compared to THF, and can be accelerated upon heating. Thus, refluxing a CH3CN solution of [Pt6−xNix(CO)12]2− for a few hours affords [Pt12−xNix(CO)21]4− (x = 2–10) in good yields (Fig. S14–S16 in the ESI†). Conversion of [Pt6−xNix(CO)12]2− into [Pt12−xNix(CO)21]4− may be viewed as a condensation with partial elimination of CO in accord to eqn (2). In order to show that the metal composition is retained in the reaction (as demonstrated by MP-AES analyses), [Pt12−xNix(CO)21]4− is reported as [Pt12−2xNi2x(CO)21]4− in eqn (2).| 2[Pt6−xNix(CO)12]2− → [Pt12−2xNi2x(CO)21]4− + 3CO | (2) |
Homometallic [H4−nNi12(CO)21]n− (n = 2–4)41 and heterometallic [HPt9Ni3(CO)21]3− clusters45 have been previously described in the literature and structurally characterized. Moreover, Longoni and Bengtsson-Kloo reported that [Pt3Ni3(CO)12]2− spontaneously decomposes affording mixtures of [Pt6Ni6(CO)21]3− and [Pt7Ni5(CO)21]3−.46 Actually, [HPt9Ni3(CO)21]3− was obtained from the reaction of [Ni6(CO)12]2− with K2PtCl4 followed by CO treatment. Thus, the procedure herein described represents a more general synthesis of [Pt12−xNix(CO)21]4− (x = 2–10). Indeed, as reported in the previous section, the composition of [Pt6−xNix(CO)12]2− (x = 1–5) can be carefully controlled and, in turn, this leads to a good control of the composition of [Pt12−xNix(CO)21]4− (x = 2–10) after thermal treatment.
[Pt6−xNix(CO)12]2− (x = 1–5) clusters with different compositions have been prepared by mixing [Pt6(CO)12]2− and [Ni6(CO)12]2− in different stoichiometric ratios (see previous section), and transformed into [Pt12−xNix(CO)21]4− (x = 2–10) upon heating at reflux for 3 h. The Pt/Ni content found in the resulting [Pt12−xNix(CO)21]4− (x = 2–10) species has been determined by MP-AES and it results to be very close to that of the reagents (Table 2).
[Pt6(CO)12]2−![[thin space (1/6-em)]](https://www.rsc.org/images/entities/char_2009.gif) : :![[thin space (1/6-em)]](https://www.rsc.org/images/entities/char_2009.gif) [Ni6(CO)12]2− stoichiometry [Ni6(CO)12]2− stoichiometry |
Pt/Ni calculatedb | [Pt12−xNix(CO)21]4− | IR (CH3CN, 293 K) νCO in cm−1 | |
|---|---|---|---|---|
| Pt/Ni by MP-AES | x by MP-AES | |||
| a [NBu4]2[Pt6−xNix(CO)12] (x = 1–5) has been obtained by mixing [NBu4]2[Pt6(CO)12] and [NBu4]2[Ni6(CO)12] in variable stoichiometric ratios (column 1) as described in the literature19 and in the previous section. b Pt/Ni calculated based on the stoichiometry of the reagents. | ||||
1![[thin space (1/6-em)]](https://www.rsc.org/images/entities/char_2009.gif) : :![[thin space (1/6-em)]](https://www.rsc.org/images/entities/char_2009.gif) 5 5 |
0.20 | 0.21 | 9.92 | 1982(vs), 1787(s) |
1![[thin space (1/6-em)]](https://www.rsc.org/images/entities/char_2009.gif) : :![[thin space (1/6-em)]](https://www.rsc.org/images/entities/char_2009.gif) 2 2 |
0.50 | 0.55 | 7.74 | 1980(vs), 1788(s) |
1![[thin space (1/6-em)]](https://www.rsc.org/images/entities/char_2009.gif) : :![[thin space (1/6-em)]](https://www.rsc.org/images/entities/char_2009.gif) 1 1 |
1.00 | 1.10 | 5.71 | 1957(vs), 1788(s) |
2![[thin space (1/6-em)]](https://www.rsc.org/images/entities/char_2009.gif) : :![[thin space (1/6-em)]](https://www.rsc.org/images/entities/char_2009.gif) 1 1 |
2.00 | 2.32 | 3.61 | 1955(vs), 1794(s) |
5![[thin space (1/6-em)]](https://www.rsc.org/images/entities/char_2009.gif) : :![[thin space (1/6-em)]](https://www.rsc.org/images/entities/char_2009.gif) 1 1 |
5.00 | 5.44 | 1.86 | 1962(vs), 1778(s) |
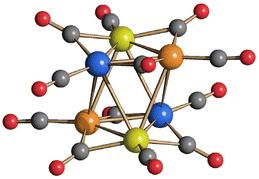
The structure of [Pt12−xNix(CO)21]4− (x = 2–10) has been determined on salts with different compositions (Fig. 4 and Table 3; Fig. S17–S19 in the ESI†), that is [NEt4]4[Pt12−xNix(CO)21] (x = 3.72), [NBu4]4[Pt12−xNix(CO)21]·2CH3COCH3 (x = 5.82), [NMe4]4[Pt12−xNix(CO)21]·2CH3CN (x = 6.25), [NEt4]4[Pt12−xNix(CO)21]·1.78CH3CN (x = 6.45). The crystals of [NMe4]4[Pt12−xNix(CO)21]·2CH3CN (x = 6.25) and [NEt4]4[Pt12−xNix(CO)21]·1.78CH3CN (x = 6.45) were of low quality and poorly diffracting. The resulting structures allowed to determine the overall geometry, composition and connectivity of the clusters. These compared very well with related homometallic and heterometallic carbonyl clusters. Their cif files were included as ESI,† but they were not deposited with CCDC.
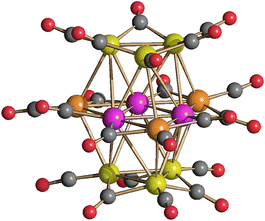 | ||
| Fig. 4 Molecular structure of [Pt12−xNix(CO)21]4− (x = 6.25) (purple, Pt; yellow, Ni ≈ 53–67% and Pt ≈ 33–47%; orange, Ni ≈ 85–87% and Pt ≈ 13–15%; red, O; grey, C). | ||
| x | 3.72 | 5.82 | 6.25 | 6.45 | 12a |
|---|---|---|---|---|---|
| a From ref. 42. b This refers to Ni–Ni contacts. | |||||
| MA–MA | 2.6535(10)–2.6740(9) | 2.6039(16)–2.6221(17) | 2.6109(17)–2.6235(16) | 2.466(6)–2.658(4) | 2.420–2.425 |
| Average 2.6620(17) | Average 2.611(3) | Average 2.617(3) | Average 2.567(13) | Average 2.422 | |
| MB–Pt | 2.6132(10)–2.6239(15) | 2.564(2)–2.5891(16) | 2.481(10)–2.669(14) | 2.558(5)–2.600(5) | 2.422–2.442b |
| Average 2.618(2) | Average 2.577(3) | Average 2.595(18) | Average 2.580(12) | Average 2.434 | |
| Pt–Pt | 2.8201(9)–2.8271(8) | 2.8097(13)–2.8246(11) | 2.8248(14)–2.8284(11) | 2.828(2)–2.844(3) | 2.671–2.681b |
| Average 2.8247(14) | Average 2.8196(19) | Average 2.827(2) | Average 2.836(4) | Average 2.674 | |
| MA–MB | 3.0072(13)–3.1292(11) | 2.9802(18)–3.074(2) | 2.963(14)–3.110(8) | 2.914(7)–3.021(5) | 2.723–2.756 |
| Average 3.079(2) | Average 3.010(3) | Average 3.033(18) | Average 2.968(15) | Average 2.744 | |
| MA–Pt | 3.0339(7)–3.1483(8) | 2.9447(12)–3.1387(13) | 2.9834(14)–3.0037(15) | 2.865(5)–3.127(5) | 2.746–2.797b |
| Average 3.098(2) | Average 3.001(3) | Average 2.992(2) | Average 3.005(17) | Average 2.780b | |
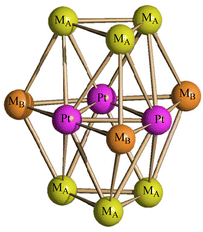
The molecular structure of these tetra-anions is very similar to those previously reported for [H4−nNi12(CO)21]− (n = 2–4) and [HPt9Ni3(CO)21]3−.41,45 It is composed of an ABA hexagonal close packed metal core based on two external M3(CO)3(μ-CO)3 triangular units and a central M6(CO)3(μ-CO)6 triangle of frequency two. The three positions of the inner triangle of the central hexametallic layer are occupied by three Pt atoms, as found in [HPt9Ni3(CO)21]3−. This is in keeping with the preference of Pt for the highest metal-connected sites (six Pt–M contacts). The three remaining sites of the central M6(CO)3(μ-CO)6 unit (four M–M contacts) and the six positions of the two external triangles (five M–M contacts) are disordered Pt/Ni. In general, there seems to be a greater preference for Ni to occupy the MB positions (internal M6 layer, Scheme 2), whereas the MA positions (external M3 layers) get richer in Ni as the total Ni content in the cluster increases (Table 4).
| M12 | A6 | B3 | |||
|---|---|---|---|---|---|
| Pt | Ni | Pt | Ni | Pt | Ni |
| 8.28 (0.690) | 3.72 (0.310) | 4.40 (0.733) | 1.60 (0.267) | 0.88 (0.293) | 2.12 (0.707) |
| 6.18 (0.515) | 5.82 (0.485) | 2.76 (0.460) | 3.24 (0.540) | 0.42 (0.140) | 2.58 (0.860) |
| 5.75 (0.479) | 6.25 (0.521) | 2.34 (0.390) | 3.66 (0.610) | 0.41 (0.137) | 2.59 (0.863) |
| 5.55 (0.462) | 6.45 (0.538) | 2.12 (0.353) | 3.88 (0.647) | 0.43 (0.143) | 2.57 (0.857) |
The Pt–Pt bonding contacts (Table 3) within the inner Pt3-triangle are almost identical independently of the Pt/Ni composition of [Pt12−xNix(CO)21]4− (x = 3.72, 5.82, 6.25, 6.45). In contrast, all other M–M contacts slightly decrease by increasing the Ni content, as expected on the basis of the smaller covalent radius of Ni (1.24 Å) compared to Pt (1.36 Å).47
The presence of Pt within [Pt12−xNix(CO)21]4− (x = 2–10) seems to stabilize the tetra-anion compared to more protonated species. Indeed, it has been previously reported that [HPt3Ni9(CO)21]3− is readily deprotonated affording [Pt3Ni9(CO)21]4−, whereas [H2Pt3Ni9(CO)21]2− rapidly decomposes already at room temperature.45 This should be contrasted to the behavior of the homometallic Ni congeners: both [HNi12(CO)21]3− and [H2Ni12(CO)21]2− are very stable in solution up to 60 °C, whereas their fully deprotonation to yield [Ni12(CO)21]4− is rather difficult.41,42 In the attempt to further proof this point, [Pt12−xNix(CO)21]4− (x = 2–10) has been reacted with increasing amounts of HBF4·Et2O. Even though there is some IR evidence of the formation of [HPt12−xNix(CO)21]3−, this rapidly decomposes and all the attempts to isolate it failed. For instance, protonation of [Pt12−xNix(CO)21]4− (x ≈ 8) resulted, after work-up of the reaction mixture (see Experimental), in crystals of [NMe4]5[HPt14+xNi24−x(CO)44]·3CH3COCH3 (x = 0.70) which contain the [HPt14+xNi24−x(CO)44]5− higher nuclearity penta-anion (Fig. 5). This compound displays a Pt/Ni ratio of 0.63 and, therefore, is richer of Pt than the starting material (Pt/Ni = 0.50). Indeed, some Ni(CO)4 is formed during the reaction with HBF4·Et2O.
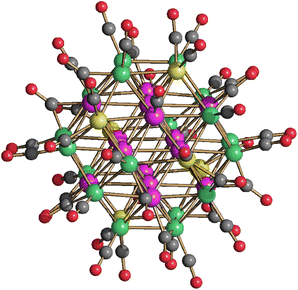 | ||
| Fig. 5 Molecular structure of [HPt14+xNi24−x(CO)44]5− (x = 0.70) (purple, Pt; green, Ni; yellow, Ni ≈ 88% and Pt ≈ 12%; red, O; grey, C). Bond distances (Å): Pt–Ptinner_octahedron 2.7307(8)–2.7463(9), average 2.7385(16); Ptinner_octahedron–Ptsurface 2.7343(8)–2.7519(7), average 2.742(2); Ptinner_octahedron–Msurface 2.5960(15); Ptinner_octahedron–Nisurface 2.6054(17)–2.6576(18), average 2.623(3); Ptsurface–Msurface 2.6826(14)–2.8970(15), average 2.790(2); Ptsurface–Nisurface 2.5332(17)–2.7428(16), average 2.645(6); Msurface–Nisurface 2.540(2)–2.778(2), average 2.704(4); Nisurface–Nisurface 2.632(2)–2.719(2), average 2.682(4). The hydrogen atom has not been located by SC-XRD. The presence of one H-atom has been based on analogy with previously reported related clusters, that is [H2Pt14Ni24(CO)44]4− and [HPt14Ni24(CO)44]5−.30,34 | ||
The molecular structure of [HPt14+xNi24−x(CO)44]5− (x = 0.70) closely resembles that of [H2Pt14Ni24(CO)44]4− and [HPt14Ni24(CO)44]5−.30,34 Because of this resemblance and due to the −5 charge, it has been formulated as a monohydride. See the Introduction for a brief discussion on how to assign the number of hydrides to large metal carbonyl clusters. Further details can be found in the literature.26,28,29,31,39,43,44,49,51
The structure of [HPt14+xNi24−x(CO)44]5− (x = 0.70) consists of a truncated-ν3-octahedron (truncated octahedron of frequency three) as also found in the metal core of [Pt38(CO)44]2−.48 The ccp M44 metal lattice contains one interstitial M6 octahedron, eight centred M7 hexagonal faces and six square M4 faces. The six positions of the fully interstitial octahedron and the eight centres of the eight hexagonal faces are occupied by 14 Pt atoms. The remaining 24 positions corresponding to the corner sites of the truncated-ν3-octahedron and grouped into six square faces are fully occupied by 24 Ni atoms in [H2Pt14Ni24(CO)44]4−. Conversely, in the case of [HPt14+xNi24−x(CO)44]5− (x = 0.70), only 18 of these positions (three per each square face) are fully occupied by Ni atoms, whereas the remaining six positions (one per square face) are disordered Pt/Ni. Thus, [H2Pt14Ni24(CO)44]4− displays a perfectly ordered structure with complete segregation of Ni and Pt, whereas [HPt14+xNi24−x(CO)44]5− (x = 0.70) displays some compositional and substitutional disorder, even if rather limited. The fractionary indices in its formula indicate that it is actually a mixture of [HPt14Ni24(CO)44]5− (ca. 30%) and [HPt15Ni23(CO)44]5− (ca. 70%) (compositional disorder). Substitutional disorder is evidenced by the fact that the additional Pt atoms is disordered over six different positions. [HPt14+xNi24−x(CO)44]5− (x = 0.70) possesses 26 terminal and 18 edge bridging CO ligands as found in [H2Pt14Ni24(CO)44]4−.
Synthesis and molecular structure of [Pt19−xNix(CO)22]4− (x = 2–6)
[Pt19−xNix(CO)22]4− (x = 2–6) can be obtained by heating [Pt9−xNix(CO)18]2− (x = 1–3) in CH3CN at 80 °C, or by heating [Pt6−xNix(CO)12]2− (x = 2–4) in DMSO at 130 °C (Scheme 1). The resulting [Pt19−xNix(CO)22]4− (x = 2–6) is always richer of Pt than the starting material, in agreement with the fact that some Ni is lost as Ni(CO)4, as evidenced by IR spectroscopy.The molecular structure of [Pt19−xNix(CO)22]4− (x = 2–6) has been determined on the three salts [NEt4]4[Pt19−xNix(CO)22]·2CH3COCH3 (x = 2.23), [NBu4]4[Pt19−xNix(CO)22]·2CH3CN (x = 3.11), [NBu4]4[Pt19−xNix(CO)22]·2CH3CN (x = 5.26), which display different Pt/Ni compositions (Fig. 6 and Fig. S20, S21 in the ESI;†Table 5). The crystals of [NBu4]4[Pt19−xNix(CO)22]·2CH3CN (x = 5.26) were of low quality and poorly diffracting. The resulting structure allowed to determine the overall geometry, composition and connectivity of the cluster. These compared very well with related M19 carbonyl clusters. Its cif file was included as ESI,† but not deposited with CCDC.
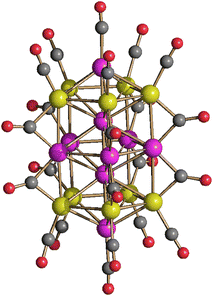 | ||
| Fig. 6 Molecular structure of [Pt19−xNix(CO)22]4− (x = 5.26) (purple, Pt; yellow, Ni ≈ 47–58% and Pt ≈ 42–53%; red, O; grey, C). | ||
| x | 5.26 | 3.11 | 2.23 | 0a |
|---|---|---|---|---|
| a From ref. 38. | ||||
| MA–MA | 2.766(4)–2.802(5) | 2.804(4)–2.818(3) | 2.7940(17)–2.8363(17) | 2.828(4)–2.919(4) |
| Average 2.776(9) | Average 2.815(7) | Average 2.818(4) | Average 2.87(3) | |
| PtA–PtA | 2.860(3)–2.868(4) | 2.855(5)–2.863(4) | 2.8288(12)–2.8631(11) | 2.877(4)–2.961(4) |
| Average 2.864(7) | Average 2.860(9) | Average 2.851(3) | Average 2.90(3) | |
| MA–PtA | 2.647(2)–2.676(3) | 2.658(3)–2.683(4) | 2.6441(18)–2.6925(17) | 2.689(5)–2.745(5) |
| Average 2.656(5) | Average 2.665(8) | Average 2.673(4) | Average 2.72(2) | |
| PtA–PtB | 2.764(2)–2.7702(19) | 2.760(3)–2.768(2) | 2.7285(14)–2.7913(12) | 2.714(4)–2.891(4) |
| Average 2.766(4) | Average 2.764(6) | Average 2.744(3) | Average 2.80(6) | |
| MA–PtB | 2.706(2)–2.726(3) | 2.743(3)–2.753(3) | 2.7267(16)–2.7743(14) | 2.694(4)–2.933(4) |
| Average 2.717(6) | Average 2.749(7) | Average 2.740(3) | Average 2.81(9) | |
| MA–PtC | 2.689(4)–2.699(2) | 2.714(5)–2.724(3) | 2.7009(15)–2.7414(14) | 2.708(4)–2.814(4) |
| Average 2.697(7) | Average 2.720(7) | Average 2.721(3) | Average 2.75(3) | |
| PtB–PtB | 2.624(3) | 2.623(4) | 2.6225(18) | 2.641(5) |
| PtB–PtC | 2.646(2) | 2.648(3) | 2.6353(13) | 2.675(5)–2.686(5) |
| Average 2.680(7) | ||||
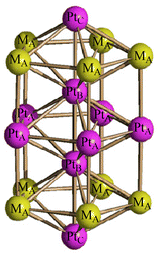
As in the case of the homometallic [Pt19(CO)22]4−, the M19 metal cage of these clusters display an idealized D5h symmetry, being composed of three eclipsed M5 pentagonal layers with two additional M atoms in between these pentagons and two further M atoms capping the external pentagonal faces. Alternatively, the M19 metal cage may be described as composed of two centred pentagonal prisms and two pentagonal pyramids sharing three pentagonal faces. The resulting polyhedron displays 10 rectangular faces and 10 triangular faces. The five positions of the central pentagon, the two fully interstitial positions and the two apexes of the two pentagonal pyramids are fully occupied by 9 Pt atoms (PtA, PtB and PtC, respectively, in Scheme 3). The 10 positions corresponding to the two external pentagons are disordered Pt/Ni (MA in Scheme 3). The stereochemistry of the CO ligands is the same in all [Pt19−xNix(CO)22]4− (x = 2–6) clusters as well as [Pt19(CO)22]4−. Thus, there are 10 μ-CO ligands bridging the PtA–MA edges of the two pentagonal prisms, and 12 terminal carbonyls, one per each MA atom of the two external pentagons and the two PtC vertexes of the external pentagonal pyramids. As expected, platinum fully occupies the two interstitial positions (10 M–M contacts, no CO), the inner pentagon (6 M–M contacts, 2 μ-CO) and the two apexes of the pentagonal pyramids (5 M–M contacts, 1 terminal CO), whereas the 10 positions within the external pentagons (5 M–M contacts, 1 terminal and 1 μ-CO) are disordered Pt/Ni. Regarding the two apexes of the two pentagonal pyramids it is likely that Ni is too small in order to cap a pentagonal M5 face and, thus, also these positions are occupied by Pt. Indeed, Ni(CO) fragments are often found capping triangular faces in several clusters.49–51
The M–M bonding contacts of [Pt19−xNix(CO)22]4− (x = 2.23, 3.11, 5.26) can be divided into eight groups, as depicted in Table 5 (see Scheme 3 for labeling). The general trends observed among the different groups are similar to those reported for the homometallic cluster [Pt19(CO)22]4−,38 that is, PtB–PtB ∼ PtB–PtC < MA–PtA ∼ MA–PtC < PtA–PtB ∼ MA–PtB < MA–MA ∼ PtA–PtA. As also observed in the case of [Pt6−xNix(CO)12]2− (ref. 19) and [Pt12−xNix(CO)21]4−, within each group the M–M distances are shortened by increasing the Ni content.
Electrochemistry, infrared spectroelectrochemistry, and electrochemical impedance spectroscopy of [Pt19−xNix(CO)22]4− (x = 3.11)
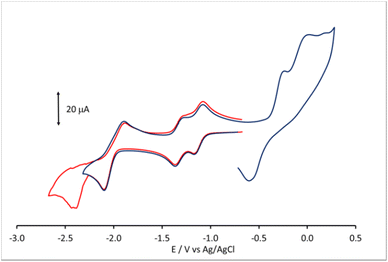
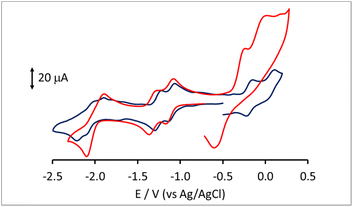
Lower nuclearity [Pt6−xNix(CO)12]2− (x = 1–5) and [Pt12−xNix(CO)21]4− (x = 2–10) clusters display only irreversible redox processes. The electrochemistry of [HPt14Ni24(CO)44]5−, closely related to [HPt14+xNi24−x(CO)44]5− (x = 0.69) was previously reported.30,34 Thus, this work has been focused on the new heterometallic [Pt19−xNix(CO)22]4− (x = 3.23) cluster, since it is known that the related homometallic [Pt19(CO)22]4− cluster displays several reversible electrochemical processes.52 Indeed, the comparison of the electrochemical behavior of [Pt19−xNix(CO)22]4− (x = 3.11) and [Pt19(CO)22]4− offers the possibility to study the effect of the substitution of 3–4 Pt atoms with 3–4 Ni atoms within the same cluster structure.The cyclic voltammetry (CV) of [Pt19−xNix(CO)22]4− (x = 3.11) at a glassy carbon (GC) electrode is shown in Fig. 7. In spite of the structural similarity, the electrochemical behaviour of the mixed Pt/Ni cluster shows some differences with respect to that of the homometallic [Pt19(CO)22]4− species. The CV profiles of [Pt19−xNix(CO)22]4− (x = 3.11) and [Pt19(CO)22]4− in CH3CN at a GC electrode are compared in Fig. 8, and the redox potentials of the observed electron transfer processes are compiled in Table 6. The most evident difference concerns the anodic region: only irreversible processes are observable for the mixed cluster, while the homometallic one in voltammetric experiments exhibits 4 reversible oxidation steps.52
| Compound | Oxidation processes | Reduction processes | ||||||
|---|---|---|---|---|---|---|---|---|
| a Peak potential value for irreversible processes. b Two-electrons process, as inferred from cyclic voltammetry. | ||||||||
| [Pt19(CO)22]4− | +0.52a | +0.44a | +0.05 (100) | −0.19 (78) | −1.11 (80) | −1.26 (80) | −1.98 (210) | −2.12 (200) |
| [Pt19−xNix(CO)22]4− (x = 3.23) | −0.03a | −0.26a | −1.13 (70) | −1.33 (70) | −2.04b (200) | −2.43a,b | ||
In the cathodic region, the heterometallic cluster shows a pair of one-electron reversible reductions at potentials only slightly lower than those of the homometallic one, while, at lower potentials, the second pair of reversible closely spaced reductions of [Pt19(CO)22]4− appears as a single peak for [Pt19−xNix(CO)22]4− (x = 3.11), with a current double compared to that of the first two reductions, and is followed by a further irreversible reduction at −2.43 V.
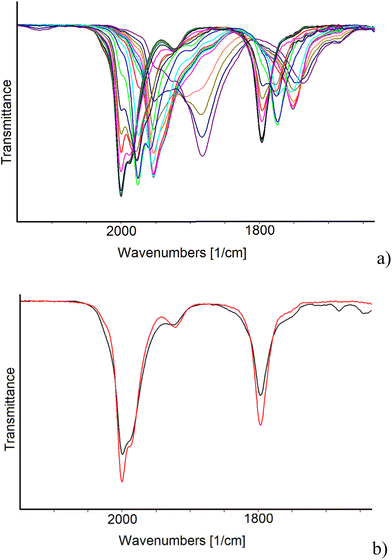
IR SEC experiments in an OTTLE cell confirmed that the oxidation of [Pt19−xNix(CO)22]4− (x = 3.11) (νCO = 2000 and 1797 cm−1) is complicated by fast decomposition reactions. Instead, the cluster can be reduced in two consecutive one-electron steps to [Pt19−xNix(CO)22]5− (νCO = 1976 and 1774 cm−1) and [Pt19−xNix(CO)22]6− (νCO = 1953 and 1751 cm−1), both stable in the time scale of the IR SEC. The IR spectrum of the initial cluster was quantitatively obtained in the reverse oxidative back-scan, confirming the reversibility of these two reduction steps. A further decrease of the potential, after the formation of [Pt19−xNix(CO)22]6−, caused a large shift of the terminal νCO stretching frequencies down to 1882 cm−1 (Fig. 9a) and band broadening. It is likely that the latter spectrum can be attributed to a more reduced form of the cluster with a limited stability in the time scale of the IR SEC experiment, since at the end of the reverse oxidation back-scan, the νCO bands at 2000 and 1797 cm−1 of starting [Pt19−xNix(CO)22]4− were restored, although not quantitatively (Fig. 9b). Moreover, the observed 71 cm−1 shift of the terminal νCO of the new species (νCO = 1882 cm−1) respect to [Pt19−xNix(CO)22]6− (νCO = 1953 and 1751 cm−1), suggests that 3 electrons are consecutively added without being possible to accumulate to a great extent the intermediate species.31
The spectroelectrochemistry of [Pt19(CO)22]4− was investigated by Zanello52 who reported the IR spectra of oxidized [Pt19(CO)22]3− and reduced [Pt19(CO)22]5−. We verified that, in the time scale of IR SEC experiment, only one electron can be reversibly removed from [Pt19(CO)22]4− (Fig. S22 in the ESI†) and further oxidation results in subsequent chemical reactions as already found for the chemical oxidation with large excess of acid, via the H+/H2 redox couple.36,48
The sequence of IR spectra recorded in an OTTLE cell during the progressive decrease of the working electrode potential from −0.7 to −2.5 V (vs. Ag pseudo reference electrode) of a solution of [Pt19(CO)22]4− have been recorded (Fig. S23a in the ESI†). Their profiles are very similar to those obtained for [Pt19−xNix(CO)22]4− (x = 3.11), and likewise the first two reductions were found to be completely reversible in the time scale of the IR SEC experiment. Concerning the behaviour at lower potentials, a greater stability of the homometallic more reduced species can be inferred by the fact that the IR spectrum of the starting cluster was almost quantitatively re-obtained when the working electrode potential was returned to the initial value (Fig. S23b in the ESI†). Moreover, during the shift of the νtCO from 1959 to 1885 cm−1, one low intensity band at intermediate frequencies (about 1932 cm−1) was observable and was tentatively attributed to a cluster charge −7, based on the measured νtCO shift of 23 cm−1.
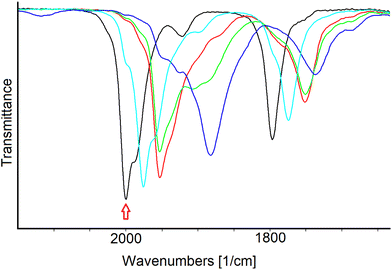
A more careful analysis of the IR spectra of Fig. 9a allowed to highlight the presence of a very low intensity band at 1908 cm−1 that could indicate the presence of very small amounts of an intermediate redox state of the cluster even in the case of the heterometallic one. Selected IR spectra of [Pt19−xNix(CO)22]n− (x = 3.11) are shown in Fig. 10; the turquoise and the red traces can be confidently attributed to the cluster charge −5 and −6, respectively, the green spectrum indicates a mixture of several states where a weak band at 1908 cm−1 could be attributed to the species with charge −8, while we tentatively attributed the light blue spectrum to one species with charge −9.
Table 7 reports the CO stretching frequencies in solution associated with the cluster charge for both [Pt19−xNix(CO)22]n− (x = 3.11) and [Pt19(CO)22]n−.
| Cluster charge n | ν tCO | ν bCO |
|---|---|---|
| −3 | (2027) | (1818) |
| −4 | 2000 (2005) | 1797 (1798) |
| −5 | 1976 (1981) | 1774 (1777) |
| −6 | 1953 (1959) | 1751 (1755) |
| −7 | (1932) | (1744, 1690) |
| −8 | 1908 | 1730, 1688, broad |
| −9 | 1882 (1885) | 1737, 1688, broad (1744, 1690) |
The results of the IR SEC experiments do not agree perfectly with the CV profile of Fig. 7, the most relevant difference being the well defined and reversible two electron reduction peak in the CV that would predict the quantitative formation of [Pt19−xNix(CO)22]8− (x = 3.11), before the irreversible further 2e− reduction. A similar trend is observed for the cathodic processes of [Pt19(CO)22]4− (x = 3.11): also in this case, in the IR SEC experiment, compared to CV, some charge states of the cluster are almost missing. We believe that a possible explanation for these differences is the different working electrodes employed in the two experiments, that is GC for CV and Pt for IR SEC.
In many cases, we observed that the voltammetric profiles of clusters are ill defined at Pt electrodes, while more resolved peaks are instead obtained at GC.31,53 In Fig. S24 in the ESI,† the CV responses of [Pt19−xNix(CO)22]4− (x = 3.11) at the two electrodes are compared. At Pt electrode, the first two reduction peaks are less intense, less resolved and followed by a continuous current increase which would seem to match with the simultaneous presence in solution of different charged clusters, as deduced by IR SEC experiments, before the attainment of a more reduced, relatively stable, species.
The redox peaks were also investigated by means of electrochemical impedance spectroscopy (EIS). Fig. 11 shows the Nyquist and Bode plots of the peaks at −2.04, −1.33, and −1.13 V using the GC working electrode (WE). Each measurement was performed at the E° of the redox process, which was calculated as the average of the potential of the reduction and oxidation peak obtained from CV (Fig. 7). For Pt WE, only the redox process at −1.13 V was evaluated, as the processes at lower potential were not visible in CV. Observing the inset in Fig. 11A we can infer that moving towards lower potential (i.e. higher negative charges on the cluster) there is a decrease of the kinetic of the reduction mechanism. The impedance spectra were fitted using the Randles circuit (Fig. 11B) in order to estimate the charge transfer resistance, that can be related to the kinetic of the charge transfer by the following equation:54
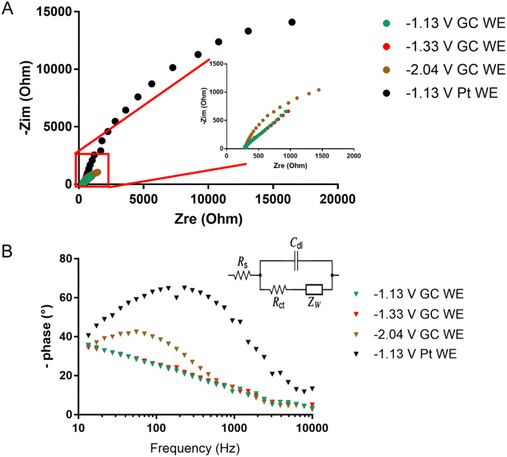 | ||
| Fig. 11 (A) Nyquist plot and (B) Bode plot obtained for the redox processes of [Pt19−xNix(CO)22]4− (x = 3.11) at −1.13, −1.33, and −2.04 V for both GC and Pt WE. | ||
The values of Rct obtained through the fitting support the slower charge transfer kinetic for higher negatively charged clusters. This is also visible in the Bode plot of Fig. 11B, where the phase shift due to the electron transfer is barely visible for the electron transfer at −1.13 and −1.33 V and well defined in the peak at −2.04 V. It should be noted that when Pt is used as WE the reaction kinetic is slowed even at −1.13 V (Fig. 11) with a 10 time-fold charge transfer resistance obtained through fitting (i.e. 10 time-fold lower heterogeneous rate constant). This suggests a major involvement of the nature of the electrode in the redox process of the cluster.
Computational investigations
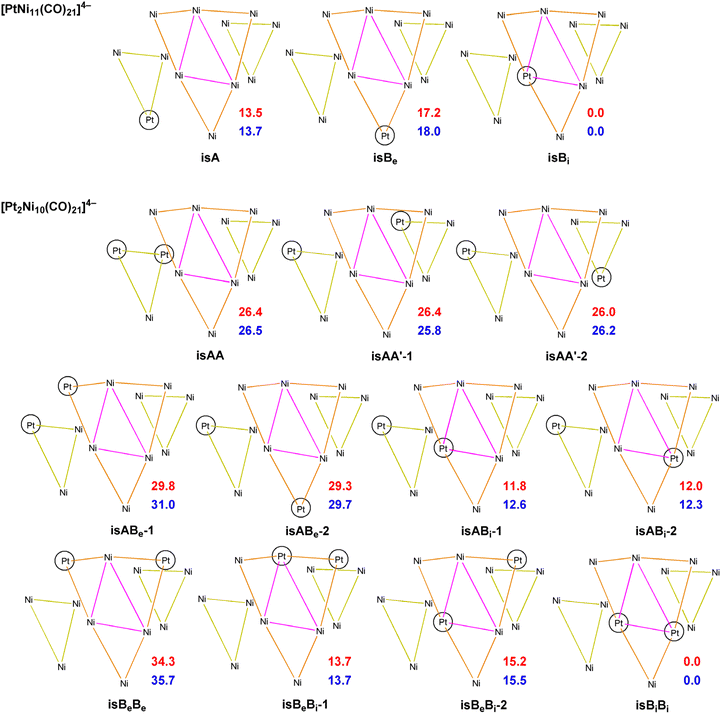
Computational studies of [Pt6−xNix(CO)12]2− (x = 0–6) hexanuclear clusters have been previously reported.19 These indicated that the six positions of their {M6} core can be randomly occupied by Pt and Ni. This is in keeping with the equivalence of the six metal positions of an octahedral metal cage. Thus, it was of interest to computationally investigate heterometallic Pt–Ni carbonyl clusters displaying not equivalent metal sites on their metal cages.The preference of Pt and Ni for the different positions in the {M12} core of [Pt12−xNix(CO)21]4− clusters was computationally investigated, considering different possible isomers of [PtNi11(CO)21]4− and [Pt2Ni10(CO)21]4− (Scheme 4). The relative energy values (both Gibbs energy G and electronic energy + nuclear repulsion E) are reported in Scheme 4. The most stable position of Pt atom in [PtNi11(CO)21]4− is in the inner triangle of the central hexametallic layer (isBi in Scheme 4), in agreement with the experimental outcomes. The other two possible isomers are meaningfully less stable by about 13–14 kcal mol−1 (trimetallic layer, isA) and 17–18 kcal mol−1 (external triangle of the hexametallic layer, isBe).
The stability trend for the Pt atoms Bi ≫ A > Be was confirmed by the relative energy values of the isomers of [Pt2Ni10(CO)21]4−. The most stable species has in fact both Pt atoms in the inner triangle of the hexametallic layer (isBiBi in Scheme 4). Formally shifting one Pt atom to the trimetallic layer causes an energy rise by about 12 kcal mol−1 (see isABi-1 and isABi-2 in Scheme 4), while the shift to the external triangle of the hexametallic layer rises the energy by about 14–15 kcal mol−1 with respect to isBiBi (see isBeBi-1 and isBeBi-2 in Scheme 4). Considering the isomers without inner Pt atoms, those with both Pt atoms in the external triangles are the most stable (isAA, isAA’-1 and isAA’-2 in Scheme 4), even if their energies are about 26 kcal mol−1 higher than that of isBiBi. As expected from the trends previously described, the shift of one Pt atom to the external triangle of the hexametallic layer causes an energy rise (isABe-1 and isABe-2 in Scheme 4, relative energies around 29–31 kcal mol−1). Finally, isBeBe is the least stable species, having E and G values relative to isBeBe of 34.3 and 35.7 and kcal mol−1, respectively.
It is worth noting that isomers with the same compositions of the layers have in all cases roughly comparable energy. Such a result suggests that the intralayer M–M interactions have greater influence with respect to the interlayer ones on the stabilization of [Pt12−xNix(CO)21]4− clusters.
The AIM analysis55–57 on the most stable isomer of [PtNi11(CO)21]4− (Table 9) allowed to localize eight Pt–Ni (3,−1) b.c.p.'s. The data summarized in Table 9, the density (ρ) and the potential energy density (V) in particular, revealed that the Pt–Ni bonds in the hexametallic layer are stronger than the interlayer ones. In particular, the highest ρ values and lowest V values correspond to the bonds of Pt with Ni atoms in the external triangle of the hexametallic layer. This outcome supports the experimentally observed preference of Pt atom for the inner triangle of the hexametallic layer.
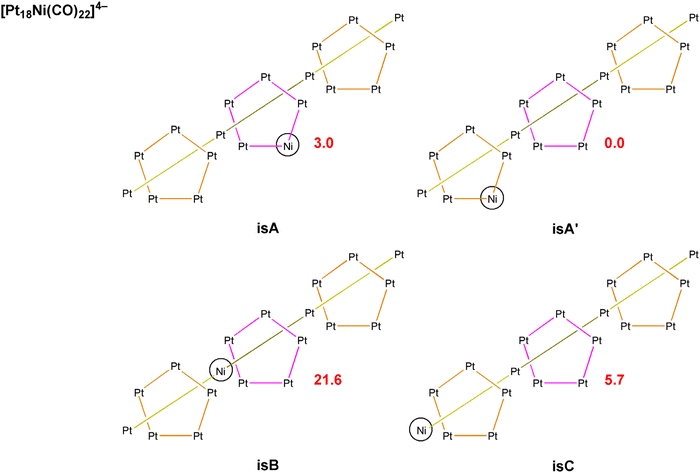
The computational investigation was extended to [Pt19−xNix(CO)22]4− cluster, focusing the attention on [Pt18Ni(CO)22]4−. Four isomers are possible, corresponding to the localization of the Ni atom in the central pentagonal layer (isA), in one of the other two external pentagonal layers (isA′), in one of the two fully interstitial positions (isB) or in one of the two apexes of the two pentagonal pyramids (isC). The four isomers of [Pt18Ni(CO)22]4− are sketched in Scheme 5 with the relative energy values. The stability of the cluster depends upon the position of the Ni atom accordingly to the trend A′ > A > C ≫ B. The computational result is in line with the X-ray data, that showed Pt/Ni disorder only for the A′ positions of [Pt19−xNix(CO)22]4−. It is worth noting the huge energy rise (21.6 kcal mol−1 with respect to the most stable isomer) when Ni occupies one of the fully interstitial positions, i.e. that corresponding to the highest number of M–M contacts.
Conclusions
Heterometallic Pt–Ni carbonyl molecular nanoclusters of increasing sizes have been synthesized and structurally characterized by SC-XRD, that is, [Pt6−xNix(CO)12]2− (x = 1–5), [Pt12−xNix(CO)21]4− (x = 2–10), [Pt19−xNix(CO)22]4− (x = 2–6) and [HPt14+xNi24−x(CO)44]5− (x ≈ 0.7). This offered the possibility to investigate the Pt–Ni distribution within M6, M12, M19 and M38 cages. As previously reported,19 [Pt6−xNix(CO)12]2− (x = 1–5) can be viewed as perfect random alloy clusters, in view of the equivalence of the six metal sites within their octahedral M6 cages. Conversely, when the metal sites are not equivalent, as in the cases of [Pt12−xNix(CO)21]4− (x = 2–10), [Pt19−xNix(CO)22]4− (x = 2–6) and [HPt14+xNi24−x(CO)44]5− (x ≈ 0.7), Pt usually displays a preference for sites with high M–M and low M–CO connectivities, whereas the opposite trend is observed for Ni. This results in partial confinement and separation of the two metals, even though some positional disorder is often present, usually involving sites with intermediate M–M and M–CO connectivities. This experimental crystallographic investigation has been supported by DFT calculations.The cluster [Pt19−xNix(CO)22]4− (x = 3.11) was electrochemically characterized by CV, IR SEC and EIS. The comparison with the isostructural homometallic [Pt19(CO)22]4− pointed out a very similar IR SEC reduction pattern: the difference in the cathodic region of the voltammetric profiles of the two clusters completely disappears in the time scale of the IR SEC experiment, and indistinguishable sequences of IR spectra were obtained during the reduction steps. In particular, two monoelectronic, completely reversible, redox changes and a further multielectronic process, with a good, even if not complete reversibility, indicated the multivalent nature for both the clusters. The presence of three Ni atoms affected instead at a great extent the stability of the mono-oxidized cluster [Pt19−xNix(CO)22]3− (x = 3.11) with respect to the homometallic one. This difference, already evident in CV, was confirmed by IR SEC and the only reversible anodic step was no longer observable for the mixed cluster.
The electrochemical behavior of [Pt19−xNix(CO)22]4− (x = 3.11) confirmed what was already observed for large metal carbonyl nanoclusters: (a) the different performance of WE materials, that is, the dependence of the electron transfer rate constant on the electrode material that was confirmed by CV and EIS measure at Pt and GC WEs; (b) the decrease of the electron transfer rate constant on increasing the number of added electrons to the starting clusters; (c) the instability of several reduced species with respect to disproportionation reactions which prevent the accumulation in sequence of each charged species as the potentialdecreases.52 For both homometallic [Pt19(CO)22]4− and heterometallic [Pt19−xNix(CO)22]4− this aspect is particularly evident because a large shift of νCO seems to suggest two missing redox states of the clusters in the IR SEC experiments, before the accumulation of a relatively long-lived multi-reduced species to which we tentatively assigned a −9 charge.
Overall, this study shows that a great insight into the nature of atomically precise alloy nanoclusters can be obtained using a molecular approach, based on X-ray crystallography and electrochemical methods such as CV, IR SEC and EIS.
Experimental
General procedures
All reactions and sample manipulations were carried out using standard Schlenk techniques under nitrogen and in dried solvents. All the reagents were commercial products (Aldrich) of the highest purity available and used as received, except [NR4]2[Pt3n(CO)6n] (n = 2–4), [NR4]2[Ni3n(CO)6n] (n = 2, 3) and [NR4]2[H2Ni12(CO)21] (R = Me, Et, Bu) which have been prepared according to the literature.40–42 Analyses of C, H and N were obtained with a ThermoQuestFlashEA 1112NC instrument. Analysis of Ni and Pt were performed by microwave plasma-atomic emission spectrometry on a Agilent 4210 MP-AES instrument. IR spectra were recorded on a PerkinElmer SpectrumOne interferometer in CaF2 cells. Structure drawings have been performed with SCHAKAL99.58WARNING: CO and Ni(CO)4 may be generated during manipulation of these compounds. All the operations must be carried out under a well-ventilated fume hood.
Electrochemical, spectroelectrochemical, and electrochemical impedance spectroscopy measurements
Materials and apparatuses for electrochemistry and IR SEC have been described elsewhere.31 EIS spectra were recorded using as Edc the E°′ of a reversible electrochemical reaction obtained from the voltammetric experiments. Eac was set to 0.005 V and frequency was scanned between 10![[thin space (1/6-em)]](https://www.rsc.org/images/entities/char_2009.gif) 000 and 1 Hz. All the electrochemical experiments were performed using a Palmsens 4 potentiostat (Palmsens, The Netherlands).
000 and 1 Hz. All the electrochemical experiments were performed using a Palmsens 4 potentiostat (Palmsens, The Netherlands).
MP-AES analyses
For a typical analysis, 4–5 mg of the sample, accurately weighted with an analytical balance (±0.0001 g), were transferred in a 100 mL volumetric flask and completely dissolved with a few drops of aqua regia (HCl![[thin space (1/6-em)]](https://www.rsc.org/images/entities/char_2009.gif) :
:![[thin space (1/6-em)]](https://www.rsc.org/images/entities/char_2009.gif) HNO3 3
HNO3 3![[thin space (1/6-em)]](https://www.rsc.org/images/entities/char_2009.gif) :
:![[thin space (1/6-em)]](https://www.rsc.org/images/entities/char_2009.gif) 1 v/v). Then, distilled H2O was added up to a total volume of 100 mL. The resulting sample was directly used for MP-AES analyses.
1 v/v). Then, distilled H2O was added up to a total volume of 100 mL. The resulting sample was directly used for MP-AES analyses.
Synthesis of [NBu4]4[Pt6−xNix(CO)12] (x = 4.20)
A solution of [NBu4]2[H2Ni12(CO)21] (0.650 g, 0.365 mmol) in THF (20 mL) was added dropwise to a solution of [NBu4]2[Pt6(CO)12] (0.726 g, 0.365 mmol) in THF (20 mL). The mixture was stirred for 2 h at room temperature and, then, the solvent was removed under reduced pressure. The residue was washed with H2O (2 × 15 mL) and toluene (2 × 15 mL), and extracted with THF (30 mL). Crystals of [NBu4]2[Pt6−xNix(CO)12] (x = 4.20) suitable for SC-XRD were obtained by slow diffusion of n-hexane (60 mL) on the THF solution (yield 0.78 g, 45% based on Pt, 53% based on Ni).C44H72N2Ni4.20O12Pt1.80 (1418.78): calcd C 37.25, H 5.12, N 1.97; found: C 37.08, H 4.94, N 2.15. IR (THF, 293 K) νCO: 1992(vs), 1815(m), 1794(s) cm−1.
Synthesis and MP-AES analysis of [NBu4]2[Pt9−xNix(CO)18] (x = 1.65)
A solution of [NBu4]2[Ni6(CO)12] (0.600 g, 0.512 mmol) in THF (30 mL) was added dropwise to a solution of [NBu4]2[Pt12(CO)24] (1.79 g, 0.512 mmol) in THF (20 mL). The mixture was stirred for 2 h at room temperature and, then, the solvent was removed under reduced pressure. The residue was washed with H2O (2 × 15 mL), toluene (2 × 15 mL), and extracted with acetone (30 mL). The solvent was removed under reduced pressure and the residue analyzed by MP-AES.MP-AES: calcd Pt/Ni 2.00; found: 4.47. IR (THF, 293 K) νCO: 2029(vs), 2005(s), 1844(s), 1810(m) cm−1.
MP-AES study of the thermal decomposition of [NBu4]2[Pt6−xNix(CO)12]
A solution containing a variable amount of [NBu4]2[Ni6(CO)12] (mNi6(CO)12, see list below) in THF (20 mL) was added dropwise to a solution of [NBu4]2[Pt6(CO)12] (0.410 g, 0.206 mmol) in THF (20 mL). The mixture was stirred for 2 h at room temperature and, then, the solvent was removed under reduced pressure. The residue of [Pt6−xNix(CO)12]2− was dissolved in CH3CN (20 mL) and heated at refluxing temperature for 3 h. At this stage, IR spectroscopy revealed the presence in solution of [Pt12−xNix(CO)21]4−. The solvent was removed under reduced pressure and the residue was washed with H2O (2 × 15 mL) and toluene (2 × 15 mL), and extracted with CH3CN (40 mL). The resulting solution was analyzed by means of MP-AES in order to determine the Pt/Ni content and compare it with the starting reagents.
m
Ni
6
(CO)
12
= 1.21 g (1.03 mol; Pt6![[thin space (1/6-em)]](https://www.rsc.org/images/entities/char_2009.gif) :
:![[thin space (1/6-em)]](https://www.rsc.org/images/entities/i_char_2009.gif) Ni6 = 1
Ni6 = 1![[thin space (1/6-em)]](https://www.rsc.org/images/entities/i_char_2009.gif) :
:![[thin space (1/6-em)]](https://www.rsc.org/images/entities/i_char_2009.gif) 5). MP-AES: calcd Pt/Ni 0.20; found: 0.21. IR (CH3CN, 293 K) νCO: 1982(vs), 1787(s) cm−1.
5). MP-AES: calcd Pt/Ni 0.20; found: 0.21. IR (CH3CN, 293 K) νCO: 1982(vs), 1787(s) cm−1.
m
Ni
6
(CO)
12
= 0.483 g (0.412 mol; Pt6![[thin space (1/6-em)]](https://www.rsc.org/images/entities/i_char_2009.gif) :
:![[thin space (1/6-em)]](https://www.rsc.org/images/entities/i_char_2009.gif) Ni6 = 1
Ni6 = 1![[thin space (1/6-em)]](https://www.rsc.org/images/entities/i_char_2009.gif) :
:![[thin space (1/6-em)]](https://www.rsc.org/images/entities/i_char_2009.gif) 2). MP-AES: calcd Pt/Ni 0.50; found: 0.55. IR (CH3CN, 293 K) νCO: 1980(vs), 1788(s) cm−1.
2). MP-AES: calcd Pt/Ni 0.50; found: 0.55. IR (CH3CN, 293 K) νCO: 1980(vs), 1788(s) cm−1.
m
Ni
6
(CO)
12
= 0.241 g (0.206 mol; Pt6![[thin space (1/6-em)]](https://www.rsc.org/images/entities/i_char_2009.gif) :
:![[thin space (1/6-em)]](https://www.rsc.org/images/entities/i_char_2009.gif) Ni6 = 1
Ni6 = 1![[thin space (1/6-em)]](https://www.rsc.org/images/entities/i_char_2009.gif) :
:![[thin space (1/6-em)]](https://www.rsc.org/images/entities/i_char_2009.gif) 1). MP-AES: calcd Pt/Ni 1.00; found: 1.10. IR (CH3CN, 293 K) νCO: 1957(vs), 1788(s) cm−1.
1). MP-AES: calcd Pt/Ni 1.00; found: 1.10. IR (CH3CN, 293 K) νCO: 1957(vs), 1788(s) cm−1.
m
Ni
6
(CO)
12
= 0.121 g (0.103 mol; Pt6![[thin space (1/6-em)]](https://www.rsc.org/images/entities/i_char_2009.gif) :
:![[thin space (1/6-em)]](https://www.rsc.org/images/entities/i_char_2009.gif) Ni6 = 2
Ni6 = 2![[thin space (1/6-em)]](https://www.rsc.org/images/entities/i_char_2009.gif) :
:![[thin space (1/6-em)]](https://www.rsc.org/images/entities/i_char_2009.gif) 1). MP-AES: calcd Pt/Ni 2.00; found: 2.32. IR (CH3CN, 293 K) νCO: 1955(vs), 1794(s) cm−1.
1). MP-AES: calcd Pt/Ni 2.00; found: 2.32. IR (CH3CN, 293 K) νCO: 1955(vs), 1794(s) cm−1.
m
Ni
6
(CO)
12
= 0.0483 g (0.0412 mol; Pt6![[thin space (1/6-em)]](https://www.rsc.org/images/entities/i_char_2009.gif) :
:![[thin space (1/6-em)]](https://www.rsc.org/images/entities/i_char_2009.gif) Ni6 = 5
Ni6 = 5![[thin space (1/6-em)]](https://www.rsc.org/images/entities/i_char_2009.gif) :
:![[thin space (1/6-em)]](https://www.rsc.org/images/entities/i_char_2009.gif) 1). MP-AES: calcd Pt/Ni 5.00; found: 5.44. IR (CH3CN, 293 K) νCO: 1962(vs), 1778(s) cm−1.
1). MP-AES: calcd Pt/Ni 5.00; found: 5.44. IR (CH3CN, 293 K) νCO: 1962(vs), 1778(s) cm−1.
Synthesis of [NEt4]4[Pt12−xNix(CO)21] (x = 3.72)
A solution of [NEt4]2[Ni6(CO)12] (0.450 g, 0.475 mmol) in acetone (30 mL) was added dropwise to a solution of [NEt4]2[Pt9(CO)18] (1.00 g, 0.397 mmol) in acetone (20 mL). The mixture was stirred for 2 h at refluxing temperature and, then, the solvent was removed under reduced pressure. The residue was washed with H2O (2 × 15 mL) and toluene (2 × 15 mL), and extracted with acetone (35 mL). Crystals of [NEt4]4[Pt12−xNix(CO)21] (x = 3.72) suitable for SC-XRD were obtained by slow diffusion of n-hexane (100 mL) on the acetone solution (yield 0.71 g, 56% based on Pt, 31% based on Ni).C53H80N4Ni3.72O21Pt8.28 (2942.95): calcd C 21.63, H 2.74, N 1.90; found: C 20.68, H 2.98, N 1.71. IR (acetone, 293 K) νCO: 1998(vs), 1802(s) cm−1. IR (CH3CN, 293 K) νCO: 1998(vs), 1796(s) cm−1. IR (DMSO, 293 K) νCO: 1978(vs), 1796(s) cm−1.
Synthesis of [NBu4]4[Pt12−xNix(CO)21]·2CH3COCH3 (x = 5.82)
A solution of [NBu4]2[Ni6(CO)12] (0.490 g, 0.418 mmol) in THF (15 mL) was added dropwise to a solution of [NBu4]2[Pt6(CO)12] (0.800 g, 0.402 mmol) in THF (20 mL). The mixture was stirred for 2 h at room temperature and then, the solvent was removed under reduced pressure. The residue was dissolved with CH3CN (15 mL), stirred for 8 days at room temperature and, then, the solvent was removed under reduced pressure. The solid residue was washed with H2O (3 × 15 mL) and toluene (3 × 15 mL), and extracted with THF (20 mL) and acetone (20 mL). Crystals of [NEt4]4[Pt12−xNix(CO)21]·2CH3COCH3 (x = 5.82) suitable for SC-XRD were obtained by slow diffusion of n-hexane (60 mL) on the acetone solution (yield 0.65 g, 52% based on Pt, 47% based on Ni).C91H156N4Ni5.82O23Pt6.18 (3221.88): calcd C 33.93, H 4.88, N 1.74; found: C 34.11, H 4.65, N 1.54. IR (nujol, 293 K) νCO: 1979(vs), 1790(vs), 1712(m) cm−1. IR (THF, 293 K) νCO: 1983(vs), 1814(m) cm−1. IR (acetone, 293 K) νCO: 1983(vs), 1818(m) cm−1. IR (CH3CN, 293 K) νCO: 1989(vs), 1821(m) cm−1. IR (DMSO, 293 K) νCO: 1984(vs), 1815(m) cm−1.
Synthesis of [NMe4]4[Pt12−xNix(CO)21]·2CH3CN (x = 6.25)
A solution of [NMe4]2[Ni6(CO)12] (0.560 g, 0.669 mmol) in CH3CN (30 mL) was added dropwise to a solution of [NMe4]2[Pt6(CO)12] (0.913 g, 0.552 mmol) in CH3CN (20 mL). The mixture was stirred for 2 h at refluxing temperature and, then, the solvent was removed under reduced pressure. The residue was washed with H2O (2 × 15 mL) and toluene (2 × 15 mL), and extracted with CH3CN (20 mL). Crystals of [NMe4]4[Pt12−xNix(CO)21]·2CH3CN (x = 6.25) suitable for SC-XRD were obtained by slow diffusion of n-hexane (2 mL) and di-iso-propyl-ether (60 mL) on the CH3CN solution (yield 0.57 g, 40% based on Pt, 36% based on Ni).C41H54N6Ni6.25O21Pt5.75 (2455.60): calcd C 20.05, H 2.22, N 3.42; found: C 20.38, H 1.99, N 3.28. IR (CH3CN, 293 K) νCO: 1993(vs), 1836(m) cm−1.
Synthesis of [NEt4]4[Pt12−xNix(CO)21]·1.79CH3CN (x = 6.45)
A solution of [NEt4]2[Ni6(CO)12] (0.840 g, 0.600 mmol) in THF (30 mL) was added dropwise to a solution of [NEt4]2[Pt6(CO)12] (0.505 g, 0.475 mmol) in THF (20 mL). The mixture was stirred for 2 h at room temperature and, then, the solvent was removed under reduced pressure. The residue was washed with H2O (2 × 15 mL) and toluene (2 × 15 mL), and extracted with CH3CN (30 mL). The mixture was stirred for 2 h at refluxing temperature and, then, the solvent was removed under reduced pressure. The residue was washed with H2O (2 × 15 mL), toluene (2 × 15 mL), THF (2 × 15 mL), acetone (20 mL), and extracted with CH3CN (20 mL). Crystals of [NEt4]4[Pt12−xNix(CO)21]·1.79CH3CN (x = 6.45) suitable for X-ray crystallography were obtained by slow diffusion of n-hexane (2 mL) and di-iso-propyl-ether (60 mL) on the CH3CN solution (yield 0.72 g, 53% based on Pt, 49% based on Ni).C56.58H85.37N5.79Ni6.45O21Pt5.56 (2644.80): calcd C 25.68, H 3.25, N 3.07; found: C 25.29, H 3.44, N 2.85. IR (nujol, 293 K) νCO: 1993(sh), 1972(sh), 1954(vs), 1779(s) 1754(s), 1732(m) cm−1.
Synthesis of [NEt4]4[Pt19−xNix(CO)22]·2CH3COCH3 (x = 2.23)
A solution of [NEt4]2[Ni6(CO)12] (0.250 g, 0.264 mmol) in acetone (30 mL) was added dropwise to a solution of [NEt4]2[Pt12(CO)24] (0.870 g, 0.266 mmol) in acetone (20 mL). The mixture was stirred for 2 h at room temperature and, then, the solvent was removed under reduced pressure. The residue was dissolved in CH3CN (30 mL) and heated at refluxing temperature for 1 h. The solvent was removed under reduced pressure and the residue was washed with H2O (2 × 15 mL), toluene (2 × 15 mL), and THF (15 mL), and extracted with acetone (30 mL). Crystals of [NEt4]4[Pt19−xNix(CO)22]·2CH3COCH3 (x = 2.23) suitable for SC-XRD were obtained by slow diffusion of n-hexane (60 mL) on the acetone solution (yield 0.54 g, 61% based on Pt, 16% based on Ni).C60H92N4Ni2.23O24Pt16.77 (4656.29): calcd C 15.48, H 1.99, N 1.20; found: C 15.33, H 2.19, N 1.04. IR (nujol, 293 K) νCO: 1978(vs), 1774(s), 1739(m) cm−1. IR (CH3CN, 293 K) νCO: 2002(vs), 1798(ms) cm−1.
Synthesis of [NBu4]4[Pt19−xNix(CO)22]·2CH3CN (x = 3.11)
A solution of [NBu4]2[Ni6(CO)12] (0.350 g, 0.299 mmol) in THF (30 mL) was added dropwise to a solution of [NBu4]2[Pt12(CO)24] (0.594 g, 0.298 mmol) in THF (20 mL). The mixture was stirred for 2 h at room temperature and, then, the solvent was removed under reduced pressure. The residue was dissolved in CH3CN (30 mL) and heated at refluxing temperature for 2 h. The solvent was removed under reduced pressure and the residue was washed with H2O (2 × 15 mL), toluene (2 × 15 mL), and extracted with CH3CN (30 mL). Crystals of [NBu4]4[Pt19−xNix(CO)22]·2CH3CN (x = 3.11) suitable for SC-XRD were obtained by slow diffusion of n-hexane (2 mL) and di-iso-propyl-ether (60 mL) on the CH3CN solution (yield 0.58 g, 52% based on Pt, 20% based on Ni).C90H150N6Ni3.11O22Pt15.89 (4950.72): calcd C 21.84, H 3.05, N 1.70; found: C 21.77, H 3.18, N 1.52. IR (nujol, 293 K) νCO: 2009(vs), 1772(ms) cm−1. IR (CH3CN, 293 K) νCO: 2000(vs), 1797(ms) cm−1.
Synthesis of [NBu4]4[Pt19−xNix(CO)22]·2CH3CN (x = 5.26)
A solution of [NBu4]2[Ni6(CO)12] (0.710 g, 0.606 mmol) in THF (30 mL) was added dropwise to a solution of [NBu4]2[Pt6(CO)12] (0.500 g, 0.251 mmol) in THF (20 mL). The mixture was stirred for 2 h at room temperature and, then, the solvent was removed under reduced pressure. The residue was dissolved in DMSO (15 mL) and heated at 130 °C for 14 h. The crude product was precipitated by addition of a saturated solution of [NBu4]Br in H2O (50 mL). The residue was washed with H2O (2 × 15 mL), toluene (2 × 15 mL), and THF (15 mL), and extracted with CH3CN (30 mL). Crystals of [NBu4]4[Pt19−xNix(CO)22]·2CH3CN (x = 5.26) suitable for SC-XRD were obtained by slow diffusion of n-hexane (2 mL) and di-iso-propyl-ether (60 mL) on the CH3CN solution (yield 0.39 g, 76% based on Pt, 12% based on Ni).C90H150N6Ni5.26O22Pt13.73 (4656.82): calcd C 23.22, H 3.25, N 1.81; found: C 23.41, H 3.02, N 1.64. MP-AES: calcd Pt/Ni 2.61; found: 2.87. IR (nujol, 293 K) νCO: 2000(vs), 1770(ms) cm−1. IR (CH3CN, 293 K) νCO: 1997(vs), 1774(ms) cm−1.
Synthesis of [NMe4]5[HPt14+xNi24−x(CO)44]·3CH3COCH3 (x = 0.70)
A solution of [NMe4]2[Ni6(CO)12] (0.960 g, 1.15 mmol) in CH3CN (30 mL) was added dropwise to a solution of [NMe4]2[Pt6(CO)12] (0.960 g, 0.580 mmol) in CH3CN (20 mL). The mixture was stirred for 2 h at refluxing temperature and, then, the solvent was removed under reduced pressure. The residue was washed with H2O (2 × 15 mL) and toluene (2 × 15 mL), and extracted with acetone (40 mL). HBF4·Et2O (18 μL, 0.133 mmol) was added to the acetone solution and the mixture stirred at room temperature for 1 h. The solvent was removed under reduced pressure, and the residue was washed with H2O (2 × 15 mL) and toluene (2 × 15 mL), and extracted with THF (30 mL). Crystals of [NMe4]5[HPt14+xNi24−x(CO)44]·3CH3COCH3 (x = 0.70) suitable for SC-XRD were obtained by slow diffusion of n-hexane (60 mL) on the THF solution (yield 0.56 g, 39% based on Pt, 31% based on Ni).C73H78N5Ni23.30O47Pt14.70 (6012.97): calcd C 14.58, H 1.31, N 1.16; found: C 14.87, H 1.44, N 0.89. IR (nujol, 293 K) νCO: 2014(vs), 1995(sh), 1806(ms) cm−1. IR (CH3CN, 293 K) νCO: 2012(vs), 1849(w), 1811(ms) cm−1. IR (acetone, 293 K) νCO: 2015(vs), 1822(ms) cm−1.
X-ray crystallographic study
Crystal data and collection details for the structures deposited with CCDC, that is [NBu4]4[Pt6−xNix(CO)12] (x = 4.20), [NEt4]4[Pt12−xNix(CO)21] (x = 3.72), [NBu4]4[Pt12−xNix(CO)21]·2CH3COCH3 (x = 5.82), [NEt4]4[Pt19−xNix(CO)22]·2CH3COCH3 (x = 2.23), [NBu4]4[Pt19−xNix(CO)22]·2CH3CN (x = 3.11), [NMe4]5[HPt14+xNi24−x(CO)44]·3CH3COCH3 (x = 0.70) are reported in Table S5 in the ESI.†The structures of [NMe4]4[Pt12−xNix(CO)21]·2CH3CN (x = 6.25), [NEt4]4[Pt12−xNix(CO)21]·1.79CH3CN (x = 6.45), [NBu4]4[Pt19−xNix(CO)22]·2CH3CN (x = 5.26) were of low quality and poorly diffracting. The resulting structures allowed to determine the overall geometry, composition and connectivity of the clusters. These compared very well with related homometallic and heterometallic carbonyl clusters. Their cif files were included as ESI† (cifSI.cif), but they were not deposited with CCDC. Their crystal data and collection details are reported in Table S6 in the ESI.†
The diffraction experiments were carried out on a Bruker APEX II diffractometer equipped with a PHOTON2 detector using Mo–Kα radiation. Data were corrected for Lorentz polarization and absorption effects (empirical absorption correction SADABS).59 Structures were solved by direct methods and refined by full-matrix least-squares based on all data using F2.60 Hydrogen atoms were fixed at calculated positions and refined by a riding model. All non-hydrogen atoms were refined with anisotropic displacement parameters, unless otherwise stated.
Computational details
Geometry optimizations were performed in gas phase using the PBEh-3c method, which is a reparametrized version of PBE0![[thin space (1/6-em)]](https://www.rsc.org/images/entities/char_2009.gif) 61 (with 42% HF exchange) that uses a split-valence double-zeta basis set (def2-mSVP) with relativistic ECPs for Pt62–64 and adds three corrections that consider dispersion, basis set superposition and other basis set incompleteness effects.65–67 The “restricted” approach was used in all the cases. IR simulations were carried out on the [PtNi11(CO)21]4− and [Pt2Ni10(CO)21]4− clusters using the harmonic approximation, from which zero-point vibrational energies and thermal corrections (T = 298.15 K) were obtained. IR simulations on the [Pt18Ni(CO)22]4− isomers failed because of hardware limits. Calculations were performed with the ORCA 4.0.1.2 and 5.0.3.68–70 The output, converted in .molden format, was elaborated with the software Multiwfn, version 3.5.71 Cartesian coordinates and final energy values of the DFT-optimized structures are provided in the ESI,† together with the available simulated IR frequencies and Gibbs free energies at 298 K. The Cartesian coordinates are also collected in a separate .xyz file for ease of visualization.
61 (with 42% HF exchange) that uses a split-valence double-zeta basis set (def2-mSVP) with relativistic ECPs for Pt62–64 and adds three corrections that consider dispersion, basis set superposition and other basis set incompleteness effects.65–67 The “restricted” approach was used in all the cases. IR simulations were carried out on the [PtNi11(CO)21]4− and [Pt2Ni10(CO)21]4− clusters using the harmonic approximation, from which zero-point vibrational energies and thermal corrections (T = 298.15 K) were obtained. IR simulations on the [Pt18Ni(CO)22]4− isomers failed because of hardware limits. Calculations were performed with the ORCA 4.0.1.2 and 5.0.3.68–70 The output, converted in .molden format, was elaborated with the software Multiwfn, version 3.5.71 Cartesian coordinates and final energy values of the DFT-optimized structures are provided in the ESI,† together with the available simulated IR frequencies and Gibbs free energies at 298 K. The Cartesian coordinates are also collected in a separate .xyz file for ease of visualization.
Conflicts of interest
There are no conflicts to declare.Acknowledgements
We thank the University of Bologna and the University of Pisa for financial support. We thank the Referees for very useful suggestions in revising the manuscript.References
- S. Hossain, Y. Nihori, L. V. Nair, B. Kumar, W. Kurashige and Y. Negishi, Alloy Clusters: Precise Synthesis and Mixing Effects, Acc. Chem. Res., 2018, 51, 3114–3124 CrossRef CAS PubMed.
- S. Wang, Q. Li, X. Kang and M. Zhu, Customizing the Structure, Composition, and Properties of Alloy Nanoclusters by Metal Exchange, Acc. Chem. Res., 2018, 51, 2784–2792 CrossRef CAS PubMed.
- A. Ghosh, O. F. Mohammed and O. M. Bakr, Atomic-Level Doping of Metal Clusters, Acc. Chem. Res., 2018, 51, 3094–3103 CrossRef CAS PubMed.
- X. Kang, Y. Li, M. Zhu and R. Jin, Atomically precise alloy nanoclusters: syntheses, structures, and properties, Chem. Soc. Rev., 2020, 49, 6443–6514 RSC.
- T. Kawawaki, Y. Imai, D. Suzuki, S. Kato, L. Koboyashi, T. Suzuki, R. Kaneko, S. Hossain and Y. Negishi, Atomically Precise Alloy Nanoclusters, Chem. – Eur. J., 2020, 26, 16150–16193 CrossRef CAS PubMed.
- E. Khatun and T. Pradeep, New Routes for Multicomponent Atomically Precise Metal Nanoclusters, ACS Omega, 2021, 6, 1–16 CrossRef CAS PubMed.
- C. Sun, B. K. Teo, C. Deng, J. Lin, G.-G. Luo, C.-H. Tung and D. Sun, Hydrido-coinage-metal clusters: Rational design, synthetic protocols and structural characteristics, Coord. Chem. Rev., 2021, 427, 213576 CrossRef CAS.
- X. Zhang, G. Cui, H. Feng, L. Chen, H. Wang, B. Wang, X. Zhang, L. Zheng, S. Hong and M. Wei, Platinum-copper single atom alloy catalysts with high performance towards glycerol hydrogenolysis, Nat. Commun., 2019, 10, 5812 CrossRef CAS PubMed.
- T. Kawawaki, Y. Kataoka, M. Hirata, Y. Iwamatsu, S. Hossain and Y. Negishi, Toward the creation of high-performance heterogeneous catalysts by controlled ligand desorption from atomically precise metal nanoclusters, Nanoscale Horiz., 2021, 6, 409–448 RSC.
- R. Jin, G. Li, S. Sharma, Y. Li and X. Du, Toward Active-Site Tailoring in Heterogeneous Catalysts by Atomically Precise Metal Nanoclusters with Crystallographic Structure, Chem. Rev., 2021, 121, 567–648 CrossRef CAS PubMed.
- Y.-C. Gao, C. Wang, C.-X. Zhang, H.-W. Li and Y. Wu, Controlled preparation and application of glutathione capped gold and platinum alloy nanoclusters with high peroxidase-like activity, J. Mater. Sci. Technol., 2022, 109, 140–146 CrossRef.
- Y. Cui, M. Zhao, Y. Zou, J. Zhang, J. Han, Z. Wang and Q. Jiang, Ultrasmall AuPd nanoclusters on amine-functionalized carbon blacks as high-performance bi-functional catalysts for ethanol electrooxidation and formic acid dehydrogenation, J. Energy Chem., 2022, 68, 556–563 CrossRef CAS.
- I. López-Hernández, V. Truttmann, C. Garcia, C. W. Lopes, C. Rameshan, M. Stöger-Pollach, N. Barrabés, G. Rupprechter, F. Rey and A. E. Palomares, AgAu nanoclusters supported on zeolites: Structural dynamics during CO oxidation, Catal. Today, 2022, 384–386, 166–176 CrossRef.
- T. Kawawaki, A. Ebina, Y. Hosokawa, S. Ozaki, D. Suzuki, S. Hossain and Y. Negishi, Thiolate-Protected Metal Nanoclusters: Recent Development in Synthesis, Understanding of Reaction, and Application in Energy and Environmental Field, Small, 2021, 17, 2005328 CrossRef CAS PubMed.
- S. Han, Y. Zhao, Z. Zhang and G. Xu, Recent Advances in Electrochemiluminescence and Chemiluminescence of Metal Nanoclusters, Molecules, 2020, 25, 5208 CrossRef CAS PubMed.
- J. Tang, H. Shi, G. Ma, L. Luo and Z. Tang, Ultrasmall Au and Ag Nanoclusters for Biomedical Applications: A Review, Front. Bioeng. Biotechnol., 2020, 8, 1019 CrossRef PubMed.
- G. Li, X. Sui, X. Cai, W. Hu, X. Liu, M. Chen and Y. Zhu, Precisely Constructed Silver Active Sites in Gold Nanoclusters for Chemical Fixation of CO2, Angew. Chem., Int. Ed., 2021, 60, 10573–10576 CrossRef CAS PubMed.
- T. Zheng, F. Wu, H. Fu, L. Zeng, C. Shang, L. Zhu and Z. Guo, Rational Design of Pt-Pd-Ni Trimetallic Nanocatalysts for Room-Temperature Benzaldehyde and Styrene Hydrogenation, Chem. – Asian J., 2021, 16, 2298–2306 CrossRef CAS PubMed.
- C. Cesari, B. Berti, M. Bortoluzzi, C. Femoni, M. C. Iapalucci and S. Zacchini, Heterometallic Ni-Pt Chini-Type Carbonyl Clusters: An Example of Molecular Random Alloy Clusters, Inorg. Chem., 2021, 60, 8811–8825 CrossRef CAS PubMed.
- B. Berti, M. Bortoluzzi, C. Cesari, C. Femoni, M. C. Iapalucci, L. Soleri and S. Zacchini, Synthesis, Structural Characterization, and DFT Investigations of [MxM’5−xFe4(CO)16]3− (M, M′ = Cu, Ag, Au; M ≠ M′) 2-D Molecular Alloy Clusters, Inorg. Chem., 2020, 59, 15936–15952 CrossRef CAS PubMed.
- B. Berti, C. Cesari, C. Femoni, T. Funaioli, M. C. Iapalucci and S. Zacchini, Redox active Ni-Pd carbonyl alloy nanolcusters: syntheses, molecular structures and electrochemistry of [Ni22−xPd20+x(CO)48]6− (x = 0.62), [Ni29−xPd6+x(CO)42]6− (x = 0.09) and [Ni29+xPd6−x(CO)42]6− (x = 0.27), Dalton Trans., 2020, 49, 5513–5522 RSC.
- C. Femoni, M. C. Iapalucci, G. Longoni, P. H. Svensson, P. Zanello and F. Fabrizi de Biani, Synthesis and Characterization of ν3-Octahedral [Ni36Pd8(CO)48]6− and [Ni35Pt9(CO)48]6− Clusters Displaying Unexpected Surface Segregation of Pt Atoms and Molecular and/or Crystal Substitutional Ni/Pd and Ni/Pt Disorder, Chem. – Eur. J., 2004, 10, 2318–2326 CrossRef CAS PubMed.
- X. Kang, X. Wei, X. Liu, S. Wang, T. Yao, S. Wang and M. Zhu, A reasonable approach for the generation of icosahedral kernels in metal nanoclusters, Nat. Commun., 2021, 12, 6186 CrossRef PubMed.
- M. J. Cowan, A. V. Nagarajan and G. Mpourmpakis, Correlating structural rules with electronic properties of ligand-protected alloy nanolcusters, J. Chem. Phys., 2021, 155, 024303 CrossRef CAS PubMed.
- H. Zhen, L. Liu, Z. Lin, S. Gao, X. Li and X. Zhang, Physically Compatible Machine Learning Study on the Pt-Ni Nanoclusters, J. Phys. Chem. Lett., 2021, 12, 1573–1580 CrossRef CAS PubMed.
- I. Ciabatti, F. Fabrizi de Biani, C. Femoni, M. C. Iapalucci, G. Longoni and S. Zacchini, Metal Segregation in Bimetallic Co-Pd Carbide Carbonyl Clusters: Synthesis, Structure, Reactivity and Electrochemsitry of [H6−nCo20Pd16C4(CO)48]n− (n = 3–6), ChemPlusChem, 2013, 78, 1456–1465 CrossRef CAS PubMed.
- R. Jin and T. Higaki, Open questions on the transition between nanoscale and bulk properties of metals, Commun. Chem., 2021, 4, 28 CrossRef CAS PubMed.
- C. Cesari, J.-H. Shon, S. Zacchini and L. A. Berben, Metal Carbonyl Clusters of Group 8–10: Synthesis and Catalysis, Chem. Soc. Rev., 2021, 50, 9503–6539 RSC.
- S. Zacchini, Using Metal Carbonyl Clusters to Develop a Molecular Approach towards Metal Nanoparticles, Eur. J. Inorg. Chem., 2011, 4125–4145 CrossRef CAS.
- C. Femoni, M. C. Iapalucci, G. Longoni and P. H. Svensson, New high-nuclearity Ni-Pt carbonyl clusters: synthesis and X-ray structure of the ordered [Ni24Pt14(CO)44]4− and the substitutionally Ni/Pt disordered [Ni10(Ni6−xPtx)Pt8(CO)30]4− (x = 1.92) tetraanions, Chem. Commun., 2001, 1776–1777 RSC.
- C. Cesari, T. Funaioli, B. Berti, C. Femoni, M. C. Iapalucci, F. M. Vivaldi and S. Zacchini, Atomically Precise Ni-Pd Alloy Carbonyl Nanoclusters: Synthesis, Total Structure, Electrochemistry, Spectroelectrochemistry, and Electrochemical Impedance Spectroscopy, Inorg. Chem., 2021, 60, 16713–16725 CrossRef CAS PubMed.
- N. T. Tran, M. Kawano, D. R. Powell and L. F. Dahl, High-nuclearity [Pd13Ni13(CO)34]4− containing a 26-atom Pd13Ni13 core with an unprecedented five-layer close-packed triangular stacking geometry: possible substitutional Pd/Ni crystal disorder at specific intralayer nickel sites, J. Chem. Soc., Dalton Trans., 2000, 4138–4144 RSC.
- E. G. Mednikov and L. F. Dahl, Syntheses, structures and properties of primarily nanosized homo/heterometallic palladium CO/PR3-ligated clusters, Philos. Trans. R. Soc., A, 2010, 368, 1301–1322 CrossRef CAS PubMed.
- C. Femoni, M. C. Iapalucci, F. Kaswalder, G. Longoni and S. Zacchini, The possible role of metal carbonyl clusters in nanoscience and nanotechnologies, Coord. Chem. Rev., 2006, 250, 1580–1604 CrossRef CAS.
- C. Cesari, C. Femoni, T. Funaioli, M. C. Iapalucci, I. Rivalta, S. Ruggieri and S. Zacchini, Heterometallic rhodium clusters as electron reservoirs: Chemical, electrochemical, and theoretical studies of the centered-icosahedral [Rh12E(CO)27]n− atomically precise carbonyl compounds, J. Chem. Phys., 2021, 155, 104301 CrossRef CAS PubMed.
- E. Cattabriga, I. Ciabatti, C. Femoni, T. Funaioli, M. C. Iapalucci and S. Zacchini, Syntheses, Structures, and Electrochemistry of the Defetctive ccp [Pt33(CO)38]2− and the bcc [Pt40(CO)40]6− Molecular Nanoclusters, Inorg. Chem., 2016, 55, 6068–6079 CrossRef CAS PubMed.
- J. D. Roth, G. J. Lewis, L. K. Safford, X. Jiang, L. F. Dahl and M. J. Weaver, Exploration of the Ionizable Metal Cluster-Electrode Surface Analogy: Infrared Spectroelectrochemistry of [Pt24(CO)30]n, [Pt26(CO)32]n, and [Pt38(CO)44]n (n = 0 to −10) and Comparisons with Potential-Dependent Spectra of CO Adlayers on Platinum Surfaces, J. Am. Chem. Soc., 1992, 114, 6159–6169 CrossRef CAS.
- D. M. Washecheck, E. J. Wucherer, L. F. Dahl, A. Ceriotti, G. Longoni, M. Manassero, M. Sansoni and P. Chini, Synthesis, Structure, and Stereochemical Implications of the [Pt19(CO)12(μ2-CO)10]4− Tetraanion: A Bicapped Triple-Decker All-Metal Sandwich of Idealized Fivefold (D5h) Geometry, J. Am. Chem. Soc., 1979, 101, 6110–6112 CrossRef CAS.
- B. Berti, C. Femoni, M. C. Iapalucci, S. Ruggieri and S. Zacchini, Functionalization, Modification, and Transformation of Platinum Chini Clusters, Eur. J. Inorg. Chem., 2018, 3285–3296 CrossRef CAS.
- G. Longoni and P. Chini, Synthesis and Chemical Characterization of Platinum Carbonyl Dianions [Pt3(CO)6]n2− (n = ∼ 10, 6, 5, 4, 3, 2, 1). A New Series of Inorganic Oligomers, J. Am. Chem. Soc., 1976, 98, 7225–7231 CrossRef CAS.
- J. V. Barkley, T. Eguchi, R. A. Harding, B. T. Heaton, G. Longoni, L. Manzi, H. Nakayama, K. Miyagi, A. K. Smith and A. Steiner, Solid state studies (X-ray and 1H-, 13C-NMR) on (NMe4)4−x[HxNi12(CO)21]·S (x = 1, S = Me2CO; x = 2, S = 2THF), J. Organomet. Chem., 1999, 573, 254–260 CrossRef CAS.
- A. F. Masters and J. T. Meyer, Structural systematics in nickel carbonyl cluster anions, Polyhedron, 1995, 14, 339–365 CrossRef CAS.
- A. Bernardi, C. Femoni, M. C. Iapalucci, G. Longoni and S. Zacchini, The problems of detecting hydrides in metal carbonyl clusters by 1H NMR: the case study of [H4−nNi22(C2)4(CO)28(CdBr)2]n− (n = 2–4), Dalton Trans., 2009, 4245–4251 RSC.
- C. Cesari, C. Femoni, M. C. Iapalucci and S. Zacchini, Molecular Fe, Co and Ni carbide carbonyl clusters and nanoclusters, Inorg. Chim. Acta, 2023, 544, 121235 CrossRef CAS.
- A. Ceriotti, F. Demartin, H. Longoni, M. Manassero, G. Piva, G. Piro and M. Sansoni, Synthesis, NMR, and structural characterization of the [Ni9Pt3(CO)21H4−n]n− (n = 4, 3, 2) anionic clusters, J. Organomet. Chem., 1986, 301, C5–C8 CrossRef CAS.
- L. Bengtsson-Kloo, M. C. Iapalucci, G. Longoni and S. Ulvelund, Solution Structures of Mono- and Ditriangular Chini Clusters of Nickel and Platinum. An X-ray Scattering and Quantum Chemical Study, Inorg. Chem., 1998, 37, 4335–4343 CrossRef CAS PubMed.
- B. Cordero, V. Gómez, A. E. Platero-Prats, M. Revés, J. Echeverría, E. Cremades, F. Barragán and S. Alvarez, Covalent radii revisited, Dalton Trans., 2008, 2832–2838 RSC.
- E. Cattabriga, I. Ciabatti, C. Femoni, M. C. Iapalucci, G. Longoni and S. Zacchini, Globular molecular platinum carbonyl nanoclusters: Synthesis and molecular structures of the [Pt26(CO)32]− and [Pt14+x(CO)18+x]4− anions and their comparison to related platinum “browns”, Inorg. Chim. Acta, 2018, 470, 238–249 CrossRef CAS.
- C. Cesari, I. Ciabatti, C. Femoni, M. C. Iapalucci and S. Zacchini, Capping [H8−nNi42C8(CO)44]4− (n = 6, 7, 8) Octa-carbide Carbonyl Nanoclusters with [Ni(CO)] and [CuCl] Fragments, J. Cluster Sci., 2017, 28, 1963–1979 CrossRef CAS.
- C. Capacci, C. Cesari, C. Femoni, M. C. Iapalucci, F. Mancini, S. Ruggieri and S. Zacchini, Structural Diversity in Molecular Nickel Phosphide Carbonyl Nanoclusters, Inorg. Chem., 2020, 59, 16016–16026 CrossRef CAS PubMed.
- A. Bernardi, I. Ciabatti, C. Femoni, M. C. Iapalucci, G. Longoni and S. Zacchini, Molecular nickel poly-carbide carbonyl nanoclusters: The octa-carbide [HNi42C8(CO)44(CuCl)]7− and the deca-carbide [Ni45C10(CO)46]6−, J. Organomet. Chem., 2016, 812, 229–239 CrossRef CAS.
- S. Fedi, P. Zanello, F. Laschi, A. Ceriotti and S. El Afefey, A joint electrochemical/spectroelectrochemical inspection (and re-inspection) of high-nuclearity platinum carbonyl clusters, J. Solid State Electrochem., 2009, 13, 1497–1504 CrossRef CAS.
- C. Cesari, B. Berti, T. Funaioli, C. Femoni, M. C. Iapalucci, D. Pontiroli, G. Magnani, M. Riccç, M. Bortoluzzi, F. M. Vivaldi and S. Zacchini, Atomically Precise Platinum Carbonyl Nanoclusters: Synthesis, Total Structure, and Electrochemical Investigation of [Pt27(CO)31]4− Displaying a Defective Structure, Inorg. Chem., 2022, 61, 12534–12544 CrossRef CAS PubMed.
- A. Lasia, Electrochemical impedance spectroscopy and its applications, in Modern aspects of electrochemistry, Springer, Boston, MA, 2002, pp. 143–248 Search PubMed.
- R. Bianchi, G. Gervasio and D. Marabello, Experimental Electron Density Analysis of Mn2(CO)10: Metal-Metal and Metal-Ligand Bond Characterization, Inorg. Chem., 2000, 39, 2360–2366 CrossRef CAS PubMed.
- C. Lepetit, P. Fau, K. Fajerwerg, M. L. Kahn and B. Silvi, Topological analysis of the metal-metal bond: A tutorial review, Coord. Chem. Rev., 2017, 345, 150–162 CrossRef CAS.
- X. Yang, R. M. Chin and M. B. Hall, Protonating metal-metal bonds: Changing the metal-metal interaction from bonding, to nonbonding, and to antibonding, Polyhedron, 2022, 212, 115585 CrossRef CAS.
- E. Keller, SCHAKAL99, University of Freiburg, Germany, 1999 Search PubMed.
- G. M. Sheldrick, SADABS-, 2008/1 - Bruker AXS Area Detector Scaling and Absorption Correction, Bruker AXS, Madison, WI, 2008 Search PubMed.
- G. M. Sheldrick, Crystal structure refinement with SHELXL, Acta Crystallogr., Sect. C: Struct. Chem., 2015, 71, 3–8 Search PubMed.
- S. Grimme, J. G. Brandenburg, C. Bannwarth and A. Hansen, Consistent structures and interactions by density functional theory with small atomic orbital basis sets, J. Chem. Phys., 2015, 143, 054107 CrossRef PubMed.
- F. Weigend and R. Ahlrichs, Balanced basis sets of split valence, triple zeta valence and quadruple zeta valence quality for H to Rn: Design and assessment of accuracy, Phys. Chem. Chem. Phys., 2005, 7, 3297–3305 RSC.
- D. Andrae, U. Haeussermann, M. Dolg, H. Stoll and H. Preuss, Energy-adjusted ab initio pseudopotentials for the second and third row transition elements, Theor. Chim. Acta, 1990, 77, 123–141 CrossRef CAS.
- F. Weigend, Accurate Coulomb-fitting basis sets for H to Rn, Phys. Chem. Chem. Phys., 2006, 8, 1057–1065 RSC.
- H. Kruse and S. Grimme, A geometrical correction for the inter- and intra-molecular basis set superposition error in Hartree-Fock and density functional theory calculations for large systems, J. Chem. Phys., 2012, 136, 154101 CrossRef PubMed.
- S. Grimme, S. Ehrlich and L. Goerigk, Effect of the damping function in dispersion corrected density functional theory, J. Comput. Chem., 2011, 32, 1456–1465 CrossRef CAS PubMed.
- S. Grimme, J. Antony, S. Ehrlich and H. Krieg, A consistent and accurate ab initio parametrization of density functional dispersion correction (DFT-D) for the 94 elements H-Pu, J. Chem. Phys., 2010, 132, 154104 CrossRef PubMed.
- F. Neese, The ORCA program system, Wiley Interdiscip. Rev.: Comput. Mol. Sci., 2012, 2, 73–78 CAS.
- F. Neese, Software update: the ORCA program system, version 4.0, Wiley Interdiscip. Rev.: Comput. Mol. Sci., 2018, 8, e1327 Search PubMed.
- F. Neese, Software update: The ORCA program system-Version 5.0, Wiley Interdiscip. Rev.: Comput. Mol. Sci., 2022, 12, e1606 Search PubMed.
- T. Lu and F. Chen, Multiwfn: A multifunctional wavefunction analyzer, J. Comput. Chem., 2012, 33, 580–592 CrossRef CAS PubMed.
Footnote |
| † Electronic supplementary information (ESI) available: IR spectra of products; X-Ray crystallographic study; supplementary IR-SEC and CV figures; ORTEP drawings (pdf file): Cartesian coordinates for DFT calculations (pdf and xyz file). The preliminary data of [NMe4]4[Pt12−-xNix(CO)21]·2CH3CN (x = 6.25), [NEt4]4[Pt12−-xNix(CO)21]·1.79CH3CN (x = 6.45), [NBu4]4[Pt19−-xNix(CO)22]·2CH3CN (x = 5.26) are included as cif files (cifSI.cif) but not deposited with CCDC. CCDC 2217067 [NBu4]4[Pt6−-xNix(CO)12] (x = 4.20), 2217068 [NEt4]4[Pt12−-xNix(CO)21] (x = 3.72), 2217069 [NBu4]4[Pt12−-xNix(CO)21]·2CH3COCH3 (x = 5.82), 2217072 [NEt4]4[Pt19−-xNix(CO)22]·2CH3COCH3 (x = 2.23), 2217073 [NBu4]4[Pt19−-xNix(CO)22]·2CH3CN (x = 3.11) and 2217076 [NMe4]5[HPt14+xNi24−-x(CO)44]·3CH3COCH3 (x = 0.70). For ESI and crystallographic data in CIF or other electronic format see DOI: https://doi.org/10.1039/d2dt03607j |
| This journal is © The Royal Society of Chemistry 2023 |

