
 Open Access Article
 This Open Access Article is licensed under a Creative Commons Attribution-Non Commercial 3.0 Unported Licence
Automated LC-MS analysis and data extraction for high-throughput chemistry†
Joseph
Mason
 *a,
Harry
Wilders
bc,
David J.
Fallon
b,
Ross P.
Thomas
bc,
Jacob T.
Bush
b,
Nicholas C. O.
Tomkinson
c and
Francesco
Rianjongdee
a
*a,
Harry
Wilders
bc,
David J.
Fallon
b,
Ross P.
Thomas
bc,
Jacob T.
Bush
b,
Nicholas C. O.
Tomkinson
c and
Francesco
Rianjongdee
a
aMedicinal Chemistry, GSK Medicines Research Centre, Gunnels Wood Road, Stevenage, Hertfordshire SG1 2NY, UK. E-mail: joe.mason.chem@gmail.com
bChemical Biology, GSK Medicines Research Centre, Gunnels Wood Road, Stevenage, Hertfordshire SG1 2NY, UK
cDepartment of Pure and Applied Chemistry, University of Strathclyde, 295 Cathedral Street, Glasgow, G1 1XL, UK
First published on 19th October 2023
Abstract
High-throughput experimentation for chemistry and chemical biology has emerged as a highly impactful technology, particularly when applied to Direct-to-Biology. Analysis of the rich datasets which come from this mode of experimentation continues to be the rate-limiting step to reaction optimisation and the submission of compounds for biological assay. We present PyParse, an automated, accurate and accessible program for data extraction from high-throughput chemistry and provide real-life examples of situations in which PyParse can provide dramatic improvements in the speed and accuracy of analysing plate data. This software package has been made available through GitHub repository under an open-source Apache 2.0 licence, to facilitate the widespread adoption of high-throughput chemistry and enable the creation of standardised chemistry datasets for reaction prediction.
Introduction
High-throughput experimentation (HTE) is a modern-day powerhouse for organic chemistry; it refers to the execution of multiple, miniaturised chemistry experiments in parallel, which are performed on a plate rather than using traditional glassware. With this parallelisation comes an acceleration by which new discoveries can be made, in the optimisation of reaction conditions, and the synthesis of analogues for drug discovery. Numerous reviews have highlighted the positive impact of this paradigm;1–5 this is particularly evident in the pharmaceutical industry, where high-throughput6–12 and ultra-high-throughput14 chemistry is increasingly used. Direct-to-Biology (D2B),13,15–18 which uses nano-scale high-throughput experimentation, has had a profound impact on the speed and scale by which compounds can be synthesised and tested (as unpurified reaction mixtures) in a biological assay. With this increase in reaction efficiency, the rate-limiting step for new discoveries in chemistry has arguably shifted from reaction setup to reaction analysis. Substantial progress has been made in increasing the throughput of analytical data collection, which typically makes use of tandem Liquid Chromatography-Mass Spectrometry (LC-MS),19 but the subsequent analysis continues to be labour-intensive.20 For endeavours in reaction prediction21–23 (and the generation of reaction datasets which support these efforts)24 to realise their full potential, rapid and robust reaction analyses are required.Commercial software packages are available to automate the analysis of LC-MS data for high-throughput experimentation;25–29 they are typically agnostic to the brand of LC-MS machine used and are capable of processing the raw data from the instrument directly. However, the associated cost of these commercial solutions can be prohibitive. Furthermore, not all tools are specific to the analysis of high-throughput chemistry, and the closed nature of proprietary software development may hinder customisation for each user's needs. Solutions from the academic community include the method published by Steimbach et al. using Visual Basic and Spotfire;30 however, selection of the appropriate LC-MS peaks was performed manually. Osipyan et al. developed and published their Python tool to analyse plate-based mass-spectrometry data, using the observed mass-to-charge ratios to predict the abundance of the desired product.31 Most recently, Haas et al. published MOCCA, an open access Python tool for the analysis of plate-based high performance liquid chromatography (HPLC) data;32 other open-access tools for HPLC data are also available.33 Whilst all of these options provide certain functionality for specific users, we believed that there was a need to develop an open-source solution that would be suitable for the analysis of LC-MS data from both D2B and reaction optimisation experiments. An open-source solution was particularly attractive to us: the ability to adapt as required and implement into alternative workflows was considered a key advantage over commercial solutions.
The result of our endeavour was a Python program capable of reading and analysing (or “parsing”) LC-MS data for high-throughput chemistry experiments, which has been named PyParse. This program, already used across multiple departments at GSK, has been released under the open-source Apache 2.0 licence on GitHub with documentation and sample data.34 This article, intended as a user guide for the bench chemist, provides further detail and real-life examples of using PyParse (Fig. 1).
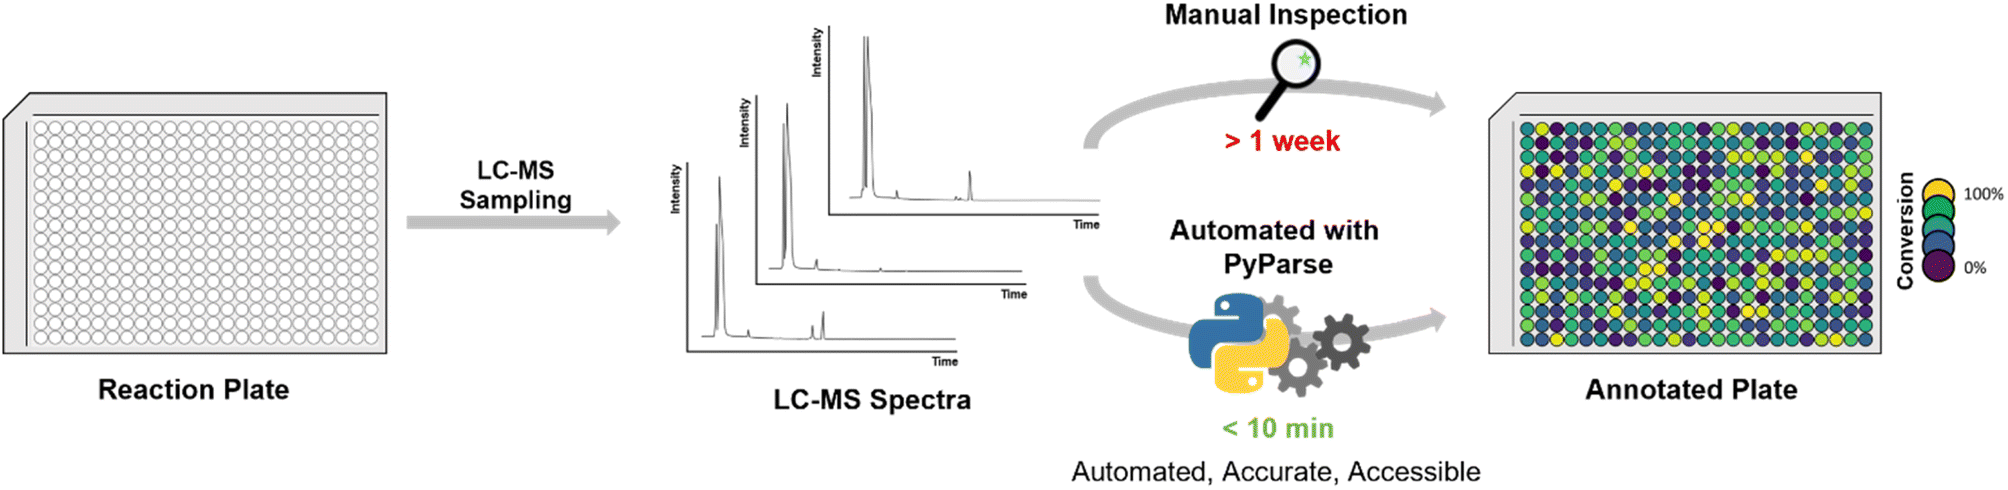 | ||
| Fig. 1 Schema for high-throughput experimentation workflow using liquid chromatography-mass spectrometry (LC-MS). | ||
Method
The software requires two key inputs: a plate map (a Comma-Separated Values (.csv) file containing the structure of the expected compounds in each well of the LC-MS plate), and the pre-processed Waters OpenLynx™ Browser Report file (.rpt).35 These are provided as arguments when calling the script via a command line operation.36 PyParse was designed to work with and is therefore currently limited to the .rpt file format, as this is the primary LC-MS format used in chemistry at GSK. However, the advantage of the open-source nature of the software release is that additional input options for LC-MS data may be scripted by a user to accept an alternative input type.The output from PyParse comprises a heatmap, annotated visualisations, and verbose descriptions to precisely describe how the analysis was computed. Tabulated results are also generated in the form of .csv files to facilitate the upload of the data to a suitable database, thus enabling data mining and reaction prediction efforts. All visualisations are presented to the user in an HTML web page, chosen for its flexibility in styling and layout, as well as its intuitive user interface.
As part of the output, PyParse also generates a summary table (see Fig. S1 of ESI†); here, the retention time is reported for each compound, along with the ID of the well with the highest purity or ratio to internal standard. Two columns labelled “Overlap Detection” and “Potential Conflicts” are also present; they are designed to alert the user if PyParse has detected that the reported purity may not be reliable. “Overlap Detection” finds where a second peak has overlapped with the product peak in the most successful well. The “Potential Conflicts” column alerts the user to cases where the compound peak eluted at the same retention time as that observed for another compound, potentially compromising the reported LC-MS UV area. In each case, these warnings notify the chemist to scrutinise that well manually, though it should be noted that it remains the user's responsibility to verify the quality of the LC-MS data.
The comprehensive outputs are designed to allow the bench chemist to interpret the data more easily, leading to the submission of compounds to a biological assay, optimised conditions for a chemical transformation, or new insights into the reaction mechanism.
Results and discussion
To demonstrate how PyParse works in this user guide for chemists, we have selected two complimentary work packages to discuss. The first, a recently published in-house data package from a D2B synthesis and screening of a reactive fragment library;13 the second, a plate-based optimisation for the C–H activation of oxazoles.In the original publication by Thomas et al.,13 more than 1000 reactive fragments were synthesised via an amide coupling reaction (Fig. 2A), then screened using a Photoaffinity Bit screening platform. The purity of each fragment was estimated from the LC-MS UV peak percentage area, which was determined manually for each reaction. This in-house dataset, which had already been carefully analysed, represented the ideal opportunity to evaluate the performance and fidelity of PyParse. The original LC-MS data files obtained by Thomas et al., covering the four separate 384-well plates, were re-analysed by PyParse, where only the SMILES (Simplified Molecular Input Line Entry System) of the product in each well was provided in the platemap. We deliberately opted not to provide the observed retention time to PyParse, as we believed this represented a fairer comparison with the manual analysis conducted by Thomas et al. The eight minutes and 36 seconds taken for PyParse to analyse the data and prepare >2000 separate visualisations represented a substantial time saving compared with the original manual analysis, which was estimated to have taken over 34 h (two minutes per well × 1026 wells, Fig. 2B). A meta-analysis was then conducted, whereby the output from PyParse was compared against the analysis by Thomas et al. Results were assigned to one of three categories: “Correct”, where the assignment from PyParse matched the original publication; “Incorrect”, where the assignment by PyParse did not match; and “Ambiguous”, where closer (manual) inspection of the LC-MS data revealed that there were multiple peaks which contained the required m/z (mass![[thin space (1/6-em)]](https://www.rsc.org/images/entities/char_2009.gif) :charge ratio) for the desired product, resulting in a differing but inconclusive result (see ESI,† page S14, for further details). This meta-analysis revealed that the PyParse analysis matched the original assignment in over 95% of cases (Fig. 2C). We concluded this was a sufficient level of reliability, given that this experiment of >1000 wells contained numerous complex reaction profiles and/or products with poor UV absorption characteristics (see ESI, Fig. S3 and S4†).
:charge ratio) for the desired product, resulting in a differing but inconclusive result (see ESI,† page S14, for further details). This meta-analysis revealed that the PyParse analysis matched the original assignment in over 95% of cases (Fig. 2C). We concluded this was a sufficient level of reliability, given that this experiment of >1000 wells contained numerous complex reaction profiles and/or products with poor UV absorption characteristics (see ESI, Fig. S3 and S4†).
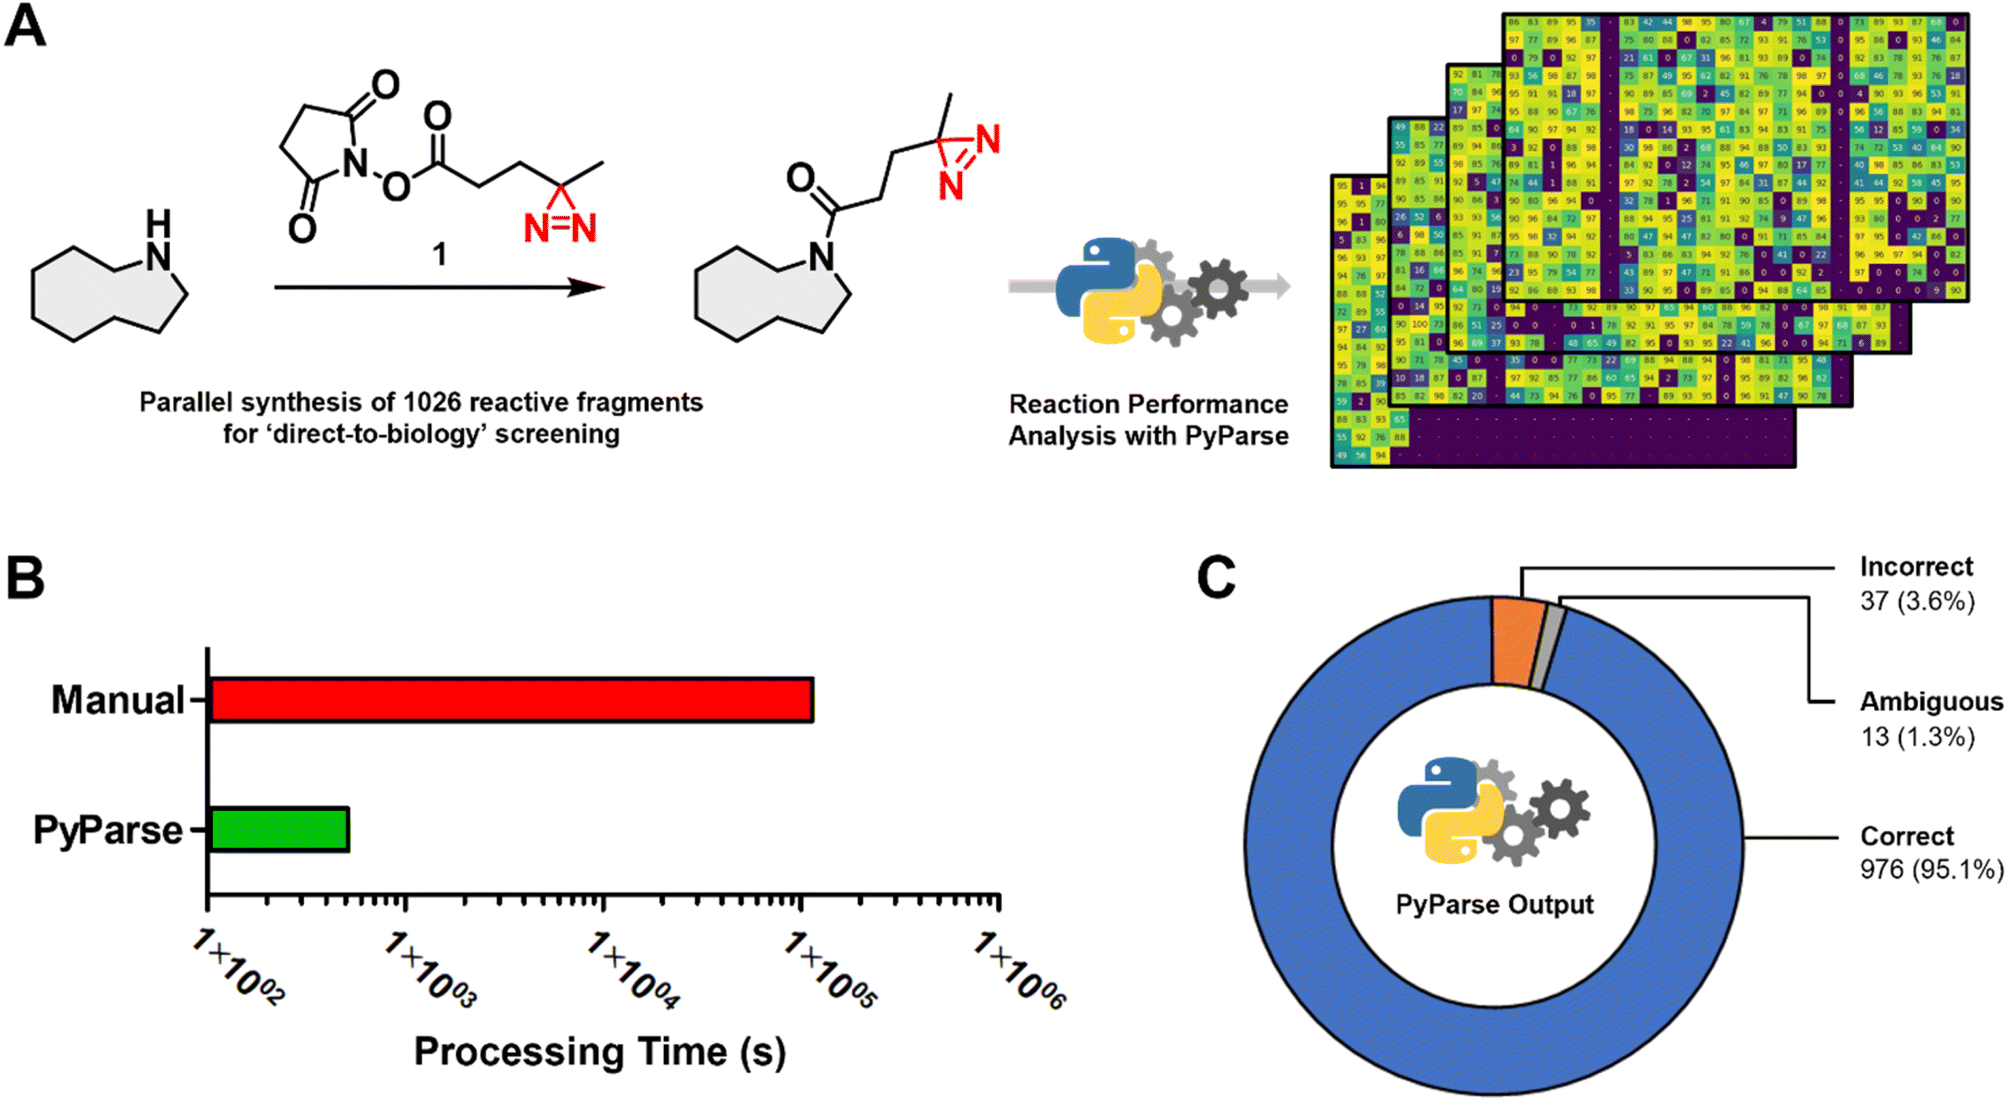 | ||
| Fig. 2 Meta analysis for the in-house parallel synthesis of 1026 reactive fragments, previously published by Thomas et al.13 (A) Generic scheme for the amide coupling reaction, and the stacked heatmaps that were generated by PyParse; (B) comparison of the time taken to analyse the full collection of LC-MS data (note: manual analysis was estimated at two minutes per well × 1026 wells); (C) donut chart comparing the assignment by PyParse with the original manual analysis: “Correct”, where the assignments by PyParse and Thomas et al. were in agreement; “Incorrect”, where PyParse failed to find the peak assigned by Thomas et al.; “Ambiguous”, where closer inspection of the LC-MS data revealed there were multiple peaks which contained the required m/z for the product, resulting in an ambiguous assignment. | ||
Overall, the meta-analysis conducted exemplifies PyParse's high level of accuracy and performance, which serves to demonstrate that the confidence placed in PyParse for in-house D2B analyses is well founded.
The second example of a PyParse analysis relates to a reaction screening plate that was conducted during in-house efforts to validate a plate design for the C–H activation of oxazoles at the C2 position (Scheme 1A). The plate design (Scheme 1B and Fig. S5 of ESI†) was inspired by numerous publications in the field,37–45 and hinged on the use of a palladium catalyst with a copper co-catalyst to enhance C2 selectivity. In the planning stage, we identified that the regioselectivity of the transformation posed a key risk, as both the C2 and C5 positions are precedented to undergo Pd-catalysed arylation under these conditions.42 As both the identity of the palladium catalyst and the base had been reported to influence the regioselectivity, the plate design focused on these two parameters (Scheme 1B).46,47 After heating for 18 h at 100 °C, LC-MS data were obtained for the plate and analysed using PyParse. The hit validation graph for the desired product 4.1, generated automatically by PyParse (Scheme 1C), proved exceptionally useful in determining the outcome of this optimisation. This graph plots all hits (defined as any LC-MS peak which contains the expected m/z) for a particular compound according to their retention time against the well in which they were found. The markers are sized by the UV percentage peak area of the hit, shaded by whether they were included (black) or excluded (red) from the final output (i.e., the heatmap), and shaped by the cluster to which they were assigned by the PyParse algorithm. The purpose of this graph is to allow the user to visualise the results of this algorithm;34 successful validation is indicated by a horizontal straight line of black markers, consistent with a set of peaks which have the same retention time irrespective of the well. Using the hit validation graph for the product (Scheme 1C), two predominant sets of hits at 0.71 and 0.73 minutes were rapidly identified. Each set had a consistent retention time, thus indicating that these were the likely retention times of the two expected regioisomers 4.1 and 4.2. By resubmitting the data to PyParse and specifying a retention time of either 0.71 or 0.73 minutes, heatmaps (see ESI†) and tabular datasets were generated for each regioisomer in turn. We also noted the presence of the bis-arylation product 4.3 in the plate, identified by the mass:charge ratio, which comes as a consequence of over-reaction. The heatmaps (see Fig. S7 and S8 of ESI†), in conjunction with manual analysis of the tabular datasets, enabled us to identify wells C12 and D6 as the best performing conditions for 4.1 and 4.2 respectively (Scheme 1D). The subsequent scale up (see ESI†) and isolation of the two products allowed us to confirm the regiochemistry for each isomer by HMBC and ROESY.
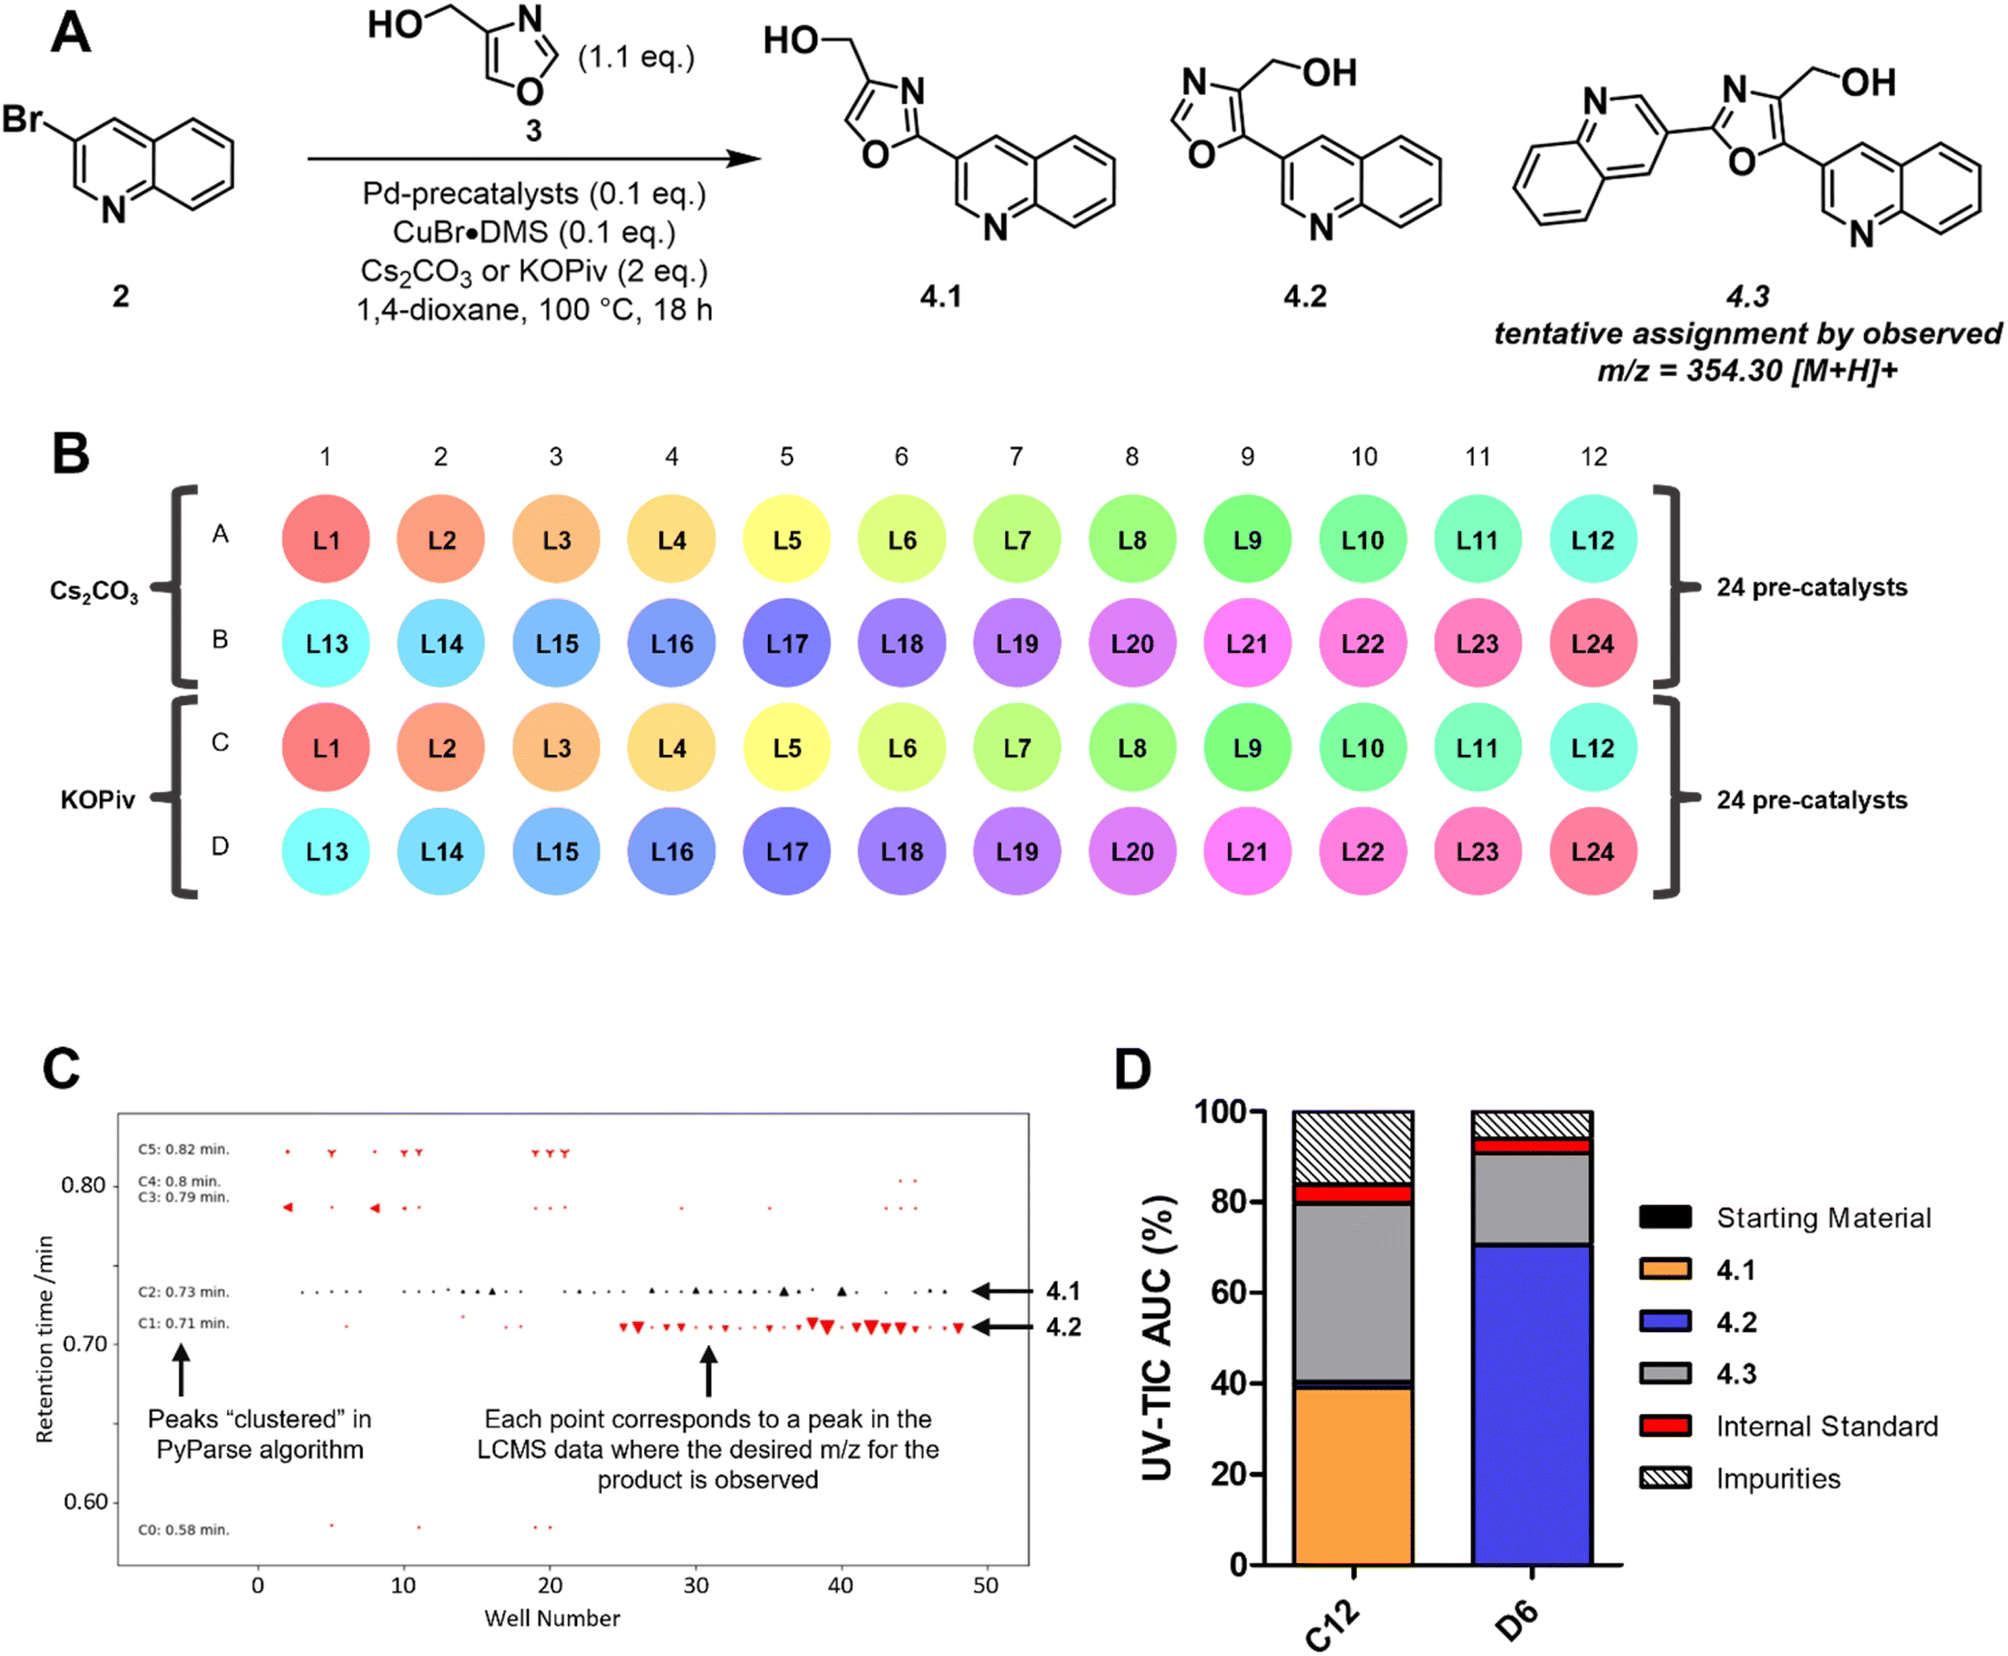 | ||
| Scheme 1 An example reaction optimisation plate, designed for the palladium catalysed C–H activation of an oxazole. (A) Generic reaction scheme for the plate-based optimisation; (B) 48-well plate design; (C) hit validation graph for the desired product; (D) bar chart comparing the peak percentage areas of assigned compounds in the best performing wells for each regioisomer. | ||
The visualisations generated by PyParse for this challenging reaction optimisation plate facilitated the rapid identification of the appropriate reaction conditions for each regioisomer. These results led us to conclude that the plate design used was indeed effective for the optimisation of C–H activation reactions for oxazoles; investigations into a wider substrate scope are currently ongoing and will be reported in a future publication.
Conclusions
In this work we present a new Python based tool for the automated analysis of LC-MS data related to high-throughput plates, and subsequent data extraction for visualisation and mining. The package, named PyParse, has been published under an open-source Apache 2.0 licence on GitHub to allow the wider chemistry community to use the software and benefit from its capabilities in LC-MS peak assignment and data visualisation.34 We expect that open-source tools like this will help drive adoption of high-throughput chemistry by first intent across the academic and industrial sectors. This, in turn, will provide richer datasets for existing collaborative efforts such as the Open Reaction Database,24 in addition to facilitating the generation of highly accurate predictive models.Data availability
The code for PyParse can be found at GitHub at https://github.com/thatchemistryguy/PyParse, with a corresponding DOI for the v1.0.0 release at 10.5281/zenodo.8267220. The version of the code employed for this study is version 1.0.0. An example dataset (separate to that discussed in this manuscript) may be found at the above GitHub repository for testing purposes. The LC-MS dataset (and platemap for PyParse) for the reaction optimisation 48-well plate have been uploaded as part of the ESI.† The following parameters were specified for use for this dataset, at the point of running the PyParse script in the command line interface: -r: 4; -c: 12; -pt corrP/STD; -tat 0.01. The four LC-MS datasets and associated platemaps containing full structures for the D2B experiment are not currently approved for public release, as GSK retains a proprietary interest in these compounds.Author contributions
J. M., H. W., D. J. F. and F. R. all contributed to software development, implementation of the computer code, and publication of PyParse to the cited GitHub repository; J. M. conducted the research investigation for the reaction optimisation dataset, the formal analysis of the reaction optimisation dataset and the meta-analysis of the D2B dataset; R. P. T. and J. B. were responsible for the data collection of the D2B dataset; all authors contributed to the writing, review and editing of the manuscript.Conflicts of interest
J. M., D. J. F., J. T. B. and F. R. are all full employees of GSK and may own shares in GSK.Acknowledgements
H. W. and R. P. T are grateful to GSK for a studentship via the GSK/University of Strathclyde Centre for Doctoral Training in Synthetic and Medicinal Chemistry. The authors thank the EPSRC for funding via Prosperity Partnership EP/S035990/1 and GSK for financial support. The authors are grateful to Andy Hobbs, Stephen Besley, Adrian Dunn, Sean Lynn, Michael Brown, and Omar Rahman in the Discovery Analytical department at GSK for the maintenance of open-access LCMS machines, the purification of regioisomeric products 4.1 and 4.2 and the acquisition of NMR and mass spectrometry data.Notes and references
- M. Shevlin, ACS Med. Chem. Lett., 2017, 8, 601–607 CrossRef CAS PubMed.
- S. W. Krska, D. A. DiRocco, S. D. Dreher and M. Shevlin, Acc. Chem. Res., 2017, 50, 2976–2985 CrossRef CAS PubMed.
- S. M. Mennen, C. Alhambra, C. L. Allen, M. Barberis, S. Berritt, T. A. Brandt, A. D. Campbell, J. Castañón, A. H. Cherney, M. Christensen, D. B. Damon, J. Eugenio de Diego, S. García-Cerrada, P. García-Losada, R. Haro, J. Janey, D. C. Leitch, L. Li, F. Liu, P. C. Lobben, D. W. C. MacMillan, J. Magano, E. McInturff, S. Monfette, R. J. Post, D. Schultz, B. J. Sitter, J. M. Stevens, I. I. Strambeanu, J. Twilton, K. Wang and M. A. Zajac, Org. Process Res. Dev., 2019, 23, 1213–1242 CrossRef CAS.
- S. A. Biyani, Y. W. Moriuchi and D. H. Thompson, Chem.: Methods, 2021, 1, 323–339 CAS.
- C. J. Taylor, A. Pomberger, K. C. Felton, R. Grainger, M. Barecka, T. W. Chamberlain, R. A. Bourne, C. N. Johnson and A. A. Lapkin, Chem. Rev., 2023, 123, 3089–3126 CrossRef CAS PubMed.
- J. M. Stevens, E. M. Simmons, Y. Tan, A. Borovika, J. Fan, R. V. Forest, P. Geng, C. A. Guerrero, S. Lou, D. Skliar, S. E. Steinhardt and N. A. Strotman, Org. Process Res. Dev., 2022, 26, 1174–1183 CrossRef CAS.
- X. Li and A. L. Dunn, Org. Process Res. Dev., 2022, 26, 795–803 CrossRef CAS.
- T. Cernak, N. J. Gesmundo, K. Dykstra, Y. Yu, Z. Wu, Z. C. Shi, P. Vachal, D. Sperbeck, S. He, B. A. Murphy, L. Sonatore, S. Williams, M. Madeira, A. Verras, M. Reiter, C. H. Lee, J. Cuff, E. C. Sherer, J. Kuethe, S. Goble, N. Perrotto, S. Pinto, D. M. Shen, R. Nargund, J. Balkovec, R. J. DeVita and S. D. Dreher, J. Med. Chem., 2017, 60, 3594–3605 CrossRef CAS PubMed.
- Z. Jaman, D. L. Logsdon, B. Szilágyi, T. J. P. Sobreira, D. Aremu, L. Avramova, R. G. Cooks and D. H. Thompson, ACS Comb. Sci., 2020, 22, 184–196 CrossRef CAS PubMed.
- S. A. Biyani, Q. Qi, J. Wu, Y. Moriuchi, E. A. Larocque, H. O. Sintim and D. H. Thompson, Org. Process Res. Dev., 2020, 24, 2240–2251 CrossRef CAS.
- S. Lin, S. Dikler, W. D. Blincoe, R. D. Ferguson, R. P. Sheridan, Z. Peng, D. V. Conway, K. Zawatzky, H. Wang, T. Cernak, I. W. Davies, D. A. DiRocco, H. Sheng, C. J. Welch and S. D. Dreher, Science, 2018, 361, eaar6236 CrossRef PubMed.
- N. Gesmundo, K. Dykstra, J. L. Douthwaite, Y.-T. Kao, R. Zhao, B. Mahjour, R. Ferguson, S. Dreher, B. Sauvagnat, J. Saurí and T. Cernak, Nat. Synth., 2023 DOI:10.1038/s44160-023-00351-1.
- R. P. Thomas, R. E. Heap, F. Zappacosta, E. K. Grant, P. Pogány, S. Besley, D. J. Fallon, M. M. Hann, D. House, N. C. O. Tomkinson and J. T. Bush, Chem. Sci., 2021, 12, 12098–12106 RSC.
- B. Mahjour, Y. Shen and T. Cernak, Acc. Chem. Res., 2021, 54, 2337–2346 CrossRef CAS PubMed.
- A. B. Santanilla, E. L. Regalado, T. Pereira, M. Shevlin, K. Bateman, L. C. Campeau, J. Schneeweis, S. Berritt, Z. C. Shi, P. Nantermet, Y. Liu, R. Helmy, C. J. Welch, P. Vachal, I. W. Davies, T. Cernak and S. D. Dreher, Science, 2015, 347, 49–53 CrossRef PubMed.
- C. E. Hendrick, J. R. Jorgensen, C. Chaudhry, I. I. Strambeanu, J. F. Brazeau, J. Schiffer, Z. Shi, J. D. Venable and S. E. Wolkenberg, ACS Med. Chem. Lett., 2022, 13, 1182–1190 CrossRef CAS PubMed.
- N. J. Gesmundo, B. Sauvagnat, P. J. Curran, M. P. Richards, C. L. Andrews, P. J. Dandliker and T. Cernak, Nature, 2018, 557, 228–232 CrossRef CAS PubMed.
- K. Gao, S. Shaabani, R. Xu, T. Zarganes-Tzitzikas, L. Gao, M. Ahmadianmoghaddam, M. R. Groves and A. Domling, RSC Med. Chem., 2021, 12, 809–818 RSC.
- C. J. Welch, X. Gong, W. Schafer, E. C. Pratt, T. Brkovic, Z. Pirzada, J. F. Cuff and B. Kosjek, Tetrahedron: Asymmetry, 2010, 21, 1674–1681 CrossRef CAS.
- R. Grainger and S. Whibley, Org. Process Res. Dev., 2021, 25, 354–364 CrossRef CAS.
- M. Fitzner, G. Wuitschik, R. Koller, J. M. Adam and T. Schindler, ACS Omega, 2023, 8, 3017–3025 CrossRef CAS PubMed.
- A. M. Żurański, J. I. Martinez Alvarado, B. J. Shields and A. G. Doyle, Acc. Chem. Res., 2021, 54, 1856–1865 CrossRef PubMed.
- W. Beker, R. Roszak, A. Wolos, N. H. Angello, V. Rathore, M. D. Burke and B. A. Grzybowski, J. Am. Chem. Soc., 2022, 144, 4819–4827 CrossRef CAS PubMed.
- S. M. Kearnes, M. R. Maser, M. Wleklinski, A. Kast, A. G. Doyle, S. D. Dreher, J. M. Hawkins, K. F. Jensen and C. W. Coley, J. Am. Chem. Soc., 2021, 143, 18820–18826 CrossRef CAS PubMed.
- Peaksel, https://elsci.io/peaksel/index.html, accessed 22nd August 2023.
- Virscidian Automated Compound QC, https://www.virscidian.com/workflows/medicinal-chemistry/automated-compound-qc/, accessed 22nd August 2023.
- Katalyst D2D, https://www.acdlabs.com/products/spectrus-platform/katalyst-d2d/, accessed 22nd August 2023.
- Progenesis QI, https://www.nonlinear.com/progenesis/qi/, accessed 22nd August 2023.
- Mnova MSChrom, https://mestrelab.com/software/mnova/ms/, accessed 22nd August 2023.
- R. R. Steimbach, P. Kollmus and M. Santagostino, J. Org. Chem., 2021, 86, 1528–1539 CrossRef CAS PubMed.
- A. Osipyan, S. Shaabani, R. Warmerdam, S. V. Shishkina, H. Boltz and A. Domling, Angew. Chem., Int. Ed., 2020, 59, 12423–12427 CrossRef CAS PubMed.
- C. P. Haas, M. Lubbesmeyer, E. H. Jin, M. A. McDonald, B. A. Koscher, N. Guimond, L. Di Rocco, H. Kayser, S. Leweke, S. Niedenführ, R. Nicholls, E. Greeves, D. M. Barber, J. Hillenbrand, G. Volpin and K. F. Jensen, ACS Cent. Sci., 2023, 9, 307–317 CrossRef CAS PubMed.
- B. C. Jansen, L. Hafkenscheid, A. Bondt, R. A. Gardner, J. L. Hendel, M. Wuhrer and D. I. R. Spencer, PLoS One, 2018, 13, e0200280 CrossRef PubMed.
- J. Mason, F. Rianjongdee, H. Wilders and D. J. Fallon, 2023, DOI: DOI:10.5281/zenodo.8267220. https://github.com/thatchemistryguy/PyParse, accessed 22nd August 2023.
- Waters OpenLynx, https://www.waters.com/nextgen/ie/en/library/application-notes/2007/openlynx-open-access-and-software-tools-for-managing-an-open-access-laboratory-environment.html, accessed 22nd August 2023.
- See ESI† for guidance and examples of the command line operation para006Deters.
- J. Huang, J. Chan, Y. Chen, C. J. Borths, K. D. Baucom, R. D. Larsen and M. M. Faul, J. Am. Chem. Soc., 2010, 132, 3674–3675 CrossRef CAS PubMed.
- C. Verrier, T. Martin, C. Hoarau and F. Marsais, J. Org. Chem., 2008, 73, 7383–7386 CrossRef CAS PubMed.
- N. A. Strotman, H. R. Chobanian, Y. Guo, J. He and J. E. Wilson, Org. Lett., 2010, 12, 3578–3581 CrossRef CAS PubMed.
- J. J. Dong, J. Roger, C. Verrier, T. Martin, R. Le Goff, C. Hoarau and H. Doucet, Green Chem., 2010, 12, 2053–2063 RSC.
- X. Shi, J. F. Soulé and H. Doucet, Adv. Synth. Catal., 2019, 361, 4748–4760 CrossRef CAS.
- T. Piou, Y. Slutskyy, N. J. Kevin, Z. Sun, D. Xiao and J. Kong, Org. Lett., 2021, 23, 1996–2001 CrossRef CAS PubMed.
- W. Chen and J. Yang, J. Organomet. Chem., 2018, 872, 24–30 CrossRef CAS.
- X. B. Shen, Y. Zhang, W. X. Chen, Z. K. Xiao, T. T. Hu and L. X. Shao, Org. Lett., 2014, 16, 1984–1987 CrossRef CAS PubMed.
- L. Theveau, C. Verrier, P. Lassalas, T. Martin, G. Dupas, O. Querolle, L. Van Hijfte, F. Marsais and C. Hoarau, Chem. Eur. J., 2011, 17, 14450–14463 CrossRef CAS PubMed.
- B. T. Ingoglia, C. C. Wagen and S. L. Buchwald, Tetrahedron, 2019, 75, 4199–4211 CrossRef CAS PubMed.
- Full plate design details can be found in the ESI†.
Footnote |
| † Electronic supplementary information (ESI) available. See DOI: https://doi.org/10.1039/d3dd00167a |
| This journal is © The Royal Society of Chemistry 2023 |