 Open Access Article
Artificial intelligence aided recognition and classification of DNA nucleotides using MoS2 nanochannels†
Sneha
Mittal
 ,
Souvik
Manna
 ,
Milan Kumar
Jena
and
Biswarup
Pathak
 *
*
Department of Chemistry, Indian Institute of Technology (IIT) Indore, Indore, Madhya Pradesh 453552, India. E-mail: biswarup@iiti.ac.in
First published on 12th September 2023
Abstract
Artificial intelligence (AI) has revolutionized the landscape of genomics, offering unprecedented opportunities for rapid and cost-effective single-molecule identification. Herein, with a goal of achieving ultra-rapid and high throughput DNA sequencing at the single nucleotide level, we propose AI-empowered MoS2 nanochannels as a proof-of-concept. The proposed nanochannel provides unique transmission and current–voltage (I–V) fingerprints for each nucleotide, enabling high-throughput DNA sequencing. Leveraging the XGBoost regression (XGBR) algorithm, the technology allows the prediction of DNA transmission fingerprints with a mean absolute error (MAE) as low as 0.03. Integration of SMILES (simplified molecular input line entry system) string generated RDKit fingerprints leads to a noteworthy reduction of 16% in the MAE values. In addition, the logistic regression (LR) algorithm achieves perfect classification accuracy of 100% for each quaternary, ternary, and binary DNA nucleotide. The interpretability of the LR algorithm is greatly enhanced through SHapley Additive exPlanations (SHAP) analysis. The proposed AI-empowered nanotechnology holds immense potential for personalized genomics, opening new avenues for precise and scalable DNA sequencing.
Introduction
High-throughput DNA sequencing is crucial for unravelling the genetic code, understanding biological processes, and advancing personalized medicine, making it a fundamental necessity in medicinal research and healthcare.1–4 Nanopore/nanochannel technology has now made it possible to sequence a chromosome-size long DNA at the single-molecule level with industrial scalability.5–8 Rajan et al. reported a proof-of-concept based study utilizing Fano resonance driven two dimensional molecular electronics spectroscopy for molecular fingerprinting, DNA sequencing, and cancerous methylated DNA nucleobase recognition through armchair graphene nanoribbons.9 The method helps in resolving the conductance signal overlapping issue in DNA sequencing. Transverse tunneling current-based DNA sequencing is a promising approach for single molecule identification of DNA nucleotides.10–12 The electrical conductance or transmission is one of the primary detection signatures in the nanopore/nanochannel-assisted single-molecule measurements. However, because of certain factors such as electrode nucleotide coupling, orientational variations, nucleotide electronic states, and motion of DNA passing through the electrodes, transmission profiles oftentimes exhibit a severe signal overlap, making it difficult to interpret the data with a high degree of accuracy.13,14 Besides, the state-of-the-art nanopore/nanochannel technology is expensive and time-consuming, and not directly suited for rapid identification and classification of DNA nucleotides. The search for a technology capable of highly accurate identification and classification of DNA nucleotides is an urgent and critical need of the hour.Because of size tunability, robustness, and compatibility with semiconductor technology, solid-state 2D materials have been extensively explored for DNA sequencing.10,15–17 Recently, transition metal dichalcogenides (TMDCs) have emerged as a highly promising candidate for de novo DNA sequencing applications, with MoS2 being particularly intensively investigated due to its high electron mobility and direct bandgap.18–20 According to a recent study by Farimani et al., MoS2 nanopores exhibit a notably higher signal-to-noise ratio (SNR > 15) for nucleobase detection when compared to graphene (SNR ∼ 3).20 In addition, MoS2 nanopores can operate without degradation for an extended duration of time, making it an attractive candidate for high throughput DNA sequencing.21
With recent advancements, artificial intelligence (AI) has emerged as a dominant platform for accurate identification of biomolecules, including but not limited to nucleotides,22–24 amino acids,25 viruses,26,27 bacteria,28,29 sugars,30 and so on. AI has the ability to distinguish between specimens of similar characteristics with a high degree of accuracy and without prior knowledge of readouts of the complete genome. To address the major issues of complexity in DNA signal interpretation and classification, in this study, we propose AI-empowered nanotechnology as a new tool for ultra-rapid and accurate identification and classification of DNA nucleotides. Given experimental feasibility and scalability, we use MoS2 nanochannels as a model field-effect-transistor (FET)-based device.18
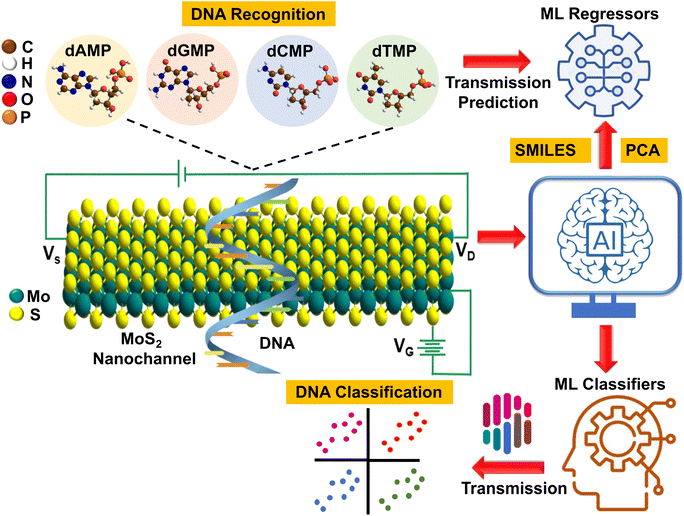
In our pursuit of AI-aided DNA recognition and classification, we took our first step by developing a highly efficient machine-learning (ML) tool that can predict the transmission fingerprints of all four DNA nucleotides. Afterward, using these transmission profiles, we aim to classify each quaternary, ternary, and binary DNA nucleotide and explore new avenues for interpretable ML-aided ultrafast, cost-effective, and high throughput DNA sequencing. To better illustrate our approach, a schematic is given that visually depicts the AI-aided DNA recognition and classification process (Fig. 1). Finally, a DFT (density functional theory) guide to experimental studies is provided by determining the key DNA fingerprints (sensitivity, current–voltage characteristics, adsorption energy, and translocation time) with a detailed understanding of molecular interactions, offering valuable insights and direction for future experimental research.
Results and discussion
ML aided DNA recognition
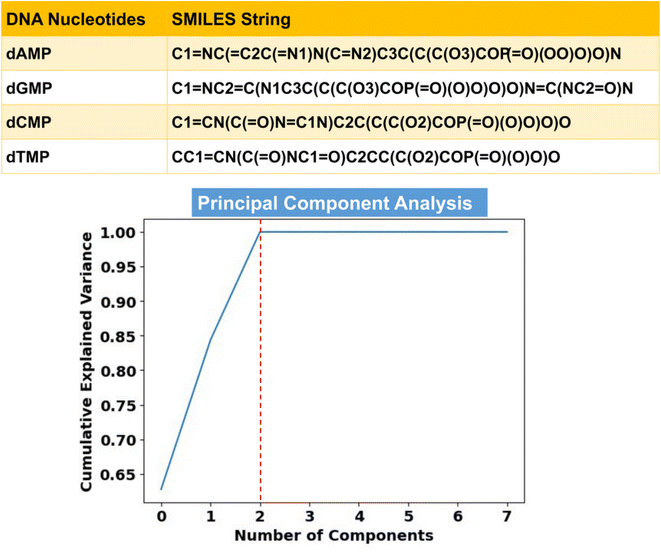
Toward ML-aided DNA recognition, our first step was to select the important input features. Herein, for the efficient training of the ML regression models in the prediction of transmission, we use RDKit fingerprints of DNA nucleotides as input features. RDKit is a widely used open-source cheminformatics toolkit that provides a comprehensive set of tools for handling and analyzing chemical structures and related data.31 RDKit tools encode molecular structures into fixed-length numerical vectors to generate characteristic fingerprints, which can capture the complex relationships between atoms and targeted properties and enable more accurate analysis of chemical compounds.32,33Herein, RDKit fingerprints are generated from molecular SMILES (simplified molecular input line entry system) strings, as shown in Fig. 2. SMILES features offer a distinct approach to represent chemical compounds through a linear notation using strings composed of a fixed set of characters.34,35 This unique representation allows for a standardized and consistent way of describing compound structures, enabling efficient processing and analysis of chemical information.
The extracted RDKit fingerprints enable the processing of DNA nucleotides with a comparable chemical composition, shape, and size while incorporating a comprehensive array (vector representation) of structural information. All the structural information of each DNA nucleotide (SMILES) has been encoded into a binary vector of length 2048 where each bit of fingerprint represents the presence or absence of a specific substructure or molecular feature within the molecule. On account of particular importance in transmission prediction, key features (described in Text S1†) derived from the elemental and molecular properties of the nucleotides have also been included in the input training dataset.36,37 In this respect, corresponding to a single DNA nucleotide, we have a total of 2048 RDKit fingerprints and 8 elemental and molecular features in the input training dataset. The details of ML regression tools are given in the ESI† (Text S1).
The next important step is to determine the output, i.e., the transmission function. To obtain the transmission profiles, we initially examined the most stable configuration (Fig. S1 and S2†) of each DNA nucleotide adsorbed on the MoS2 nanochannel surface. A detailed description of this assessment can be found in the ESI† (Text S2). Furthermore, we have employed a non-equilibrium Green's function (NEGF) combined DFT method, as applied in the TranSIESTA code, to calculate the transmission function.38,39 The transmission function T(E,Vb) is determined by using the equation,
| T(E,Vb) = Tr[ΓL(E)GC(E)ΓR(E)G†C(E)] |
To remove redundancy and reduce the dimensionality of the input feature vectors, we employ principal component analysis (PCA) from the ‘scikit-learn’ library (Text S1†).40 The cumulative explained variance plot in Fig. 2 demonstrates that only 3 principal components (PCs) are sufficient, leading to a substantial reduction in the input feature space dimension. Therefore, in place of 2056 features, we utilize these 3 PCs as inputs for learning of the ML algorithms. Since the transmission function (T) is a function of energy (E), it is necessary to include energy values as an important input feature vector. To this end, we have a total of 4 input features (3 PCs and 1 energy feature) in the input training dataset, having a total of 2000 transmission data points (500 data points for each nucleotide in the energy (E) range of ±2.5 eV).
Furthermore, we have employed four prevalent ML regression models, namely, XGBoost regression (XGBR), random forest regression (RFR), extra tree regression (ETR), and light gradient boosted machine regression (LGBM), which are available in the ‘scikit-learn’ library.40 To ensure the optimal performance of the models, we perform hyperparameter tuning using the RandomizedSearchCV method.40 The details of tuned hyperparameters for each ML regression model can be found in the ESI† (Table S2). The models are assessed based on their ability to predict unseen data by using 75% of the input data for training and 25% for testing. A performance metric, the mean absolute error (MAE) has been utilized to analyze the model's performance in the prediction of the test dataset. To ensure the stability and generalization of the ML models, we have performed 10-fold cross-validation (Text S1†) and calculated the MAE and standard deviation for each fold, as shown in Table 1. The close similarity between the mean MAE values from 10-fold cross-validation and the test MAE values indicates that the models are stable and can be reliably generalized to a new dataset. Looking at the test MAE values, the XGBR model is found to be the best-fitted model with a minimum test MAE score of 0.15, which may be due to its high scalability and capability of handling large datasets with complex non-linear relationships between input features and output variables.41
| Fold | XGBR | RFR | ETR | LGBR |
|---|---|---|---|---|
| 1 | 0.19 | 0.28 | 0.38 | 0.53 |
| 2 | 0.12 | 0.20 | 0.36 | 0.45 |
| 3 | 0.16 | 0.25 | 0.42 | 0.43 |
| 4 | 0.18 | 0.16 | 0.26 | 0.37 |
| 5 | 0.15 | 0.27 | 0.49 | 0.54 |
| 6 | 0.21 | 0.19 | 0.28 | 0.44 |
| 7 | 0.22 | 0.27 | 0.38 | 0.53 |
| 8 | 0.18 | 0.27 | 0.41 | 0.52 |
| 9 | 0.15 | 0.15 | 0.34 | 0.42 |
| 10 | 0.22 | 0.19 | 0.34 | 0.38 |
| Mean MAE ± standard deviation | 0.17 ± 0.03 | 0.22 ± 0.04 | 0.36 ± 0.06 | 0.46 ± 0.06 |
| Test MAE | 0.15 | 0.25 | 0.38 | 0.47 |
Furthermore, to ensure the stability of the best-fitted model XGBR, evaluation of the scatter plot between train-test predictions and population stability index (PSI) analysis is carried out (Fig. S3†). The details of PSI analysis can be found in the ESI† (Text S1). The train-test scatter plot displays a tight cluster of points that follows the ideal diagonal line. Additionally, the PSI values for both fixed-size and quantile bins were found to be low. These findings provide strong evidence that the model XGBR is stable and can make consistent predictions on unseen data.
To provide an insight into the importance of SMILE string generated RDKit fingerprints, we tried to check the performance of the best fitted XGBR model in the absence of RDKit features. In this prediction, we observed an increase of 16% in the MAE value. This finding sincerely establishes the pertinency of RDKit fingerprints in more accurate DNA recognition with de novo feasibility. The train-test scatter plot in the RDKit fingerprint eliminated XGBR prediction can be found in the ESI† (Fig. S4). To get a better understanding of how these molecular and elemental features (without RDKit fingerprints) are correlated and their relative importance toward the model's prediction, Pearson's feature correlation (Fig. S5†) and the feature importance plot (Fig. S6†) are also studied. The feature correlation plot suggests that there is a strong correlation between the feature’s average ionic radius and average covalent radius. In addition, the features HOMO and LUMO are also highly correlated. The feature importance plot suggests that the feature energy is of utmost importance. This is expected because the output transmission is the function of energy itself. Among the elemental and molecular features, the feature’s average valence electrons, average electronegativity, and average atomic radius are found to be of relatively higher importance.
In transverse-tunneling based next-generation DNA sequencing, the primary step is to determine the transmission fingerprints of DNA nucleotides. In order to check the potential of the proposed AI-empowered nanotechnology toward DNA sequencing, we shift our focus to ML-assisted identification of DNA nucleotides. Our ML-aided prediction of transmission fingerprints of DNA nucleotides is based on two key observations. First, calling of partially unknown DNA nucleotides, and second, calling of completely unknown DNA nucleotides. These two observations will help in rigorous inspection of the best-fitted model for accurate prediction of transmission fingerprints of DNA nucleotides.
Calling of partially unknown DNA nucleotides
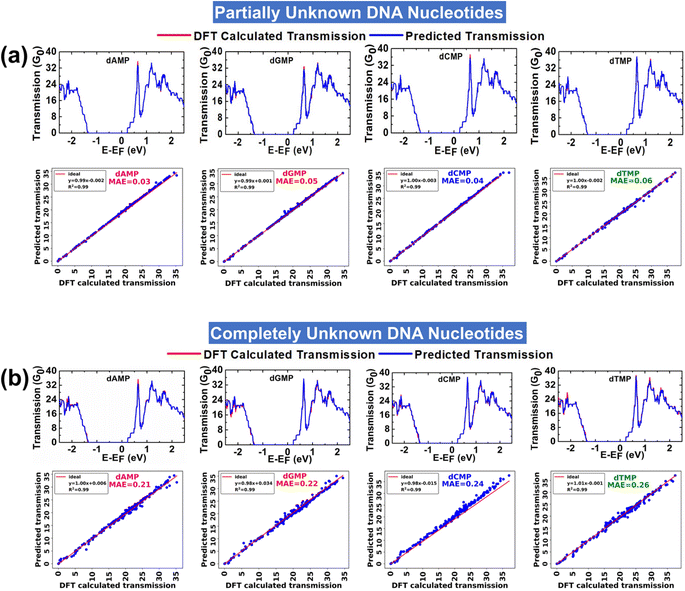
In the prediction of each partially unknown DNA nucleotide, the model is trained with 75% of input data of all four DNA nucleotides. The analysis aims to evaluate the performance of the XGBR model toward interpretation of a complex dataset of all four DNA nucleotides. Fig. 3a shows the DFT calculated and ML predicted transmission spectra for partially unknown DNA nucleotides at an energy interval of ±2.5 eV. A corresponding scatter plot between the DFT calculated and ML predicted transmission function for each partially unknown DNA nucleotide is also given. The model predicted each partially unknown DNA nucleotide with MAE values in the range of 0.03–0.06 and a nearly perfect coefficient of determination (R2) value of ∼0.99. The findings indicate that the XGBR model exhibits high precision in discerning the transmission profiles of individual DNA nucleotides from complex (or noisy) transmission arrays of the four DNA nucleotides.Calling of completely unknown DNA nucleotides
In the prediction of each completely unknown DNA nucleotide, the model is trained with 75% of input data of the remaining three nucleotides, e.g., in the prediction of dAMP, the model is trained with the dataset of the remaining three nucleotides (dGMP, dCMP, and dTMP). This analysis would help in analyzing the performance of XGBR toward prediction of nucleotides of an unknown DNA sample. Corresponding to four completely unknown DNA nucleotides, we have a total of four input training datasets. We have named the models XGBR 1, XGBR 2, XGBR 3, and XGBR 4 for the prediction of completely unknown dAMP, dGMP, dCMP, and dTMP, respectively.The DFT calculated and ML predicted transmission spectra for completely unknown DNA nucleotides at an energy interval of ±2.5 eV are shown in Fig. 3b. The corresponding scatter plots between DFT calculated and ML predicted transmission functions are also given. The model predicted each completely unknown DNA nucleotide with MAE values in the range of 0.21–0.26 and a nearly perfect R2 value of 0.99. The MAE values for completely unknown DNA nucleotides are noticeably higher than those for partially unknown ones. This disparity arises because when predicting partially unknown nucleotides, the machine is trained with 75% of the dataset, which includes some known values. Conversely, in the case of completely unknown nucleotides, the machine encounters distinct features not present in the training data, resulting in higher prediction errors.
To ensure the robustness and reliability of the utilized XGBR models, we have performed 10-fold cross-validation. In all XGBR models, the test MAE values are close to the mean MAE values of each fold of 10-fold cross-validation, which indicates that the models are stable (Table 2). In addition, for each XGBR model, we have also studied the learning curve and PSI scores. The learning curves exhibit a consistent decrease in MAE values for both the training and test datasets (Fig. S7a†) while maintaining consistently low PSI values for both fixed and quantile size bins (Fig. S7b†). These findings suggest that the XGBR models exhibit robust performance and maintain stable predictions across different input datasets. In light of all these results, we conclude that proposed AI-empowered MoS2 nanochannel has the potential to alleviate the experimental complexity by providing ultra-rapid and distinct transmission fingerprints of each DNA nucleotide. After successfully establishing the pertinency of AI-empowered-nanotechnology in high-precision identification of DNA nucleotides, we turn our attention to explore its potential in classification of DNA nucleotides.
| Fold | XGBR 1 | XGBR 2 | XGBR 3 | XGBR 4 |
|---|---|---|---|---|
| 1 | 0.24 | 0.18 | 0.15 | 0.20 |
| 2 | 0.27 | 0.30 | 0.22 | 0.14 |
| 3 | 0.21 | 0.24 | 0.22 | 0.28 |
| 4 | 0.32 | 0.21 | 0.19 | 0.13 |
| 5 | 0.22 | 0.18 | 0.24 | 0.19 |
| 6 | 0.23 | 0.18 | 0.28 | 0.19 |
| 7 | 0.23 | 0.22 | 0.23 | 0.22 |
| 8 | 0.21 | 0.16 | 0.21 | 0.18 |
| 9 | 0.27 | 0.21 | 0.29 | 0.18 |
| 10 | 0.17 | 0.14 | 0.22 | 0.18 |
| Mean MAE ± standard deviation | 0.24 ± 0.03 | 0.20 ± 0.04 | 0.22 ± 0.03 | 0.19 ± 0.03 |
| Test MAE | 0.22 | 0.17 | 0.18 | 0.13 |
ML-aided DNA classification
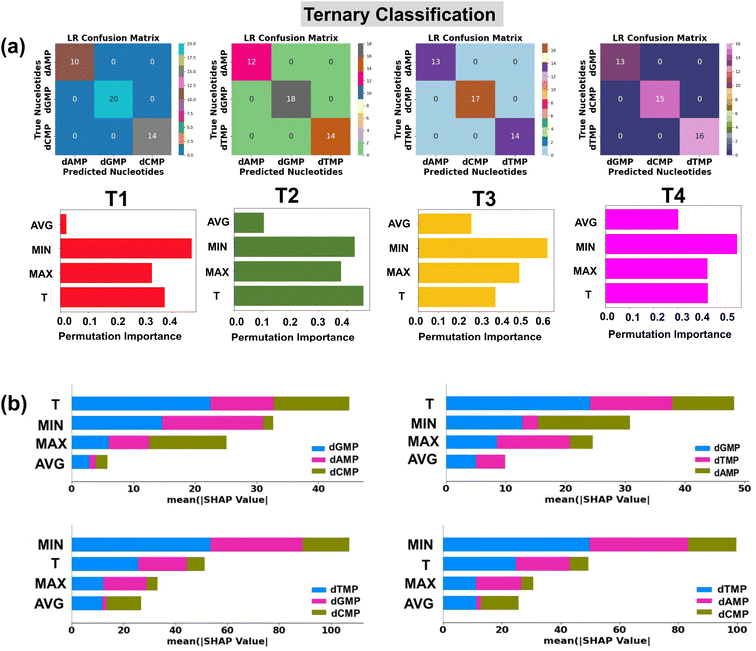
In traditional DNA sequencing, the next cumbersome step is to assign the computed transmission fingerprints to each individual nucleotide. However, conventional methods for analyzing fingerprints often suffer from poor resolution, as signal overlap can make it difficult to distinguish the nucleotides from their DNA counterparts. As in real measurements, each sensitivity histogram corresponds to the transmission function profile of a single nucleotide, and it is likely that all four DNA nucleotides contribute to the real transmission profile with a certain degree of probability. Hence for more robust and accurate identification, it is necessary to check the performance of the proposed AI-empowered MoS2 nanochannel in each quaternary, ternary, and binary classification of DNA nucleotides. With this goal, we started to explore the potential of supervised ML classification algorithms in the identification of each class of DNA nucleotides. The details of ML classification tools are given in the ESI† (Text S3).Quaternary classification
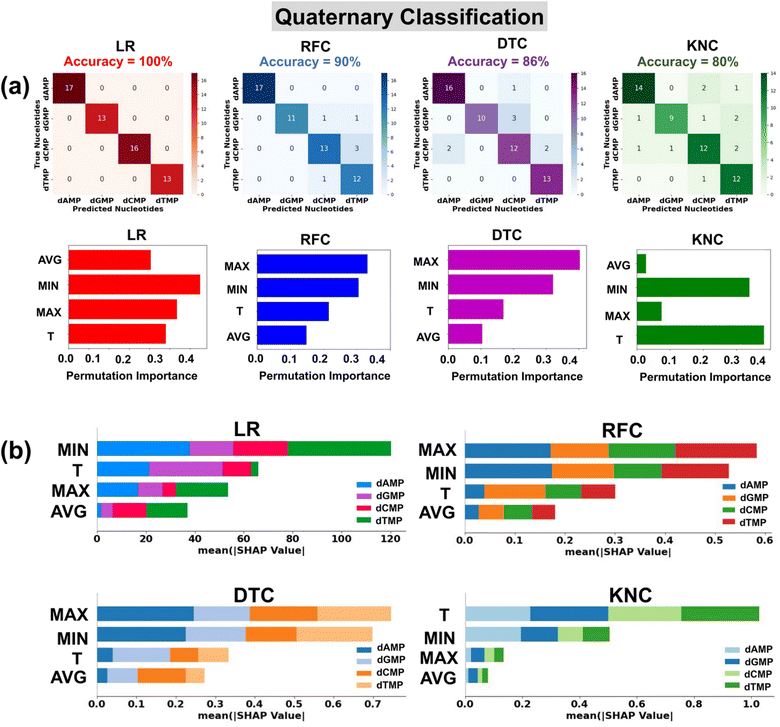
In the preparation of a classification input dataset, we have considered a total of four input features extracted from the transmission profiles of DNA nucleotides. A detailed description of these input features is provided in the ESI (Table S3†). Herein, for robust classification, we have considered the energy range of −2.5 to −1.7 eV having a total of 292 data points (73 data points for each nucleotide) in the input dataset for all four DNA nucleotides. We have utilized four prevalent classification algorithms, namely, logistic regression (LR), random forest classification (RFC), decision tree classification (DTC), and k-nearest neighbor classification (KNC) with tuned hyperparameters. The details of optimized hyperparameters are provided in the ESI† (Table S4). 80% of the input data is used for training of the models, while the rest 20% is used as a test dataset.To ensure the used model's generalizability and stability, we have performed 10-fold cross-validation (Table 3). For each classification model, the mean MAE values are close to the test MAE values, which indicates that the models are stable and generalized. The confusion matrices show the performance of the used classification models in the prediction of each class of DNA nucleotides from a quaternary dataset (Fig. 4a). Among the utilized models, the LR model is found to be the best fitted with a perfect accuracy of 100%.
| Fold | LR (%) | RFC (%) | DTC (%) | KNC (%) |
|---|---|---|---|---|
| 1 | 100 | 83 | 83 | 75 |
| 2 | 100 | 79 | 83 | 75 |
| 3 | 100 | 96 | 79 | 83 |
| 4 | 100 | 83 | 87 | 78 |
| 5 | 100 | 74 | 65 | 56 |
| 6 | 100 | 78 | 74 | 74 |
| 7 | 100 | 91 | 91 | 78 |
| 8 | 100 | 91 | 87 | 56 |
| 9 | 100 | 87 | 83 | 87 |
| 10 | 100 | 87 | 87 | 83 |
| Mean accuracy ± standard deviation | 100 ± 0.00 | 85 ± 6.78 | 82 ± 7.60 | 74.5 ± 10.59 |
| Test accuracy | 100 | 90 | 86 | 80 |
To ensure no overfitting of the LR model, we have checked the performance of LR models with different train-test split ratios (Fig. S9†). In each case of different train-test split ratios, the calculated accuracy of LR is 100%. However, when tested on a larger dataset (in the energy range of ±2.5 eV having a total of 2000 input data points), the model's accuracy dropped to 23%. This indicates that the LR model can accurately identify each DNA nucleotide class with 100% accuracy only in the specific energy range of −2.5 to −1.7 eV.
The classification reports consisting of parameter precision, recall, and F1-score for each utilized classification model are given in the ESI† (Fig. S8). The details of the accuracy score and classification parameters can be found in the ESI† (Text S3). To shed light on the interpretation of the used ML classification models, the permutation feature importance plots are studied (Fig. 4a).40 It is noticed that the features MIN, MAX, and T are of relatively higher importance in the output prediction of LR, DTC/RFC, and KNC models, respectively. To further understand the contribution of input features toward prediction of each class of DNA nucleotides, SHAP summary bar plots are analyzed (Fig. 4b).42 Comparing the heights of different bars, one can assess the relative importance of features toward prediction of individual classes of DNA nucleotides. Features with taller bars have a stronger influence on the model's predictions compared to those with shorter bars.
Quaternary classification with rotation dynamics
In the quaternary classification given above, we utilized the transmission fingerprints of the most stable configuration of DNA nucleotides. However, in a realistic picture, these nucleotides may undergo several orientational and configurational variations. Hence for robust classification, it is necessary to check the performance of the best-fitted model in the prediction of DNA nucleotides with orientational variations. In order to check this, we try to predict the DNA nucleotides for each considered seven rotations of DNA nucleotides. Confusion matrices for each rotation matrix show a perfect accuracy of 100% in LR-assisted prediction of the class of each nucleotide in different rotated configurations, as given in the ESI† (Fig. S10a).The feature importance plots show the significant contribution of each utilized feature toward the prediction of the output (Fig. S10b†). The results suggest that each utilized input feature is of particular importance in the prediction of nucleotide classes of different rotated configurations. Furthermore, to introduce transparency in the prediction of rotation dynamics, SHAP summary bar plots are analyzed (Fig. S10c†). A notable contribution of T and MIN input features is observed toward LR prediction of nucleotide classes with different rotated configurations. In light of these results, we conclude that our proposed interpretable LR-assisted AI-empowered MoS2 nanochannel can predict the class of each DNA nucleotide in different rotated configurations with a perfect accuracy of 100%.
Binary classification
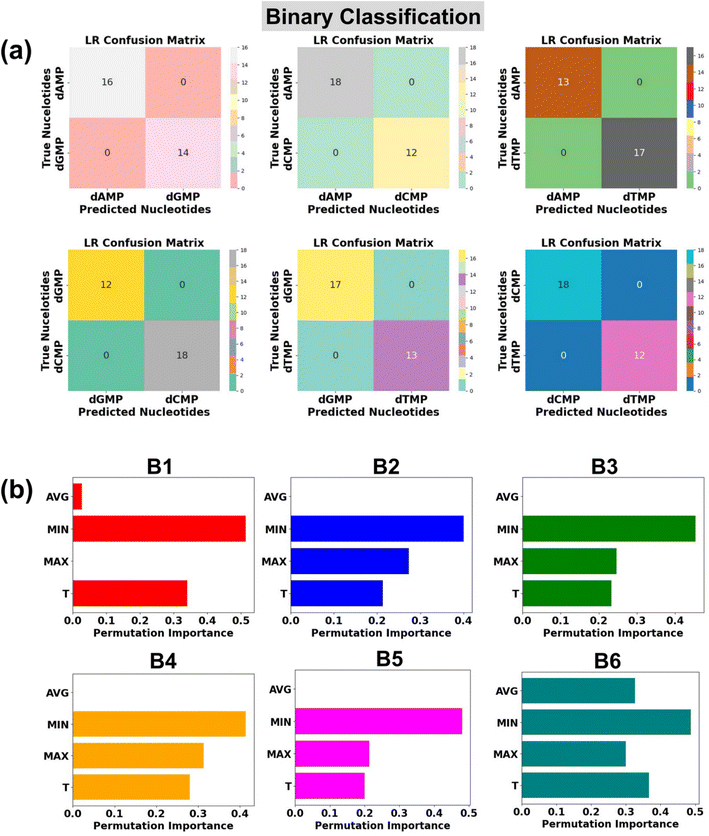
In the realm of high throughput DNA sequencing, an intriguing quest is the identification of two classes of DNA nucleotides: purine (dAMP and dGMP) and pyrimidine (dCMP and dTMP). With this in mind, we further check the potential of the LR algorithm in the classification of binary DNA nucleotides. There are six possible combinations of two types of nucleotides: (B1: dAMP and dGMP), (B2: dAMP and dCMP), (B3: dAMP and dTMP), (B4: dGMP and dCMP), (B5: dGMP and dTMP), and (B6: dCMP and dTMP).In each case of binary DNA nucleotides, we observed a perfect accuracy of 100%, which suggests that the proposed AI-empowered nanotechnology can individually identify the class of single nucleotides from complex datasets of two types of nucleotides (Fig. 6a). A better understanding of how each feature is affecting the model's performance can be found in the given permutation feature importance plot (Fig. 6b). As compared to other features, the feature MIN is found to be of higher importance toward binary classification of DNA nucleotides which is also in good agreement with feature importance results of ternary classification. The promising capability of the proposed AI-empowered MoS2 nanochannel in accurately predicting quaternary (with and without rotation dynamics), ternary, and binary DNA nucleotides, significantly enhances its potential for practical implementation in real DNA sequencing.
It is interesting to note that the ‘MIN’ and ‘T’ features have a higher impact, and the ‘AVG’ feature has the least influence in each quaternary, ternary, and binary classification of DNA nucleotides. This observation could be attributed to the difference in the coupling strength of the MoS2 electrode-to-nucleotide molecular orbitals (MOs). The features ‘MIN’, and ‘AVG’ are extracted from the transmission profiles of each unlabelled nucleotide by dividing the minimum (Tmin) and average values (Tavg) of the transmission function with each datapoint of the corresponding nucleotide dataset. Tmin is the minimum transmission value with minimum coupling strength, which is noted to be distinct for each nucleotide. Hence, when the transmission values are divided by the minimum value, it significantly changes the scale of the feature values corresponding to overlapped signals of each DNA nucleotide and enhances the distinguishability. On the other hand, the Tavg is the average of the transmission values, so when the transmission values are divided by the average value, it gives a similar value and therefore leads to less distinguishability among the DNA nucleotides.
A DFT guide to experimental studies
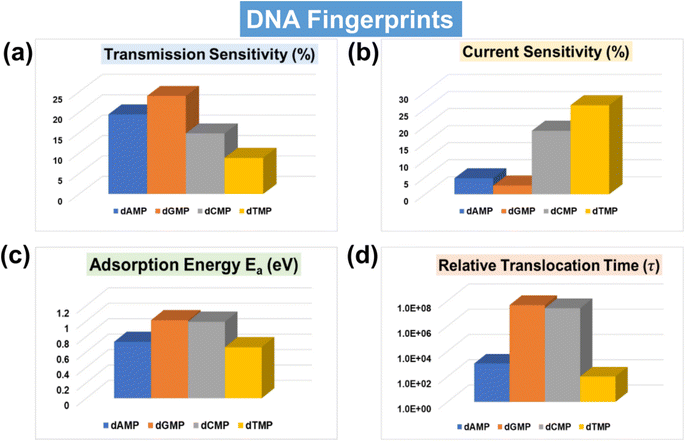
With a solid foundation established for ultra-rapid and accurate DNA identification and classification using the AI-empowered MoS2 nanochannel, our focus now shifts towards offering comprehensive qualitative and quantitative guidance for real measurements by evaluating the key fingerprints of DNA nucleotides. One of the important experimental parameters is sensitivity, which determines the capability of the sensing device toward single-nucleotide resolution. In order to thoroughly analyze the electric detection capabilities of the proposed MoS2 nanochannel FET-based device, we have calculated both transmission and current-sensitivity values, as shown in Fig. 7a and b. The details of transmission and current-sensitivity calculations can be found in the ESI† (Text S4). Our results demonstrate that the proposed device exhibits potential for sensitive and selective identification of DNA nucleotides, with transmission sensitivity values standing out as particularly noteworthy. For a better understanding, the related transmission and current–voltage (I–V) signature plots of DNA nucleotides adsorbed on the proposed MoS2 nanochannel device are provided in the ESI† (Fig. S11a and b). These DFT results of transmission and current–voltage (I–V) fingerprints further validate the efficacy of AI-empowered MoS2 nanochannels in high throughput DNA sequencing. A visual understanding of the underlying physics, accompanied by a detailed explanation, is given in the ESI† (Fig. S12).Because of key importance in real DNA sequencing, the adsorption energy (Ea) and translocation time (τ) have also been calculated (Fig. 7c, d and Table S5†). A visual understanding of interactions between the MoS2 nanochannel surface and DNA nucleotides can be found in the studied charge density difference plot (Fig. S13†). The plot indicates strong overlapping between the electron clouds of dGMP/dCMP and S atoms of the MoS2 nanochannel surface, leading to relatively high adsorption energy. Fig. 7 provides a quick review of all the key DNA signature fingerprints in a single glance. Notably, the transmission and current sensitivity fingerprints stand out as particularly significant. For the experimental viability of the proposed device, the effect of configurational variations on the transmission fingerprints has also been studied (Fig. S14†). The figure shows a negligible change in transmission due to orientational variations, showing the feasibility of the proposed MoS2 nanochannel device in DNA sequencing with less signal overlap or unwanted noise.
Conclusions
To achieve the formidable goal of ultra-rapid, accurate, and cheap DNA sequencing, in the present study, we propose an AI-empowered MoS2 nanochannel that enables ultra-rapid and high-precision recognition and classification of DNA nucleotides. By leveraging easily accessible features, the XGBR algorithm can accurately determine the transmission fingerprints of each individual DNA nucleotide with a MAE value as low as 0.03 and nearly perfect R2 value of ∼0.99. The best fitted LR algorithm exhibits a perfect accuracy of 100% for the prediction of individual classes of quaternary, ternary, and binary DNA nucleotides. The permutation feature importance analysis and SHAP beeswarm plot are utilized to enhance the LR model's interpretability at both global and local levels. With DFT validation, we found that the XGBR model can recognize completely unknown DNA nucleotides with good accuracy. Next, to provide a comprehensive and qualitative guide to experimental studies, we evaluate the key fingerprints of DNA nucleotides, such as adsorption energy, translocation time, I–V characteristics, and sensitivity, with a deep understanding of the underlying physics. The transmission and current sensitivity fingerprints are observed to be particularly noteworthy for high-precision nucleotide identification. In this regard, the proposed AI-empowered nanotechnology offers exciting new opportunities for rapid and more accurate DNA sequencing and can significantly alleviate the complexity of theoretical and experimental studies. Undoubtedly, further exploration and experimental application of AI-empowered MoS2 nanochannels holds immense potential in whole genome sequencing, potentially leading to personalized genomics and beyond.Data availability
All the details of DFT data production are given in the ESI.† All the machine learning databases are available at https://doi.org/10.5281/zenodo.8063774. The software tools utilized in this work are SIESTA (https://gitlab.com/siesta-project/siesta), TranSIESTA (https://gitlab.com/siesta-project/siesta/-/releases/v4.1.5), Python (https://www.python.org/), and Google collab (https://colab.google/).Author contributions
S. M.: conceptualization, computational calculations, formal analysis, and writing-original draft; S. M. & M. K. J.: formal analysis-review and writing-review and editing; B. P.: conceptualization, resources, writing-review and editing, supervision, and funding acquisition.Conflicts of interest
The authors declare no competing financial interest.Acknowledgements
This work was supported by grants DST-SERB (project number: CRG/2018/001131 and CRG/2022/000836), and CSIR (project number: 01(3046)/21/EMR-II). S. M., S. M., and M. K. J. acknowledge UGC, Prime Minister's Research Fellowship (PMRF), and MHRD for a research fellowship, respectively.References
- F. S. Collins, E. D. Green, A. E. Guttmacher and M. S. Guyer, Nature, 2003, 422, 835–847 CrossRef CAS PubMed.
- C. Dekker, Nat. Nanotechnol., 2007, 2, 209–215 CrossRef CAS PubMed.
- D. Branton, D. W. Deamer, A. Marziali, H. Bayley, S. A. Benner, T. Butler, M. Di Ventra, S. Garaj, A. Hibbs, X. Huang, S. B. Jovanovich, P. S. Krstic, S. Lindsay, X. S. Ling, C. H. Mastrangelo, A. Meller, J. S. Oliver, Y. V. Pershin, J. M. Ramsey, R. Riehn, G. V. Soni, V. Tabard-Cossa, M. Wanunu, M. Wiggin and J. A. Schloss, Nat. Biotechnol., 2008, 26, 1146–1153 CrossRef CAS PubMed.
- J. A. Schloss, Nat. Biotechnol., 2008, 26, 1113–1115 CrossRef CAS PubMed.
- M. Zwolak and M. Di Ventra, Nano Lett., 2005, 5, 421–424 CrossRef CAS PubMed.
- J. Lagerqvist, M. Zwolak and M. Di Ventra, Nano Lett., 2006, 6, 779–782 CrossRef CAS PubMed.
- D. Deamer, M. Akeson and D. Branton, Nat. Biotechnol., 2016, 34, 518–524 CrossRef CAS PubMed.
- S. K. Min, W. Y. Kim, Y. Cho and K. S. Kim, Nat. Nanotechnol., 2011, 6, 162–165 CrossRef CAS PubMed.
- A. C. Rajan, M. R. Rezapour, J. Yun, Y. Cho, W. J. Cho, S. K. Min, G. Lee and K. S. Kim, ACS Nano, 2014, 8, 1827–1833 CrossRef CAS PubMed.
- S. J. Heerema and C. Dekker, Nat. Nanotechnol., 2016, 11, 127–136 CrossRef CAS PubMed.
- M. Di Ventra and M. Taniguchi, Nat. Nanotechnol., 2016, 11, 117–126 CrossRef CAS PubMed.
- H. Qiu, W. Zhou and W. Guo, ACS Nano, 2021, 15, 18848–18864 CrossRef CAS PubMed.
- M. Zwolak and M. Di Ventra, Rev. Mod. Phys., 2008, 80, 141–165 CrossRef.
- M. Krems, M. Zwolak, Y. V. Pershin and M. Di Ventra, J. Biophys., 2009, 97, 1990–1996 CrossRef CAS PubMed.
- S. M. Iqbal, D. Akin and R. Bashir, Nat. Nanotechnol., 2007, 2, 243–248 CrossRef CAS PubMed.
- K. Venta, G. Shemer, M. Puster, J. A. Rodríguez-Manzo, A. Balan, J. K. Rosenstein, K. Shepard and M. Drndić, ACS Nano, 2013, 7, 4629–4636 CrossRef CAS PubMed.
- S. Liu, B. Lu, Q. Zhao, J. Li, T. Gao, Y. Chen, Y. Zhang, Z. Liu, Z. Fan, F. Yang, L. You and D. Yu, Adv. Mater., 2013, 25, 4549–4554 CrossRef CAS PubMed.
- J. Feng, K. Liu, R. D. Bulushev, S. Khlybov, D. Dumcenco, A. Kis and A. Radenovic, Nat. Nanotechnol., 2015, 10, 1070–1076 CrossRef CAS PubMed.
- M. Graf, M. Lihter, D. Altus, S. Marion and A. Radenovic, Nano Lett., 2019, 19, 9075–9083 CrossRef CAS PubMed.
- A. B. Farimani, K. Min and N. R. Aluru, ACS Nano, 2014, 8, 7914–7922 CrossRef CAS PubMed.
- J. Feng, K. Liu, M. Graf, M. Lihter, R. D. Bulushev, D. Dumcenco, D. T. L. Alexander, D. Krasnozhon, T. Vuletic, A. Kis and A. Radenovic, Nano Lett., 2015, 15, 3431–3438 CrossRef CAS PubMed.
- M. Taniguchi, T. Ohshiro, Y. Komoto, T. Takaai, T. Yoshida and T. Washio, J. Phys. Chem. C, 2019, 123, 15867–15873 CrossRef CAS.
- J. Im, S. Sen, S. Lindsay and P. Zhang, ACS Nano, 2018, 12, 7067–7075 CrossRef CAS PubMed.
- S. Biswas, S. Sen, J. Im, S. Biswas, P. Krstic, B. Ashcroft, C. Borges, Y. Zhao, S. Lindsay and P. Zhang, ACS Nano, 2016, 10, 11304–11316 CrossRef CAS PubMed.
- Y. Zhao, B. Ashcroft, P. Zhang, H. Liu, S. Sen, W. Song, J. Im, B. Gyarfas, S. Manna, S. Biswas, C. Borges and S. Lindsay, Nat. Nanotechnol., 2014, 9, 466–473 CrossRef CAS PubMed.
- A. Arima, I. H. Harlisa, T. Yoshida, M. Tsutsui, M. Tanaka, K. Yokota, W. Tonomura, J. Yasuda, M. Taniguchi, T. Washio, M. Okochi and T. Kawai, J. Am. Chem. Soc., 2018, 140, 16834–16841 CrossRef CAS PubMed.
- M. Taniguchi, S. Minami, C. Ono, R. Hamajima, A. Morimura, S. Hamaguchi, Y. Akeda, Y. Kanai, T. Kobayashi, W. Kamitani, Y. Terada, K. Suzuki, N. Hatori, Y. Yamagishi, N. Washizu, H. Takei, O. Sakamoto, N. Naono, K. Tatematsu, T. Washio, Y. Matsuura and K. Tomono, Nat. Commun., 2021, 12, 3726 CrossRef CAS PubMed.
- M. Tsutsui, T. Yoshida, K. Yokota, H. Yasaki, T. Yasui, A. Arima, W. Tonomura, K. Nagashima, T. Yanagida, N. Kaji, M. Taniguchi, T. Washio, Y. Baba and T. Kawai, Sci. Rep., 2017, 7, 17371 CrossRef PubMed.
- M. Tsutsui, M. Tanaka, T. Marui, K. Yokota, T. Yoshida, A. Arima, W. Tonomura, M. Taniguchi, T. Washio, M. Okochi and T. Kawai, Anal. Chem., 2018, 90, 1511–1515 CrossRef CAS PubMed.
- J. Im, S. Biswas, H. Liu, Y. Zhao, S. Sen, S. Biswas, B. Ashcroft, C. Borges, X. Wang, S. Lindsay and P. Zhang, Nat. Commun., 2016, 7, 13868 CrossRef CAS PubMed.
- G. Landrum, RDKit: Open-Source Cheminformatics Software, http://www.rdkit.org/ Search PubMed.
- N. Schneider, R. A. Sayle and G. A. Landrum, J. Chem. Inf. Model., 2015, 55, 2111–2120 CrossRef CAS PubMed.
- A. Capecchi, D. Probst and J.-L. Reymond, J. Cheminf., 2020, 12, 43 CAS.
- D. Weininger, J. Chem. Inf. Comput. Sci., 1988, 28, 31–36 CrossRef CAS.
- D. Weininger, A. Weininger and J. L. Weininger, J. Chem. Inf. Comput. Sci., 1989, 29, 97–101 CrossRef CAS.
- T. Furuhata, T. Ohshiro, G. Akimoto, R. Ueki, M. Taniguchi and S. Sando, ACS Nano, 2019, 13, 5028–5035 CrossRef CAS PubMed.
- J. Prasongkit, A. Grigoriev, B. Pathak, R. Ahuja and R. H. Scheicher, Nano Lett., 2011, 11, 1941–1945 CrossRef CAS PubMed.
- S. Datta, Superlattices Microstruct., 2000, 28, 253–278 CrossRef CAS.
- M. Brandbyge, J.-L. Mozos, P. Ordejón, J. Taylor and K. Stokbro, Phys. Rev. B: Condens. Matter Mater. Phys., 2002, 65, 165401 CrossRef.
- F. Pedregosa, G. Varoquaux, A. Gramfort, V. Michel, B. Thirion, O. Grisel, M. Blondel, P. Prettenhofer, R. Weiss, V. Dubourg, J. Vanderplas, A. Passos, D. Cournapeau, M. Brucher, M. Perrot and É. Duchesnay, J. Mach. Learn. Res., 2011, 12, 2825–2830 Search PubMed.
- T. Chen and C. Guestrin, in Proceedings of the 22nd ACM SIGKDD International Conference on Knowledge Discovery and Data Mining, Association for Computing Machinery, New York, NY, USA, 2016, pp. 785–794 Search PubMed.
- S. M. Lundberg, G. Erion, H. Chen, A. DeGrave, J. M. Prutkin, B. Nair, R. Katz, J. Himmelfarb, N. Bansal and S.-I. Lee, Nat. Mach. Intell., 2020, 2, 56–67 CrossRef PubMed.
Footnote |
| † Electronic supplementary information (ESI) available: ML aided DNA recognition; hyperparameter tuning of ML regression models; stability check of the best-fitted XGBR model; RDKit fingerprint eliminated XGBR prediction Pearson's correlation matrix; RDKit fingerprint eliminated feature importance plot ensuring stability of XGBR models; ML aided DNA classification; hyperparameter tuning of classification models; classification reports; stability check of the best-fitted LR classification algorithm; single nucleotide identification for rotation dynamics; transmission and current–voltage plots; adsorption energy and translocation time; charge density difference plots; effect of in-plane rotation on transmission function. See DOI: https://doi.org/10.1039/d3dd00118k |
| This journal is © The Royal Society of Chemistry 2023 |

