
 Open Access Article
 This Open Access Article is licensed under a
 Creative Commons Attribution 3.0 Unported Licence
Improving scientific image processing accessibility through development of graphical user interfaces for scikit-image
Mikael
Kuwahara
,
Jun
Fujima
,
Keisuke
Takahashi
 * and
Lauren
Takahashi
*
* and
Lauren
Takahashi
*
Department of Chemistry, Hokkaido University, North 10, West 8, Sapporo 060-0810, Japan. E-mail: keisuke.takahashi@sci.hokudai.ac.jp; lauren.takahashi@sci.hokudai.ac.jp
First published on 21st April 2023
Abstract
Catalyst informatics has garnered a lot of attention within the research community as it is a very powerful method for discovering and understanding catalysts from the data perspective. However, while the availability of image data such as microscopy data is also growing exponentially, image analysis has not enjoyed the same degree of success as cases that deal with textual or numerical data. Not only are there not many tools available for image processing, but also the tools that do exist require a large degree of experience with programming and computer science, limiting the number of people who are able to conduct image processing. Thus, there is a growing need for accessible tools geared towards image processing and segmentation. Graphical user interfaces (GUIs) for image processing tools offered by Python library scikit-image are developed and implemented in previously developed catalyst informatics platform CADS (https://cads.eng.hokudai.ac.jp/). Architecture and development of the GUIs are investigated and several cases of image processing are explored.
1 Introduction
Image data has grown exponentially and become readily accessible due to advances in technology, leading to the establishment of data science and informatics.1–5 Furthermore, image data obtained by microscopy such as scanning electron microscopy (SEM) and transmission electron microscopy (TEM) has dramatically increased. However, despite the growing accessibility, there are various issues faced when attempting to apply data science to image processing. Typically, data-centered research involves textual and numerical data, which are then analyzed using data science techniques in order to uncover underlying information, trends, and patterns that may be present.6–8 However, with image processing it is oftentimes difficult to capture key features using only one's eyes, making image processing tools necessary for proper image analysis. In response to this need, a variety of tools have appeared where tools and programming libraries such as OpenCV, Tensorflow, and scikit-learn have become popular for research that requires data science techniques.9–11 However, while being very useful, use of such libraries and tools requires heavy programming and knowledge of computer science. This prevents researchers, who are likely unfamiliar with programming or computer science, from adopting data science for their own research. It is, therefore, necessary to make these tools more accessible for people who wish to take advantage of these tools but struggle with the high learning curve.In an effort to improve accessibility to data science tools, a data platform, Catalyst Acquisition by Data Science (CADS), has been previously developed and can be found at https://cads.eng.hokudai.ac.jp/.12 In summary, CADS is a data platform designed to assist in catalyst design by making data science techniques accessible through graphical user interfaces (GUIs). Through the development of GUIs, it has become possible for researchers unfamiliar with programming to utilize data science techniques when conducting research. Given its initial success, further developments have been pursued in order to also incorporate image processing by incorporating the Python scikit-image library.13 By developing GUIs for image processing tools, it should therefore be possible for researchers unskilled in image processing programming to utilize the image processing tools, thereby improving accessibility to the image processing community. Here, graphical user interfaces for the scikit-image library are designed and developed within the CADS platform.
2 CADS analysis and visualization components
2.1 General architecture overview
Within the CADS platform, GUIs are implemented as View Components. In order to access the View Components, one would enter the “Analysis” section and either start a “New analysis” or open an existing workspace. In the Analysis section of the CADS website the user can load various View Components of their own choice and need. Fig. 1 illustrates the underlying structures found within various parts of a View Component that deal with configuration, data manipulation, and rendering. Inside each of these components one will find three parts: a window that houses an interactive display/rendering/visualization; a data management interface where user input and built-in controllers can reconfigure data and provide input for the view window; and a server-side data manipulation component where more advanced data processing can be carried out before being returned to the client for rendering. With this design, users can configure data through an interactive visualized form. The configurations are then passed to the server, where the appropriate algorithms and manipulated data are applied and the resulting output of the applied configurations and settings is returned as visualization.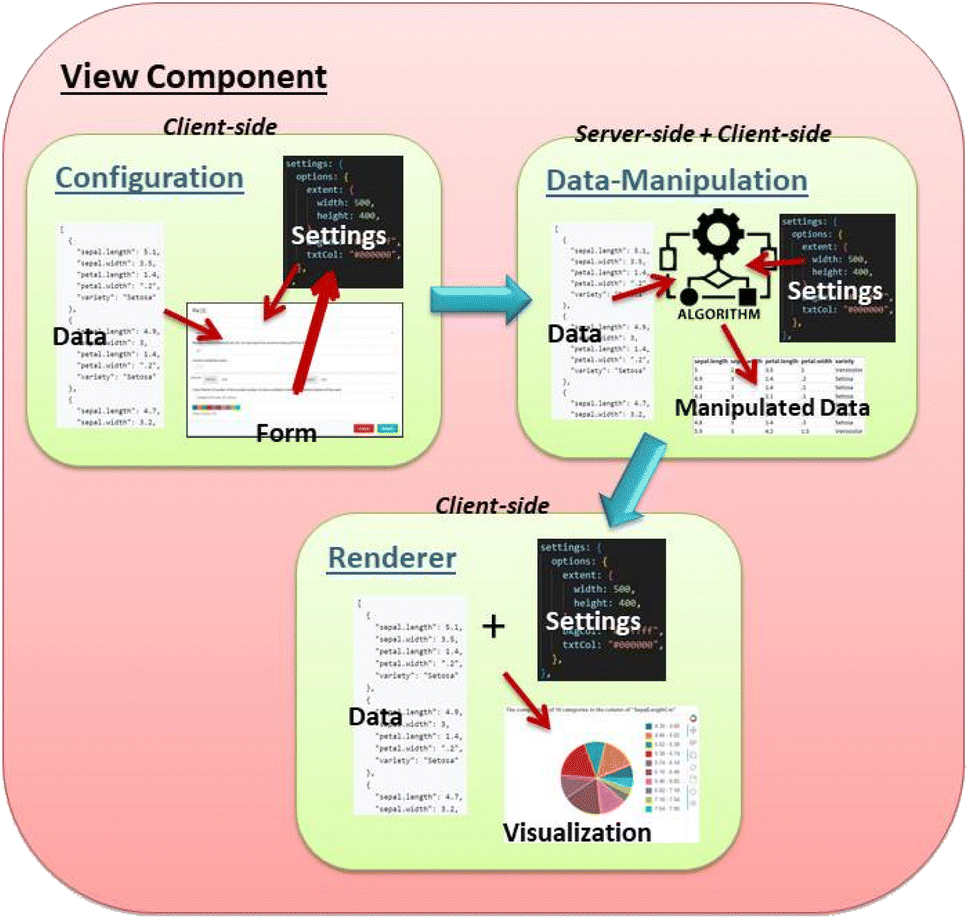 | ||
| Fig. 1 The underlying structure of the View Component. | ||
This architecture is designed and developed so that creating the frame of a new View Component is a fairly easy and quick task that makes it viewable and intractable almost at once. The configuration of each component is done via ReactJS driven forms with easy-to-use dropdown boxes, switches, and text-inputs that allows the user to interact with all availably made settings for the particular component, all stored and communicated in JSON-format under the hood. The raw data from the data management section is also stored as JSON and is included in the package as different parts of the components communicate. In the interface the user cannot manipulate the content of the data, but can select which parts of it that should be used and how.
The server side is mainly driven by Python and Django where multiple tools and libraries are installed for various sorts of data manipulation. As a developer, one creates a dedicated function to handle the JSON-package being delivered, manipulate it with the help of tools such as scikit-learn, and then return the result to the client in JSON-format. When the data and user-selected settings are returned, they are validated and polished if necessary and then sent to the rendering part of the component, which starts drawing the data visualization according to the design of the particular component and in accordance to the user's instructions from the component settings form. Although most current components use the Bokeh library to display charts and different types of graphs, it is not a requirement. Any possible rendering is available based on the goals of the developer and of the final module.
2.2 All view-components' shared features
No matter what a component may contain and what makes it unique, there are a few things that all components share. First it is the View Component container that holds at least three buttons to control the view: the delete-button, which destroys and removes the view; the configuration-button, which opens up the settings-form; and the duplicate-button, which duplicates the current view with its current settings. At the top of the Analysis page, if component-mobility is enabled, a fourth button (alternatively, handle) is made available that allows a user to drag the component in a grid-like manner inside the window in order to place the component in the order of one's choice. Inside the form, one may find different options for different components, but they are all displayed in the same manner in order to make the user feel at home, even with new and unfamiliar components. The form also contains various help instructions to guide the user in the configuration process. All loaded components in their current order and their current settings can be saved as a workspace, using a button found in the top right corner, for easy retrieval and reusability.2.3 The Image View component
This work mainly focuses on our latest component, the Image View component, with its image processing capabilities. Fig. 2 illustrates the workflow taken when processing information from the renderer. The workflow starts from the renderer, which displays the designated image. The visual/rendering side is simple: an image is communicated as a base64 string in the JSON-package, displayed in an <img> tag on the client side. Here, the image is just shown as-is where any CSS filter, which can also be managed here, can be selected through the configuration form and applied. The bulk of the interaction with this component is most likely done within the configuration form, where the user can load any web-approved image (jpeg, png and so forth) either locally or by link if domain-protections do not prevent it. Note that the Image View component does not currently interact with any pre-loaded data since it currently works with images and not statistics; however, future upgraded versions may incorporate this feature. After loading (selecting) an image, the user can improve the image display with features such as borders and custom titles in addition to applying various available types of image-manipulations to it.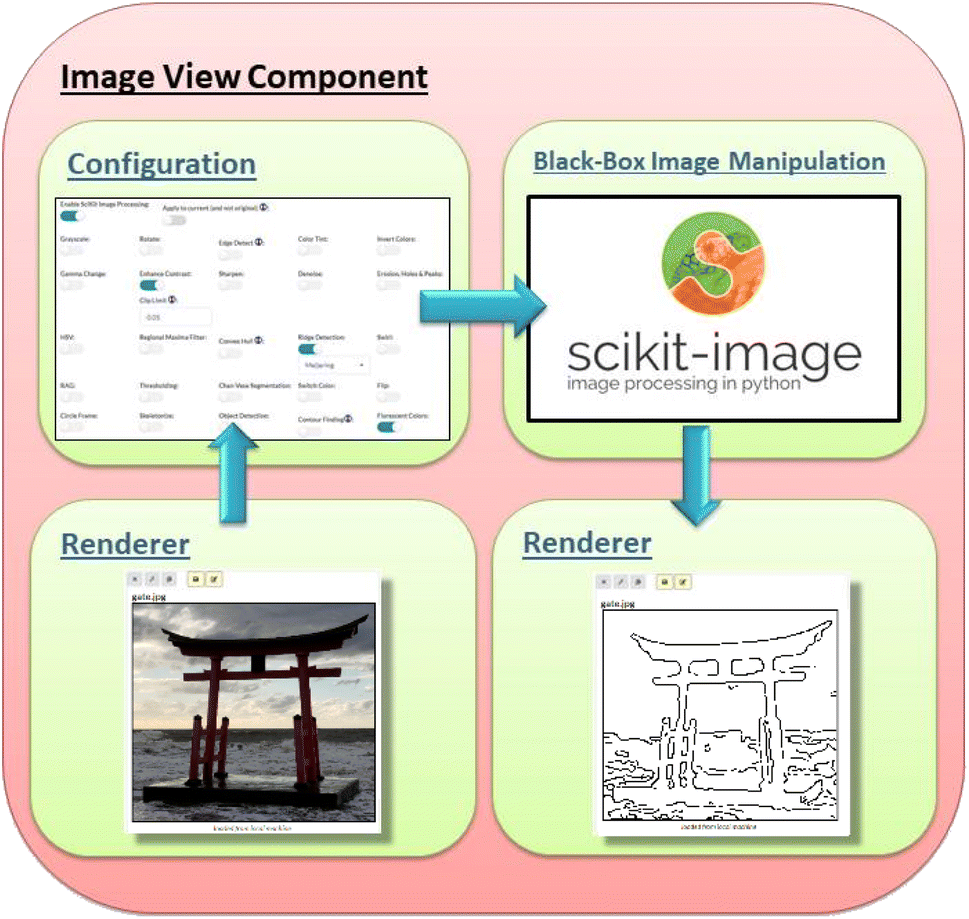 | ||
| Fig. 2 The Image View Component. | ||
The simplest interactive image manipulation is through enabling basic CSS filters, which allows the user to carry out classic, minor image alterations and see the end results in real-time. These CSS-filters can be applied in combination. The interface makes it very easy with sliders that change the manipulated value in question with direct visual response. These settings can be reset to the original image through the use of the reset button. The other, more powerful option of available image-processing is to enable the scikit-image library, which opens up the ways the Image View component allows the user to interact with that tool. Note that the images used in Fig. 3, 4 and 5 are found within the scikit-image library. As seen in Fig. 3, the interface is very simple with a single switch to turn a feature on or off, which then provide additional parameters (as few as possible for easy usage) when relevant to adjust for optimal results. Given that scikit-image is Python-driven and server-side, the changes made in the form are not visible until after the form settings are submitted and the server applies the selections. Each switch or parameter is accompanied by a popup-info marker that briefly explains or demonstrates what it does. For cases that require further explanation, additional links to off-site resources are included. This is done to help improve usability for users that may be new to or otherwise unfamiliar with the processing tools provided.
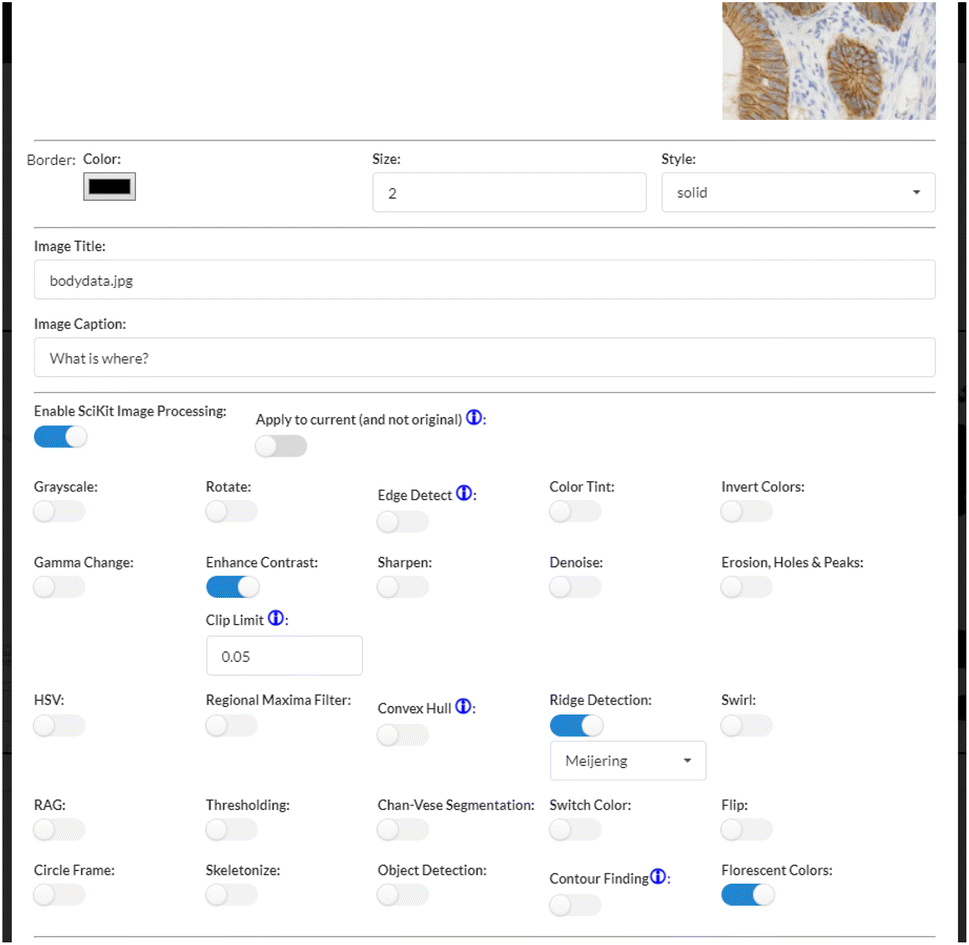 | ||
| Fig. 3 Interface example 01. | ||
If the user applies multiple effects, those effects will be applied in order of the list of switches, which sometimes may not lead to the intended result. To circumvent this, it is recommended to apply a few effects to start, submit the work-order to the server, and allow the server to prepare the output. Length of time is quick, yet dependent on the effects themselves, the number of effects selected, the size of the image, and settings of the specific parameters. When the server returns the image, the effects will be applied while storing the original image, allowing the user to reset the image if necessary. After the image returns, the user may once again open the configuration form to apply new effects but on the manipulated image rather than the original. This is easily instructed by a single switch in the form. The user can then turn off previously applied effects if desired and start adding new ones.
It is possible to duplicate image components and work with several components within the same workspace, as seen in Fig. 4. This is useful as it is possible to explore several different aspects of image processing and easily compare the results within the same workspace. It is important to note that when a workspace of components is saved, only the most current settings are saving. If one were to use the approach of manipulating images in steps, one should save the image (and/or its mediate versions) themselves onto a local machine for future easy retrieval; else, the changes and steps may be lost. Saving an image is easy and can be done through clicking the custom yellow save button uniquely available on the Image View component's interface.
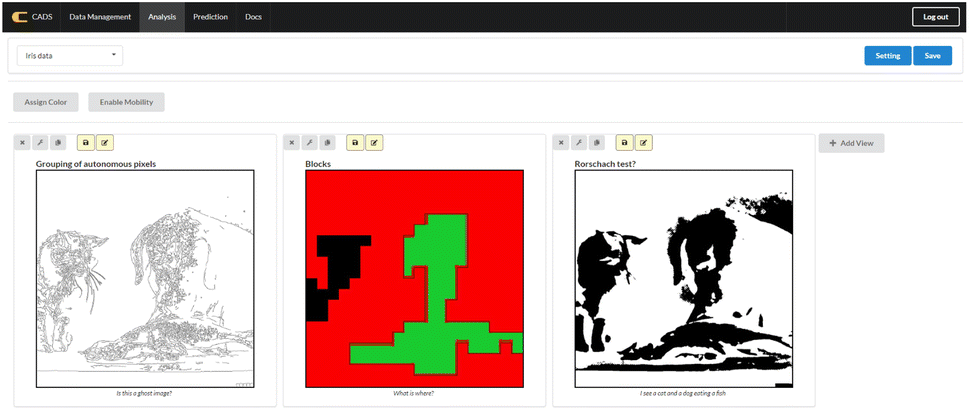 | ||
| Fig. 4 Interface example 02. | ||
One should be aware that effects applied may sometimes vary in results depending on the source image, and it is therefore recommended to prepare an image beforehand should the result not mirror one's expectations. The most common pre-manipulation of an image before loading it into the Image View component is to convert it into a jpeg file in order to strip it of the alpha channel. This is just a suggestion, and not a necessity should one wish to adopt CADS architecture for their own use. CADS works with all image types, but the result depends on what scikit-image sees in the source picture, which does not always reflect what a person may see. Another custom button for this component is the ‘Annotation’-button, found next to the save button, also yellow in color, which denotes component specific custom buttons. The Annotation feature allows the user to draw using the mouse on top of the image, as seen in Fig. 5, in order to annotate or highlight things that the image shows. The annotations are saved within the workspace, but it is still recommended to save the images on their own, now and then, for safekeeping and usage outside of CADS.
 | ||
| Fig. 5 Interface example 03. | ||
3 Case studies
Image analysis is an important part of many scientific disciplines that require image analysis and segmentation.14,15 In particular, areas such as material design rely on image analysis in order to, for example, detect structural defects or detect nanoparticles, and with developments in data science techniques, it is becoming possible to enlist machines to help detect anomalies or other such factors within images.16–18 However, there are large learning barriers in place where many researchers who traditionally analyze images manually are unfamiliar with programming or data science approaches. Thus, the CADS View Components are designed in an effort to bridge this gap.In order to test how these View Components can be used for image analysis, several different types of images are chosen for analysis. In particular, several transmission electron microscopy (TEM) images are selected in order to determine whether image analysis can be improved using the scikit-image library. The TEM images used to test the usability of the GUIs have been previously published.19 These images were initially used as part of a study focused on using neural networks to determine the average size of particles. In this instance, the TEM images are manipulated via the View Components in order to gain new insights. Two images are selected, as visualized in Fig. 6, in order to better understand how image analysis can be improved through the new View Components.
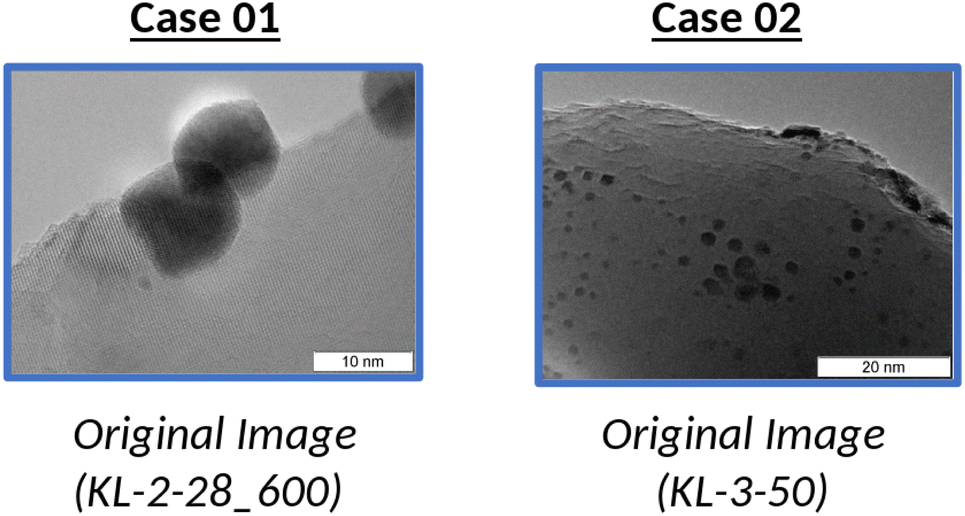 | ||
| Fig. 6 Original images used for Case 01 and Case 02. | ||
Case 01 (Fig. 6) is used to explore how the View Components can be used to analyze TEM images. In particular, the TEM image used with Case 01 is chosen to investigate how information such as atom density can be clarified. To start, we are presented with a range of options as seen in Fig. 7. Here, one is given 25 different options to select from, which will then be applied to the given image once confirmed. Users can select the options they wish to activate, whether it be a single option or several options at once.
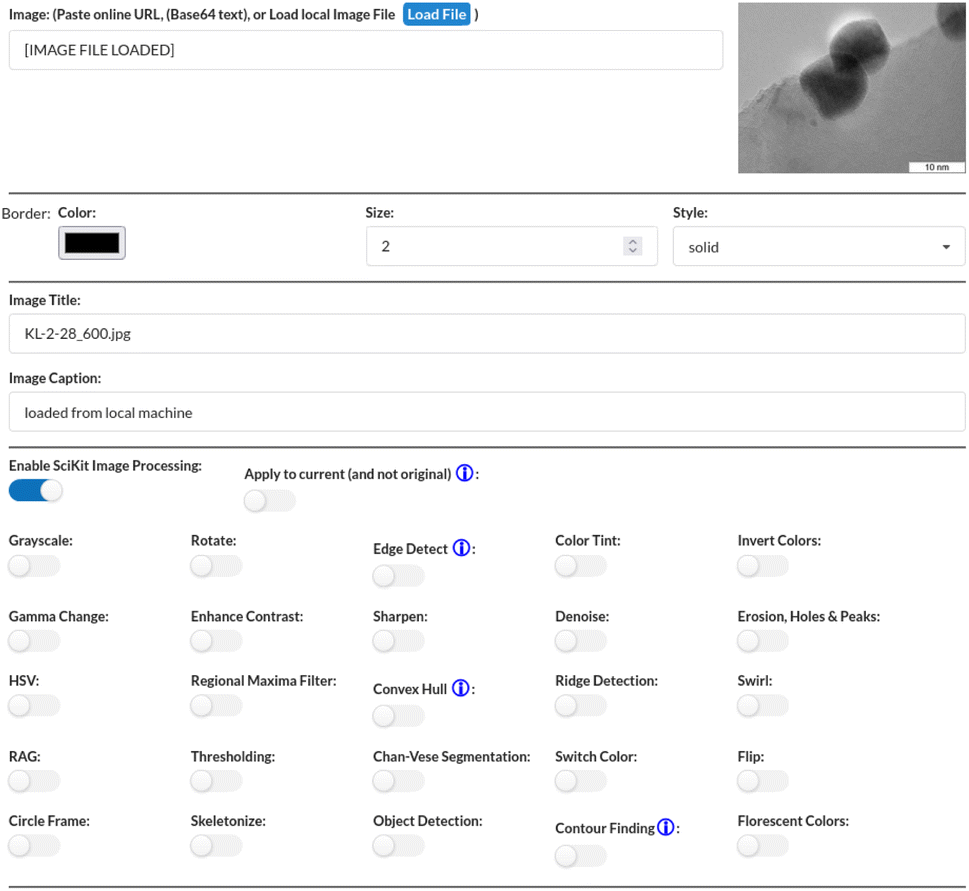 | ||
| Fig. 7 Options available when applying scikit image processing. | ||
When relevant, users can also clarify specifics that pertain to a particular option. This is possible in cases like Fig. 8 where users can choose Meijering or Hessian ridge detection. Once selected, the effects are immediately applied to the original image.
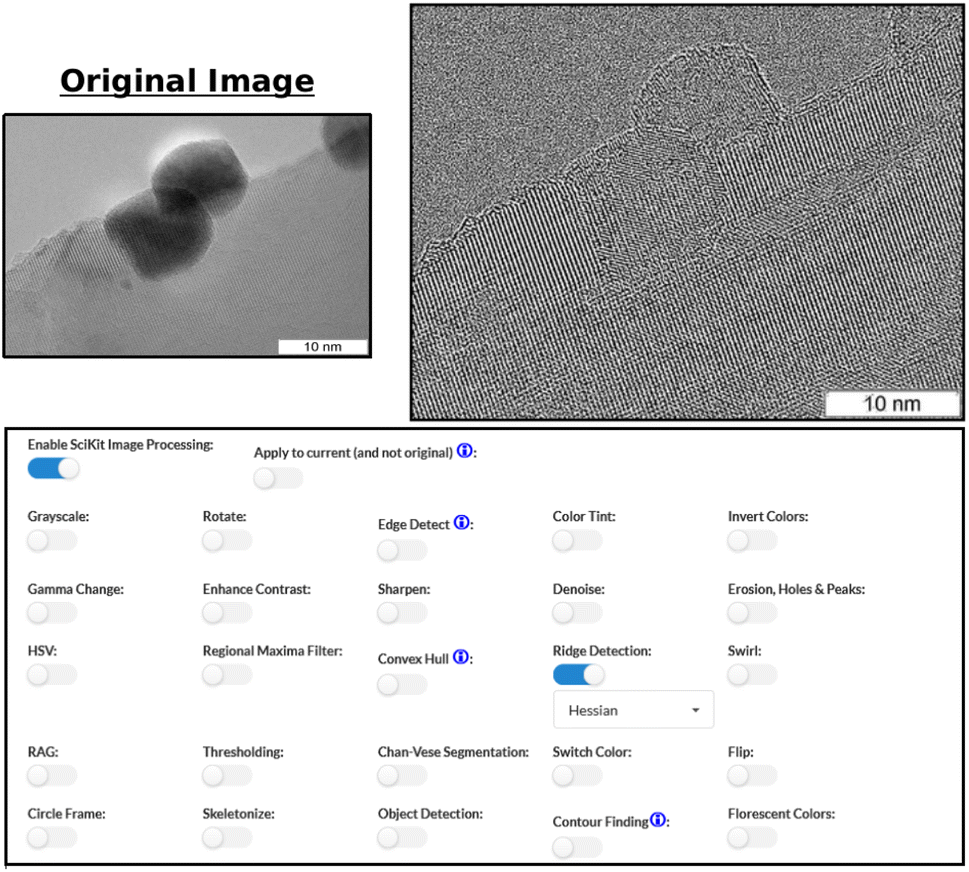 | ||
| Fig. 8 Case 01: applying ridge detection to the image with ‘Hessian’ selected. | ||
Multiple options can be selected and applied simultaneously. An example of this is illustrated in Fig. 9. Here, the original image is edited where options “Invert Colors” and “Erosion” are selected. In doing so, atom placement from an alternative perspective can be analyzed. In the case of Fig. 9, one can better see areas where atoms may be layered on each other. Additional adjustments can be applied to improve visibility. For instance, by sharpening the altered image in Fig. 9, it becomes easier to see the individual atoms as well as better understand the degree of atom density in areas with strong overlap. By also enhancing the contrast, the topography of where the atoms are dense becomes more obvious. Thus, new insights into TEM images can be gained through creative use of the View Component options.
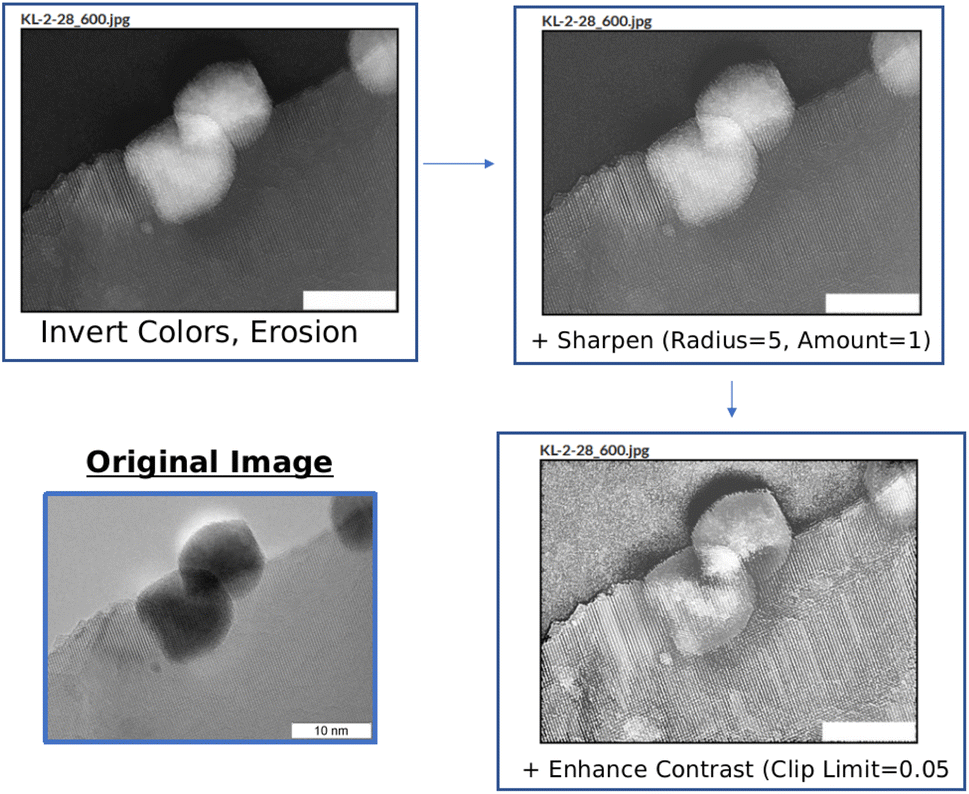 | ||
| Fig. 9 Case 01: applying multiple options across different iterations of the original image. | ||
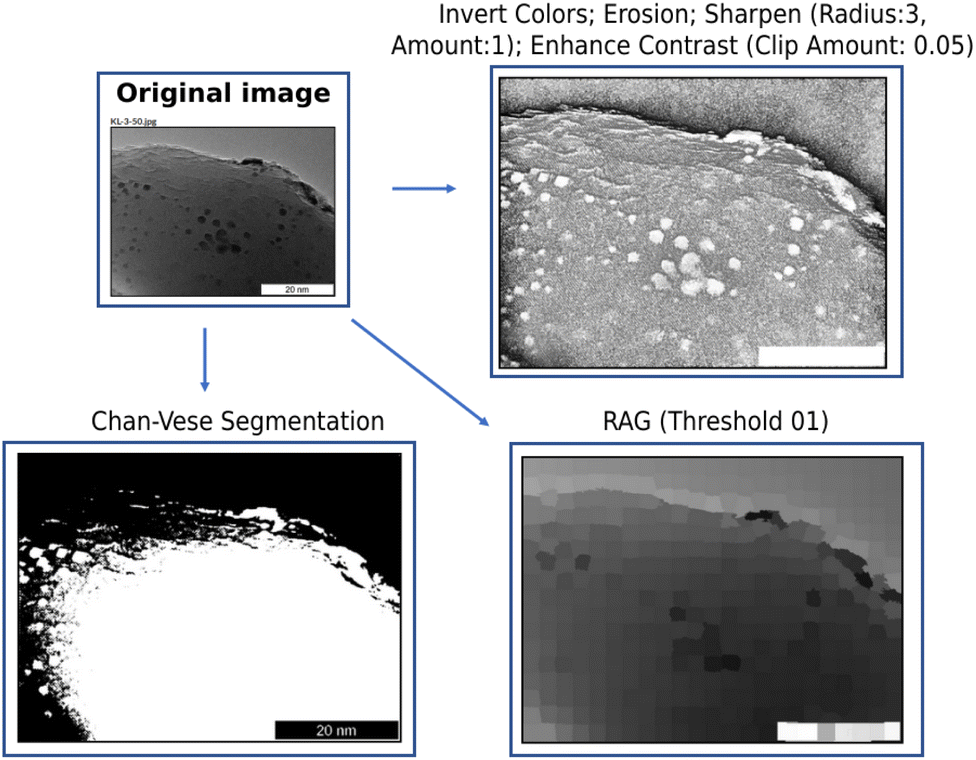
Case 02 (Fig. 6) explores various ways that the View Components can be used when imagery is dark or has visibility issues. This is seen in Fig. 10 which illustrates the various ways TEM images that are dark or otherwise are hard to discern can be investigated.
 | ||
| Fig. 10 Case 02: various applications of different options. | ||
To start, through the View Components, topography becomes visible after the following options are selected: Invert Colors, Erosion, Sharpen, and Enhance Contrast. By applying these factors within the same window, it becomes possible to more clearly understand where atoms congregate and how the surface is shaped. Additionally, Chan–Vese segmentation can be applied, which is useful for cases when one wishes to carry out segmentation without relying on edges.20 Similarly, options are available when one wishes to process an image as a region adjacency graph (RAG).21 Thus, we can see from these cases that image analysis can be carried out efficiently, within the same workspace, and without extensive previously held knowledge regarding programming, image processing, and data science.
4 Conclusion
Increasingly, researchers look to employ data science techniques for research endeavors, yet are often unfamiliar with programming, data science, or image processing. A data platform, CADS, has been previously developed in an effort to address these difficulties. In particular, View Components are developed in order to incorporate image processing tools on the data platform. The goal of all CADS View Components, in particular Image View Components, is to allow users to interact with data and resources without requiring skills in programming and advanced scripting, while also allowing one to manipulate and interact with complex data in highly advanced ways. Developing View Components in this manner allows researchers that wish to approach research from new perspectives to utilize Python script and libraries such as scikit-learn and scikit-image without prior extensive knowledge, thereby reducing potential learning curves that may be encountered. Several microscopy images have been investigated using the developed View Components and are able to successfully apply the image processing tools found within scikit-image to the images within the developed View Components where factors such as topography and atom density are clarified. Thus, a web-based image process tool is developed in order to help address the difficulties many researchers face when attempting to use programming or data science techniques for their research and can be continually developed to reflect the developments in the programming community as well as reflect the evolving needs of the research community.Data availability
All codes and data are shared at github (https://github.com/Material-MADS/mads-app).Conflicts of interest
There are no conflicts to declare.Acknowledgements
This work is funded by the Japan Science and Technology Agency (JST) with CREST grant number JPMJCR17P2 and ERATO grant number JPMJER1903.Notes and references
- K. Takahashi, L. Takahashi, I. Miyazato, J. Fujima, Y. Tanaka and T. Uno, et al., The rise of catalyst informatics: towards catalyst genomics, ChemCatChem, 2019, 11(4), 1146–1152 CrossRef CAS.
- A. Agrawal and A. Choudhary, Perspective: Materials informatics and big data: Realization of the “fourth paradigm” of science in materials science, APL Mater., 2016, 4(5), 053208 CrossRef.
- K. Takahashi and Y. Tanaka, Materials informatics: a journey towards material design and synthesis, Dalton Trans., 2016, 45(26), 10497–10499 RSC.
- J. B. Hagen, The origins of bioinformatics, Nat. Rev. Genet., 2000, 1(3), 231–236 CrossRef CAS PubMed.
- T. Engel, Basic overview of chemoinformatics, J. Chem. Inf. Model., 2006, 46(6), 2267–2277 CrossRef CAS PubMed.
- L. M. Ghiringhelli, J. Vybiral, S. V. Levchenko, C. Draxl and M. Scheffler, Big data of materials science: critical role of the descriptor, Phys. Rev. Lett., 2015, 114(10), 105503 CrossRef PubMed.
- L. Himanen, A. Geurts, A. S. Foster and P. Rinke, Data-driven materials science: status, challenges, and perspectives, Adv. Sci., 2019, 6(21), 1900808 CrossRef.
- K. T. Butler, D. W. Davies, H. Cartwright, O. Isayev and A. Walsh, Machine learning for molecular and materials science, Nature, 2018, 559(7715), 547–555 CrossRef CAS PubMed.
- G. Bradski, The OpenCV Library, Dr. Dobb’s J. Softw. Tools, 2000, 25(11), 120–123 Search PubMed.
- M. Abadi, A. Agarwal, P. Barham, E. Brevdo, Z. Chen, C. Citro, et al., Tensorflow: Large-scale machine learning on heterogeneous distributed systems, arXiv, 2016, preprint, arXiv:160304467, DOI:10.48550/arXiv.1603.04467.
- F. Pedregosa, G. Varoquaux, A. Gramfort, V. Michel, B. Thirion and O. Grisel, et al., Scikit-learn: Machine Learning in Python, J. Mach. Learn. Res., 2011, 12, 2825–2830 Search PubMed.
- J. Fujima, Y. Tanaka, I. Miyazato, L. Takahashi and K. Takahashi, Catalyst Acquisition by Data Science (CADS): a web-based catalyst informatics platform for discovering catalysts, React. Chem. Eng., 2020, 5(5), 903–911 RSC.
- S. Van der Walt, J. L. Schönberger, J. Nunez-Iglesias, F. Boulogne, J. D. Warner and N. Yager, et al., scikit-image: image processing in Python, PeerJ, 2014, 2, e453 CrossRef PubMed.
- J. Schindelin, I. Arganda-Carreras, E. Frise, V. Kaynig, M. Longair and T. Pietzsch, et al., Fiji: an open-source platform for biological-image analysis, Nat. Methods, 2012, 9(7), 676–682 CrossRef CAS.
- H. Wieslander, C. Wählby and I. M. Sintorn, TEM image restoration from fast image streams, PLoS One, 2021, 16(2), e0246336 CrossRef CAS PubMed.
- C. Park and Y. Ding, Automating material image analysis for material discovery, MRS Commun., 2019, 9(2), 545–555 CrossRef CAS.
- N. Laanait, M. Ziatdinov, Q. He and A. Borisevich, Identifying local structural states in atomic imaging by computer vision, Adv. Struct. Chem. Imaging, 2016, 2(1), 1–11 CrossRef CAS PubMed.
- A. G. Okunev, M. Y. Mashukov, A. V. Nartova and A. V. Matveev, Nanoparticle Recognition on Scanning Probe Microscopy Images Using Computer Vision and Deep Learning, Nanomaterials, 2020, 10(7), 1285 CrossRef CAS PubMed.
- A. V. Nartova, M. Y. Mashukov, R. R. Astakhov, V. Y. Kudinov, A. V. Matveev and A. G. Okunev, Particle Recognition on Transmission Electron Microscopy Images Using Computer Vision and Deep Learning for Catalytic Applications, Catalysts, 2022, 12(2), 135 CrossRef CAS.
- P. Getreuer, Chan-vese segmentation, Image Process. Line, 2012, 2, 214–224 CrossRef.
- A. Trémeau and P. Colantoni, Regions adjacency graph applied to color image segmentation, IEEE Trans. Image Process, 2000, 9(4), 735–744 CrossRef PubMed.
| This journal is © The Royal Society of Chemistry 2023 |