
 Open Access Article
 This Open Access Article is licensed under a
 Creative Commons Attribution 3.0 Unported Licence
FEREBUS: a high-performance modern Gaussian process regression engine†
Matthew J.
Burn‡
and
Paul L. A.
Popelier‡
 *
*
Department of Chemistry, The University of Manchester, Manchester, M13 9PL, UK. E-mail: pla@manchester.ac.uk; Tel: +44 (0)161 3064511
First published on 9th December 2022
Abstract
FEREBUS is a highly optimised Gaussian process regression (GPR) engine, which provides both model and optimiser flexibility to produce tailored models designed for domain specific applications. FEREBUS provides the user with the necessary tools to decide on the trade-off between time and accuracy, in order to produce adequately accurate machine learnt models. FEREBUS has been designed from the ground up, for deep integration in the file management pipeline (ICHOR) of the multipolar, machine learned, polarisable force field FFLUX. As such it can produce accurate atomistic models for molecular dynamics simulations as efficiently as possible. FEREBUS utilises both OpenMP and OpenAcc technologies for parallel execution of optimisation routines and offloading computation to GPU accelerator devices with high efficiency, reaching parallel efficiency of 99%. The FORTRAN90 program FEREBUS embodies a modern approach to a high performance GPR engine providing both flexibility and performance in a single package.
1. Introduction
Molecular dynamics (MD) simulations are becoming increasingly prevalent1–3 in the drive to complement experiment both in biochemistry and materials science. As the applications and scale of MD simulations increase, so does the demand on the speed and accuracy of the simulations. Classical MD simulations are fast but the traditional force fields powering them often lack the accuracy (e.g. ref. 4) required to predict properties independently from experiment. In contrast, ab initio simulations do not face the ongoing challenge of reliable parameterisation but face the different challenge of solving the Schrödinger equation “on the spot”. This way of working is severely hampered by computational demands and thus remains confined to relatively small systems followed over short trajectories.Machine learning (ML) has become an invaluable tool5–12 in bridging the gap between the accuracy of ab initio simulations and the speed of classical MD. Many groups contributed to an explosion of computer programs and potentials, which typically fall either into the category of neural networks or kernel methods. The latter were first introduced13 in atomistic potential design in 2009, while the former14,15 became practical16 in solid state modelling in 2007. Although originally called kriging, the ML method17–23 we use for the construction of our force field FFLUX is better called Gaussian process regression (GPR) to be in line with literature practice. GPR predicts the properties of the topological atoms24,25 that are at the basis of FFLUX. Both the atomic energies and atomic multipole moments (including charges) originate from the same quantum topological partitioning scheme. This uniformity helps in offering energies that are consistent at both short and long range while also being atomistic. With the availability of analytical forces,26 FFLUX enables geometry optimisation, such as that of a peptide-capped glycine.27 The parallelised MD program that makes this possible is called DL_FFLUX,28 which is a local version of DL_POLY29 that we interfaced with the GPR models. The first MD simulations are now possible, starting with one on liquid water30 while FFLUX simulations of molecular crystals are in the pipeline.
This paper details the implemented features of the in-house program FEREBUS,31,32 which is tasked with generating atomistic GPR models. FEREBUS is a highly optimised GPR engine, designed to produce atomistic models for MD simulations in FFLUX. Here we report on the recent advancements in FEREBUS, which has been designed from the ground up for increased model flexibility, ameliorated optimiser tunability and improved performance via GPU acceleration. Previous iterations of FEREBUS used a predefined mean and covariance function in the model definition as well as standard optimiser implementations. The choice of mean and covariance function will heavily depend on the application of the model as well as affecting the model performance. Therefore, rewriting FEREBUS with the design goals of increased flexibility whilst keeping the performance requirements was the next logical step.
There exist many implementations of Gaussian process (GP) regressors across a variety of languages. Some of the major ones are GPyTorch,33 GPy,34 GPML,35 scikit-learn,36 and libraries such as GPflow,37 FlowMO38 and GAUCHE.39 The latter three regress directly on molecular structures rather than regress in preparation of atomistic simulations, which is the focus of the current work. For instance, many off-the-shelf regressors are tailored towards using gradient descent optimisation. In contrast, this paper presents a GP regressor implementation designed from the ground up, with global optimisation through particle swarm optimisation (PSO).
Although predictive performance is the main objective of most off-the-shelf solutions, FEREBUS is used within the in-house ICHOR40 pipeline, which may favour fast production of models over their predictive performance. ICHOR implements an active learning workflow requiring dozens of models during an active learning run, which explains the focus on speed over accuracy during model creation. FEREBUS provides the flexibility, in both model and optimiser design.
2. Results and discussion
2.1 GPR models
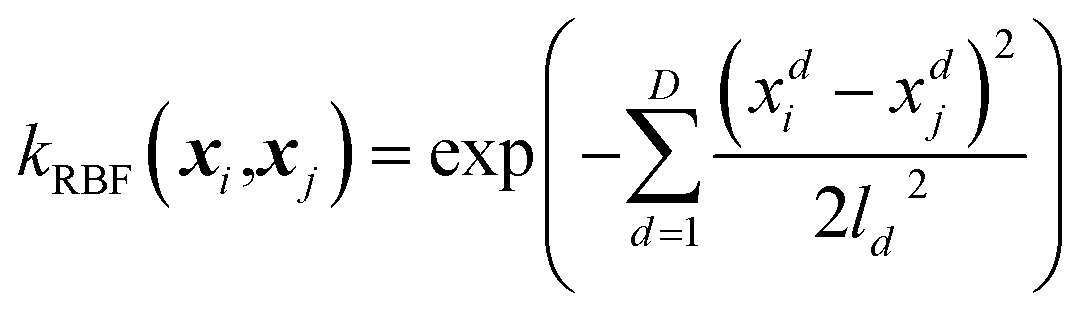
GPR35 is an interpolation method to produce a fit of an arbitrary function using a given training set. The training set consists of a set of input points, denoted as X, and a vector of corresponding outputs denoted y. The GPR model interpolates between training points using a covariance function, k, often called a kernel function. Using the kernel function, a covariance matrix of the training input can be calculated,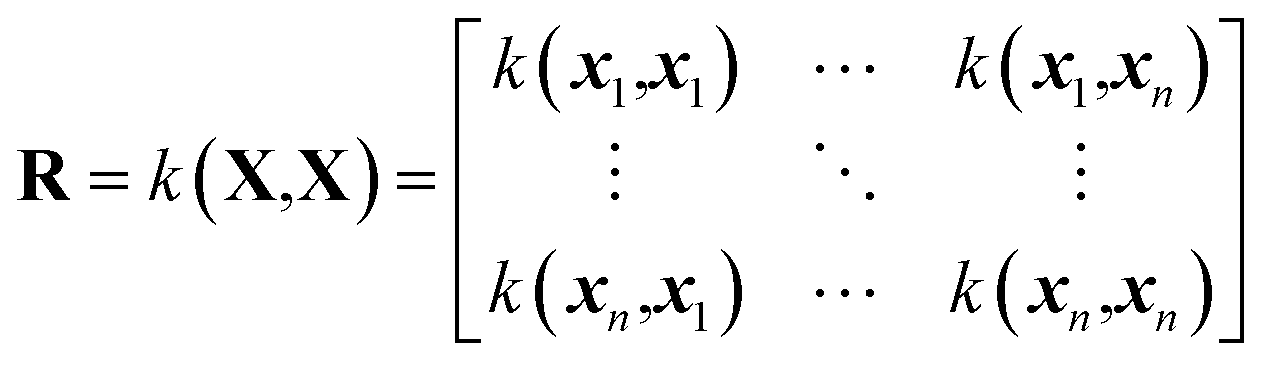 | (1) |
 | (2) |
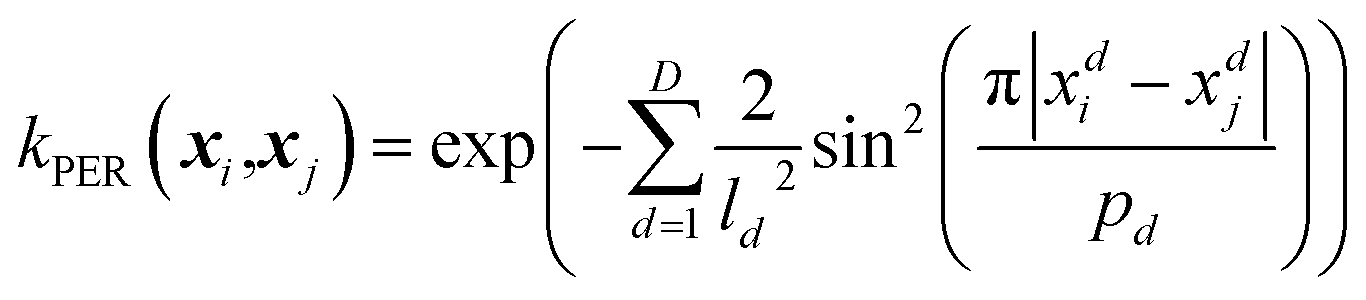 | (3) |
From eqn (3) it is clear that the periodic kernel has two sets of hyperparameters: l and p. The lengthscale hyperparameters, l, dictate how fast the covariance drops off with increasing Euclidean distance between two (data) points. The hyperparameters p describe the periodicity of the system, i.e. how often covariance should repeat itself.
If a function is known to have a general trend, for example, a series that increases over time, then these kernels can be combined with a linear kernel,
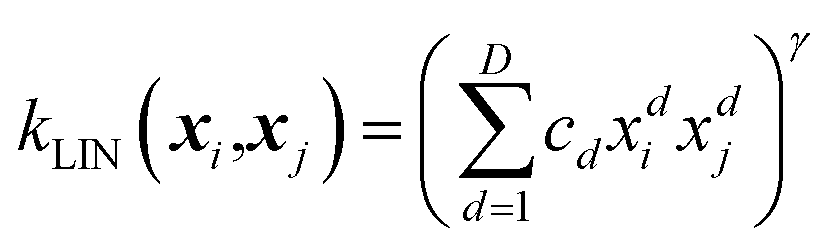 | (4) |
The final type of kernel implemented in FEREBUS is the constant kernel. This is the simplest kernel: no matter what is inputted, the covariance remains constant,
| kCONST(xi,xj) = σ | (5) |
 cost function is maximised, which is equivalent to minimising
  ,
, | (6) |
The limiting factor when optimising GPR models is the inversion of the covariance matrix, which scales as  . As the covariance matrix is positive semi-definite, the matrix inversion may be avoided by solving the linear system via Cholesky decomposition, which leads to increased numerical accuracy. The Cholesky decomposition and linear system solving is performed by routines provided by the LAPACK41 library. The log-likelihood function shown in eqn (6) is known as the marginal log-likelihood function and is the default likelihood function in FEREBUS. Note that in our past work we have used the log-likelihood function instead. FEREBUS implements a second likelihood function known as the concentrated log-likelihood, which has been the default likelihood function in previous work. Further details on the concentrated log-likelihood may be found in the ESI.†
2.2 Kernel composition
A major advancement of FEREBUS compared to previous versions of this program is the implementation of dynamic kernel composition.42 All the kernels shown in the previous section can be combined to create a new kernel that is designed specifically for the domain-specific task at hand. There are several ways to combine kernels implemented in FEREBUS, which involve taking kernels as inputs to produce a new kernel. For example, two kernels can be added together to create a new summed kernel,| kSUM(k1,k2) = k1 + k2. | (7) |
Note that the inputs to the kernels k1 and k2 have been omitted for clarity. Summing two kernels forms an OR operation between the kernels. For example, if one of the kernels has a high covariance and the other has a low covariance then the output will still have a high covariance because they have been summed. The result is that given the correct function, the sum kernel can be used to extrapolate outside of the bounds of each kernel individually.
The opposite to the OR operation is the AND operation, which is achieved using the product kernel,
| kPROD(k1,k2) = k1 × k2 | (8) |
Similarly to the sum kernel, if one kernel has a high covariance and the other has a low covariance, the product kernel will produce a low covariance. Concomitantly, both kernels must have a high covariance for the result to be a high covariance.
Combining kernels using the sum or product operations produces a new kernel. Therefore, kernels can be complex and contain nested operations for additional flexibility. By combining kernels together, domain-specific knowledge can be used to capture patterns within the data, resulting in fewer data required to model the same function. For example, if a function displays a periodic nature whilst also showing a linear trend, then modelling this behaviour with a single kernel would be difficult. However, the task becomes trivial by summing a periodic kernel and a linear kernel (Fig. 1).
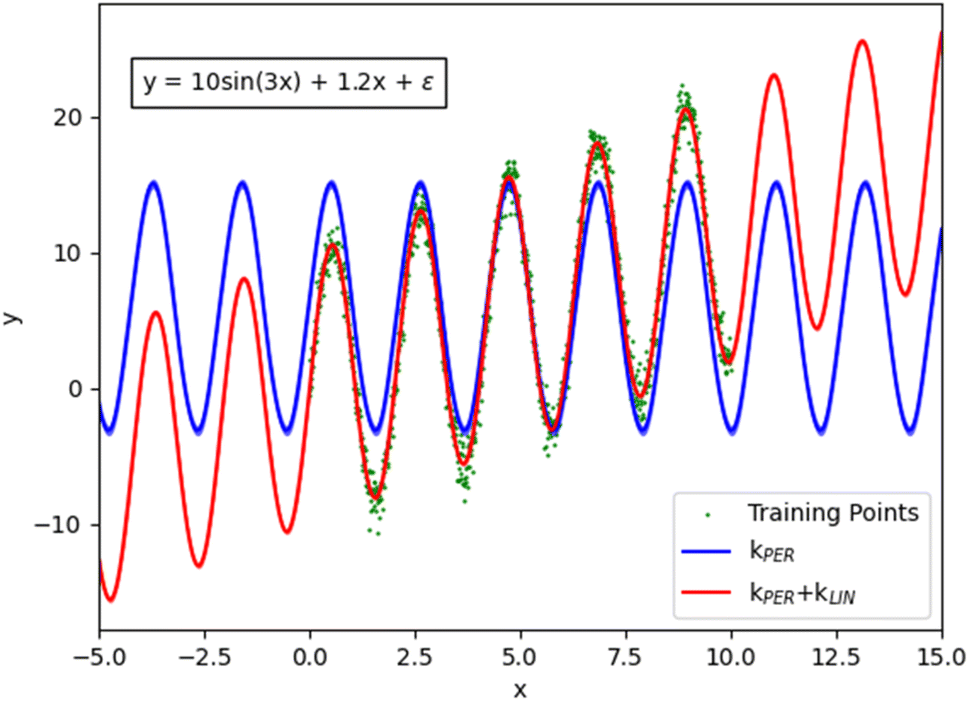 | ||
| Fig. 1 Demonstration of the effect of combining a periodic and a linear kernel in order to better describe the original function (all plotted with matplotlib). | ||
Another useful kernel composition is the scaling kernel. This kernel can be used to scale the output value of a kernel and can be thought of as a product between a kernel and a constant kernel,
| kSCALE(k) = σ × k. | (9) |
FEREBUS is designed with high performance in mind. Because the kernel is one of the hottest parts (i.e. a path where most of the execution time is spent) of a Gaussian process regressor's code, the kernel composition is an important implementation issue. FEREBUS implements several kernels that can be used on their own or composed into more complex kernels dynamically at runtime. Because kernels are composed at runtime, a recursive descent parser combined with a kernel interpreter is used to construct the composite kernel prior to optimisation. Full details of the kernel interpreter are found in the ESI.† Producing a composite kernel prior to optimisation removes the need to parse and reinterpret the kernel at each kernel invocation. Instead the kernel is initialised once and simply called at each optimisation step with new parameters. As each kernel in a composite kernel can be computed independently prior to combining to form the final product, FEREBUS parallelises over separate kernel tasks. This matter is discussed in greater detail in Section 2.8.
2.3 Active dimensions
When moving to multiple dimensions, further improvements can be made towards the flexibility of composite kernels. When using a kernel in a multidimensional space, the kernel function often acts over all dimensions as shown in eqn (2)–(4). This need not be the case because it is possible to specify and thereby restrict the dimensions upon which a kernel acts. These specified dimensions are called the kernel's active dimensions. Defining the active dimensions of a given kernel becomes valuable when it is known that certain dimensions may have different characteristics to the other dimensions of the input. For example, if one dimension is periodic then it is beneficial to use a periodic kernel on this dimension alone. If the other dimensions of the input are not periodic then it would be detrimental to use a periodic kernel over all dimensions. In this case it may be beneficial to define a different kernel for each dimension.Fig. 2 shows that the GPR model benefits from using a periodic kernel in the second dimension. Indeed, Fig. 2B shows that the model produced using the RBF kernel in both dimensions performs well in the regions containing training data but breaks down soon after extrapolating away from the training data. The RBF kernel therefore requires much more data to model the periodicity over this larger distance compared to the periodic kernel.
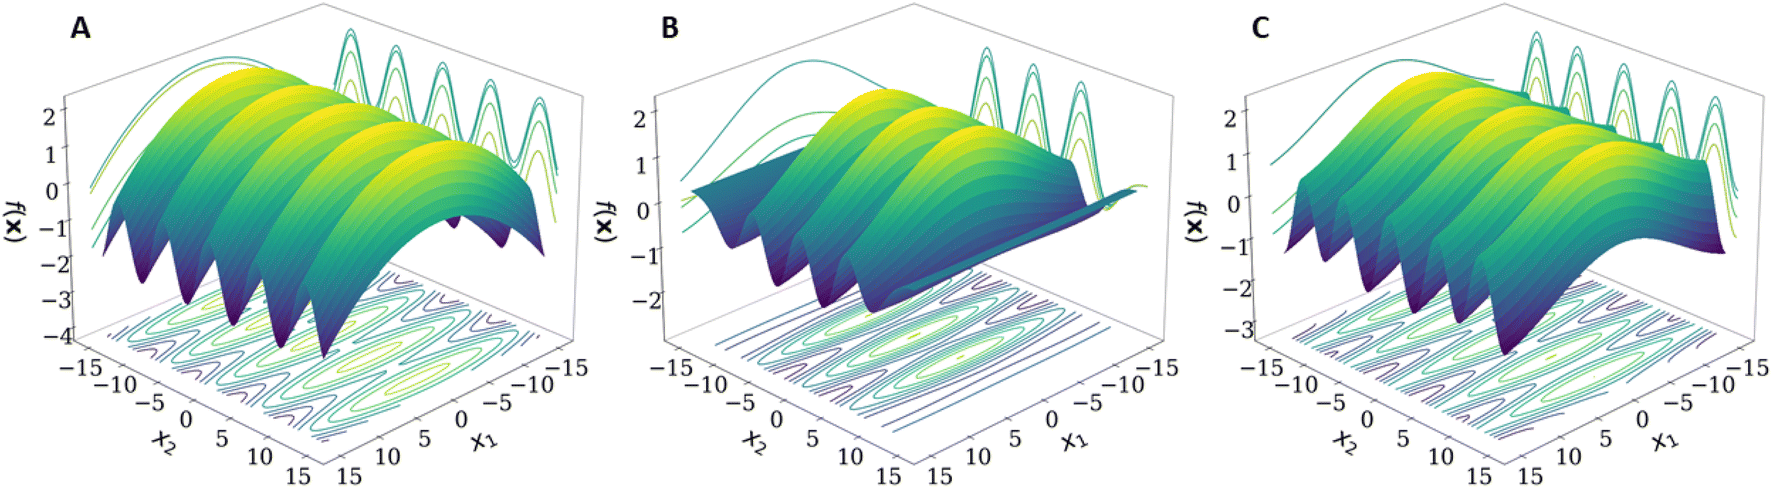 | ||
Fig. 2 Example of a function utilising active dimensions: (A) the true function  , (B) predicted surface using a GPR model with an RBF kernel in both dimensions, and (C) predicted surface using a GPR model with an RBF kernel in the first dimension and a periodic kernel in the second dimension. The GPR models for (B) and (C) were created using a training set with a range of x ∈ [−8,8] and a test set with a range of xtest ∈ [−15,15]. Matplotlib was used to make the plots. , (B) predicted surface using a GPR model with an RBF kernel in both dimensions, and (C) predicted surface using a GPR model with an RBF kernel in the first dimension and a periodic kernel in the second dimension. The GPR models for (B) and (C) were created using a training set with a range of x ∈ [−8,8] and a test set with a range of xtest ∈ [−15,15]. Matplotlib was used to make the plots. | ||
If certain characteristics of a system are known, such as the periodicity of the system, then this knowledge can be used when defining types of kernels and active dimensions. As discussed previously, FEREBUS is used to create GPR models for atomistic simulations in FFLUX. Such simulations use the atomic local frame (ALF) to define the features of a given geometry. ALF features are split into to two parts: the first three features refer to features between the atoms defining the ALF while the rest are spherical polar coordinates of all atoms outside of the ALF defined using this local frame. Three-dimensional spherical polar coordinates are used for each atom (r, θ, φ), where every third feature (φ) can vary in value from π to −π and as such is cyclic in nature. Such a feature is a perfect candidate for using a periodic kernel which with relatively few training points. The remaining features (θ and of course r) are not cyclic and are better suited to a kernel such as the RBF kernel. As the periodicity of the cyclic ALF feature (φ) is 2π, the periodic kernel shown in eqn (3) can be simplified to
 | (10) |
2.4 Mean functions
Alongside the kernel functions, the second factor defining a GPR model is its mean function. Theoretically any mean function can be used to create a GPR model and, much like swapping kernel functions, mean functions allow for the user to add domain knowledge into the problem and thereby reduce the reliance on the training data and kernel. For example, if the training data are quadratic in nature then a quadratic mean function can be used allowing for better extrapolation from the training data.The simplest and most common mean function used in GPR models is the zero-mean function (μzero). The zero-mean function is a very simple function where the output is always zero. The zero-mean function is often most useful when using standardised data, which naturally produces a zero-mean. Another mean function is the constant mean function (μconst), which produces a constant value irrespective of the inputs it is given. The difference between the constant mean and the zero-mean is that the user is free to select whichever value is returned from the constant mean function. This value is often the mean of the training data but it can be optimised alongside the kernel hyperparameters,
| μzero(x) = (0, 0, …, 0) | (11) |
| μconst(x) = (μ, μ, …, μ) | (12) |
Using the zero-mean function and the constant mean function is also known as simple kriging and ordinary kriging, respectively. There exists a third form of kriging termed universal kriging, which makes use of an arbitrary mean function. An arbitrary mean function allows for great flexibility whilst designing a GPR model. Some examples of mean functions implemented in FEREBUS are the linear (μlin) and quadratic (μquad) mean functions,
| μlin(X*) = (X* − xmin)β + ymin | (13) |
| μquad(X*) = (X* − xmin)2β + ymin | (14) |
| xmin = min(X) | (15) |
| ymin = min(y) | (16) |
| A = (X − xmin)n | (17) |
| B = y − ymin | (18) |
| β = (ATA)−1(ATB) | (19) |
2.5 Particle swarm optimisation
PSO is an evolutionary optimiser based on the swarming behaviour of birds. Traditional gradient descent optimisers are limited by the exact location of the starting position. Depending on the starting position, a gradient descent optimiser can become stuck in a local optimum for a potentially highly multimodal function such as the likelihood function, which is a major drawback. This pitfall can of course be mitigated by restarting the optimiser in different locations but this is a time-consuming process. On the other hand, PSO samples many points simultaneously and then employs a communication method to simultaneously search new areas of the objective function whilst also moving towards the previously best-known position. Not requiring any gradient information allows the PSO algorithm to bypass local minima on the optimisation surface with ease while also providing a simple implementation and fast evaluation at runtime. A thorough comparison32 between the analytical method L-BFGS-B, PSO and another stochastic method called differential evolution nuances the statements above. Indeed, that systematic work concluded that PSO and differential evolution are able to come close to the same maximum of the concentrated log-likelihood. However, they cannot reach the exact stationary point without refinement through L-BFGS-B when the log-likelihood presents some long ridges or different maxima.
As the name suggests, PSO algorithm is based upon individual particles that swarm towards an optimum value. A given particle (i) consists of a position vector p and a velocity vector v where the velocity updates the position at each timestep t,
| pi(t) = pi(t) + vi(t + 1) | (20) |
Three factors enter the calculation of the velocity for the next iteration: (i) the particle's current velocity, (ii) the distance of the particle to the particle's previously best-known position, and (iii) the distance of the particle to the swarm's previously best-known position. These three factors are known as the particle's inertia, the cognitive learning factor and the social learning factor, respectively. Each factor has an accompanying weight to allow for fine-tuning of how much each one influences the next iteration's velocity. The social learning factor and the cognitive learning factor are also multiplied by a random factor to prevent stagnation,
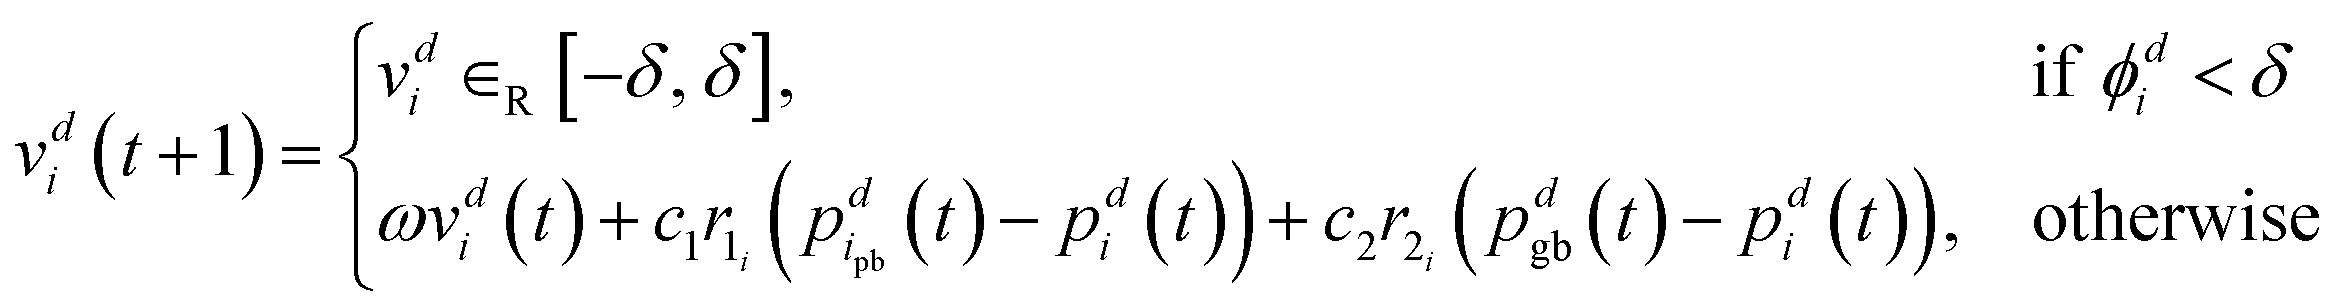
| vi(t + 1) = ωvi(t) + c1r1i(pipb(t) − pi(t)) + c2r2i(pgb(t) − pi(t)) | (21) |
 | (22) |
Plotting the inequality shown in eqn (22) produces the plot shown in Fig. 3. Such a plot shows the region of space in which the chosen PSO parameters will exhibit convergent behaviour.
 | ||
| Fig. 3 The shaded section (grey) represents the region of phase space in which the PSO parameters will exhibit convergent behaviour. | ||
Alongside the constant parameter classical PSO algorithm, FEREBUS implements four other algorithms: random unified PSO (RUPSO), random individual PSO (RIPSO), unified adaptive PSO (UAPSO46) and individual adaptive PSO (IAPSO). The RUPSO and RIPSO algorithms are the simplest and both choose all three control parameters at random whilst ensuring the convergence inequality in eqn (22) is met. The RUPSO and RIPSO algorithms aim to remove the bias from selecting a single set of control parameters. At each timestep for each particle in the swarm, the control parameters are selected using the following sets of equations,
| ω ∈R [−1, 1] | (23) |
 | (24) |
 | (25) |
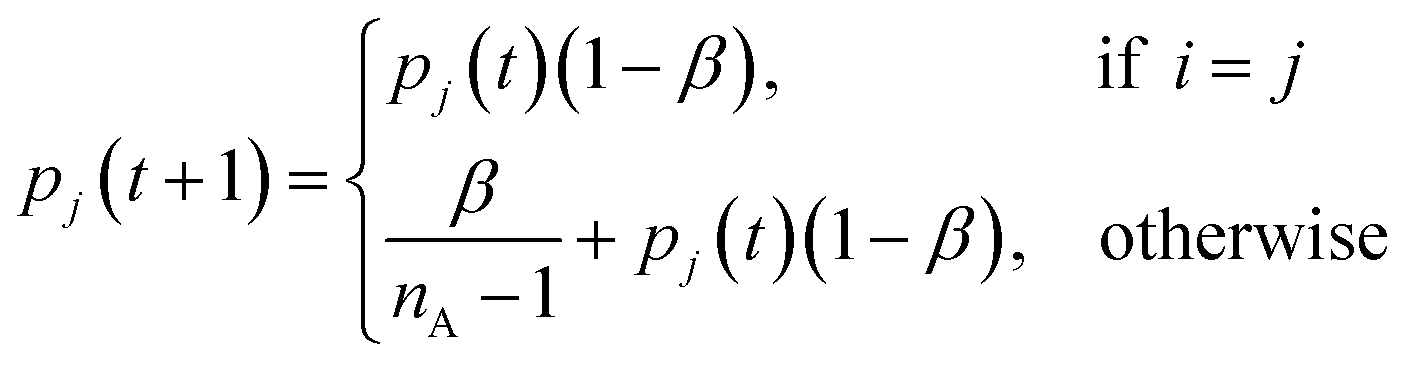
For both UAPSO and IAPSO, a learning automaton is used to select the control parameters. A learning automaton is a machine learning algorithm designed to make a decision and then learn from the environment (in terms of automaton literature) to improve the subsequent decision in the next iteration. For the purpose of the adaptive PSO algorithms, the goal is to converge towards an optimum value. Hence, selecting control parameters that result in moving towards this goal are rewarded and those that work against this goal are penalised. Rewarding a parameter results in a higher probability that the parameter will be chosen in the subsequent iteration. Conversely, penalising a parameter reduces the chance of choosing it in the subsequent iteration.
Starting with UAPSO, a learning automaton is initialised for each control parameter: ω, c1 and c2. To initialise a learning automaton, three variables are required: a minimum parameter value, a maximum parameter value and the number of parameters to generate. For each learning automaton an evenly spaced set of parameters is created alongside a uniform probability distribution. In the first iteration there is an equal chance to choose any of the control parameters in the learning automaton due to the uniform probability distribution. The probability of the chosen parameters is then adjusted based on whether the chosen parameters have improved the log-likelihood values of the swarm. If the number of particles that improved their log-likelihood values is greater than a fixed value τ, the parameter i is deemed a success and rewarded using the following,
 | (26) |
 | (27) |
FEREBUS tested the five PSO methods on their prediction of glucose. This is an elaborate and realistic test corresponding to a 51-dimensional system with 500 validation points. Fig. 4 shows the number of iterations required to converge the log-likelihood, with concomitant S-curves. The latter show which percentage of the validation set returns a prediction error smaller than a selected value (read off from the x-axis). Fig. 5 displays how the mean absolute error (MAE) varies with the marginal log-likelihood and also with the number of iterations, again for each of the five variants of PSO. From Fig. 4A it is clear that each swarm updater drastically reduces the number of iterations it takes for the PSO algorithm to converge to an optimum. Fig. 4B shows that the quality of the reached optimum directly affects the predictive accuracy of the models. In other words, the lower the marginal log-likelihood function the better the corresponding S-curve. Fig. 5A confirms this conclusion but by using the MAE as an indicator of predictive success. However, Fig. 5B shows that the predictive accuracy of the model is broadly determined by the number of iterations it takes to reach an optimum. The only exception is the slight RUPSO/RIPSO anomaly. FEREBUS is used to generate models during an active learning run. During such a run the training set is iteratively improved requiring the production of a new training set for each iteration. Most of the models during an active learning run are primarily used to find the next point to add to the training set and not used in a production setting. Therefore, the ability to produce a relatively accurate model in significantly less time is a substantial advantage where algorithms such as RIPSO and RUPSO may become very useful. In summary, trading speed for accuracy is beneficial in this case.
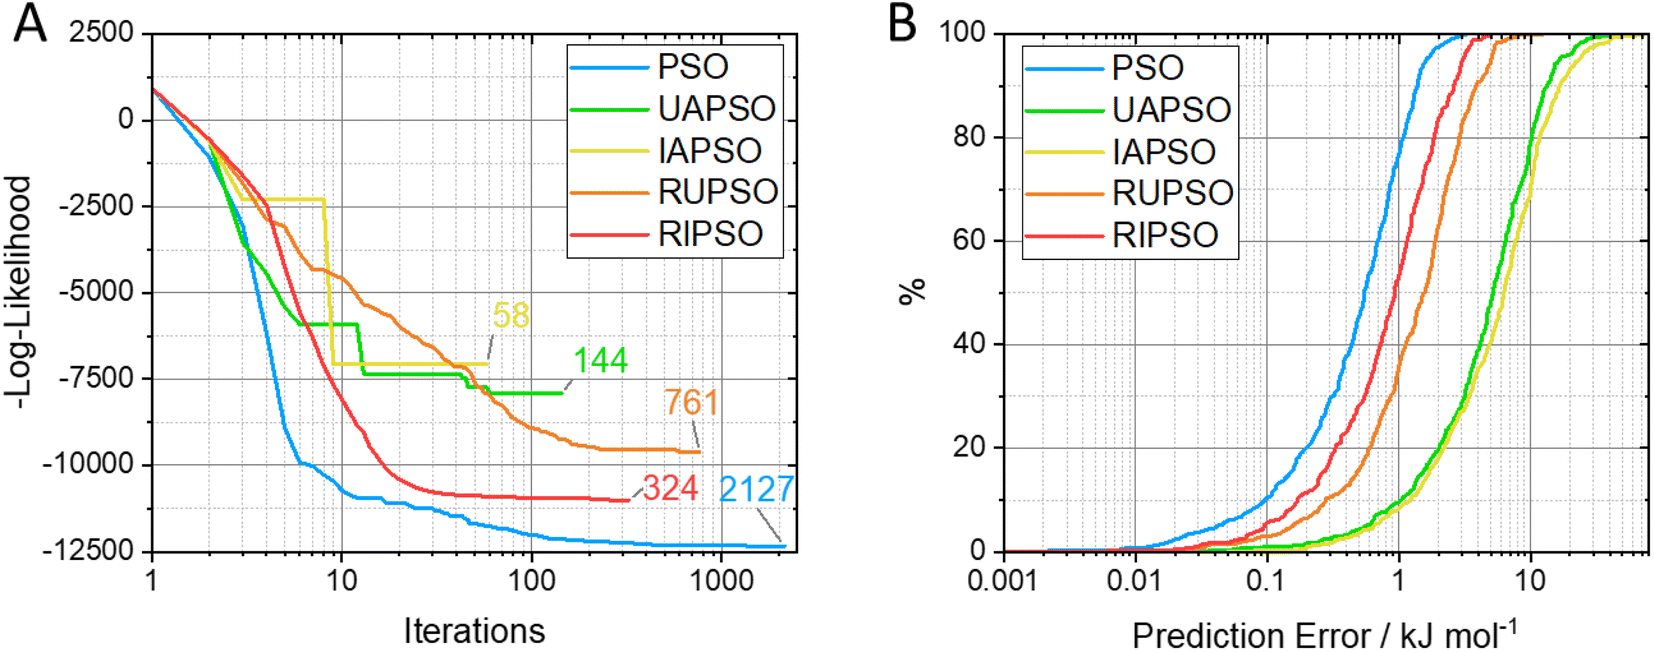 | ||
| Fig. 4 Results for glucose: (A) the number iterations taken to converge, and (B) the predictive accuracy of the model produced using each parameter updater using a 2130-point, 51-dimensional training set using the marginal log-likelihood function (note the minus sign on the y-axis of (A)). | ||
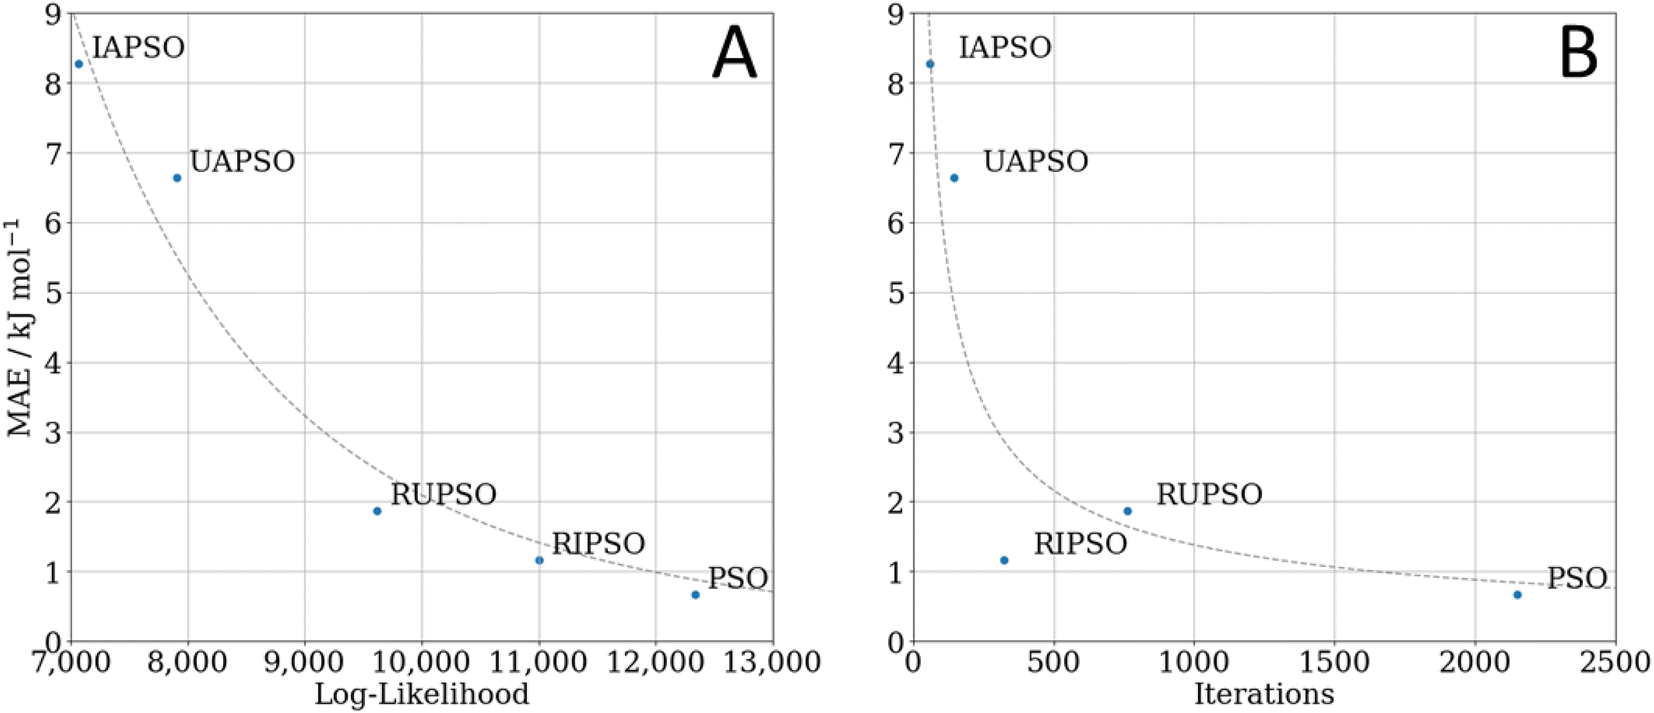 | ||
| Fig. 5 The effect on the mean absolute error (MAE) (of the model produced) of (A) the marginal log-likelihood reached, and (B) the number of optimisation iterations. All models were produced using a 2130-point, 51-dimensional training set (glucose) with 500 validation points. | ||
The f-PSO prevents getting stuck on plateaus by forcing the velocity of each particle, i, to increase if the partial potential, ϕdi, in a particular dimension, d, drops below a threshold, δ. The partial potential of a particle describes the particle's potential to move towards or away from the global optimum value in one dimension,
| ϕdi = |vdi(t + 1)| + |pdgb(t) − pdi(t)|. | (28) |
This partial potential is then used in the velocity update to determine whether to use a forced velocity update of the particle in a particular dimension or to use the regular update method shown in eqn (21) (see “otherwise”), such that for each dimension d we have,
 | (29) |
If the particle is currently close to the global optimum and the velocity in the next iteration is small then the partial potential of the particle is low and thus more likely to force a velocity update (i.e. the partial potential falls below δ). If the swarm has reached a plateau and starting to group then the partial potential for the particles on the plateau will be small, causing forced velocity updates. This should force the particles off the plateau. If the particles are grouping at an optimum, as opposed to at a plateau, the forced velocity updates will not have any effect and hence not affect the optimum reached.
2.6 Stopping criteria
Without a stopping criterion, the PSO algorithm would run until a predetermined maximum number of iterations were reached. This has the potential to be highly inefficient as an optimum could be reached long before this value, which wastes likelihood calculations and consequently much computing time. Creating a reliable stopping criterion for the PSO algorithm is a non-trivial task as each particle is performing a separate optimisation. Hence, even if it may seem like one particle has found an optimum, another particle may carry on for much longer. It is not recommended to stop each particle separately because each one finds a local optimum. This is because the other particles that are still moving can influence those that have currently stagnated. Due to the nature of the swarm optimum, only updating when a particle reaches a better optimum is also another difficulty. As a particle hits the global optimum value, and subsequently moves away from it, it is possible that the global optimum does not change for several iterations whilst the swarm carries on searching. FEREBUS implements a stopping criterion that attempts to provide a trade-off between (i) stopping too early and producing a poor model, and (ii) leaving the optimisation run too long and thereby wasting computing time.The “relative change” stopping criterion uses the difference between the current iteration's global best-known value and the best-known value in the previous iteration, divided by the previously known best-known value. The relative difference is important because different functions may have drastically different absolute values whereas the relative difference allows for the use a single tolerance value. If the relative difference of the optimum value is below the tolerance (δtol) value for the number of stall iterations (Nstall), then the optimisation is terminated. Waiting for several stall iterations for the difference to remain constant (up to a certain precision given by δtol) prevents premature termination of the optimisation. The relative-change stopping criterion has been used successfully in previous work and is the default stopping criterion in FEREBUS. The Scheme 1 below shows some algorithm details.
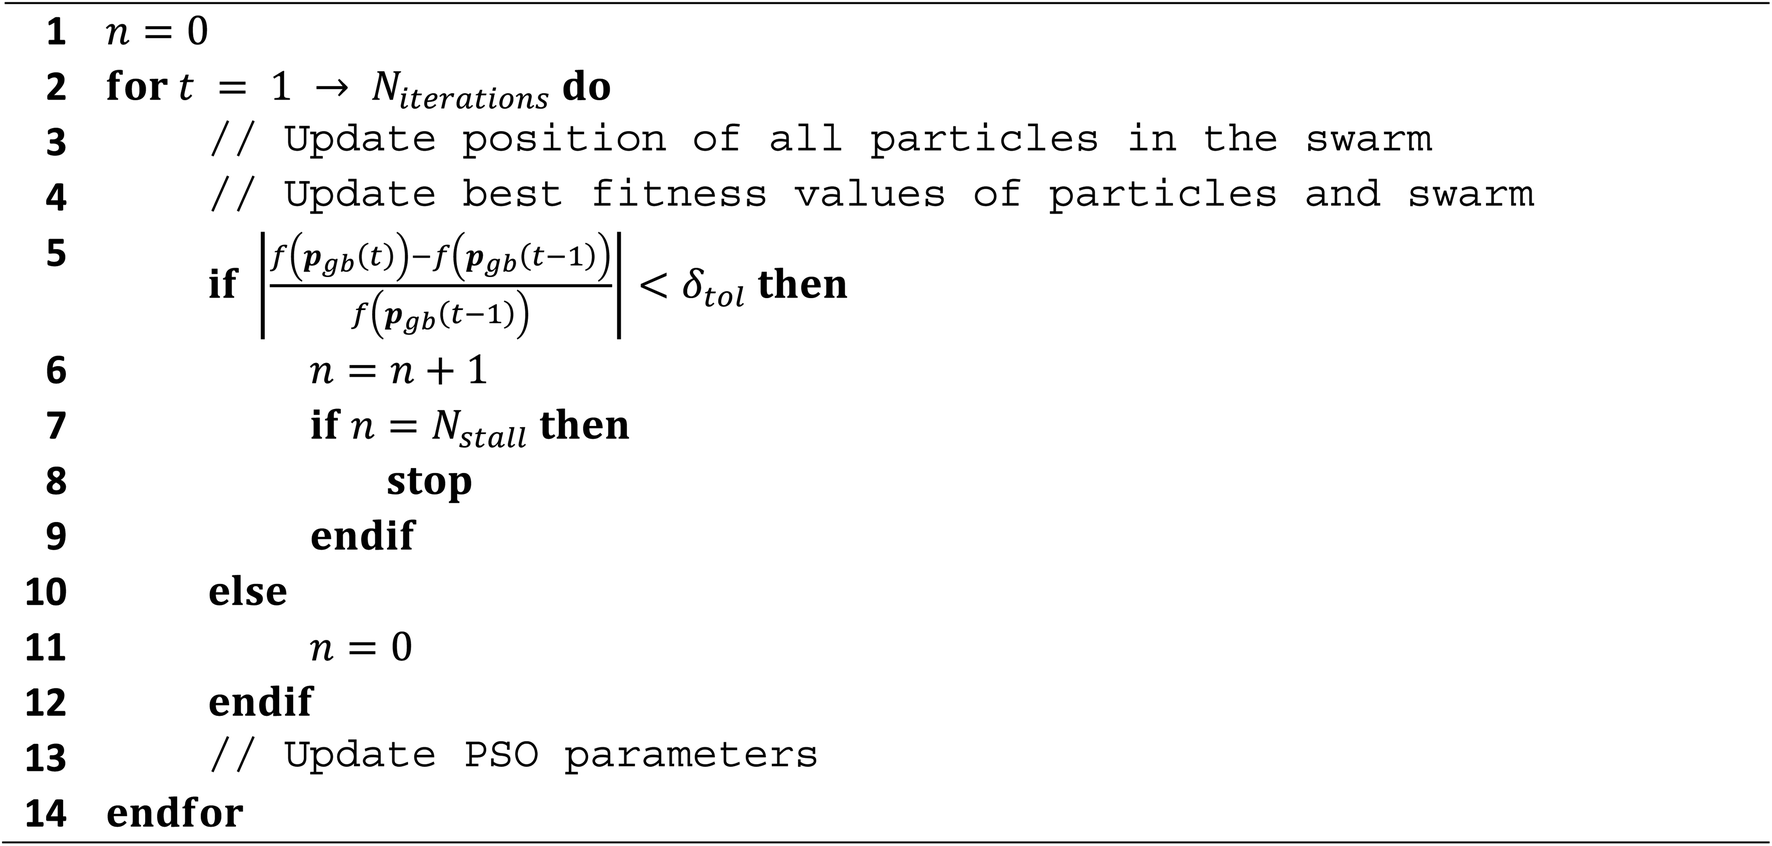 | ||
| Scheme 1 Relative change stopping criterion. | ||
Optimising the stopping criterion parameters is a trade-off between speed and accuracy. Fig. 6 shows the effect of the number of stall iterations and the tolerance of the relative difference method on three optimisation performance indicators. As can be seen from Fig. 6A, decreasing the number of stall iterations dramatically decreases the number of iterations it takes to converge. From Fig. 6B one learns that this decrease in optimisation iterations does not negatively impact the likelihood value reached, until an Nstall value of roughly 10–15, which is also reflected in the MAE of the model produced (shown in Fig. 6C). Finally, the tolerance has little effect on both the number of iterations to converge or the MAE, except for very large values (≥0.1). This is because the global best position is only updated once a better position has been found. Thus the cost value does not change for several iterations if a particle briefly moves away from the global best position. Consequently, the tolerance has little effect because the change in the best-known position during this period is zero.
 | ||
| Fig. 6 The effect of the number of stall iterations (Nstall) and the tolerance (tol) of the relative difference method on (left) the number of iterations taken to converge, on (middle) the value of the marginal log-likelihood achieved, and on (right) the mean absolute error (MAE) of the resultant model. A 1230-point, 51-dimensional training set was used during the optimisation. | ||
2.7 Ill-conditioned covariance matrices
During the log-likelihood calculation the linear system Ax = b must be solved for x. Because the covariance matrix of a GPR model is positive-definite, Cholesky factorisation is employed. If the covariance matrix is ill-conditioned then the factorisation will fail, which prevents the computation of the log-likelihood. The optimisation will fail if, during the PSO, a particle is at a position in the parameter space that produces an ill-conditioned matrix. To prevent the failure of the optimisation due to arriving at an ill-conditioned area of the optimisation surface, FEREBUS reinitialises the failed particle to a new random position with the same bounds that were used to initialise the swarm. The log-likelihood at the new position is then calculated and, if successful, the optimisation continues; otherwise, the particle is reinitialised again.Finally, we note that we add the identity matrix multiplied by a noise parameter, which is often called a nugget. This application of jitter to the diagonal of the covariance matrix was described in a previous publication.48 However, for sake of completeness we repeat here that the applied noise parameter (which scales the added unity matrix) typically ranges between 10−10 (default unoptimised value) and 10−6. This parameter can also be optimised. There is not much noise in our data because poorly integrated atoms are discarded prior to the model construction.
2.8 Parallelisation
Particle swarm optimisation allows for highly parallel execution as the function evaluation of each particle during a swarm update is independent of every other particle. Because the optimisation of the hyperparameters overwhelmingly takes the largest portion of FEREBUS's execution time, parallelising over the particles provides an almost linear speedup given the number of particles is equal to or greater than the number of threads.To ensure that there is no data race during the PSO, it is necessary that synchronous PSO is used. Synchronous PSO updates the global best position of the swarm once per swarm update after all particles have been updated. This is opposed to asynchronous PSO where after each particle's update, the global best position is also updated. For obvious reasons the latter is not suitable for parallelisation hence the necessity of synchronous PSO.
A second parallelisation strategy is employed at a lower level whilst using composite kernels. While using composite kernels to calculate the covariance between two points, two independent covariance calculations occur, and the results are combined. Much like as for the independent particle updates, the covariance calculations can be executed in parallel and then combined on a single thread. Take for example the composite kernel k = (k1 + k2) × k3, which is illustrated in Fig. 8. In serial, each kernel value would be computed sequentially before being combined. However, in the parallel implementation, all three kernels will be computed simultaneously before being combined on a single thread.
 | ||
| Fig. 7 Parallelisation strategy for the particle swarm optimisation algorithm in FEREBUS. | ||
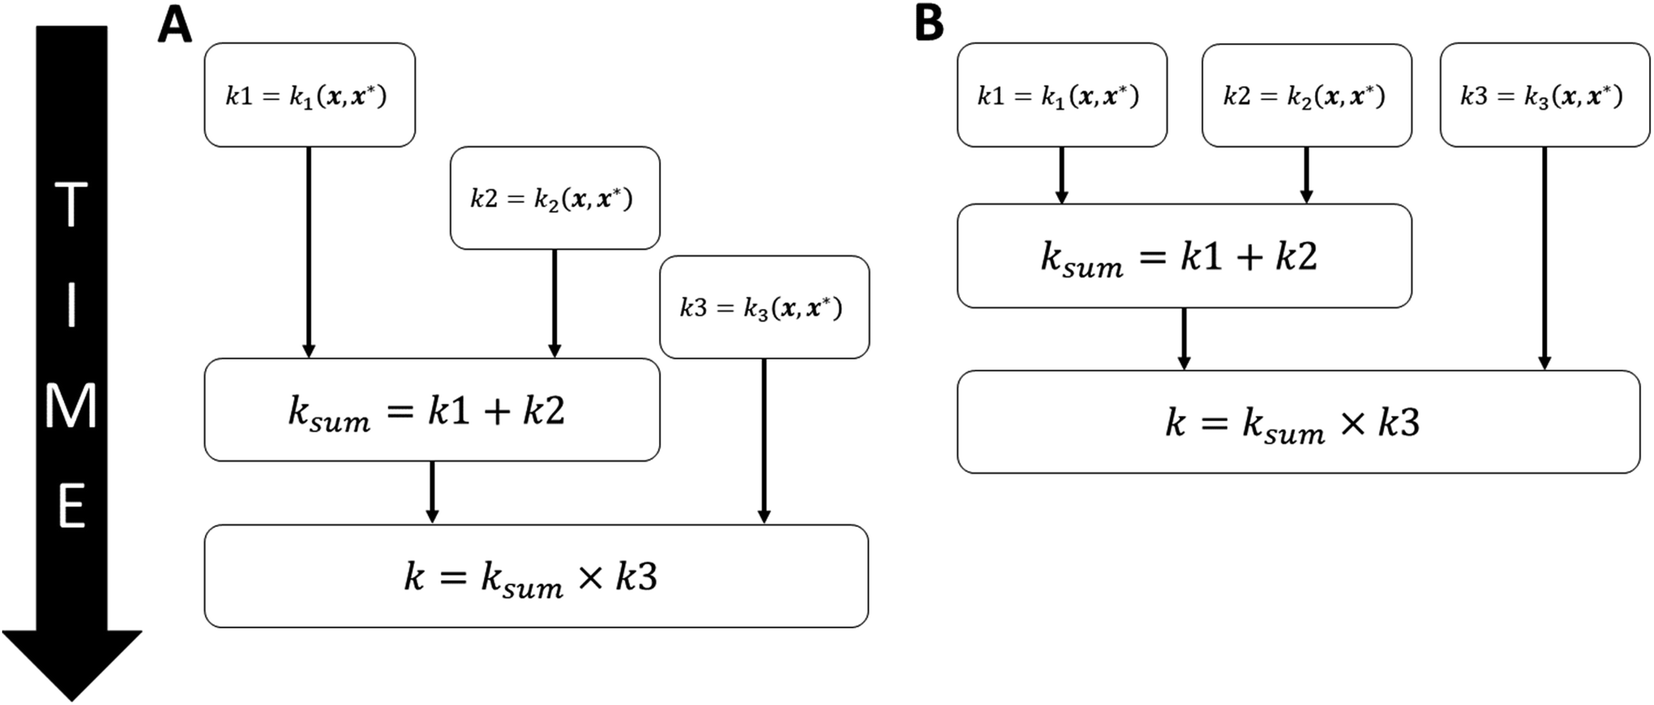 | ||
| Fig. 8 A composite kernel executing in (A) serial or (B) in parallel for the example kernel k = (k1 + k2) × k3. | ||
As can be seen from Fig. 9, the parallelisation strategy implemented in FEREBUS provides almost perfect scaling as the vast majority of FEREBUS's runtime is spent in the PSO routine. As the current parallelisation implementation uses OpenMP, the number of cores is limited to a single node. Future developments will focus on extending the parallelisation to MPI allowing for multi-node execution. Full details of the hardware used for the benchmarks can be found in the ESI.†
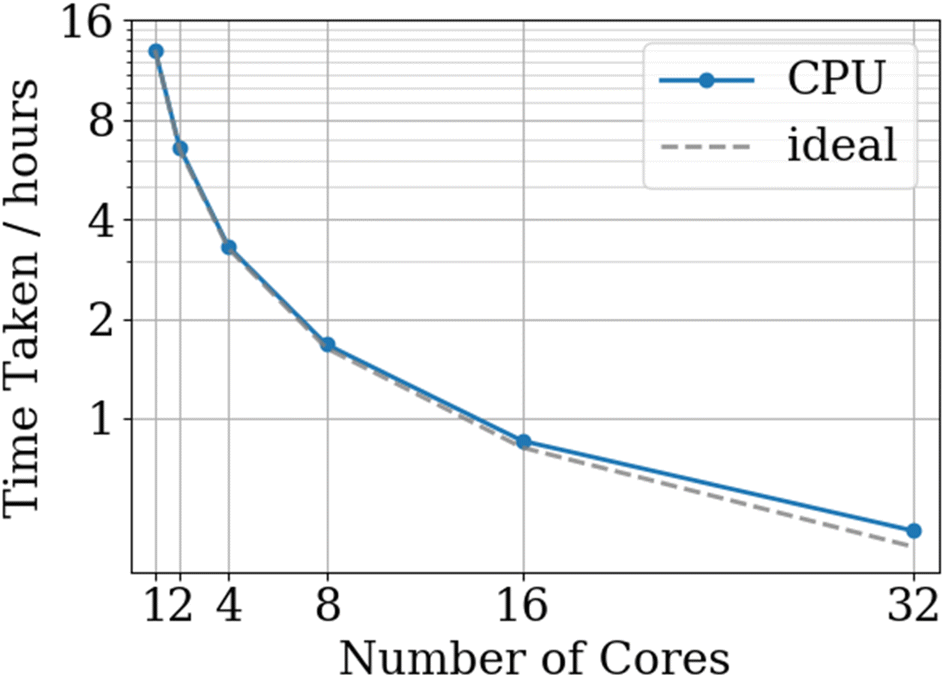 | ||
| Fig. 9 CPU FEREBUS benchmarks for a 2130-point, 51-dimensional training set running for 1000 PSO iterations with the ideal scaling based upon the serial time. | ||
2.9 GPU optimisation
After optimising FEREBUS on the CPU, further optimisation and parallelisation provide diminishing returns. To further increase the performance of FEREBUS, parts of the FEREBUS code were ported to run on the GPU using OpenAcc.As can be seen from Fig. 10, FEREBUS uses the GPU to calculate the covariance matrix (R) given a training set (X) and a set of hyperparameters (θ). The covariance matrix calculation is a highly parallel computation involving many vector difference and dot product calculations, which is perfect for offloading to the GPU. When initialising FEREBUS, the training set input (X) is copied from the CPU to the GPU asynchronously. Subsequently, each particle's position is copied over to the GPU when the covariance matrix is required. The covariance calculations are then performed on the GPU and the covariance matrix (R) is then copied back to the CPU. All data copying is carried out asynchronously allowing for more efficient data transfer and latency hiding.
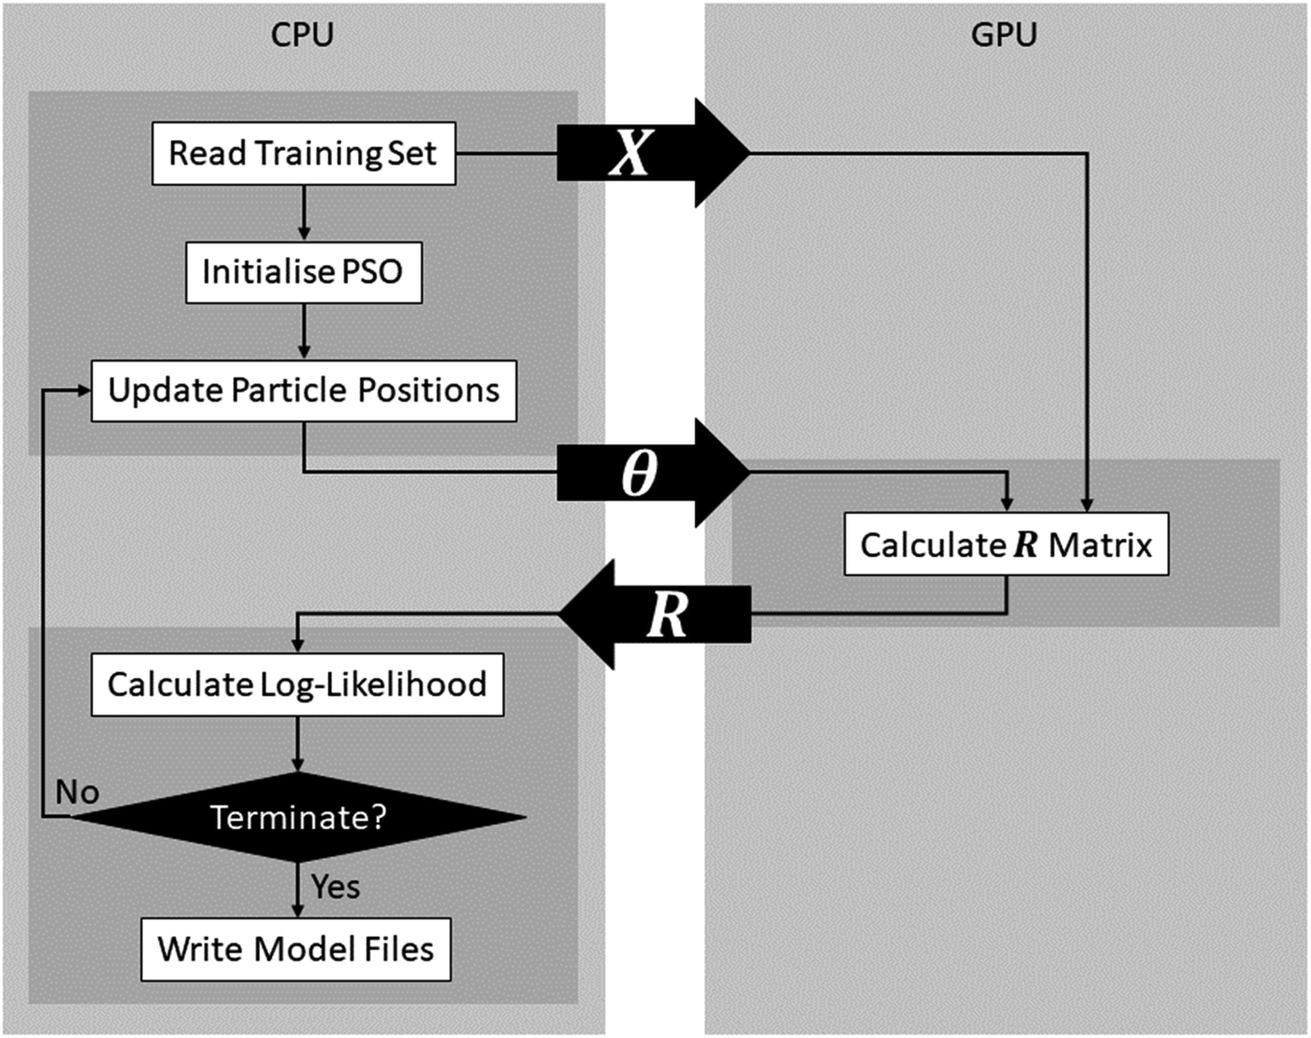 | ||
| Fig. 10 Details of GPU implementation in FEREBUS. | ||
The GPU implementation can be combined with the PSO parallelisation strategy outlined in Section 7 to further improve performance. Using the parallel PSO implementation outlined in Fig. 7, during each swarm update, each particle is running on an independent thread. During a particle update, the covariance matrix for the particle's position in search space must be computed invoking a call to the GPU. As shown in Fig. 10, this call involves transferring the hyperparameters to the GPU and then transferring the covariance matrix back. Using a single stream for this data transfer would destroy any performance gain from parallelisation because each particle would have to wait for the previous particle's data to transfer to and from the GPU. Instead, multiple streams are utilised so that each thread can transfer data independently of the other threads.
Fig. 11 shows that, on average, the GPU code is 4.2 times faster than the CPU implementation, which is comparable to a realistic speedup49 using a GPU. GPU speedup compared to CPU code is limited by two factors: (i) the performance of the GPU code, and (ii) the time it takes to transfer data to and from the GPU. From Fig. 10 it is clear that there are many more opportunities to transfer computation to the GPU. For example, porting the log-likelihood calculation to the GPU would remove the requirement of transferring the covariance matrix from the GPU and replace this transfer with the transfer of a scalar value. The GPU benchmarks were run on a V100 compute node with the CPU specs matching the CPU benchmarks where each GPU is limited to 8 cores. Full details of the hardware used for the CPU and GPU benchmarks can be found in the ESI.†
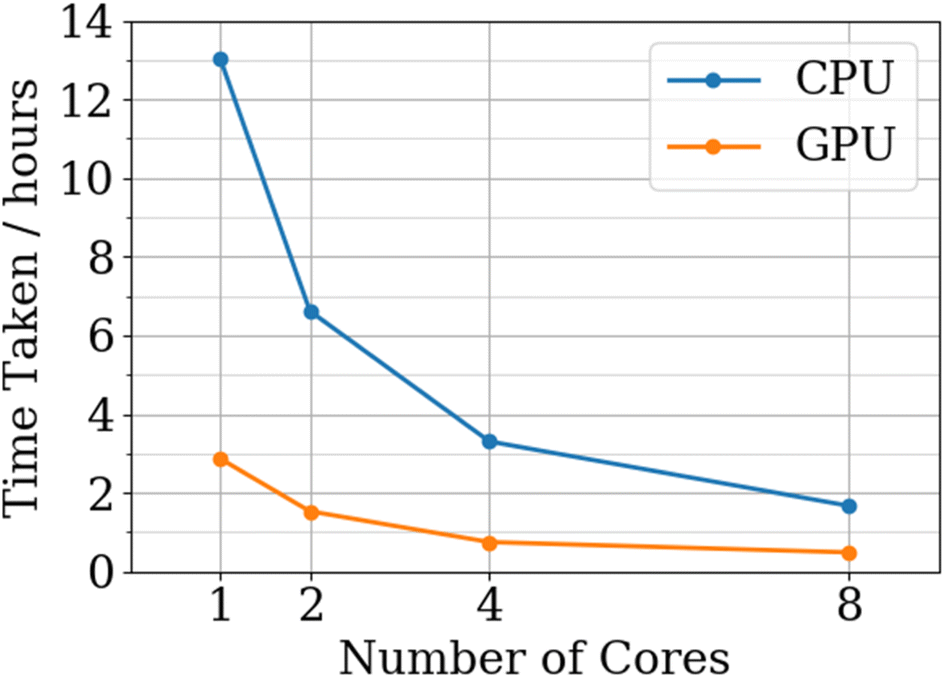 | ||
| Fig. 11 CPU versus GPU FEREBUS benchmarks for a 2130-point, 51-dimensional training set running for 1000 PSO iterations. | ||
2.10 Future work
For the high-dimensional problems considered here we will consider high-dimensional modelling strategies as sources for future work. Such strategies include TuRBO,50 which uses trust region optimisation and has been found to operate well in GP-based surrogate Bayesian optimisation loops (the performance of which will likely carry over to active learning). Additionally, projection-based methods such as variational autoencoders51 may offer strategies for mitigating against the high-dimensionality of the input space.In general, FEREBUS has been written as a library, which explains the separation of the code into an ‘app’ and a ‘src’ directory where the ‘app’ uses the ‘src’ library to perform GPR. The kernels implemented in FEREBUS can be algebraically combined, statically in code (for example using ‘k = k1 + k2 × k3’) or read from a configuration file and generated dynamically at runtime using the ‘KernelInterpreter’ and ‘KernelConfigList’ (for example, ‘k = kernel_interpreter%interpret(“k1+k2*k3”, kernel_config_list)’), which serves both use cases. Therefore, the kernel can be updated dynamically at runtime and the model retrained at runtime when new data becomes available. What FEREBUS currently lacks for an MD code such as FLARE is a prediction subroutine as FEREBUS has been designed for training only but an inference feature would not be a significant addition.
3. Conclusions
GPR models are at the centre of the FFLUX pipeline. The accuracy of the model produced by the FORTRAN90 program FEREBUS directly affects the accuracy of the simulations carried out. FEREBUS must keep up with the latest advancements in GPR research and optimisation procedures to get the most out of FFLUX. Advancements in kernel composition and active dimensions are proving their worth, universal mean functions can open the door to more robust models for simulations and performance improvements allow for much larger models to be trained within a reasonable amount of time.The time taken to train a model is made even more important whilst using FEREBUS inside an active learning workflow as a model must be retrained for each active learning iteration. Using the self-adaptive Particle Swarm Optimisation (PSO) algorithms implemented in FEREBUS, allows the user to determine a time versus accuracy trade-off that makes sense for the specific application. Less accurate models may be produced much quicker to reduce the iteration time of the active learning method whilst allowing for a final optimisation with constant parameters to produce a high accuracy production model.
OpenAcc was demonstrated as the initial GPU implementation for FEREBUS in order to accelerate the computation of the covariance matrix. Further developments may move more of the computation over to the GPU such as the log-likelihood calculation. This will reduce the time spent waiting for data transfer between the host and device leading to further performance gains.
OpenMP was used effectively both as a CPU only and GPU implementation to provide almost perfect scaling with the number of cores. The CPU-only code provides an average parallel efficiency of 96% due to the inherent parallelisability of the PSO algorithm, which allows highly concurrent computation of various positions on the cost function surface. The OpenMP implementation was also effectively integrated with the GPU implementation to open multiple streams to the GPU allowing for efficient asynchronous data transfer. The OpenAcc-OpenMP GPU implementation provides an average parallel efficiency of 88% and an average speedup factor of 4.2 over the CPU implementation.
FEREBUS has been consistently demonstrated to produce accurate GPR models using training sets with input features defined by an Atomic Local Frame (ALF). However, other types of features (as described in work of other research groups) can be used in conjunction with FEREBUS because its architecture is independent of the feature type (or output type). Due to both its CPU and GPU parallelisation, FEREBUS is placed as a high-performance alternative to commonly used Python packages, such as GPy and scikit-learn, whilst maintaining the flexibility that Python packages offer. Unlike previous versions, FEREBUS7 is not restricted to a single mean and kernel function. Instead FEREBUS7 can produce GPR models for a wide variety of problem spaces, not only limited to chemistry. In fact, the free availability of FEREBUS7 makes it possible to add one's own kernel to it. A further remarkable attribute of FEREBUS is its incorporation of PSO. A particle is re-initialised when an ill-conditioned covariance matrix appears, which adds to the robustness of FEREBUS. Finally, we note that FEREBUS always optimises its hyperparameters thereby ensuring the best predictive performance of the models it generates.
FEREBUS provides the tools for generating tailored GPR models in an efficient manner. Due to the specific requirements of the FFLUX pipeline, it is not always necessarily advantageous to invest the time in producing the most accurate model as intermediate models within an active learning run are not likely to be used in a FFLUX simulation. Providing the user with the tools to determine the time-accuracy trade-off is an invaluable asset. Packaging the functionality into a highly optimised and GPU accelerated codebase is key to producing accurate, high-dimensional GPR models with many thousands of training points.
Software information
Project Name: FEREBU-v7Project home page: https://github.com/popelier-group/FEREBUS-v7
Operating System: Linux
Programming Language: Fortran90
License: MIT
Data availability
The data that support the findings of this study are available from the corresponding author upon reasonable request.Conflicts of interest
There are no conflicts to declare.Acknowledgements
M. J. B. acknowledges the MRC National Productivity Investment Fund (NPIF) for the award of a PhD studentship.References
- X. Liu, D. Shi, S. Zhou, H. Liu and X. Yao, Expert Opin. Drug Discovery, 2018, 13, 23 Search PubMed.
- F. Mouvet, J. Villard, V. Bolnykh and U. Rothlisberger, Acc. Chem. Res., 2022, 55, 221 CrossRef CAS PubMed.
- A. Albaugh, H. A. Boateng, R. T. Bradshaw, O. N. Demerdash, J. Dziedzic, Y. Mao, D. T. Margul, J. Swails, Q. Zeng, D. A. Case, P. Eastman, L.-P. Wang, J. W. Essex, M. Head-Gordon, V. S. Pande, J. W. Ponder, Y. Shao, C.-K. Skylaris, I. T. Todorov, M. E. Tuckerman and T. Head-Gordon, J. Phys. Chem. B, 2016, 120, 9811 CrossRef CAS PubMed.
- S. Rauscher, V. Gapsys, M. J. Gajda, M. Zweckstetter, B. L. de Groot and H. Grubmüller, J. Chem. Theory Comput., 2015, 11, 5513 Search PubMed.
- M. Pinheiro, F. Ge, N. Ferré, P. O. Dral and M. Barbatti, Chem. Sci., 2021, 12, 14396 RSC.
- V. L. Deringer, A. P. Bartók, N. Bernstein, D. M. Wilkins, M. Ceriotti and G. Csányi, Chem. Rev., 2021, 121, 10073 CrossRef CAS PubMed.
- J. Behler, Chem. Rev., 2021, 121, 10037 Search PubMed.
- F. Musil, A. Grisafi, A. P. Bartók, C. Ortner, G. Csányi and M. Ceriotti, Chem. Rev., 2021, 121, 9759 CrossRef CAS PubMed.
- O. T. Unke, S. Chmiela, H. E. Sauceda, M. Gastegger, I. Poltavsky, K. T. Schütt, A. Tkatchenko and K.-R. Müller, Chem. Rev., 2021, 121, 10142 CrossRef CAS PubMed.
- T.-W. Ko, J. A. Finkler, S. Goedecker and J. Behler, Acc. Chem. Res., 2021, 54, 808 Search PubMed.
- P. L. A. Popelier, Phys. Scr., 2016, 91, 033007 CrossRef.
- M. Ceriotti, C. Clementi and O. A. v. Lilienfeld, J. Chem. Phys., 2021, 154, 160401 CrossRef CAS PubMed.
- C. M. Handley, G. I. Hawe, D. B. Kell and P. L. A. Popelier, Phys. Chem. Chem. Phys., 2009, 11, 6365 Search PubMed.
- C. M. Handley and P. L. A. Popelier, J. Phys. Chem. A, 2010, 114, 3371 Search PubMed.
- C. M. Handley and P. L. A. Popelier, J. Chem. Theory Comput., 2009, 5, 1474 CrossRef CAS PubMed.
- J. Behler and M. Parrinello, Phys. Rev. Lett., 2007, 98, 146401 CrossRef PubMed.
- G. I. Hawe and P. L. A. Popelier, Can. J. Chem., 2010, 88, 1104 Search PubMed.
- M. J. L. Mills and P. L. A. Popelier, Comput. Theor. Chem., 2011, 975, 42 Search PubMed.
- M. J. L. Mills and P. L. A. Popelier, Theor. Chem. Acc., 2012, 131, 1137 Search PubMed.
- T. L. Fletcher, S. J. Davie and P. L. A. Popelier, J. Chem. Theory Comput., 2014, 10, 3708 CrossRef CAS PubMed.
- T. L. Fletcher and P. L. A. Popelier, J. Comput. Chem., 2017, 38, 336 CrossRef CAS PubMed.
- T. L. Fletcher and P. L. A. Popelier, J. Comput. Chem., 2017, 38, 1005 Search PubMed.
- P. L. A. Popelier, Int. J. Quantum Chem., 2015, 115, 1005 CrossRef CAS.
- R. F. W. Bader, Atoms in Molecules. A Quantum Theory, Oxford Univ. Press, Oxford, Great Britain, 1990 Search PubMed.
- P. L. A. Popelier, The Quantum Theory of Atoms in Molecules, in The Nature of the Chemical Bond Revisited, ed. Frenking, G. and Shaik, S., Wiley-VCH, 2014, ch. 8, p. 271 Search PubMed.
- M. J. L. Mills and P. L. A. Popelier, J. Chem. Theory Comput., 2014, 10, 3840–3856 CrossRef CAS PubMed.
- J. C. R. Thacker, A. L. Wilson, Z. E. Hughes, M. J. Burn, P. I. Maxwell and P. L. A. Popelier, Mol. Simul., 2018, 44, 881 CrossRef CAS.
- B. C. B. Symons, M. K. Bane and P. L. A. Popelier, J. Chem. Theory Comput., 2021, 17, 7043 Search PubMed.
- I. T. Todorov, W. Smith, K. Trachenko and M. T. Dove, J. Mater. Chem., 2006, 16, 1911 RSC.
- B. C. B. Symons and P. L. A. Popelier, J. Chem. Theory Comput., 2022, 18, 5577–5888 Search PubMed.
- N. Di Pasquale, M. Bane, S. J. Davie and P. L. A. Popelier, J. Comput. Chem., 2016, 37, 2606 Search PubMed.
- N. Di Pasquale, S. J. Davie and P. L. A. Popelier, J. Chem. Theory Comput., 2016, 12, 1499 Search PubMed.
- J. R. Gardner, G. Pleiss, D. Bindel, K. Q. Weinberger and A. G. Wilson, Proceedings of the 32nd International Conference on Neural Information Processing Systems, Curran Associates Inc., Montréal, Canada, 2018, p. 7587 Search PubMed.
- Gpy, http://sheffieldml.github.io/GPy/, Great Britain.
- C. E. Rasmussen and C. K. I. Williams, Gaussian Processes for Machine Learning.The MIT Press: Cambridge, USA, 2006 Search PubMed.
- G. V. F. Pedregosa, A. Gramfort, V. Michel, B. Thirion, O. Grisel, M. Blondel, P. Prettenhofer, R. Weiss, V. Dubourg, J. Vanderplas, A. Passos, D. Cournapeau, M. Brucher, M. Perrot and E. Duchesnay, J. Mach. Learn. Res., 2011, 12, 2825 Search PubMed.
- A. G. de Garis Matthews, M. van der Wilk, T. Nickson, K. Fujii, A. Boukouvalas, P. Leon-Villagra, Z. Ghahramani and J. Hensman, J. Mach. Learn. Res, 2017, 18, 1 Search PubMed.
- H. B. Moss and R.-R. Griffiths, ML4 Molecules Workshop at NeurIPS, arXiv, 2020, preprint, arXiv:2010.01118, DOI:10.48550/arXiv.2010.01118.
- R.-R. Griffiths, L. Klarner, H. B. Moss, A. Ravuri, S. Truong, B. Rankovic, Y. Du, A. Jamasb, J. Schwartz, A. Tripp, G. Kell, A. Bourached, A. J. Chan, J. Moss, C. Guo, A. A. Lee, P. Schwaller and J. Tang, Proceedings of the 39th International Conference on Machine Learning, Baltimore, Maryland, USA, PMLR 162, 2022 Search PubMed.
- M. J. Burn and P. L. A. Popelier, J. Chem. Phys., 2020, 153, 054111 Search PubMed.
- E. Anderson, Z. Bai, C. Bischof, S. Blackford, J. Demmel, F. Dongarra, J. Du Croz, A. Greenbaum, S. Hammarling, A. McKenney and D. Sorensen, LAPACK Users' Guide, Society for Industrial and Applied Mathematics, Philadelphia, PA, USA, 3rd edn, 1999 Search PubMed.
- D. K. Duvenaud, PhD thesis, The University of Cambridge, Cambridge, Britain, 2014.
- J. Kennedy and R. C. Eberhart, Proceedings of the IEEE Int. Conf. on Neural Networks, 1995, vol. 4, p. 1942 Search PubMed.
- M. Clerc, From theory to practice in Particle Swarm Optimisation, in Handbook of Swarm Intelligence. Concepts, Principles and Applications, ed. Panigrahi, B. K., Shi, Y. and Lim, M., Springer, 2011, ch. 8, p. 544 Search PubMed.
- K. R. Harrison, A. P. Engelbrecht and B. M. Ombuki-Berman, Swarm Intelligence, 2018, 12, 187 CrossRef.
- B. Hashemi and M. Meybodi, Appl. Soft Comput., 2011, 11, 689 CrossRef.
- B. Bassimir, M. Schmitt and R. Wanka, Swarm Intelligence, 2020, 285 CrossRef.
- M. J. Burn and P. L. A. Popelier, Mater. Adv., 2022, 3, 8729–8739 RSC , in press..
- V. W. Lee, C. Kim, J. Chhugani, M. Deisher, D. Kim, A. D. Nguyen, N. Satish, M. Smelyanskiy, S. Chennupaty, P. Hammarlund, R. Singhal and P. Dubey, SIGARCH Comput. Archit. News, 2010, vol. 38, p. 451 Search PubMed.
- D. Eriksson, M. Pearce, J. R. Gardner, R. Turner and M. Poloczek, Advances in neural information processing systems, 33rd Conference on Neural Information Processing Systems (NeurIPS 2019), 2019 Search PubMed.
- A. Grosnit, A. M. Maraval, R. Tutunov, R.-R. Griffiths, A. I. Cowen-Rivers, L. Yang, L. Zhu, W. Lyu, Z. Chen, J. Wang, J. Peters and H. B. Ammar, arXiv, 2021, preprint, arXiv:2106.03609, DOI:10.48550/arXiv.2106.03609.
Footnotes |
| † Electronic supplementary information (ESI) available: 1. FEREBUS Benchmarks. 1.1 Hardware: CPU (Table S1), GPU (Table S2); 1.2 Optimisation Parameters: PSO (Table S3), Model (Table S4), 1.3 Timings: CPU benchmark (Table S5), GPU benchmark (Table S6), Comparison between CPU and GPU (Table S7). 2. Kernel Interpreter: (Table S8) All token types used within the FEREBUS kernel lexer; (Fig. S1) Schematic for interpreting an example composite kernel; 3. Likelihood Functions: mathematical details; likelihood value versus PSO iteration (Fig. S2); prediction errors (S-curves) for the models shown in (Fig. S3); (Table S9) Table showing the model details, RMSE and maximum prediction errors of atomic energies shown in Fig. S2 and S3. See DOI: https://doi.org/10.1039/d2dd00082b |
| ‡ Present address: Department of Chemistry, Dover Street Bldg, the University of Manchester, Manchester, M13 9GB, UK. |
| This journal is © The Royal Society of Chemistry 2023 |