
 Open Access Article
 This Open Access Article is licensed under a
 Creative Commons Attribution 3.0 Unported Licence
Structure sensitivity of Cu supported on manganese oxide catalysts in levulinic acid hydrogenation†
Nayan Jyoti
Mazumdar
 a,
Praveen
Kumar
b,
Miryam
Arredondo-Arechavala
b,
Nancy
Artioli
ac and
Haresh
Manyar
*a
a,
Praveen
Kumar
b,
Miryam
Arredondo-Arechavala
b,
Nancy
Artioli
ac and
Haresh
Manyar
*a
aSchool of Chemistry and Chemical Engineering, Queen's University Belfast, David-Keir Building, Stranmillis Road, Belfast, BT9 5AG, UK. E-mail: h.manyar@qub.ac.uk
bSchool of Mathematics and Physics, Belfast, BT7 1NN, UK
cDepartment of Civil, Environmental, Architectural Engineering and Mathematics, University of Brescia, Via Branze, 43, 25123 Brescia, Italy
First published on 15th December 2023
Abstract
Different synthesis methods were used to prepare a series of size-controlled copper nanoparticles supported on manganese oxide octahedral molecular sieve (OMS-2) catalysts. All Cu/OMS-2 catalysts, with average Cu nanoparticle sizes prepared in the range of 2–22 nm, were thoroughly characterised using X-ray diffraction (XRD), N2 sorption, H2 temperature programmed reduction (TPR), transmission electron microscopy (TEM), and ICP-OES elemental analyses. The catalytic activity of the size-controlled Cu/OMS-2 catalysts was investigated in liquid phase hydrogenation of levulinic acid as a model reaction to evaluate the nanoparticle size dependance and structure–activity relationship. The catalytic activity studies showed that the catalyst performance depends greatly on the catalyst preparation methodology and Cu nanoparticle size. Complete conversion of levulinic acid with a high γ-valerolactone yield, >99%, was observed using Cu/OMS-2 catalysts prepared by the precipitation–deposition (Cu nanoparticle size 2–3 nm) method. In comparison to wet-impregnated catalysts (Cu particle size 20–22 nm), the improved performance of precipitation–deposition catalysts was mainly attributed to the well-distributed, smaller Cu nanoparticles. The influence of Cu nanoparticle size is correlated with the turnover frequency (TOF, h−1) for levulinic acid conversion, indicating the structure sensitivity of the levulinic acid hydrogenation reaction.
1. Introduction
Recent advances in nanomaterial synthesis allow us to have better control over the size and shape of metal nanoparticles leading to unique and superior physico-chemical properties. This opens new possibilities in catalysis to design more efficient and improved supported nanoparticle catalysts by controlling the size, shape, and composition of metal nanoparticles. Traditionally, heterogeneous catalysis by metals involves the impregnation of precursor salts on high surface area supports to synthesize highly dispersed metal nanoparticles. This strategy yields thermodynamically stable quasi-spherical metal nanoparticles. The distribution of active sites on metal nanoparticles is size and shape dependent, which determines the catalytic activity of nanoparticles in structure-sensitive reactions affecting the reaction rates and product distribution.Levulinic acid (LA) hydrogenation to γ-valerolactone (GVL) using heterogeneous catalysts with supported noble metals Ru, Pd, Pt, Ni, Rh, Ir, Au etc. has been extensively investigated under both gas phase and liquid phase conditions.1 Industrial-scale implementation and upscaling face considerable challenges due to the high costs and limited availability of noble metals. Non-noble metal heterogeneous supported catalysts are cheap and easily available, which is also significant in terms of cost reduction. The catalytic activity of earth-abundant metals, such as Cu, is typically lower than that of precious metals.2 Surface chemistry techniques have indicated that the structure and size of metal particles considerably affect the catalytic properties, while studies on sub-nanometer metal clusters in heterogeneous catalysis have revealed distinct size-dependent trends.3,4 Step-edge surface sites has been explored to gain more insights into their capability in reducing energy barriers during the adsorption of reactants and products in chemical reactions in order to improve the catalytic activity.5 Metal nanoparticles (NPs) with size of less than 10 nm modify the surface in contact with the adsorption sites and alter the surface structure.6 In transition metal nanoparticles, the particles with size >10 nm have their surface determined by the termination of the bulk structure, while smaller particles <10 nm show interactions between surface energies and bulk structure energies, resulting in the formation of metal clusters and various particle shapes and sizes.6 These factors significantly affect the chemical activity of particles smaller than 10 nm. Metal clusters can behave like molecules, where their reactivity can be controlled by their orbital structure, or they can behave like bulk structures, which in turn impacts the catalytic activity in structure-sensitive reactions. Furthermore, metal nanoparticles with a size range of 2–10 nm has been found to have a significant effect on the catalytic activity and product selectivity for hydrogenation reactions and dissociation reactions.7–12 In LA hydrogenation to GVL, precious metal catalysts like ruthenium (Ru) supported on titania (TiO2), ZSM-5, and as nanoparticles (NPs) have shown excellent activity under varying reaction conditions (70–200 °C, 1–40 bar H2), achieving high LA conversion (>99%) and GVL yield (>96%).13–15 However, these metals also suffer from inherent disadvantages, like scarce availability, high cost, and toxicity. In this regard, the use of more sustainable metals is necessary, and the catalysts based on earth-abundant transition metals, which are low in cost and easily available have proven as attractive alternatives. Copper is one such metal, which is easily available and has been extensively studied in hydrogenations.
Due to the increasing global population and technological developments, our society is facing a rise in overall energy consumption. Projections show that investments in energy for the year 2023 are anticipated to reach approximately USD 2.8 trillion.16 In 2022, there was a 0.9% increase in global energy-related CO2 emissions, reaching a new record of more than 36.8 billion metric tons of CO2.17 Countries are applying various protocols to reduce CO2 emissions and combat global warming by decreasing utilisation of fossil fuels and shifting to renewable, and sustainable energy alternatives.18 Biomass-derived platform chemicals, such as LA, have been identified as an important intermediate platform chemical which can be further upgraded to produce biofuels and biofuel additives.19 LA can be converted to produce value-added chemicals such as γ-valerolactone, 5-hydroxymethylfurfural, levulinate esters and 2-methyltetrahydrofuran.20 As proposed in Scheme 1, LA undergoes dehydration leading to the formation of α-angelica lactone (α-AL). α-AL is further hydrogenated to produce GVL. GVL is a promising alternative to bioethanol due to its lower vapor pressure, high boiling point, and energy density and can be utilised as solvents, fuel additives, and even in the production of nylon intermediates.21 Furthermore, GVL can be upgraded to jet-fuel blends via formation of C4 alkenes.22,23
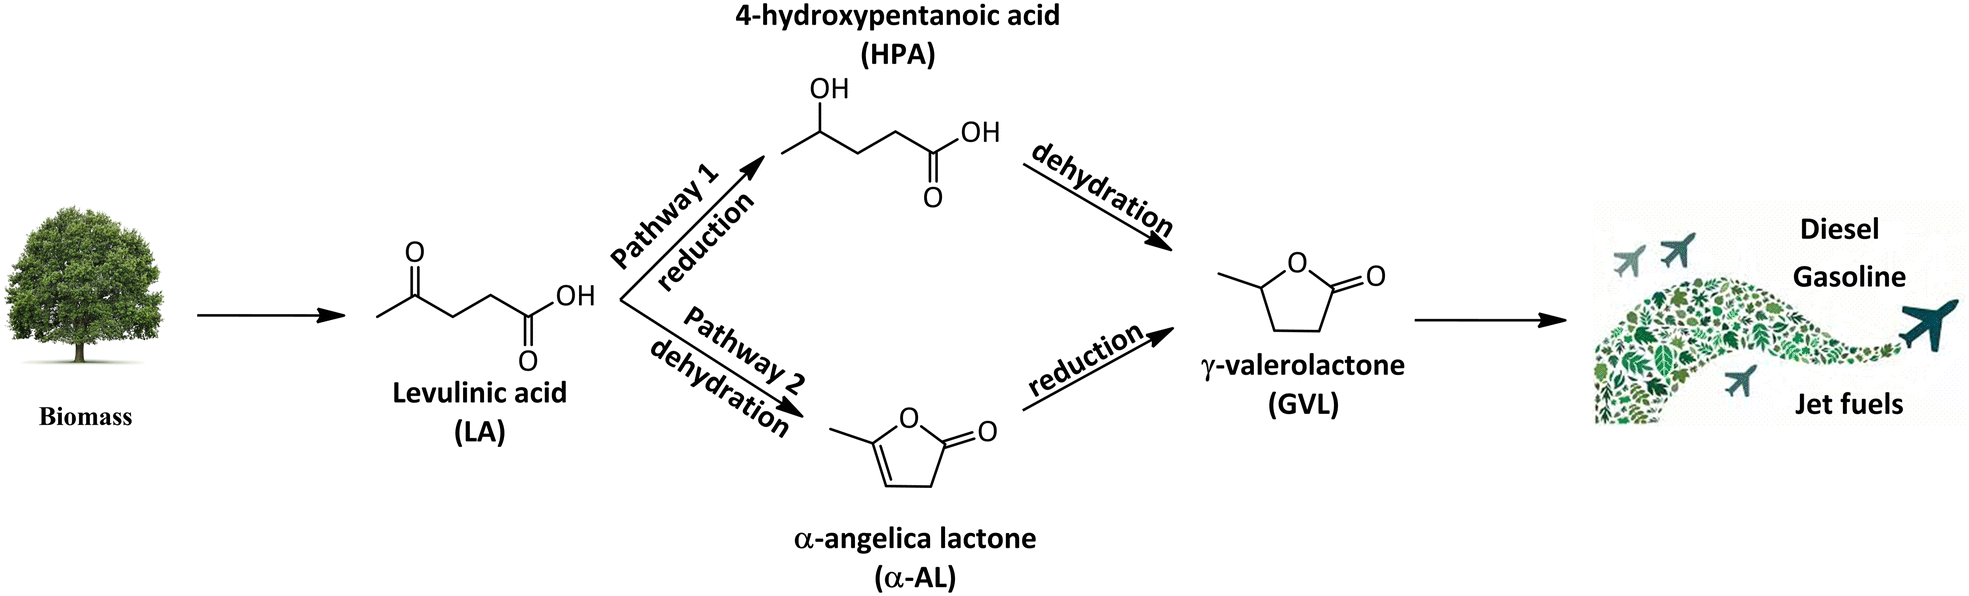 | ||
| Scheme 1 Reaction pathways for the synthesis of γ-valerolactone and green aviation fuels from levulinic acid. | ||
Rode et al. demonstrated Cu supported on Al2O3, and ZrO2 showed good selectivity towards GVL.24 Zhang and co-workers investigated Ag–Cu/Al2O3 to suppress leaching of Cu and improve re-usability of the catalyst.25 Despite many studies over Cu-based catalysts, there is still a gap in understanding the active species of Cu participating in the reaction. Several research groups have suggested an interaction between Cu species, which participate as Cu0 and Cu+ with mixed-metal oxide support to influence the catalytic activity.26–30 There is still a need to investigate the role of Cu-support effects and the effect of Cu particle size to enhance the hydrogenation activity, for a rational design of an improved catalyst. Recently, we have synthesised and evaluated a series of Cu supported on manganese oxide octahedral molecular sieve (OMS-2) catalysts and showed that 20 wt% Cu/OMS-2 (average Cu size 27 nm) exhibited good activity for LA hydrogenation.31 Other studies have also demonstrated that an average size of 15 nm for NPs are attributed to high dispersion of Cu on its support, which results in the conversion of LA to GVL with high yield.32 In the literature, LA hydrogenation is known for its structure sensitivity and the influence of metal nanoparticle size on catalytic activity. Ruppert et al. studied Ru/TiO2 catalysts and found that the optimal Ru particle size for LA hydrogenation was within the range of 3–4 nm.33 Similarly, Berg et al. investigated the impact of copper particle size within the range where surface structure changes occur, specifically below 10 nm, in methanol synthesis reaction.7 Decreasing the size of copper particles enhanced the dispersion, leading to higher catalytic activity. Recently our group has demonstrated high activity and selectivity using manganese oxide OMS-2 based catalysts in a range of hydrogenation, oxidation, and decomposition reactions.34–46 We have also shown the utilisation of Pt doped OMS-2 as selective hydrogenation catalysts for cinnamaldehyde reduction, with high selectivities to cinnamyl alcohol.47,48 Pt/OMS-2 was shown as an efficient and selective hydrogenation catalyst, further enhanced with Pt-doping, which was attributed to water assisted H2-dissociation.49
In this study, we have investigated the catalytic activity of supported Cu nanoparticle catalysts for the hydrogenation of LA to GVL. We have established the synthesis protocols for size control of Cu nanoparticles in the range of 2 to 27 nm. We further evaluated the catalytic activity of the prepared Cu/OMS-2 catalysts in LA hydrogenation, and correlated the turnover frequencies with Cu nanoparticle sizes. For development of more sustainable processes, using earth abundant metal catalysts such as Cu instead of precious noble metal catalysts would go a long way.
2. Experimental section
2.1 Materials
Levulinic acid (C5H8O3, 98%), copper nitrate hemi-pentahydrate (Cu(NO3)2·2.5H2O, 98%), copper(II) oxide (CuO, ≥99.0%) and 1,4-dioxane (C4H8O2, 99%) were purchased from Alfa Aesar. γ-Valerolactone (C5H8O2, 99%), α-angelica lactone (C5H6O2, 98%), tetrahydrofuran ((CH2)4O, 98%) and maleic acid (C4H4O4, 98%) were purchased from Sigma Aldrich. Potassium permanganate (KMnO4, 98%) and ammonium bicarbonate (NH4HCO3, 99%) were procured from Honeywell Fluka. All chemicals were used without any further purification.2.2 Catalyst preparation
![[thin space (1/6-em)]](https://www.rsc.org/images/entities/char_2009.gif) :1, and the solution was further stirred for 3 h at room temperature. A dark brown gel was formed on the top layer which was allowed to settle and then decanted off. Deionised water was added, and the solution was stirred again for 10 min and the process was repeated for three times. The resultant mixture was vacuum filtered to separate excess water and dried overnight in the oven at 120 °C. The dried OMS-2 was calcined at 450 °C for 3 h in the presence of air.
:1, and the solution was further stirred for 3 h at room temperature. A dark brown gel was formed on the top layer which was allowed to settle and then decanted off. Deionised water was added, and the solution was stirred again for 10 min and the process was repeated for three times. The resultant mixture was vacuum filtered to separate excess water and dried overnight in the oven at 120 °C. The dried OMS-2 was calcined at 450 °C for 3 h in the presence of air.
2.3 Catalyst to characterisation
Powder X-ray diffraction (XRD) measurements were performed with CuK α-radiation (1.5405 Å) on a PANalytical X’PERT PRO MPD diffractometer, equipped with a nickel filter, and operated at 40 kV and 40 mA. The scattered X-ray intensities were measured between 5 to 80° (2θ) with a counting time of 0.5 s. Scherer's equation was applied to determine the mean size of Cu NPs.where d is the mean diameter of Cu NPs (nm), λ is the wavelength of the X-ray radiation source (nm), β is the full width at half maximum (FWHM, radians) of the peak at the given diffraction angle, 2θ.
The specific surface area, pore volume and average pore diameter were determined by N2 adsorption–desorption isotherms at 77 K using a Micromeritics ASAP 2020 instrument. The Brunauer–Emmett–Teller (BET) equation was used for surface area analysis, and the Barrett–Joyner–Halenda (BJH) model was used for pore volume analysis.
Metal loading (%) was studied using a Perkin-Elmer Optima 4300 ICP-OES to measure the Cu content present in the catalysts.
H2 temperature-programmed reduction (H2-TPR) analysis was carried out using a Micromeritics AutoChem II instrument to analyse the reducibility of the catalysts. Samples (0.1 g) were loaded inside a quartz U-tube and heated to 800 °C from room temperature at a rate of 15 °C min−1 under 10% H2–Ar.
Transmission electron microscopy (TEM) was carried out using a Thermo Fisher Talos F200X G2 operated at 200 kV. Samples were prepared for TEM by mixing the catalyst in ethanol and sonicating it for 5 min to avoid any agglomeration. The sample was then drop-casted on the TEM grid.
2.4 Catalytic activity
Hydrogenation reaction of LA to GVL was carried out using a 100 ml Autoclave Engineers’ reactor having pressure and temperature limits of 200 bar and 200 °C respectively. For catalyst activity testing, prior to the hydrogenation reaction, catalyst pre-reduction was performed at 200 °C at 20 bar H2 pressure for 2 h. The reactor was charged with 200 mg of the catalyst and 30 ml of 1,4-dioxane:water (3:7 mol ratio) for catalyst pre-reduction and purged with H2 to remove any residual gas. The reactor was then heated to 200 °C, to pressurized with 20 bar H2 and stirred at 1500 rpm for 2 h. After pre-reducing the catalyst, the reactor was cooled and then 1 g LA was charged in the reactor and purged four times with H2. Thereafter the reactor was heated to 190 °C and to pressurized with 20 bar H2 and agitated to 1500 rpm; this was measured to be time zero. In our previous study, using design of experiment (DoE) to optimisation, we found 190 °C temperature, 20 bar H2 pressure, and speed of agitation at 1500 rpm as the optimum reaction conditions for LA hydrogenation.31 During the reaction, small aliquots of the sample were collected, filtered, and analysed using a Perkin-Elmer Clarus 500 GC fitted with a Zebron ZB-Wax column (30 m, 0.32 mm, and 0.25 mm) and an FID detector. Tetrahydrofuran (THF) was used an internal standard.
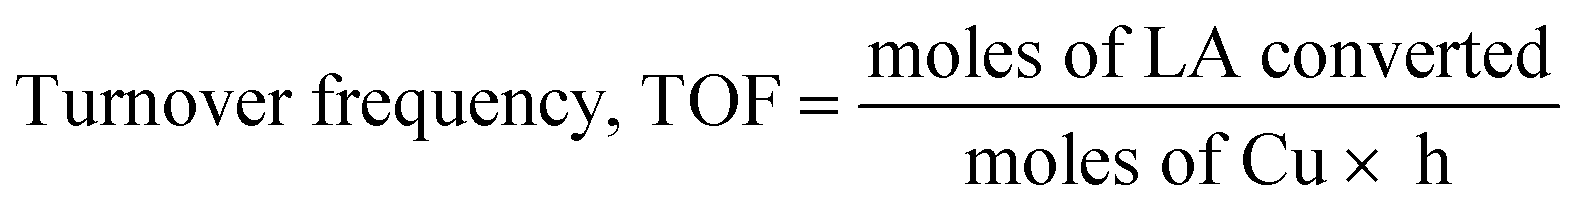
Turnover frequency, TOF (h−1) was calculated based on low conversions obtained at 1 h, using the following equation:
3. Results and discussion
3.1 Catalyst to characterisation
A series of Cu/OMS-2 catalysts with 5, 10 and 20 wt% Cu loading was prepared using Wet-Imp and Pre-Dep methods. The synthesized materials were thoroughly to characterised, and the structural properties such as measured Cu content, BET specific surface area and pore volume are given in Table 1. The comparison of theoretical and measured Cu wt% using ICP analysis is also shown, which indicated that similar Cu wt% loadings were achieved using different catalyst preparation methods. From structural properties, at first, it is noticed that there is a distinct and measurable effect of the catalyst preparation method on the structural properties. For instance, the BET surface areas were noticeably higher when catalysts with similar Cu wt% loadings were prepared using the Pre-Dep method as compared to the Wet-Imp method. A similar trend for an increase in the pore volume is also noticed, 0.107–0.145 cm3 g−1 in Wet-Imp catalysts, which increased to 0.184–0.187 cm3 g−1 in Pre-Dep catalysts (Table 1). The above trends could be attributed to the difference in the Cu NP sizes, and Cu metal dispersion on the surface. Both set of catalysts were analysed using X-ray diffraction analysis, and the corresponding XRD patterns are shown in Fig. 1. The peaks at 2θ values of 28.7°, 37.5, 41.9°, 50.0°, 60.1 and 65.2° correspond to the cryptomelane structure of manganese oxide OMS-2 material.51,52Fig. 1(a) shows Cu peaks at 43.3° (111) and 74.13° (220).53 The CuO phase appears as a sharp peak at 38.9° (200) which confirms that CuO is monoclinic and is consistent with the peaks of the CuO standard PDF #48-1548. Diffraction peaks of cuprite were also observed at angles 32.6° (110) and 36.2° (111) respectively.54| Catalysts | Measured Cua (wt%) | Specific surface areab (m2 g−1) | Pore volumec (cm3 g−1) | Average Cu crystallite size (nm) | ||
|---|---|---|---|---|---|---|
| XRD analysisd | TEM analysise | |||||
| a Measured using ICP-OES. b Measured using BET analysis. c Determined using the BJH method. d Calculated using Scherrer’s eqn. e Measured using ImageJ software. | ||||||
| Wet-Imp Cu/OMS-2 | 5 wt% | 5.06 | 27.3 | 0.145 | 19.8 | 19.2 |
| 10 wt% | 10.80 | 23.6 | 0.113 | 20.9 | 20.0 | |
| 20 wt% | 20.91 | 20.7 | 0.107 | 22.9 | 22.0 | |
| Pre-Dep Cu/OMS-2 | 5 wt% | 5.37 | 68.9 | 0.187 | — | 2.6 |
| 10 wt% | 10.90 | 58.8 | 0.164 | 11.2 | 11.9 | |
| 20 wt% | 20.32 | 42.2 | 0.184 | 14.1 | 14.6 | |
| OMS-2 | — | — | 76.1 | 0.250 | — | — |
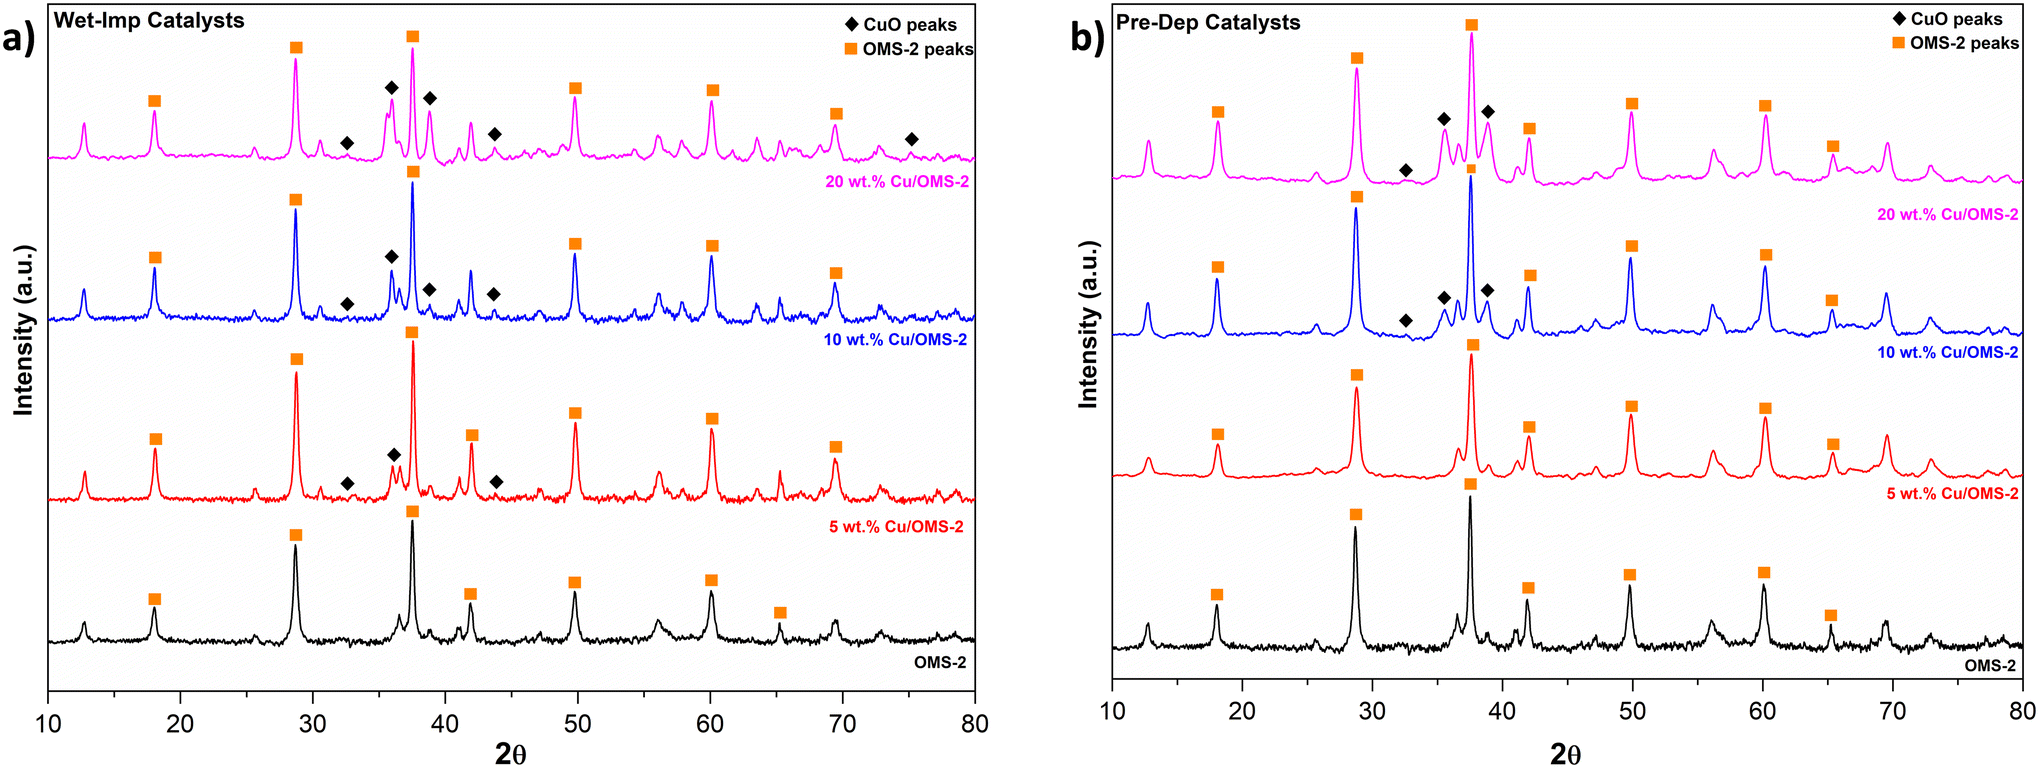 | ||
| Fig. 1 XRD patterns of Cu/OMS-2 catalysts prepared by the (a) Wet-Imp; (b) Pre-Dep method. | ||
For Wet-Imp 5, 10 and 20 wt% Cu/OMS-2 catalysts, the average Cu crystallite sizes were calculated using the Scherer equation, and found to be 19.8, 20.9 and 22.9 nm respectively. Similarly, the Cu crystallite average size from Pre-Dep catalysts was calculated from Fig. 1(b) diffraction peaks of 36.2° and 38.8°. The average size from XRD data was calculated to be 11.2 and 14.1 nm for 10, and 20 wt% Cu/OMS-2 catalysts. No peaks corresponding to Cu were seen in the XRD patterns for the Prep-Dep 5 wt% Cu/OMS-2 catalyst, which indicated smaller Cu crystallites with high dispersion of Cu metal on the support.
To further investigate the smaller Cu crystallites, 5 wt% Cu/OMS-2 prepared by both Pre-Dep and Wet-Imp methods were investigated using TEM analysis. Fig. 2(a) corresponds to the 5 wt% Cu/OMS-2 (Pre-Dep) catalyst, and shows well defined manganese oxide nanorods, doped with fine and uniformly dispersed small CuO nanoparticles. Fig. 2(b and c) exhibit the elemental mapping of Mn and Cu, which further confirms the even distribution and small size of the CuO nanoparticles. Fig. 2(d) shows the histogram with narrow particle size distribution, with an average CuO particle size of 2.6 nm. This finding correlates with Fig. 1(b), where no Cu diffraction peaks were seen in the XRD patterns, indicating that the Cu particles were highly dispersed and small, making it not visible in the XRD patterns. In Fig. 2(e), a brightfield TEM image of 5 wt% Cu/OMS-2 (Wet-Imp) catalyst demonstrates a clear view of a CuO particle located noticeably on top of a manganese oxide OMS-2 nanorod. This particle is remarkably larger when compared to the Pre-Dep catalyst. Fig. 2(f and g), shows the HAADF-STEM image of the catalyst, clearly demonstrating that large CuO agglomerates have formed over the support and overlaid elemental mapping reveals that the particles are not as well-dispersed compared to the Pre-Dep catalyst shown in Fig. 2(c). The size distribution histogram in Fig. 2(h) implies an average CuO particle size of 19.3 nm, further supporting the non-uniform and heterogeneous deposition of CuO on the support.
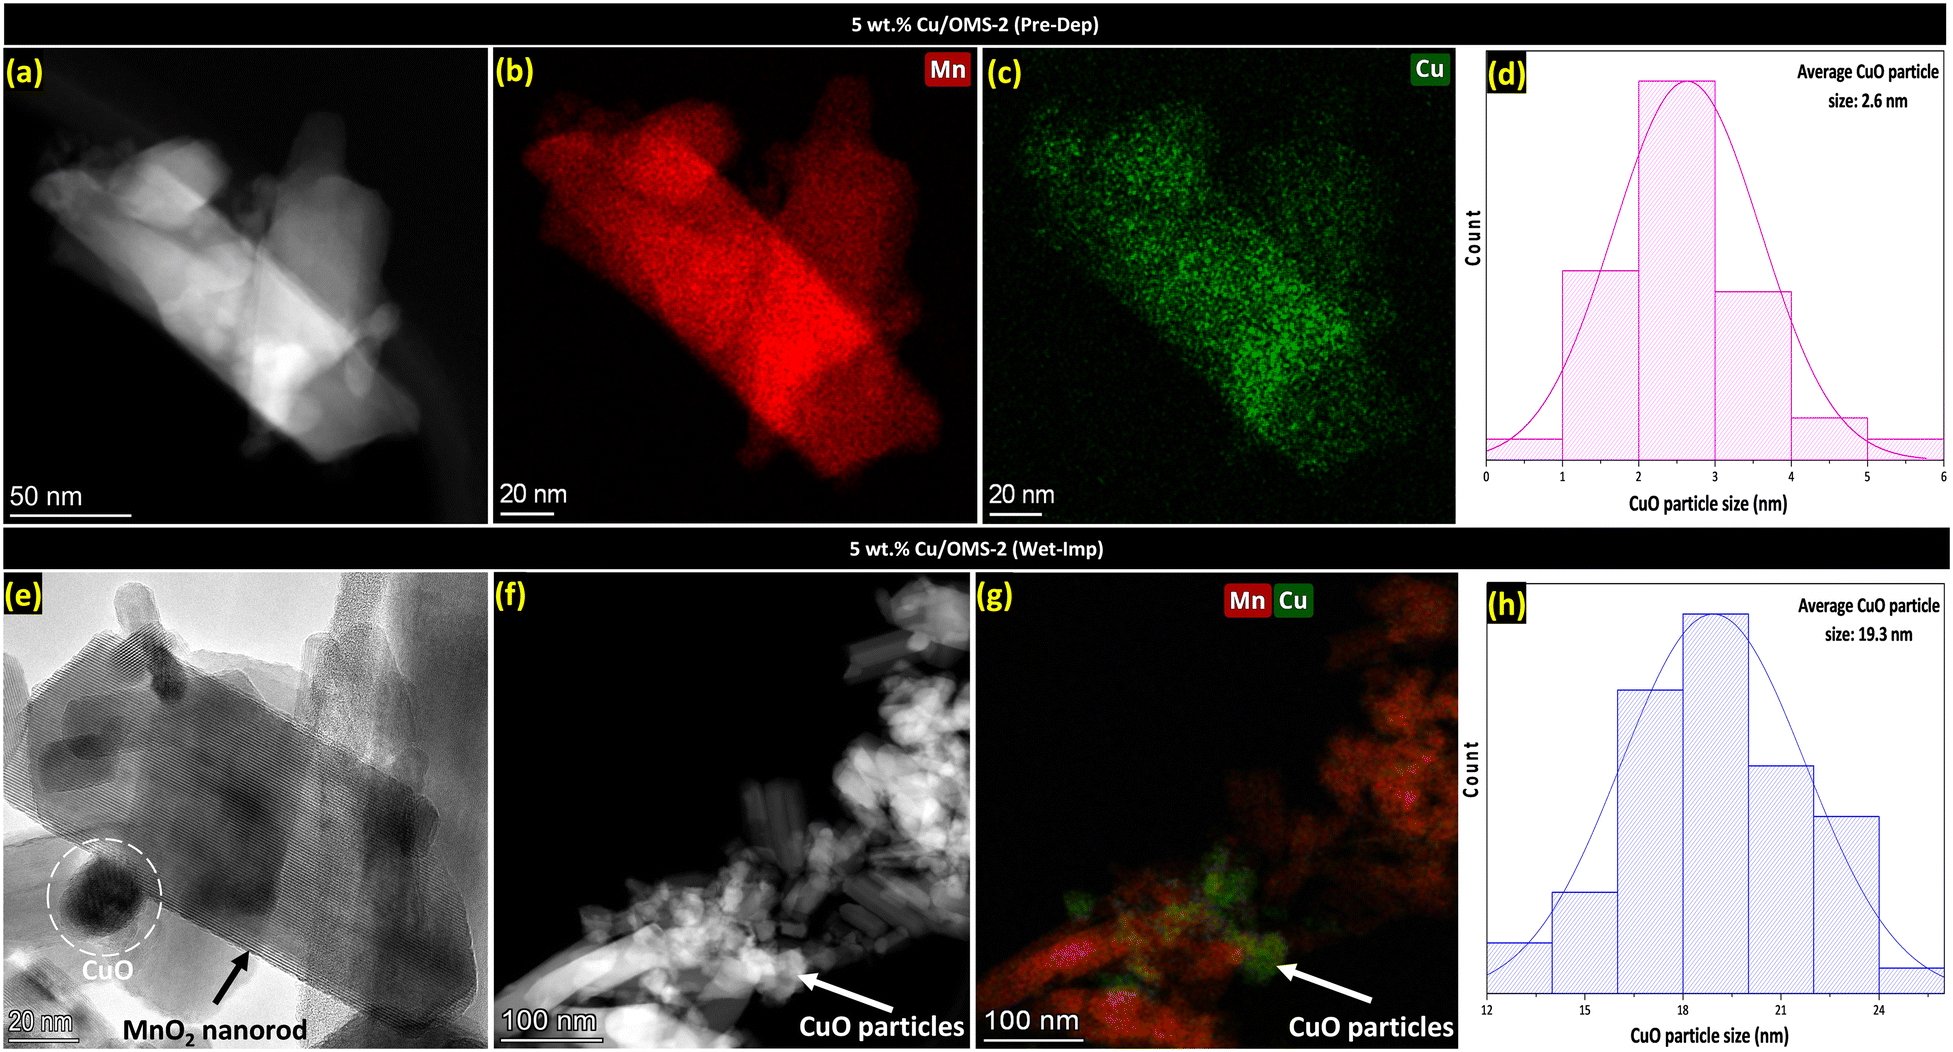 | ||
| Fig. 2 TEM analysis for 5 wt% Cu/OMS-2 Pre-Dep (a)–(d), and 5 wt% Cu/OMS-2 Wet-Imp (e)–(h). (a) HAADF-STEM representative overview, EDX elemental maps for Mn (b), and (c) Cu, and (d) average particle size distribution of CuO nanoparticles. (e) Brightfield TEM image displaying a CuO nanoparticle in the white dotted circle, (f) HAADF-STEM representative overview, (g) EDX overlaid elemental maps of Mn and Cu, and (h) average particle size distribution of CuO nanoparticles. | ||
To investigate the Cu reducibility, H2-TPR analysis was performed. Fig. 3 shows the reduction profiles for pristine OMS-2, and 5, 10 and 20 wt% Cu/OMS-2 catalysts prepared using the Pre-Dep method. Cu supported on mixed metal oxides usually show different reduction patterns due to the surface interactions between copper oxide and support metal oxides. The bulk copper oxide reduces around 280 °C. In our materials, we observe the reduction peak at lower temperatures of around 200 °C, which can be attributed to smaller Cu nanoparticles.55 The shoulder peak seen at a higher temperature can be attributed to Cu having strong metal–support interaction with manganese oxide.56 The peak observed between 369 °C to 390 °C signifies the reduction of manganese oxide from Mn4+ to Mn3+ state.34 Further, a comparison of the catalysts prepared by both methods, 20 wt% Cu/OMS-2 (Pre-Dep vs. Wet-Imp) displayed significantly different reduction profiles (Fig. 4). The 20 wt% Cu/OMS-2 Prep-Dep catalyst showed a noticeably higher H2 uptake as compared to the Wet-Imp catalyst, which could be due to the smaller CuO particle size with higher dispersion on the manganese oxide support.
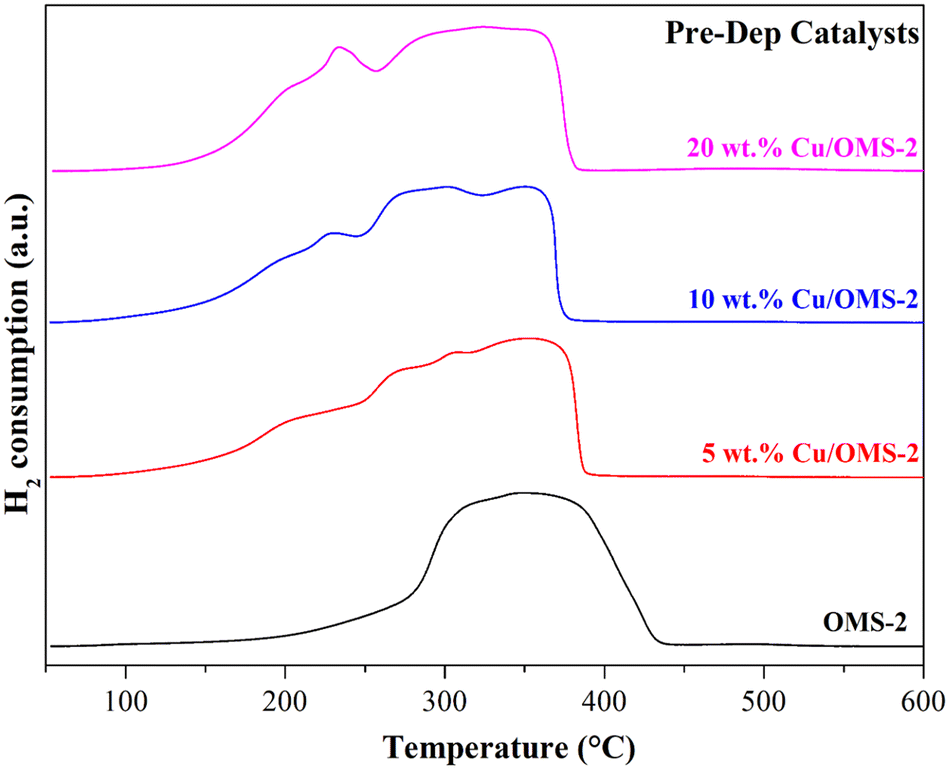 | ||
| Fig. 3 H2-TPR profiles of 5, 10 and 20 wt% Cu/OMS-2 catalysts prepared by the Pre-Dep method. | ||
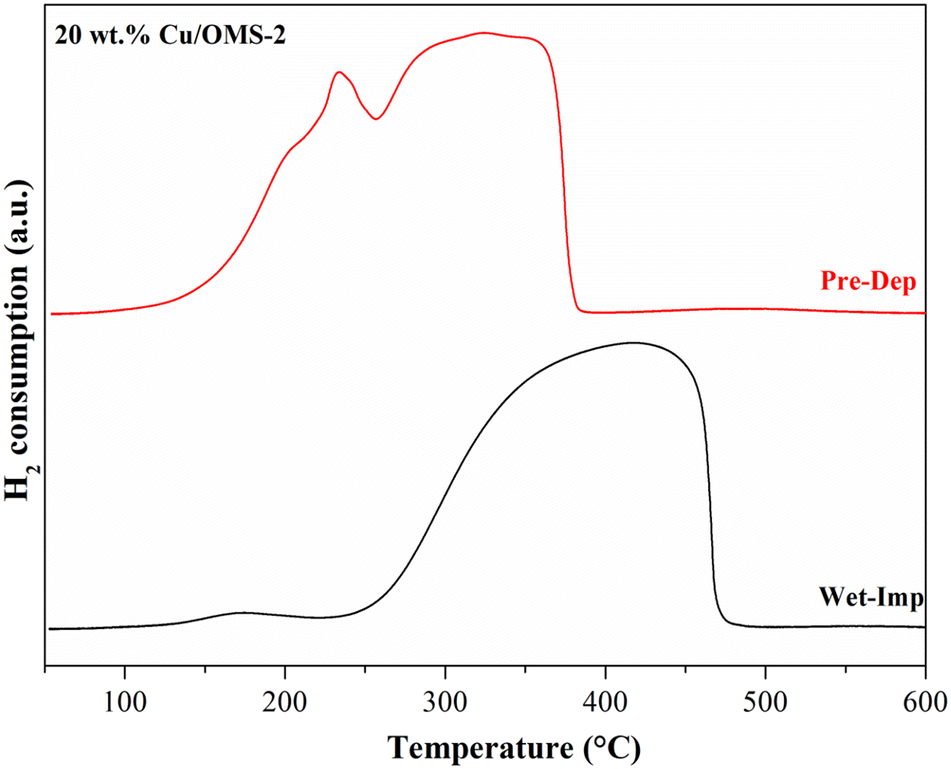 | ||
| Fig. 4 H2-TPR profiles of 20 wt% Cu/OMS-2 catalysts prepared by Pre-Dep and Wet-Imp methods. | ||
3.2 Catalyst performance in LA hydrogenation
Both Wet-Imp and Pre-Dep catalysts were investigated under same reaction conditions for liquid phase hydrogenation of LA to GVL. The performance of each catalyst was evaluated under identical reaction conditions, in 30 ml of 1,4-dioxane and water (3:7 mol ratio) as solvent at 190 °C, 20 bar H2, 1 g LA and 0.2 g of catalyst for 240 min. All catalysts prepared using the Prep-Dep method showed higher GVL yields as compared to the corresponding Wet-Imp catalysts. The GVL yield–time profiles are shown in Fig. 5(a–c). As shown in Fig. 5(a), the GVL yield (%) increased from 20 wt% Cu/OMS-2 Wet-Imp to Pre-Dep prepared catalysts. The same trend is also seen with 10 wt% Cu/OMS-2 (Fig. 5b) and 5 wt% Cu/OMS-2 (Fig. 5c) respectively. Full conversion of LA was reached within 4 h with all the Pre-Dep catalysts. The higher LA conversions and GVL yields, using Prep-Dep catalysts in comparison to the Wet-Imp catalysts for similar Cu wt% loadings, can be attributed to the relatively smaller CuO particle sizes, and overall higher specific surface area (Table 1).
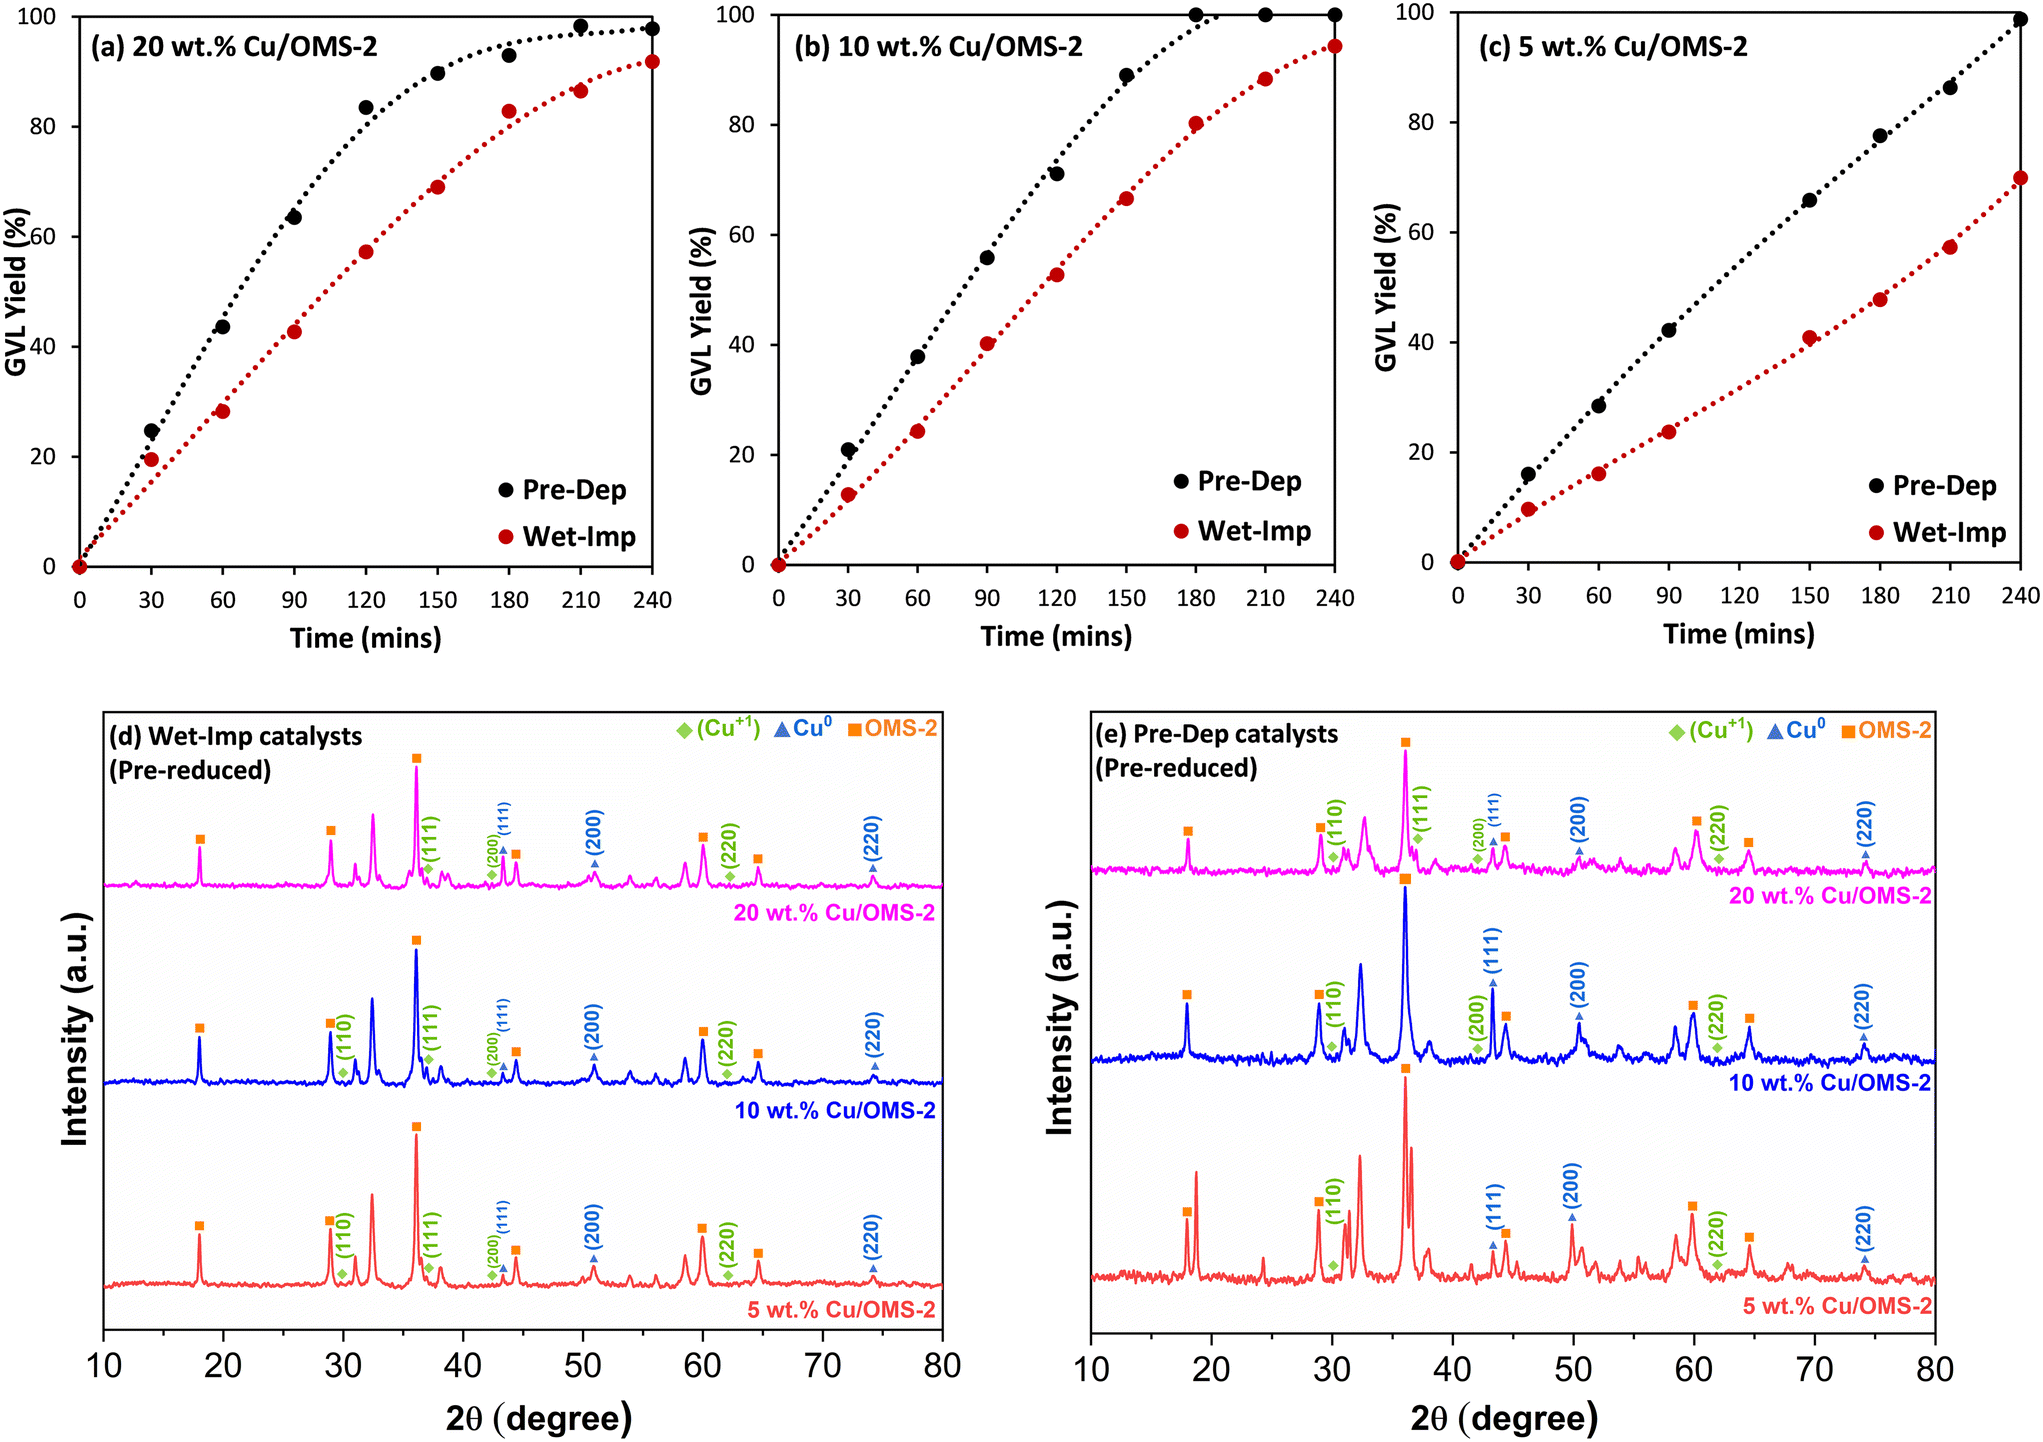 | ||
| Fig. 5 GVL yield (%) in LA hydrogenation using (a) 20 wt% Cu/OMS-2; (b) 10 wt% Cu/OMS-2 and (c) 5 wt% Cu/OMS-2. Reaction conditions: 1 g LA, 30 ml solvent (1,4-dioxane and water in 3:7 mol ratio), 0.2 g of catalyst at 190 °C temperature and 20 bar H2 pressure for 240 min at 1500 rpm; XRD patterns of pre-reduced 5, 10 and 20 wt% Cu/OMS-2 catalysts prepared by (d) Wet-Imp, and (e) Pre-Dep methods. | ||
Fig. 5(d and e) shows the X-ray diffraction (XRD) patterns of the pre-reduced Cu/OMS-2 catalysts prepared by Wet-Imp and Pre-Dep methods. The diffraction peaks observed at 2θ values 29.9°, 37.0°, 42.6° and 62.4° corresponds to the (110), (111), (200) and (220) crystal planes of the Cu2O (Cu+, cuprous oxide) phase with the space group Pn![[3 with combining macron]](https://www.rsc.org/images/entities/char_0033_0304.gif) m in accordance with the JCPDS no. 034-1354.57 Peaks observed at 2θ values 43.6°, 50.7° and 74.4° are assigned to the (111), (200), and (220) planes of metallic copper (Cu0), which are consistent with JCPDS no. 04-0836.58 The XRD analysis of the pre-reduced catalysts infers that Cu NPs are in mixed crystalline phases of Cu+ and Cu0. It is plausible that both copper species Cu+ and Cu0 could contribute to improved catalytic performance, by participating in the reaction mechanism. Cu+ acts as a Lewis acid site, interacting with the oxygen of the carbonyl group of LA, for formation of α-AL through dehydration,59,60 and subsequently, Cu0 facilitates the dissociation of hydrogen for the reduction of α-AL to GVL. The crystallite size of the pre-reduced catalysts prepared via Wet-Imp and Pre-Dep methods was determined using the Scherrer's equation for Cu0 peaks. Three peaks (2θ values of 43.6°, 50.7° and 74.4°) were used separately to calculate the crystallite size and the average value was considered. For Wet-Imp catalysts, fresh 20 wt% Cu/OMS-2 was calculated to be 22.9 nm, while the pre-reduced catalyst measured slightly larger at 23.8 nm. Similarly, pre-reduced 10 and 5 wt% Cu/OMS-2 (Wet-Imp) were measured to be 21.4 nm and 21.0 nm, which are relatively close to the fresh catalysts (Table 1). A similar trend can be observed in the Pre-Dep catalysts, with the crystallite size measuring to be 15.8 nm (20 wt% Cu/OMS-2), 13.2 nm (10 wt% Cu/OMS-2) and 4.7 nm (5 wt% Cu/OMS-2). The crystallite size closely corresponds to that of the fresh catalysts, indicating that both the fresh and pre-reduced catalysts exhibit the same Cu size.
m in accordance with the JCPDS no. 034-1354.57 Peaks observed at 2θ values 43.6°, 50.7° and 74.4° are assigned to the (111), (200), and (220) planes of metallic copper (Cu0), which are consistent with JCPDS no. 04-0836.58 The XRD analysis of the pre-reduced catalysts infers that Cu NPs are in mixed crystalline phases of Cu+ and Cu0. It is plausible that both copper species Cu+ and Cu0 could contribute to improved catalytic performance, by participating in the reaction mechanism. Cu+ acts as a Lewis acid site, interacting with the oxygen of the carbonyl group of LA, for formation of α-AL through dehydration,59,60 and subsequently, Cu0 facilitates the dissociation of hydrogen for the reduction of α-AL to GVL. The crystallite size of the pre-reduced catalysts prepared via Wet-Imp and Pre-Dep methods was determined using the Scherrer's equation for Cu0 peaks. Three peaks (2θ values of 43.6°, 50.7° and 74.4°) were used separately to calculate the crystallite size and the average value was considered. For Wet-Imp catalysts, fresh 20 wt% Cu/OMS-2 was calculated to be 22.9 nm, while the pre-reduced catalyst measured slightly larger at 23.8 nm. Similarly, pre-reduced 10 and 5 wt% Cu/OMS-2 (Wet-Imp) were measured to be 21.4 nm and 21.0 nm, which are relatively close to the fresh catalysts (Table 1). A similar trend can be observed in the Pre-Dep catalysts, with the crystallite size measuring to be 15.8 nm (20 wt% Cu/OMS-2), 13.2 nm (10 wt% Cu/OMS-2) and 4.7 nm (5 wt% Cu/OMS-2). The crystallite size closely corresponds to that of the fresh catalysts, indicating that both the fresh and pre-reduced catalysts exhibit the same Cu size.
3.3 Effect of Cu nanoparticle size on the catalytic activity
The effect of Cu size on the catalytic activity in the hydrogenation of LA to GVL was studied by comparing the TOF (h−1) values and catalyst surface area (m2 g−1) (Fig. 6a) as a function of the Cu nanoparticle sizes as determined by TEM. The TOF values are a good activity performance indicator. Amongst the catalysts evaluated in our study, the maximum TOF value of 27 h−1 was achieved using the 5 wt% Cu/OMS-2 catalyst (Cu NP size 2.6 nm). Meanwhile, in comparison, the TOF values of 16.2 h−1 for 10 wt% Cu/OMS-2, and 10.5 h−1 for 20 wt% Cu/OMS-2 catalysts were achieved. Thus, TOF values show a linear dependency on the Cu NP sizes, and TOF values increase as the Cu NP size decrease (Fig. 6a). A similar dependency is also observed for the catalyst surface area of the catalysts and size of the Cu nanoparticles; surface areas increase as the Cu NP size decrease (Fig. 6a). As a rule, a horizontal line in the plot of TOF vs. metal nanoparticle size or surface area is indicative of a structure-insensitive reaction. Therefore, LA hydrogenation to GVL is a structurally sensitive reaction as the TOF (molLA molCu−1 h−1) indicated dependency on theCu nanoparticle size. Similarly, in the Wet-Imp catalysts, as the Cu wt% increased, the Cu NP size increased, and the corresponding TOF values decreased, with the lowest TOF of 6.2 h−1 from 20 wt% Cu/OMS-2 with the Cu particle size of 22 nm. The best performing catalyst, the 5 wt% Cu/OMS-2 Pre-Dep catalyst (TOF 27 h−1), has the highest catalyst surface area of 68.9 m2 g−1 and demonstrated the maximum LA conversion rate of 4.2 × 10⁻⁴ molLA kgCu−1 h−1. Fig. 6b shows a proportional increase in LA conversion rate (molLA kgCu−1 h−1) as the surface area of the Cu catalysts increased. A similar linear correlation of catalytic activity and surface area in catalysts which are supported on various metal oxides have been reported by other research groups.50,61 For instance, Kon et al. using the Pt/HMFI zeolite catalyst observed a TOF of 33 h−1.62 Zhang et al. have reported TOF values of 278 h−1 using single atom catalyst Ru on TiO2@nitrogen doped carbon support, and 7.9 h−1 using commercial Ru/C as the catalyst.63 In their study, high TOF values were attributed to single atom catalysis and the use of N2 in the reaction feed. In a separate study, Liu et al. using Ni and NiO supported on mesoporous carbon, observed the TOF of 10.8 h−1 in LA hydrogenation.64 In our studies, we obtained the TOF values of 27 h−1 for 5 wt% Cu/OMS-2 (Pre-Dep) and 10.6 h−1 for 5 wt% Cu/OMS-2 (Wet-Imp).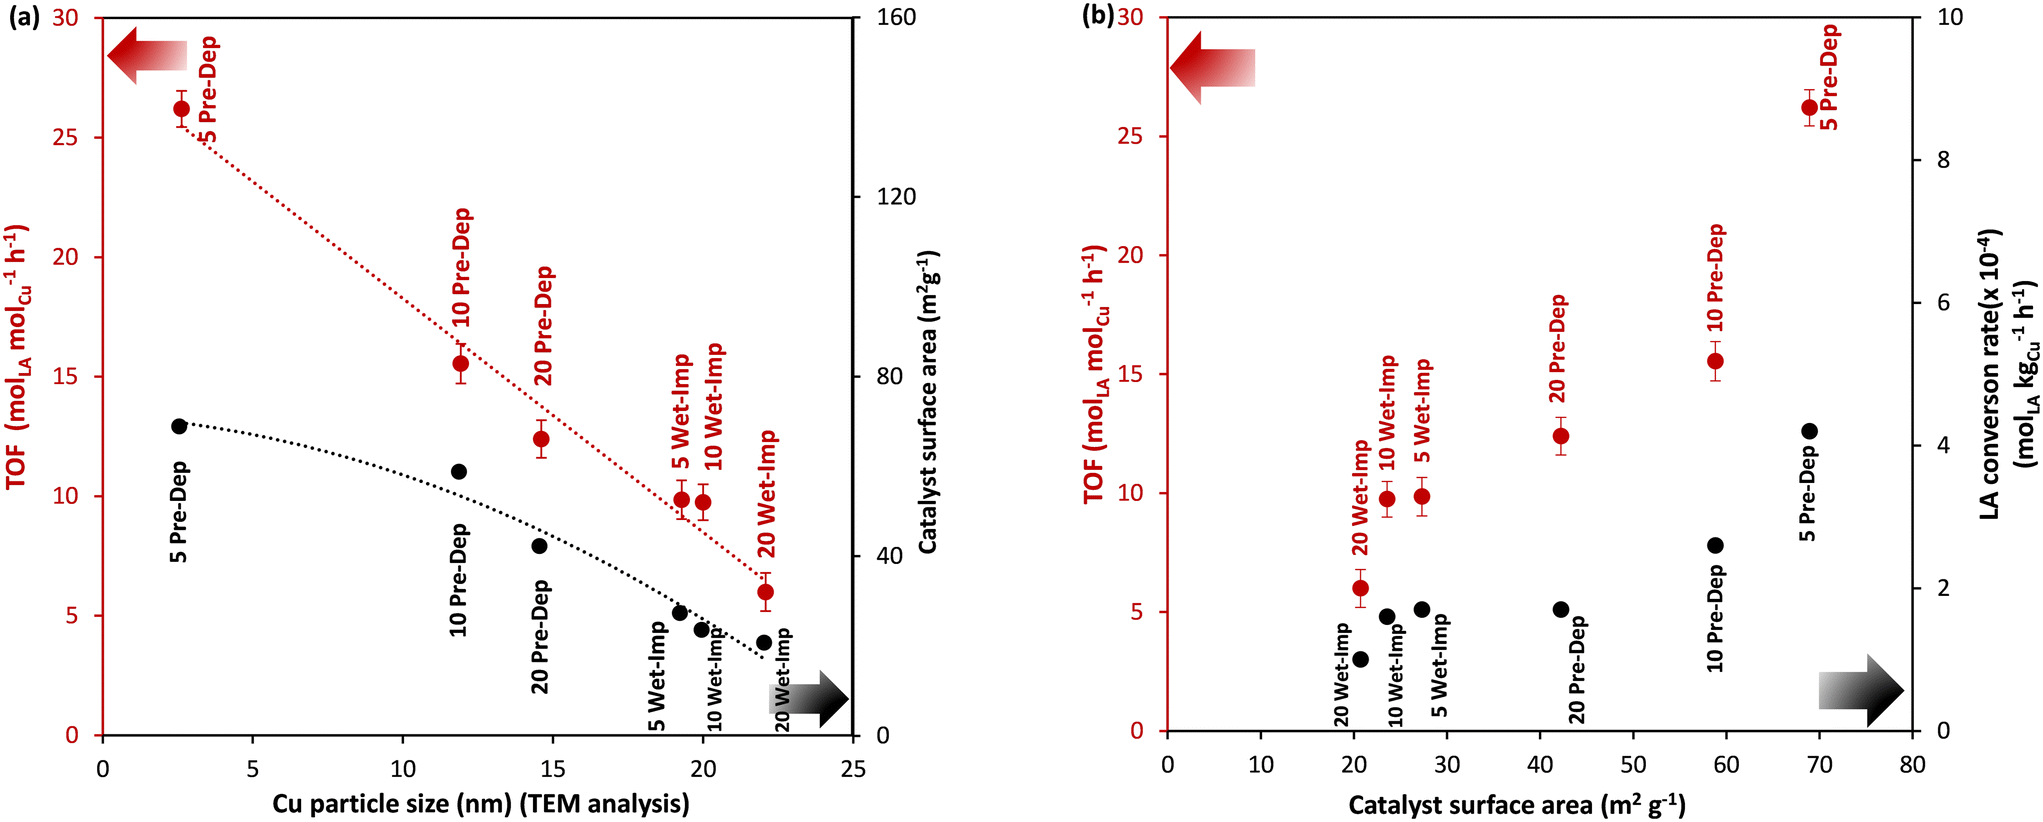 | ||
| Fig. 6 (a) TOF; and (b) LA conversion rate as a function of catalyst surface area for Cu/OMS-2. | ||
It has been reported that ratio of (111) and (100) facets, corner or edge atoms are influenced by particle size, which in turn influences the structural and electronic properties of the catalyst and larger particles are exposed to fewer edges, defects and low-index facets in comparison to smaller crystallite sizes.65 Smaller sized crystallites have more open planes, edges and defects, which comprises of co-ordinated unsaturated species which are more reactive in contrast to fully coordinated species. As the size of Cu nanoparticles decrease, the interaction with metal oxide support increases, which might involve the role of support in activity as well. The trend seen from the range of catalysts prepared with different methods clearly indicate that the activity trend correlates well with Cu particle size, thereby indicating it as the primary factor for activity.
4. Conclusions
We have shown the performance of Cu/OMS-2 catalysts prepared by different methods, wet impregnation and precipitation deposition, in the hydrogenation of LA to GVL using 1,4-dioxane and water as solvents. Best results were obtained using the 20, 10 and 5 wt% Cu/OMS-2 precipitation deposition catalysts which showed an increased LA conversion and GVL yield as compared to wet impregnation catalysts. Considering the TOF value as a descriptor for the performance of catalysts, we found that the 5 wt% Cu/OMS-2 Pre-Dep catalyst to be the best, which had a TOF value of 27 molLA molCu−1 h−1. Catalyst characterisation established the difference of preparation methods which leads to different Cu particle sizes. It was shown that LA hydrogenation in 1,4-dioxane and water is structure sensitive. Based on our data, with Cu nanoparticle sizes prepared in the range of 2 to 22 nm, the Cu NP size of 2 nm was accomplished using the precipitation deposition method.Author contributions
N. J. M.: methodology, investigation and writing – original draft preparation. P. K. and M. A.: TEM measurements, analysis and draft preparation. N. A.: methodology and draft revision. H. M.: conceptualisation, visualisation, validation, writing – review & editing and resources.Conflicts of interest
There are no conflicts to declare.Acknowledgements
The authors gratefully acknowledge the financial support for PhD studentship to N. J. M. funded through the collaboration initiative between Queen's University Belfast and Tezpur University, India. H. M. also acknowledges the funding and support provided by the Leverhulme Trust research grant RPG-2020-301, as well as the UK Catalysis hub via the authors' membership in the UK Catalysis Hub Consortium funded by EPSRC grant: EP/R026645/1.Notes and references
- W. R. H. Wright and R. Palkovits, ChemSusChem, 2012, 5, 1657–1667 CrossRef CAS PubMed.
- M. Sudhakar, V. V. Kumar, G. Naresh, M. L. Kantam, S. K. Bhargava and A. Venugopal, Appl. Catal., B, 2016, 180, 113–120 CrossRef CAS.
- J. K. Nørskov, T. Bligaard, B. Hvolbæk, F. Abild-Pedersen, I. Chorkendorff and C. H. Christensen, Chem. Soc. Rev., 2008, 37, 2163 RSC.
- A. S. Crampton, M. D. Rötzer, C. J. Ridge, B. Yoon, F. F. Schweinberger, U. Landman and U. Heiz, Surf. Sci., 2016, 652, 7–19 CrossRef CAS.
- B. Roldan Cuenya and F. Behafarid, Surf. Sci. Rep., 2015, 70, 135–187 CrossRef CAS.
- R. A. Van Santen, Acc. Chem. Res., 2009, 42, 57–66 CrossRef CAS PubMed.
- R. Van Den Berg, G. Prieto, G. Korpershoek, L. I. Van Der Wal, A. J. Van Bunningen, S. Lægsgaard-Jørgensen, P. E. De Jongh and K. P. De Jong, Nat. Commun., 2016, 7, 13057 CrossRef CAS PubMed.
- Z. P. Liu and P. Hu, J. Am. Chem. Soc., 2003, 125, 1958–1967 CrossRef CAS PubMed.
- F. Calle-Vallejo, D. Loffreda, M. T. M. Koper and P. Sautet, Nat. Chem., 2015, 7, 403–410 CrossRef CAS.
- L. Castoldi, R. Matarrese, L. Kubiak, M. Daturi, N. Artioli, S. Pompa and L. Lietti, Catal. Today, 2019, 320, 141–151 CrossRef CAS.
- J. Wisniewska, M. Ziolek, N. Artioli and M. Daturi, J. Catal., 2016, 336, 58–74 CrossRef CAS.
- L. Lietti, N. Artioli, L. Righini, L. Castoldi and P. Forzatti, Ind. Eng. Chem. Res., 2012, 51, 7597–7605 CrossRef CAS.
- J. Tan, J. Cui, T. Deng, X. Cui, G. Ding, Y. Zhu and Y. Li, ChemCatChem, 2015, 7, 508–512 CrossRef CAS.
- C. Ortiz-Cervantes and J. J. García, Inorg. Chim. Acta, 2013, 397, 124–128 CrossRef CAS.
- W. Luo, U. Deka, A. M. Beale, E. R. H. Van Eck, P. C. A. Bruijnincx and B. M. Weckhuysen, J. Catal., 2013, 301, 175–186 CrossRef CAS.
- IEA, World Energy Investment 2023, IEA, Paris, 2023 Search PubMed.
- IEA, CO2 Emissions in 2022, IEA, Paris, 2023 Search PubMed.
- J. Salisu, N. Gao, C. Quan, J. Yanik and N. Artioli, J. Energy Inst., 2023, 108, 101239 CrossRef CAS.
- S. Kang, J. Fu and G. Zhang, Renewable Sustainable Energy Rev., 2018, 94, 340–362 CrossRef CAS.
- Z. Yu, X. Lu, J. Xiong and N. Ji, ChemSusChem, 2019, 12, 3915–3930 CrossRef CAS.
- S. Dutta, I. K. M. Yu, D. C. W. Tsang, Y. H. Ng, Y. S. Ok, J. Sherwood and J. H. Clark, Chem. Eng. J., 2019, 372, 992–1006 CrossRef CAS.
- M. A. Díaz-Pérez and J. C. Serrano-Ruiz, Molecules, 2020, 25, 802 CrossRef PubMed.
- J. Q. Bond, D. M. Alonso, D. Wang, R. M. West and J. A. Dumesic, Science, 2010, 327, 1110–1114 CrossRef CAS PubMed.
- A. M. Hengne and C. V. Rode, Green Chem., 2012, 14, 1064 RSC.
- L. Zhang, J. Mao, S. Li, J. Yin, X. Sun, X. Guo, C. Song and J. Zhou, Appl. Catal., B, 2018, 232, 1–10 CrossRef CAS.
- I. Orlowski, M. Douthwaite, S. Iqbal, J. S. Hayward, T. E. Davies, J. K. Bartley, P. J. Miedziak, J. Hirayama, D. J. Morgan, D. J. Willock and G. J. Hutchings, J. Energy Chem., 2019, 36, 15–24 CrossRef.
- S. Pendem, I. Mondal, A. Shrotri, B. S. Rao, N. Lingaiah and J. Mondal, Sustainable Energy Fuels, 2018, 2, 1516–1529 RSC.
- Q. Xu, X. Li, T. Pan, C. Yu, J. Deng, Q. Guo and Y. Fu, Green Chem., 2016, 18, 1287–1294 RSC.
- A. Karelovic and P. Ruiz, Catal. Sci. Technol., 2015, 5, 869–881 RSC.
- Z. Li, H. Hao, J. Lu, C. Wu, R. Gao, J. Li, C.-L. Liu and W.-S. Dong, J. Energy Chem., 2021, 61, 446–458 CrossRef CAS.
- N. J. Mazumdar, G. Deshmukh, A. Rovea, P. Kumar, M. Arredondo-Arechavala and H. Manyar, R. Soc. Open Sci., 2022, 9, 220078 CrossRef CAS PubMed.
- W. Gong, C. Chen, R. Fan, H. Zhang, G. Wang and H. Zhao, Fuel, 2018, 231, 165–171 CrossRef CAS.
- A. M. Ruppert, J. Grams, M. Jędrzejczyk, J. Matras-Michalska, N. Keller, K. Ostojska and P. Sautet, ChemSusChem, 2015, 8, 1538–1547 CrossRef CAS PubMed.
- I. J. McManus, H. Daly, H. G. Manyar, S. F. R. Taylor, J. M. Thompson and C. Hardacre, Faraday Discuss., 2016, 188, 451–466 RSC.
- C. Coney, C. Hardacre, K. Morgan, N. Artioli, A. P. E. York, P. Millington, A. Kolpin and A. Goguet, Appl. Catal., B, 2019, 258, 117918 CrossRef CAS.
- G. D. Yadav and H. G. Manyar, Adv. Synth. Catal., 2008, 350, 2286–2294 CrossRef CAS.
- C. Quan, G. Zhang, N. Gao, S. Su, N. Artioli and D. Feng, Energy Fuels, 2022, 36, 8311–8322 CrossRef CAS.
- J. Ethiraj, D. Wagh and H. Manyar, Energy Fuels, 2022, 36, 1189–1204 CrossRef CAS.
- K. Pandit, C. Jeffrey, J. Keogh, M. S. Tiwari, N. Artioli and H. G. Manyar, Ind. Eng. Chem. Res., 2023, 62, 9201–9210 CrossRef CAS PubMed.
- T. Jakubek, K. Ralphs, A. Kotarba and H. Manyar, Catal. Lett., 2019, 149, 100–106 CrossRef CAS.
- T. Jakubek, C. Hudy, J. Gryboś, H. Manyar and A. Kotarba, Catal. Lett., 2019, 149, 2218–2225 CrossRef CAS.
- R. O'Donnell, K. Ralphs, M. Grolleau, H. Manyar and N. Artioli, Top. Catal., 2020, 63, 351–362 CrossRef.
- M. T. Yilleng, E. C. Gimba, G. I. Ndukwe, I. M. Bugaje, D. W. Rooney and H. G. Manyar, J. Environ. Chem. Eng., 2018, 6, 6382–6389 CrossRef CAS.
- T. G. A. Youngs, H. Manyar, D. T. Bowron, L. F. Gladden and C. Hardacre, Chem. Sci., 2013, 4, 3484 RSC.
- K. Ralphs, G. Collins, H. Manyar, S. L. James and C. Hardacre, ACS Sustainable Chem. Eng., 2022, 10, 6934–6941 CrossRef CAS.
- M. T. Rahman, S. Wharry, M. Smyth, H. Manyar and T. S. Moody, Synlett, 2020, 31, 581–586 CrossRef CAS.
- H. G. Manyar, R. Morgan, K. Morgan, B. Yang, P. Hu, J. Szlachetko, J. Sá and C. Hardacre, Catal. Sci. Technol., 2013, 3, 1497 RSC.
- X. Chen, Z. Wang, H. Daly, R. Morgan, H. Manyar, C. Byrne, A. S. Walton, S. F. R. Taylor, M. Smith, R. Burch, P. Hu and C. Hardacre, Appl. Catal., A, 2020, 593, 117420 CrossRef.
- H. G. Manyar, B. Yang, H. Daly, H. Moor, S. McMonagle, Y. Tao, G. D. Yadav, A. Goguet, P. Hu and C. Hardacre, ChemCatChem, 2013, 5, 506–512 CrossRef CAS.
- S. Natesakhawat, J. W. Lekse, J. P. Baltrus, P. R. Ohodnicki, B. H. Howard, X. Deng and C. Matranga, ACS Catal., 2012, 2, 1667–1676 CrossRef CAS.
- S. Sithambaram, E. K. Nyutu and S. L. Suib, Appl. Catal., A, 2008, 348, 214–220 CrossRef CAS.
- K. Wantala, T. Suwannaruang, J. Palalerd, P. Chirawatkul, N. Chanlek, S. Wannapaiboon, C. Saiyasombat and R. Khunphonoi, Surf. Interfaces, 2021, 23, 101030 CrossRef CAS.
- D. Mardiansyah, T. Badloe, K. Triyana, M. Q. Mehmood, N. Raeis-Hosseini, Y. Lee, H. Sabarman, K. Kim and J. Rho, Sci. Rep., 2018, 8, 10639 CrossRef.
- D. Zhu, L. Wang, W. Yu and H. Xie, Sci. Rep., 2018, 8, 5282 CrossRef.
- J. Y. Kim, J. A. Rodriguez, J. C. Hanson, A. I. Frenkel and P. L. Lee, J. Am. Chem. Soc., 2003, 125, 10684–10692 CrossRef CAS.
- J. Zhang, X. Meng, C. Yu, G. Chen and P. Zhao, RSC Adv., 2015, 5, 87221–87227 RSC.
- C. Tang, X. Ning, J. Li, H.-L. Guo and Y. Yang, J. Mater. Sci. Technol., 2019, 35, 1570–1577 CrossRef CAS.
- M. Salavati-Niasari, F. Davar and N. Mir, Polyhedron, 2008, 27, 3514–3518 CrossRef CAS.
- S. Zhu, X. Gao, Y. Zhu, Y. Zhu, H. Zheng and Y. Li, J. Catal., 2013, 303, 70–79 CrossRef CAS.
- S. Zhu, X. Gao, Y. Zhu, W. Fan, J. Wang and Y. Li, Catal. Sci. Technol., 2015, 5, 1169–1180 RSC.
- C. Baltes, S. Vukojevic and F. Schuth, J. Catal., 2008, 258, 334–344 CrossRef CAS.
- K. Kon, W. Onodera and K. Shimizu, Catal. Sci. Technol., 2014, 4, 3227–3234 RSC.
- K. Zhang, Q. Meng, H. Wu, T. Yuan, S. Han, J. Zhai, B. Zheng, C. Xu, W. Wu, M. He and B. Han, Green Chem., 2021, 23, 1621–1627 RSC.
- X. Liu and Z. Li, Sustainable Energy Fuels, 2021, 5, 3312–3320 RSC.
- D. Uzio and G. Berhault, Catal. Rev.: Sci. Eng., 2010, 52, 106–131 CrossRef CAS.
Footnote |
| † Electronic supplementary information (ESI) available. See DOI: https://doi.org/10.1039/d3cy01064c |
| This journal is © The Royal Society of Chemistry 2024 |