Controlling cobalt Fischer–Tropsch stability and selectivity through manganese titanate formation†
James
Paterson
 *a,
David
Brown
c,
Sarah J.
Haigh
 d,
Philip
Landon
c,
Qizhen
Li
d,
Matthew
Lindley
d,
Mark
Peacock
a,
Hendrik
van Rensburg
c and
Zhuoran
Xu
b
d,
Philip
Landon
c,
Qizhen
Li
d,
Matthew
Lindley
d,
Mark
Peacock
a,
Hendrik
van Rensburg
c and
Zhuoran
Xu
b
abp, Applied Sciences, Innovation & Engineering, Saltend, Hull, HU12 8DS, UK. E-mail: James.Paterson@uk.bp.com
bbp, Chicago, Illinois, USA
cDrochaid Research Services Ltd, St Andrews, UK
dUniversity of Manchester, Department of Materials, UK
First published on 2nd May 2023
Abstract
Fischer–Tropsch (FT) synthesis has gained renewed interest for its role in producing sustainable fuels from renewable feedstocks such as biomass, municipal waste and CO2. This submission highlights a new catalyst support material for FT, which produces a novel switch in selectivity from oxygenated products to high quality linear paraffins. The manganese titanate support with a ABO3 perovskite structure shows substantial differences in catalytic performance compared with the conventional Mn impregnated TiO2 support with the same composition, requiring only a modest thermal treatment to activate it for FT synthesis. Cobalt supported on the MnTiO3 shows significantly higher C5+ selectivity and CO conversion than the equivalent conventional Co/Mn/TiO2 catalyst. The MnTiO3 support material is shown to be able to be formed via either an in situ reactor treatment or from a targeted ex situ support preparation method. Interestingly, after the MnTiO3 support is re-oxidised to TiO2 and MnO2, it subsequently reduces back to MnTiO3 at low temperature, suggesting a structural memory for the MnTiO3 phase after oxidation. The catalyst materials were fully analysed by in situ XAS, in situ XRD, TEM and TPR, while the FT products were analysed by GC and NMR. This work provides insights into the role of manganese in FT, particularly its impact on controlling selectivity when included in a preformed catalyst support material.
Introduction
Understanding the design, treatment and long-term operation of catalysts is central to BP's research activities, with in situ and in operando X-ray techniques being key to understanding the impact of the environment on the catalyst behaviour.1 In particular, observing catalytic behaviour under realistic process conditions (similar to commercial operation) is critical to understanding how the catalyst evolves over time in a fixed-bed or slurry-type reactor. BP's development of Fischer–Tropsch (FT) catalysts dates from the early 1980s2 with commercial demonstration of the technology occurring between 2002 and 2009 at Nikiski, Alaska. More recently the BP partnership with Johnson Matthey Davy has developed a new catalyst reactor system with FT operation. The high productivity CANS™ reactor3 has shown significant benefits over other commercially available gas-to-liquid (GTL) technologies with superior performance, heat transfer and productivity. This has opened up a new opportunities for smaller scale plants using bio-feedstocks, such as biomass to liquids and CO2/e-fuels, with lower costs while negating the need for the economy of scale. This allows powder-like catalysts with minimal mass transfer to be used in a fixed-bed reactor system for improved selectivity (>90% C5+ selectivity on commercial size particles). High heat transfer enables high productivities (>300 gCH2 Lcat−1 h) along with a reduced reactor footprint.4 This technology is now being commercialised for a waste to fuels project in the USA and will commence production soon.5 Fulcrum BioEnergy is the first to license the latest CANS and catalyst technology from BP–Johnson Matthey in its Sierra BioFuels Plant, located near Reno, Nevada. The Sierra plant will be the first in the USA to produce a renewable low-carbon product from municipal solid waste, which product can be used to make sustainable fuels or blended with existing refinery materials.Manganese promotion is well known in FT, with a large number of publications highlighting the role it plays and the effects it has on selectivity and activity.6 In summary, this body of work shows manganese oxide to be an active species in syngas conversion reactions. The studies often conclude that MnO has weak H2 dissociation capability, but that MnOx species are desirable for activating CO at the interface between the support and active components.7 Mn both facilitates the dissociation of CO, which is presumed to be the rate determining step for FT, and increases the extent to which adsorbed CO covers the Co metal surface.8 Cobalt combined with Mn during synthesis provides an association of Co and Mn oxides and the formation of a Co3−xMnxO4 solid solution. This favours MnO particles in proximity to Co0 upon reduction.9 There is also lower capacity for the Mn promoted catalyst to chemisorb hydrogen; this drives a decrease of hydrogenation rate, which in turn favours the formation of longer carbon chain products compared with the unpromoted catalyst.10 Manganese species have also been shown to control particle size, which is so critical in FT, allowing to tune cobalt crystallites to the desirable range.
Role of metal–support oxides in Fischer–Tropsch
Interactions between supports and added metals for catalysis are well established and the source of a wide range of publications. These often focus on the role of strong metal support interactions (SMSI)11 and the impact of metal–support interactions for tuning chemistry.12 Alternatively, many publications highlight the role of metal support interactions/reactions13 as a deactivation mechanism,14 where active cobalt is locked up in the support. In many cases this is proposed by using very small CoO particles in the presence of water from FT products to form a mixed metal spinel such as CoAl2O4.15While cobalt aluminates are one of the more common species for tuning metal support interaction due to the structural vacancies in Al2O3, they are not the only option. Indeed, silica16 additions are well known to be advantageous and stabilise alumina supports through their incorporation into the vacant tetrahedral spinel sites.17 Other options include cobalt silicates18 and cobalt titanates,19 which have been shown to be inert for FT. Indeed, the addition of manganese in CoTiO2 FT systems has also been shown to form manganese titanate (MnTi2O4),20 from the manganese MnO analogue (rather than CoO). These are all present in the spinel AB2O4 structure with very few identifying the perovskite ABO3 structure under FT conditions. This may be due to the low levels of manganese promoter used or the analysis under process conditions (H2, elevated temperatures, etc.). MnTiO3 was formed by Valigi under hydrogen below 500 °C.21 Ilmenite/perovskite-type structures can be synthesised for Co/Mn–titania materials, generally from high temperature air calcinations, having been formed for other applications such as photo catalytic reactions, and as functional ceramics and for materials studies beyond catalysis.22 However, there only a few studies which seek to take advantage of the metal–support properties for catalytic benefit. One of these is Zhao et al.,23 who explored cobalt on a (Co/Zn/Mg)Al2O4 support, while another is Oku et al.,24 who showed transesterification of vegetable oil using ilmenite type catalysts, including CoTiO3 and MnTiO3.
In this contribution, we discuss the effect of manganese on the catalyst structure and the subsequent FT performance, highlighting how a manganese promotion can be manipulated to form a support material which exhibits the benefits of manganese promotion while also producing the high quality, linear paraffinic wax product rather than higher oxygenates. In particular, this work demonstrates the formation of the perovskite ABO3 type structure from the manganese–titania reaction, rather than a spinel vacancy substitution which is more commonly reported in FT. We further show that the support material with manganese could be pre-fabricated by a catalyst manufacturer or produced via an in situ reactor/plant treatment that favours formation of the MnTiO3 phase.
Results & discussion
Two catalysts were prepared and characterized as reported previously.25 These two catalysts were 10% cobalt on titania with either 0% or 10% Mn added with the cobalt impregnation. Similar samples with other manganese loadings between 0–10% were also prepared and tested. These showed similar results but are not discussed here in detail. These catalysts have been rigorously characterized in their calcined (oxidised) formed in previous publications.6 Here we present intriguing results produced by catalyst activations at higher temperatures, where the high manganese catalysts are found to switch from being oxygenate-forming catalysts back to conventional paraffinic hydrocarbon producing catalysts. Table 1 shows the catalyst performance based on two different activation temperatures (300 °C and 450 °C) in 100% H2. In each of the tests, the catalyst was reduced under identical conditions except for the final activation temperature. An applied temperature of 205 °C showed CO conversion under FT conditions to be very different from the catalysts which were reported previously.6 High manganese loading on the catalyst appears to reduce activity considerably using a 300 °C activation temperature compared with the unpromoted catalyst. However, when the high manganese catalyst was tested at a higher activation temperature of 450 °C, a significant increase in activity was observed, 50% higher than the unpromoted catalyst at 300 °C. When the catalysts were tested at higher applied temperatures to give matching conversions, there was a striking difference in selectivity, with the 10% Co10% MnTiO2 catalyst reduced at 450 °C showing significantly better selectivity to C5+ products than the 300 °C equivalent, and comparable selectivity to the unpromoted catalyst.| 10% Co/Mn/TiO2 (T_activation) | Applied temp. °C | CO conv. % | CH4 sel. % | C5+ sel. % | C2–C4 sel. % |
|---|---|---|---|---|---|
| 0% Mn (300 °C) | 205 | 12.9 | 3.1 | 92.5 | 4.4 |
| 10% Mn (300 °C) | 205 | 5.4 | 2.5 | 82.1 | 15.3 |
| 10% Mn (450 °C) | 205 | 19.4 | 2.7 | 91.0 | 6.1 |
| 0% Mn (300 °C) | 220 | 35.3 | 4.0 | 89.8 | 5.0 |
| 10% Mn (300 °C) | 243 | 35.5 | 7.1 | 63.6 | 28.7 |
| 10% Mn (450 °C) | 214 | 41.1 | 2.9 | 90.8 | 5.3 |
X-ray techniques such as in situ X-ray diffraction (in situ XRD) and X-ray Absorption Spectroscopy (EXAFS/XANES) were used to explore the impact of catalyst reduction temperature on performance. Products were analysed by online gas chromatography (GC), while wax was collected from the individual reactor outlets for off-line analysis. This was analysed using similar methods including 1H NMR and GC as reported previously.26 The online analysis is summarised in Table 1, while Fig. 1 shows the carbon distribution and bulk analysis of functional groups. The catalyst without manganese showed a very clean linear paraffinic product, which is commonly seen in cobalt FT, with carbon chain lengths measured in excess of C70. With higher manganese addition (300 °C reduction), the product becomes significantly more functionalised as reported previously6 but offline product analysis from these tests showed the 450 °C activation of the promoted catalyst gave increased long-chain products relative to the 300 °C promoted equivalent, with lower oxygenates, which is more in line with the unpromoted catalyst. For completeness, the unpromoted catalyst was tested following a 450 °C activation in hydrogen but showed a reduced conversion with minimal impact on selectivity.
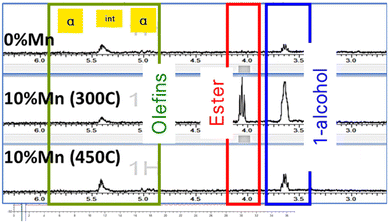 | ||
| Fig. 1 Product wax analysis by 1H NMR for 10% Co/TiO2 catalysts with and without manganese promotor following reduction at 300 °C (for 0% Mn) and at 300 °C and 450 °C for 10% Mn. | ||
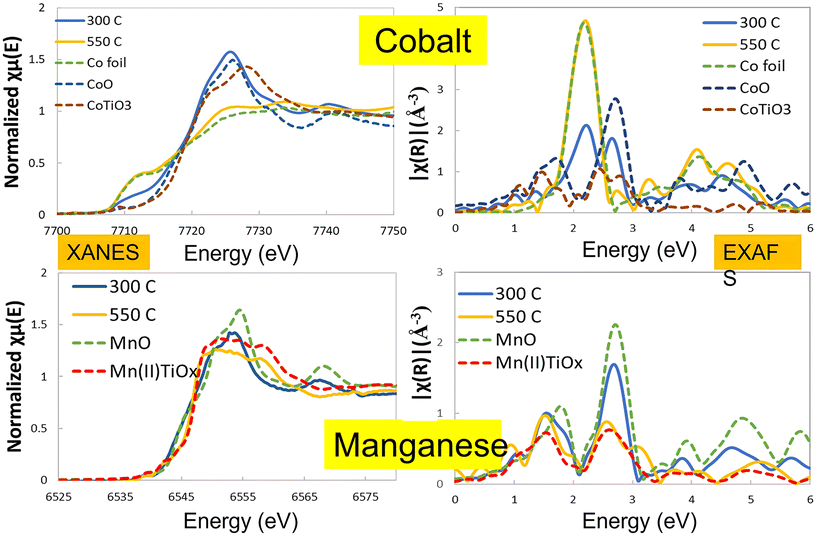
To understand the nature of this effect, the catalysts were studied by in situ X-ray diffraction and in situ EXAFS/XANES. These showed a significant structural change above 400 °C which was due to the manganese being incorporated structurally in the TiO2 support material. Fig. 2 shows the in situ XRD pattern for the two catalysts after activation at 300 °C and 450 °C, with the extracted phase analysis and particle size as a function of temperature during reduction given in Table 2. At 450 °C, the manganese promoted catalyst showed a new phase to be present, identified as the perovskite (ABO3) structure of MnTiO3 being formed, which is not seen for the unpromoted catalysts. At this temperature, the manganese was almost entirely converted to the this pyrophanite manganese titanate phase, a member of the ilmenite group. The other manganese species present in the catalyst at lower reduction temperatures are expected to be in the form of very small crystallites and are therefore not visible to the XRD, so the mechanism of the MnTiO3 formation is unclear. EXAFS and XANES were also used to explore the changes in oxidation state during this transition (Fig. 3, Table 3). This clearly showed the presence of cobalt metal in both catalysts after reduction with no evidence of any cobalt incorporated into the titanate phase. The manganese edge data shows the initial amount of MnO is very small with low coordination for the second shell, which supports the expectation of very small manganese oxide clusters rather than larger nanoparticles. As the reduction temperature is increased from 300 °C up to 450 °C and 550 °C, the manganese shifts to a manganese titanate structure which matches MnTiO3 (ABO3) and not the spinel structure AB2O4. The EXAFS and XANES data clearly shows the presence of this phase as well as the cobalt being present as Co0. The different temperatures at which the MnTiO3 phase was observed for different in situ measurements are due to the local cell configurations and length of time at the applied temperatures. In situ XRD tests incorporated a long hold at 450 °C which was not feasible in the time permitted for the EXAFS and XANES beamline work. These tests were repeated for other manganese loadings between 0 and 10% with similar results, but for brevity these are not shown here.
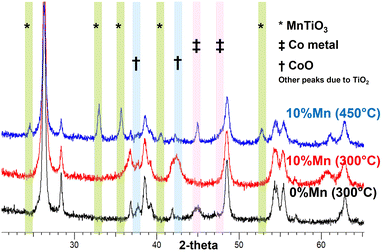 | ||
| Fig. 2 In situ XRD of CoTiO2 with 0 and 10%Mn during reduction in 100%H2. The formation of a titanate phase with ABO3 structure is seen at 450 °C for the high manganese loaded catalyst. | ||
| Temp. °C | Spinel Co3O4 | Monoxide CoO | Pyrophanite MnTiO3 | Metal Co0 | ||||
|---|---|---|---|---|---|---|---|---|
| Wt% | Size, Å | Wt% | Size, Å | Wt% | Size, Å | Wt% | Size, Å | |
| 30 | 13.5 | 174 | 10% Co/0% Mn/TiO2 | |||||
| 180 | 8.7 | 173 | 4.4 | 58 | ||||
| 210 | 11.6 | 72 | ||||||
| 250 | 4.8 | 70 | 3.9 | 68 | ||||
| 300 | 4.2 | 69 | ||||||
| 30 | 20.6 | 41 | 10% Co/10% Mn/TiO2 | |||||
| 180 | 23.3 | 39 | ||||||
| 210 | 20.2 | 32 | 3.9 | 53 | ||||
| 250 | 6.3 | 25 | 17.1 | 52 | ||||
| 300 | 20.4 | 53 | ||||||
| 410 | 14.9 | 59 | 0.9 | 313 | ||||
| 450 | 0.8 | 308 | 21.9 | 183 | 3.7 | 205 | ||
| 10% Co/10% Mn/TiO2 | Mn–O/Å | CN | σ 2 | Mn–Mn/Å | CN | Mn–Ti/Å | CN | σ 2 |
|---|---|---|---|---|---|---|---|---|
| 300 °C | 2.12 | 4.6 | 0.007 | 3.12 | 7.3 | — | — | 0.009 |
| 400 °C | 2.15 | 3.3 | 0.004 | 3.12 | 6.6 | — | — | 0.010 |
| 450 °C | 2.11 | 3.9 | 0.008 | 3.07 | 2.3 | — | — | 0.007 |
| 500 °C | 2.10 | 6.0 | 0.011 | 3.07 | 4.0 | 3.43 | 2.3 | 0.008 |
| 550 °C | 2.12 | 5.7 | 0.011 | 3.05 | 4.5 | 3.43 | 3.0 | 0.008 |
| MnO | 2.22 | 6 | — | 3.14 | 12 | — | — | — |
| Mn2O3 | 2.012 | 6 | — | 3.13 | 6 | — | — | — |
| MnO2 | 1.883 | 6 | — | 3.418 | 8 | — | — | — |
| MnTiO3 | 2.11, 2.28 | 6 | — | 3.063 | 3 | 3.433 | 3 | — |
| MnTi2O4 | 2.041 | 4 | — | 3.724 | 4 | — | — | — |
Cobalt XANES & EXAFS: except for 10% Co10% Mn/TiO2, all the other catalysts achieved 100% reduction and formed Co0 at reduction temperatures starting from 300 °C. At high reduction temperatures (>400 °C), the edge feature resembles that of the Co0, thus eliminating the possibility of the presence of other cobalt phases. At 400 °C to 450 °C, no change in the EXAFS is observed, indicating that the Co clusters have grown bigger than can be measured from EXAFS (>8 nm). No other phases of cobalt were observed. The coordination number (CN) in general increases at higher reduction temperatures. However, with the fitting error considered, all values are close to 12 except for the 10% Co10% Mn sample at 300–400 °C, and once the CN is close to 12, EXAFS is insensitive to increasing particle size.
Manganese XANES & EXAFS: the Mn exists in a phase mixture of Mn oxides including Mn(II), Mn(III) and Mn(IV) as well as MnTiO3. The Mn–O distance does not seem to vary much from sample to sample, or from different reduction temperatures. The CN for Mn–O tends to decrease with decreasing reduction temperature below 450 °C, indicating the Mn species are better dispersed at higher temperatures, where the CN for Mn–O is close to 6. The CN for Mn–Mn tends to decrease at higher reduction temperatures. Comparison with reference samples of Mn oxides and MnTiO3, shows that this value is close to that seen for MnTiO3 at high temperatures, indicating that the Mn is migrating towards the TiO2 surface due to strong metal support interaction (SMSI). This observed loss in the long range order around Mn could also be explained by the existence of a high level of dispersion of the MnOx phase in these materials that differs from the more ordered MnTiO3 phase.1 When the reduction temperature reaches 500 and 550 °C, a well resolved Mn–Ti scattering path can be observed, evidencing the close proximity of Mn and Ti in the TiO2 support.
Ex situ catalyst support design
We have already demonstrated how MnTiO3 containing catalysts can be produced by using high temperature treatments in the reactor, but this synthesis route has limitations at scale where plant design, metallurgy and process controls will limit its feasibility. It would be preferable for the catalyst to be made ex situ and then loaded into the plant for activation with a gentle low temperature reduction treatment. Here we show the feasibility of such an ex situ synthesis route which maintains catalyst performance. A series of catalysts were prepared by impregnation of the manganese precursors onto titania followed by a high temperature treatment in air and H2 (Table 4). The analyses of these materials showed only MnO2 phase following calcination in air, while calcination in hydrogen above 450 °C formed both MnO and MnTiO3. At higher manganese loadings, such as 50![[thin space (1/6-em)]](https://www.rsc.org/images/entities/char_2009.gif) :
:![[thin space (1/6-em)]](https://www.rsc.org/images/entities/char_2009.gif) 50 Ti
50 Ti![[thin space (1/6-em)]](https://www.rsc.org/images/entities/char_2009.gif) :
:![[thin space (1/6-em)]](https://www.rsc.org/images/entities/char_2009.gif) Mn, it became increasingly difficult to form only the MnTiO3 phase, although this could be overcome with increasing temperatures. It is also worth clarifying that due to the Mn loadings, the titania TiO2 phases (rutile and anatase) were present in excess in these samples. This was not optimised further to get complete conversion of manganese into the titanate phase in this work, but future work utilising higher temperatures, or longer dwell times, etc., could be tested to push this further.
Mn, it became increasingly difficult to form only the MnTiO3 phase, although this could be overcome with increasing temperatures. It is also worth clarifying that due to the Mn loadings, the titania TiO2 phases (rutile and anatase) were present in excess in these samples. This was not optimised further to get complete conversion of manganese into the titanate phase in this work, but future work utilising higher temperatures, or longer dwell times, etc., could be tested to push this further.
Ti![[thin space (1/6-em)]](https://www.rsc.org/images/entities/char_2009.gif) : :![[thin space (1/6-em)]](https://www.rsc.org/images/entities/char_2009.gif) Mn Mn |
N2 BET | XRD | |||||||
|---|---|---|---|---|---|---|---|---|---|
| Pore vol ml g−1 | Surf. area m2 g−1 | Pore size nm | MnTiO3 (wt%, nm) | MnO (wt%, nm) | MnO2 (wt%, nm) | ||||
50![[thin space (1/6-em)]](https://www.rsc.org/images/entities/char_2009.gif) : :![[thin space (1/6-em)]](https://www.rsc.org/images/entities/char_2009.gif) 50 (air) 50 (air) |
0.078 | 24 | 13.1 | — | — | — | — | 46 | 43 |
50![[thin space (1/6-em)]](https://www.rsc.org/images/entities/char_2009.gif) : :![[thin space (1/6-em)]](https://www.rsc.org/images/entities/char_2009.gif) 50 (H2) 50 (H2) |
0.096 | 27 | 14.4 | 37 | 33 | 26 | 52 | — | — |
70![[thin space (1/6-em)]](https://www.rsc.org/images/entities/char_2009.gif) : :![[thin space (1/6-em)]](https://www.rsc.org/images/entities/char_2009.gif) 30 (air) 30 (air) |
0.166 | 31 | 15.1 | — | — | — | — | 25 | 43 |
70![[thin space (1/6-em)]](https://www.rsc.org/images/entities/char_2009.gif) : :![[thin space (1/6-em)]](https://www.rsc.org/images/entities/char_2009.gif) 30 (H2) 30 (H2) |
0.126 | 32 | 15.7 | 38 | 31 | 11 | 53 | — | — |
90![[thin space (1/6-em)]](https://www.rsc.org/images/entities/char_2009.gif) : :![[thin space (1/6-em)]](https://www.rsc.org/images/entities/char_2009.gif) 10 (air) 10 (air) |
0.229 | 43 | 21.1 | — | — | — | — | 12 | 39 |
90![[thin space (1/6-em)]](https://www.rsc.org/images/entities/char_2009.gif) : :![[thin space (1/6-em)]](https://www.rsc.org/images/entities/char_2009.gif) 10 (H2) 10 (H2) |
0.166 | 45 | 14.7 | 22 | 28 | — | — | — | — |
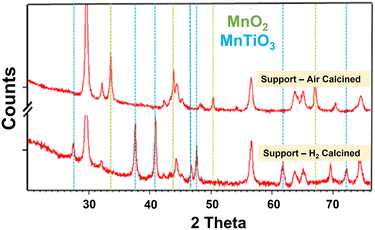
The Mn–TiO2 samples were subsequently impregnated with cobalt nitrate and calcined in air to 300 °C in a similar manner to the reference catalysts. This resulted in a partial loss of the MnTiO3 structure due to a loss of crystallinity after the re-calcination of the H2-reduced samples, but interestingly this was recoverable with lower temperature re-reduction. Indeed, it was possible to recover the MnTiO3 phase at temperatures in the range of 250–300 °C (much lower than the 450 °C needed to convert the conventional impregnated 10% Co10% Mn/TiO2). This suggests the materials had a memory of the titanate phase, which is easily reformed without the need for a full 450 °C re-reduction. The samples calcined at 500 °C in air, which did not form MnTiO3 during calcination, still required the 500 °C hydrogen reduction to form the MnTiO3 phase. Temperature programmed reductions (TPR) of the catalysts and the supports were also completed. The TPR of the Mn promoted support with 500 °C reduction showed no additional decomposition or weight loss during TPR, while the oxidised materials did (see ESI† for more info). The cobalt containing catalyst materials exhibited the commonly seen Co3O4 → CoO → Co reduction profiles, with two broad reduction features. The XRD of the support materials without cobalt is shown in Fig. 4. The support calcined in air formed only MnO2, while the same material reduced in H2 formed the distinctive MnTiO3 phases, while Table 4 shows the quantified analysis by XRD.
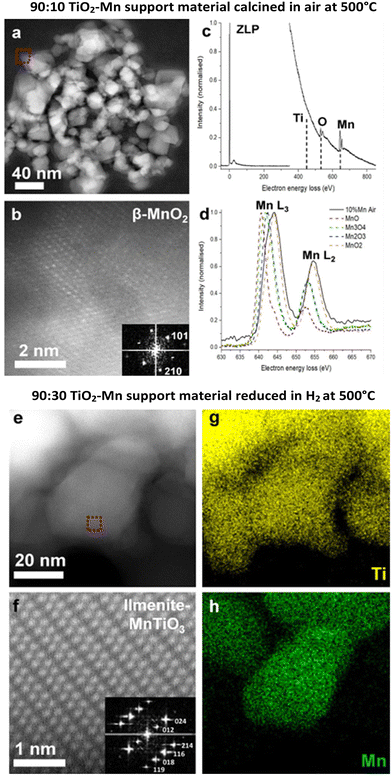
Scanning transmission electron microscopy (STEM) was conducted on the catalyst samples (with cobalt) and the ex situ prepared supports (Fig. 5). Fig. 5a–d show the 90![[thin space (1/6-em)]](https://www.rsc.org/images/entities/char_2009.gif) :
:![[thin space (1/6-em)]](https://www.rsc.org/images/entities/char_2009.gif) 10 TiO2–Mn support material calcined in air at 500 °C. The STEM electron energy loss spectroscopy (EELS) measurements and high-resolution STEM high-angle annular dark-field (HAADF) images suggest that the Mn containing particles are β-MnO2 phase. For comparison, Fig. 5e–h shows the STEM-HAADF imaging and the STEM energy dispersive X-ray spectroscopy (EDS) analysis of the 90
10 TiO2–Mn support material calcined in air at 500 °C. The STEM electron energy loss spectroscopy (EELS) measurements and high-resolution STEM high-angle annular dark-field (HAADF) images suggest that the Mn containing particles are β-MnO2 phase. For comparison, Fig. 5e–h shows the STEM-HAADF imaging and the STEM energy dispersive X-ray spectroscopy (EDS) analysis of the 90![[thin space (1/6-em)]](https://www.rsc.org/images/entities/char_2009.gif) :
:![[thin space (1/6-em)]](https://www.rsc.org/images/entities/char_2009.gif) 30 TiO2–Mn support material reduced in hydrogen at 500 °C, which demonstrates the co-dispersion of Mn and Ti and the presence of the MnTiO3 phase, indicating the Mn interacted with the TiO2 support during the H2 reduction.
30 TiO2–Mn support material reduced in hydrogen at 500 °C, which demonstrates the co-dispersion of Mn and Ti and the presence of the MnTiO3 phase, indicating the Mn interacted with the TiO2 support during the H2 reduction.
The 90% TiO2![[thin space (1/6-em)]](https://www.rsc.org/images/entities/char_2009.gif) :
:![[thin space (1/6-em)]](https://www.rsc.org/images/entities/char_2009.gif) 10% MnO support material reduced in hydrogen was also analysed by XAS against a series of references. The EXAFS and XANES data are shown in Fig. 6 and Table 5, where the ex situ prepared support (blue solid line), the reference MnTiO3 (red solid line) and the in situ 550 °C reduction sample (yellow solid line) are in good agreement. EXAFS of the prepared support material is a good fit with the theoretical structure, with close alignment of Mn–O, Mn–Mn and Mn–Ti bonds. This also shows a poor fit for other structures of manganese such as MnO and MnTi2O4.
10% MnO support material reduced in hydrogen was also analysed by XAS against a series of references. The EXAFS and XANES data are shown in Fig. 6 and Table 5, where the ex situ prepared support (blue solid line), the reference MnTiO3 (red solid line) and the in situ 550 °C reduction sample (yellow solid line) are in good agreement. EXAFS of the prepared support material is a good fit with the theoretical structure, with close alignment of Mn–O, Mn–Mn and Mn–Ti bonds. This also shows a poor fit for other structures of manganese such as MnO and MnTi2O4.
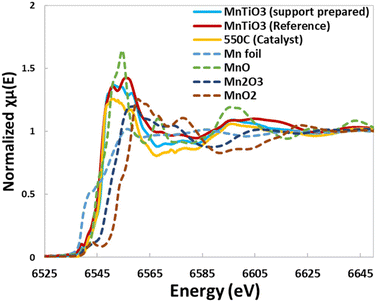 | ||
| Fig. 6 XAS data from XANES showing the close correlation of the synthesised material with the MnTiO3 standard and the EXAFS data fitting the theoretical structure. | ||
| 5% Mn | Mn–O/Å | CN | Mn–Mn/Å | CN | Mn–Ti/Å | CN |
|---|---|---|---|---|---|---|
| (a) MnTiO3 | 2.11, 2.28 | 6 | 3.063 | 3 | 3.433 | 3 |
| (b) MnTiO3 | 2.11, 2.29 | 6 | 3.058 | 4.3 | 3.474 | 2.9 |
| MnO | 2.22 | 6 | 3.14 | 12 | — | — |
| MnTi2O4 | 2.041 | 4 | 3.724 | 4 | — | — |
These support materials were also studied by TPR (ESI-11†). Supports formed from the H2-reduction treatment (where MnTiO3 is proposed) show very small amounts of hydrogen uptake. For the MnO2 forms, some reduction is seen, likely from MnO2 transforming to MnO initially, but also a small peak at 450 °C which is likely to be the transition to MnTiO3. While there is no stoichiometry mass loss between MnO. TiO2 and MnTiO3, there is likely to be some reorganisation which causes this small peak at 450 °C. These samples were run after 2 months of storage in air, indicating that they do not undergo reoxidation to the parent oxide species at room temperature.
When the catalysts were tested, the support materials with manganese oxide still present behaved in line with a non-titanate material (example data in Table 6). For this reason, the focus of the analysis here was on the catalyst made from the 90![[thin space (1/6-em)]](https://www.rsc.org/images/entities/char_2009.gif) :
:![[thin space (1/6-em)]](https://www.rsc.org/images/entities/char_2009.gif) 10 TiO2
10 TiO2![[thin space (1/6-em)]](https://www.rsc.org/images/entities/char_2009.gif) :
:![[thin space (1/6-em)]](https://www.rsc.org/images/entities/char_2009.gif) MnO support mixture, where conversion to the titanate phase was complete. In each case, a comparable catalyst made by a single impregnation and calcined at 300 °C was tested as a control. The details of these are listed in the ESI† for completeness.
MnO support mixture, where conversion to the titanate phase was complete. In each case, a comparable catalyst made by a single impregnation and calcined at 300 °C was tested as a control. The details of these are listed in the ESI† for completeness.
![[thin space (1/6-em)]](https://www.rsc.org/images/entities/char_2009.gif) :
:![[thin space (1/6-em)]](https://www.rsc.org/images/entities/char_2009.gif) CO
CO
| Description (10% Co/Mn/TiO2) | CO conv | Methane sel. | C2–C4 sel. | C5+ sel. |
|---|---|---|---|---|
| 10% Mn, ex situ support (300 °C, H2) | 55.1 | 6.2 | 6.3 | 87.5 |
| 10% Mn, ex situ support (450 °C, air) | 18.3 | 11.4 | 10.6 | 78.0 |
| 0% Mn, 300 °C | 43.6 | 9.2 | 7.2 | 83.7 |
| 0% Mn, 450 °C | 28.2 | 12.0 | 10.5 | 77.5 |
| 10% Mn, 300 °C | 13.3 | 7.0 | 35.0 | 58.0 |
| 10% Mn, 450 °C | 43.3 | 7.1 | 6.9 | 86.0 |
Catalyst stability
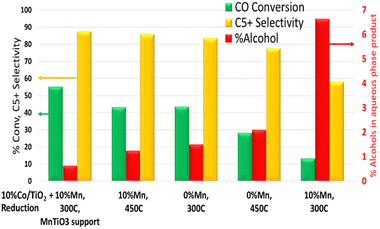
Stability and in-service lifetime tests are also important to consider for the development of viable industrial catalyst. The role of manganese in conventional FT catalysts is as a promoter to support the electronic effects, dispersion and stability.7–10 It is therefore important to ensure the catalyst stability is maintained with the new form of MnTiO3 support. Fig. 7 shows the catalyst activity (CO conversion) over a short life test (600 h) at a constant applied temperature. It shows that all catalysts are stable across the period of testing, with no obvious changes or reconditioning of the catalyst as a result of the longer times online. The ex situ MnTiO3 support with subsequent cobalt addition and 300 °C reduction is the most active, with CO conversion starting at 55%. The 10% Mn reduced at 450 °C and 0% Mn reduced at 300 °C showed similar activity and stability across the run. The unpromoted catalyst at 450 °C was less active than the 300 °C equivalent, but more active than the promoted 300 °C catalyst. The offline product analysis showed noticeable similarities in the fraction (percentage) of paraffins, olefins and alcohols (P![[thin space (1/6-em)]](https://www.rsc.org/images/entities/char_2009.gif) :
:![[thin space (1/6-em)]](https://www.rsc.org/images/entities/char_2009.gif) O
O![[thin space (1/6-em)]](https://www.rsc.org/images/entities/char_2009.gif) :
:![[thin space (1/6-em)]](https://www.rsc.org/images/entities/char_2009.gif) A). In particular the P
A). In particular the P![[thin space (1/6-em)]](https://www.rsc.org/images/entities/char_2009.gif) :
:![[thin space (1/6-em)]](https://www.rsc.org/images/entities/char_2009.gif) O
O![[thin space (1/6-em)]](https://www.rsc.org/images/entities/char_2009.gif) :
:![[thin space (1/6-em)]](https://www.rsc.org/images/entities/char_2009.gif) A for the ex situ MnTiO3 supported catalyst and the Mn promoted 450 °C activated catalyst were very similar, and matched closely with the unpromoted catalyst. The high manganese promoted catalyst which was reduced at 300 °C was in line with previous reports, showing increased selectivity towards functionalised products.
A for the ex situ MnTiO3 supported catalyst and the Mn promoted 450 °C activated catalyst were very similar, and matched closely with the unpromoted catalyst. The high manganese promoted catalyst which was reduced at 300 °C was in line with previous reports, showing increased selectivity towards functionalised products.
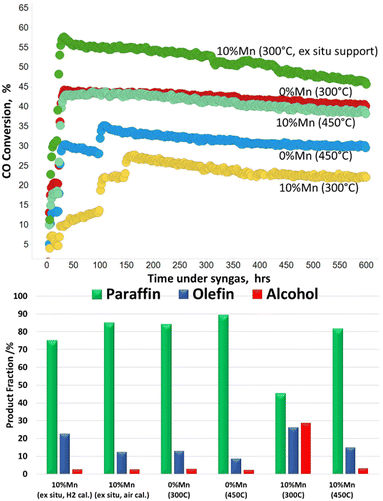 | ||
| Fig. 7 Short catalyst stability tests for the in situ and ex situ prepared catalysts. Temperature in brackets relates to the activation temperature. | ||
Conclusions
Cobalt based FT catalysts are far from a new area of research, indeed FT dates back almost 100 years. That said, in the current climate of low carbon fuels and opportunities for unconventional feedstocks, there is a resurgence of interest in FT and the role it can play to support production of sustainable fuels. This work shown here highlights that there is still much to learn, and opportunities for catalytic control of the process. This work revisited the impact of manganese promotion for higher alcohol selectivity but also explored the impact of using manganese to control the selectivity for paraffinic fuels products. By extension, the fundamental understanding of the manganese, cobalt and support interactions can be used to tune the performance over the novel FT MnTiO3 support. In particular, a catalyst with 10% Mn (Co/TiO2), which would ordinarily have low activity and high selectivity to alcohols can be ‘switched’ to give higher conversion and improved selectivity over an equivalent non-manganese promoted catalyst (Fig. 8). Given manganese alone is inactive for FT, these changes in manganese clearly tune the cobalt active sites to give this enhanced performance.This control can be obtained through a high temperature (>450 °C) treatment in hydrogen of either the calcined catalyst, or alternatively from a specific support design prior to cobalt addition. This enables the benefits of manganese promotion such as reduced deactivation and reduced hydrogen chemisorption, but without the low activity and oxygenated products that are less desirable for fuels/SAF.
Building the fundamental understanding associated with this work has enabled a map of catalyst changes to be drawn out (Fig. 9). By careful temperature and gas flow controls, a range of manipulations can be driven to reach the desired catalyst support/active phases. In conventional FT catalysts, the cobalt and manganese oxides can form a mixed metal spinel on calcination and subsequent activations release cobalt metal particles and MnO, whereas in this work, a high temperature treatment was shown to incorporate the manganese into the support material to form MnTiO3 with discrete cobalt nanoparticles. At high Mn levels, this reduced the high alcohol synthesis selectivity reported previously to regain a highly paraffinic product. Interestingly, the MnTiO3 phase can be made as a bespoke support, retaining the high surface area and porosity, onto which a normal cobalt impregnation can be achieved. A lower temperature re-reduction (for cobalt oxides to Co metal) can be completed with the support's MnTiO3 structure remaining unaffected.
Fig. 9 highlights the overall scheme for routes to a cobalt/manganese/titania catalyst. Route A (grey box) shows the conventional route to normal catalyst design and activation, route B (red box) shows the ex situ catalyst support design through a pre-prepared MnTiO3 support, route C (blue box) shows the impregnation of a MnTiO3 support or MnTiO3 oxidised support to form D, the final material of Co/MnTiO3 (green box).
Experimental
Cobalt on a TiO2 support was used as the catalyst system for these tests, made by mixing the TiO2 powder (P25) and an aqueous cobalt/manganese solution (cobalt nitrate hexahydrate, Aldrich, manganese acetate tetrahydrate, Aldrich). The catalyst samples were made at 10–20 g scale, with the aqueous solution added to the support metal and mixed until homogeneous. The catalyst was calcined in a large box fan assisted furnace in air to decompose the cobalt nitrate hexahydrate precursor to form the oxide (Co3O4) form before testing, confirmed by CHN analysis, X-ray fluorescence (XRF) and XRD. The catalyst material was fully analysed after cobalt nitrate impregnation and calcination, with a surface area of 50.0 m2 g−1, pore volume of 0.28 ml g−1 and pore size of 33 nm. The catalyst was prepared by impregnation of titania before calcining in air at 300 °C. The cobalt loading in metallic form was measured by ICP to be 10 wt% Co. X-ray diffraction data was collected using either a cobalt source for ex situ analysis or using CuKα radiation at 10.5 kW (conventional lab source normally 1.5 kW) using a Bruker D8 super speed source and LynxEye detector over the angular range of 15–90 degrees 2-theta, with fixed divergence slits. The instrument has an Anton Parr XRK900 reaction chamber which enables data collection up to 900 °C and 10 barg. This is specified with the open sample mount to ensure gas flow through the sample to reduce the reliance on diffusion through the powder only. TOPAS software was used for profile fitting and analysis of peaks. The in situ XRD cell was set up to feed CO, H2, inerts or syngas as required, with pressures up to 10 barg. Once the sample was loaded (∼100 μl of catalyst) into the XRD cell, 30 minute analyses were collected every 5 °C rise between room temperature and 300 °C. This was done to give a very slow ramp to observe the transitions in cobalt species. A fixed maximum temperature of 300 °C was used to avoid any changes to the titania support material, which showed no changes during these tests, and therefore requires no further discussion in this paper. The crystallite size is calculated from the integral breadth and Rietveld refinement from all of the peaks collected in the diffraction pattern. Broadening from strain contributed a negligible amount to the refinement and so was not used. Therefore all of the broadening in the spinel and monoxide peaks are assumed to be from changes in crystallite size.X-ray absorption spectroscopy experiments were conducted at the Sector 10 Materials Research Collaborative Access Team (MRCAT) bending magnet (BM) and insertion device (ID) beam lines, at the Co K (7709 eV) and Mn K (6539 eV) edge, respectively, at the Advanced Photon Source (APS) at Argonne National Laboratory (ANL). The beam was calibrated with corresponding metal foil prior to any measurement. Co K edge experiments were conducted in transmission mode and Mn K edge in fluorescence mode within an in situ gas cell. The cubical cell is approximately 100 mL in volume with three openings equipped with Kapton windows of 0.005′′ in thickness, conveniently capable of collecting transmission and fluorescence data, operated at ambient pressure. The inlet and outlet of the cell are controlled by individual ball valve on each gas line, which offers an airtight environment once blocked. The outside wall of the cell is circulated with coolant, whereas the sample's temperature is controlled through a separate temperature control box with thermocouples close to the sample holder inside of the cell. A series of FT catalyst samples were packed into a six-shooter situated in a sealed in situ sample cell. 100% H2 was fed into the sample cell at 100 mL min−1. The temperature was then increased to 300 °C at a rate of 5 °C min−1 and held at 300 °C for 8 h. The cell was then cooled to room temperature for XAS measurement. The same cell was then heated up to 400, 450, 500, 550 °C at the same ramp rate and held for 2 h respectively before dropping to room temperature when the XAS data was collected. All calcined catalyst samples were measured as-received. Data reduction and EXAFS fitting were done with Athena and Artemis XAS data processing package, respectively. The analysis was done averaging eight scans for Mn, and four scans for Co.
XANES spectra were processed using the Athena program (Demeter 0.9.26) (Ravel, 2005). For XANES processing, a simultaneous pre and post-edge background removal was carried out using degree 2 polynomials and a smooth atomic background was then obtained. Measured data were calibrated and aligned based on the corresponding metal foil, followed by normalization based on the height of edge jump. EXAFS refinements were performed with the Artemis package (Demeter 0.9.26) (Ravel, 2005). After data reduction following the above-mentioned protocol, the spectrum was converted to k-space and analysed in the range of 3.0–13 Å−1 or 3.0–14 Å−1 for Co, and 3.0–10 Å−1 for Mn (ESI†). The data in k-space were converted to R-space using a Hanning window to obtain the radial distribution function. The amplitude reduction factor was calibrated and fixed at S02 = 0.77 from Co foil for Co edge, and S02 = 0.93 from MnO reference compound for Mn edge. The mean square disorder Debye–Waller factor was either allow to fit, or at a fixed value based on the reference compound. Other fitting parameters used by FEFFIT included the overall E0 shift applied to each path, a fractional coordination, and an adjustment to half path length (ΔR). STEM HAADF imaging and other analytical techniques were performed using an aberration-corrected FEI Titan G2 ChemiSTEM at the University of Manchester. The microscope was operating at 200 keV with a beam current of 90 pA and a convergence semi-angle of 21 mrad for STEM-HAADF imaging, with the images analysed using Digital Micrograph. This microscope is equipped with the Super-X EDS detector with a collection angle of ≈0.7 sr, and the collected STEM-EDS dataset (200 keV, 140 pA) was post-processed using Esprit. STEM-EELS data was collected with the STEM's Gatan GIF Quantum ER spectrometer with 0.25 eV per channel dispersion and dwell times of 0.1–0.2 s, and the post-processing of EELS dataset was performed by using Digital Micrograph. Temperature Programmed Reduction was carried out on a Micromeritics Autochem II using 10% hydrogen in argon as the reduction gas. The samples were dried under argon for 30 minutes in situ prior to reduction which was carried out with a 10 °C min−1 ramp rate and heated to 900 °C and gas flow rate of 50 mL min−1.
Reactor testing was completed on a 4-tube parallel reactor unit, with individual gas feed, pressures, and temperature control, whilst products were analysed by online GC and by offline methods as reported previously.26
Conflicts of interest
The work described here is subject to multiple patent applications.Acknowledgements
The authors would like to thank BP and Drochaid Research Services for the ongoing work in this area, and for permission to publish this work. Thanks to Glenn Sunley for his insightful and constructive discussions. This work is subject to filed patents. SJH and QL acknowledge funding from the bp International Centre for Advanced Materials (bp-ICAM). TEM access in this work was supported by the Henry Royce Institute for Advanced Materials, funded through EPSRC grants EP/R00661X/1, EP/S019367/1, EP/P025021/1 and EP/P025498/1 and EPSRC grant EP/S021531/1.References
- (a) P. Senecal, S. D. M. Jacques, M. Di Michiel, S. A. J. Kimber, A. Vamvakeros, Y. Odarchenko, I. Lezcano-Gonzalez, J. Paterson, E. Ferguson and A. M. Beale, ACS Catal., 2017, 7, 2284–2293 CrossRef CAS; (b) A. M. Beale, S. D. M. Jacques, M. Di Michiel, J. F. W. Mosselmans, S. W. T. Price, P. Senecal, A. Vamvakeros and J. Paterson, Philos. Trans. R. Soc., A, 2018, 376 Search PubMed; (c) J. Paterson, M. Peacock, E. Ferguson, R. Purves and M. Ojeda, ChemCatChem, 2017, 9, 3463–3469 CrossRef CAS; (d) J. Paterson, M. Peacock, E. Ferguson, M. Ojeda and J. Clarkson, Appl. Catal., A, 2017, 546, 103–110 CrossRef CAS.
- (a) J. J. H. M. Font Freide, T. D. Gamlin, C. Graham, J. R. Hensman, B. Nay and C. Sharp, Top. Catal., 2003, 26, 3–12 CrossRef CAS; (b) J. P. Collins, J. J. H. M. Font Freide and B. Nay, J. Nat. Gas Chem., 2006, 15, 1–10 CrossRef CAS.
- T. D. Gamlin, US8906970 (B2), Davy Process Tech LTD, 2014.
- (a) A. Coe and J. Paterson, Chem. Eng., 2019, 937, 30–34 Search PubMed; (b) M. Peacock, J. Paterson, L. Reed, S. Davies, S. Carter, A. Coe and J. Clarkson, Top. Catal., 2020, 63, 328–339 CrossRef CAS; (c) R. Pearson, A. Coe and J. Paterson, Johnson Matthey Technol. Rev., 2021, 65, 396–404 Search PubMed.
- (a) BP and Johnson Matthey license innovative waste-to-fuels technology to biofuels producer Fulcrum BioEnergy, BP Press Office, 25 September 2018 Search PubMed; (b) https://www.bp.com/content/dam/bp/business-sites/en/global/corporate/pdfs/news-and-insights/press-releases/bp-and-johnson-matthey-license-innovative-waste-to-fuels-technology-to-biofuels-producer-fulcrum-bioenergy.pdf .
- J. Paterson, M. Peacock, R. Purves, R. Partington, K. Sullivan, G. Sunley and J. Wilson, ChemCatChem, 2018, 10, 5154–5163 CrossRef CAS.
- G. R. Johnson, S. Werner and A. T. Bell, ACS Catal., 2015, 5, 5888–5903 CrossRef CAS.
- F. Morales, D. Grandjean, F. M. F. de Groot, O. Stephan and B. M. Weckhuysen, Phys. Chem. Chem. Phys., 2005, 7, 568–572 RSC.
- F. Morales, E. de Smit, F. M. F. de Groot, T. Visser and B. M. Weckhuysen, J. Catal., 2007, 246, 91–99 CrossRef CAS.
- A. Dinse, M. Aigner, M. Ulbrich, G. R. Johnson and A. T. Bell, J. Catal., 2012, 288, 104–114 CrossRef CAS.
- C.-J. Pan, M.-C. Tsai, W.-N. Su, J. Rick, N. G. Akalework, A. K. Agegnehu, S.-Y. Cheng and B.-J. Hwang, J. Taiwan Inst. Chem. Eng., 2017, 74, 154–186 CrossRef CAS; V. A. de la Peña O'Shea, M. Consuelo Álvarez Galván, A. E. Platero Prats, J. M. Campos-Martin and J. L. G. Fierro, Chem. Commun., 2011, 47, 7131–7133 RSC.
- G. L. Bezemer, P. B. Radstake, U. Falke, H. Oosterbeek, H. P. C. E. Kuipers, A. J. van Dillen and K. P. de Jong, J. Catal., 2006, 237, 152–161 CrossRef CAS; G. R. Johnson, S. Werner and A. T. Bell, ACS Catal., 2015, 5, 5888–5903 CrossRef.
- M. Wolf, N. Fischer and M. Claeys, Chem Catal., 2021, 1, 1014–1041 CrossRef CAS.
- D. J. Moodley, A. M. Saib, J. van de Loosdrecht, C. A. Welker-Nieuwoudt, B. H. Sigwebela and J. W. Niemantsverdriet, Catal. Today, 2011, 171, 192–200 CrossRef CAS.
- E. Rytter and A. Holmen, Catal. Today, 2016, 275, 11–19 CrossRef CAS; M. Wolf, E. K. Gibson, E. J. Olivier, J. H. Neethling, C. R. A. Catlow, N. Fischer and M. Claeys, ACS Catal., 2019, 9, 4902–4918 CrossRef; Y. Zhang, D. Wei, S. Hammache and J. G. Goodwin, J. Catal., 1999, 188, 281–290 CrossRef; P. A. Chernavskii, G. V. Pankina, R. V. Kazantsev, S. V. Maksimov, S. Y. Kupreenko, A. N. Kharlanov and O. L. Eliseev, Kinet. Catal., 2022, 63, 304–311 CrossRef.
- G. Busca, Catal. Today, 2020, 357, 621–629 CrossRef CAS.
- M. K. Mardkhe, B. Huang, C. H. Bartholomew, T. M. Alam and B. F. Woodfield, J. Porous Mater., 2016, 23, 475–487 CrossRef CAS; Y. Zhang, B. Huang, M. K. Mardkhe and B. F. Woodfield, Microporous Mesoporous Mater., 2019, 284, 60–68 CrossRef.
- A. Kogelbauer, J. C. Weber and J. G. Goodwin, Catal. Lett., 1995, 34, 259–267 CrossRef CAS.
- J. G. Moya-Cancino, A.-P. Honkanen, A. M. J. van der Eerden, H. Schaink, L. Folkertsma, M. Ghiasi, A. Longo, F. M. F. de Groot, F. Meirer, S. Huotari and B. M. Weckhuysen, ChemCatChem, 2019, 11, 1039–1044 CrossRef CAS PubMed.
- F. Morales, D. Grandjean, F. M. F. de Groot, O. Stephan and B. M. Weckhuysen, Phys. Chem. Chem. Phys., 2005, 7, 568–572 RSC; D. Grandjean, F. Morales, A. Mens, F. M. F. de Groot and B. M. Weckhuysen, AIP Conf. Proc., 2007, 882, 666–668 CrossRef CAS.
- M. Valigi and A. Cimino, J. Solid State Chem., 1975, 12, 135–143 CrossRef CAS.
- A. Abedini and S. Khademolhoseini, J. Mater. Sci.: Mater. Electron., 2016, 27, 330–334 CrossRef CAS; H. Wang, Q. Gao, H. T. Li, M. Gao, B. Han, K. S. Xia and C.-G. Zhou, ACS Appl. Nano Mater., 2018, 1, 2727–2738 CrossRef; A. M. Abyzov, N. A. Khristyuk and F. M. Shakhov, Ceram. Int., 2020, 46, 1990–2001 CrossRef; S.-H. Chuang, R.-H. Gao, D.-Y. Wang, H.-P. Liu, L.-M. Chen and M. Y. Chiang, J. Chin. Chem. Soc., 2010, 57, 932–937 CrossRef.
- M. Zhao, Z. Zhao, Y. Lyu, W. Lu, M. Jin, T. Liu, H. Zhu and Y. Ding, Ind. Eng. Chem. Res., 2021, 60, 2849–2860 CrossRef CAS.
- T. Oku, M. Nonoguchi, T. Moriguchi, H. Izumi, A. Tachibana and T. Akatsuka, RSC Adv., 2012, 2, 8619–8622 RSC.
- J. Paterson, R. Partington, M. Peacock, K. Sullivan, J. Wilson and Z. Xu, Eur. J. Inorg. Chem., 2020, 2020, 2312–2324 CrossRef CAS.
- R. Partington, J. Clarkson, J. Paterson, K. Sullivan and J. Wilson, J. Anal. Sci. Technol., 2020, 11, 42 CrossRef CAS.
Footnote |
| † Electronic supplementary information (ESI) available. See DOI: https://doi.org/10.1039/d3cy00030c |
| This journal is © The Royal Society of Chemistry 2023 |

