
Heteroatom zeolites with a high content of framework metal sites as Lewis-acid catalysts for the conversion of ethanol–acetaldehyde to 1,3-butadiene†
Haoxi
Jiang
 abc,
Liping
Yi
abc,
Guochao
Yang
abc and
Lingtao
Wang
*abc
abc,
Liping
Yi
abc,
Guochao
Yang
abc and
Lingtao
Wang
*abc
aKey Laboratory for Green Chemical Technology of Ministry of Education, R&D Center for Petrochemical Technology, Tianjin University, Tianjin 300072, China. E-mail: ltwang@tju.edu.cn; Tel: +86 22 27406119
bZhejiang Institute of Tianjin University, Ningbo, Zhejiang 315201, China
cState Key Laboratory of Engines, Tianjin University, Tianjin 300072, China
First published on 17th November 2022
Abstract
Heteroatom zeolites possess good Lewis acidity due to heteroatom incorporation in their framework. However, a high incorporation of metals can be hardly achieved because of the weak interactions between the metals and zeolite framework, which limit their catalytic activity. An improved dissolution–reconstruction strategy is proposed in this study for preparing a high content of framework metal sites in heteroatom Zr-β zeolites. The prepared Zr-β zeolite possessed a high Zr content of 5.0 wt% compared to other reported zeolites (1.5 wt% in general), together with more framework Zr sites, better Lewis acidity, and higher mesoporosity. The higher performance is due to the synergistic effect of the parent *BEA framework and the functional agents TEA+, OH−, and F−, as well as the process control. The as-fabricated Zr-β zeolite demonstrated high catalytic performance in the conversion of an ethanol–acetaldehyde mixture to 1,3-butadiene, which was mainly attributed to its high content of framework Zr sites and good diffusion properties resulting from its high mesoporosity.
1. Introduction
Metal sites (such as Sn, Ti, Zr, and Hf) incorporated into the zeolite framework display electron acceptability and good Lewis acidity due to their different electronegativity and coordination. Thus, they have abilities for the selective adsorption, polarization, and activation of carbonyl groups,1,2 showing great potential for many catalytic reactions, such as the isomerization of monosaccharides,3 aldol condensation,4–7 dehydration of alcohols,8,9 Meerwein–Ponndorf–Verley (MPV) reaction,10–14 Baeyer–Villiger oxidation,15,16 and epoxidation of alkenes,1,17–20 as well as ethanol (and acetaldehyde) to 1,3-butadiene (ETB) tandem reaction.21,22Zr-zeolite is one of the most active and selective Lewis acid catalysts for the ETB reaction (Scheme 1).23 This route has attracted widespread attention since the oil route for producing butadiene was affected by the development of shale gas and bioethanol technology. Sushkevich demonstrated that Ag/Zr-β was capable of catalyzing the ETB reaction, achieving a 48% conversion and 56% selectivity.21 Mg–Zr/MFI nanosheets24 and Zr/MCF25 were also reported to be effective catalysts in the ETB process. In addition, Jiang in our research group also demonstrated some progress in the ETB reaction catalyzed by Zr-SBA-15 and Zr-β.26,27
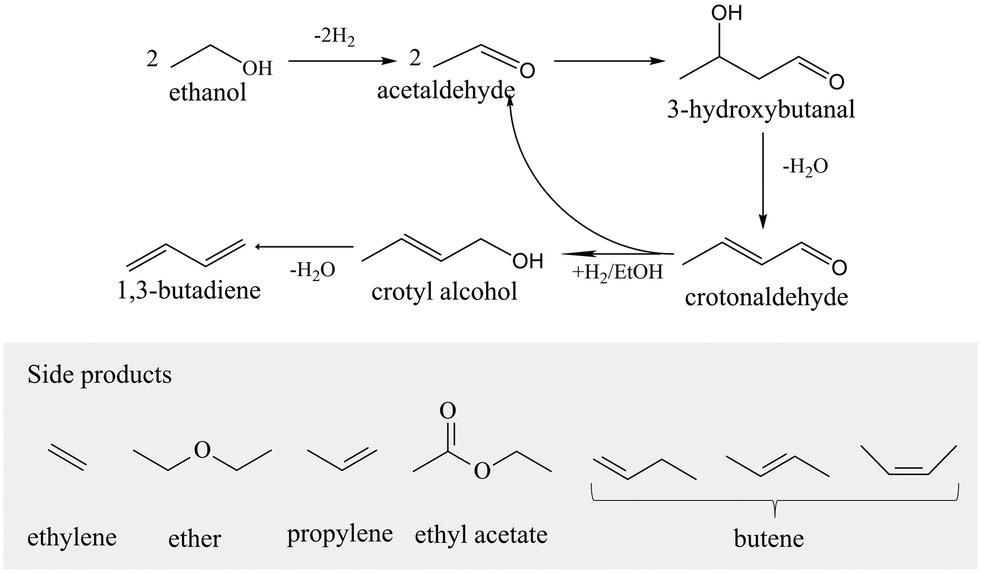 | ||
| Scheme 1 ETB route for producing butadiene.28 | ||
As mentioned above, heteroatom zeolites with sufficient isolated framework metal sites possess high activity due to the good Lewis acidity upon metal incorporation.29 The preparation methods mainly include direct synthesis13,30–32 and a suitable post-treatment.33,34 However, extra-framework species cannot be avoided in these methods due to the uncontrollable hydrolysis of the metal precursor as well as the metal–silica interactions in the absence of structure-directing agents, especially under the circumstance of the introduction of a high content of metal.13,16,35,36 Hence, the preparation of heteroatom zeolites with a high metal content remains a challenge.
Dissolution–reconstruction (DRC) is an effective approach for the development of mesoporosity in zeolites, where recrystallization after the dissolution of the zeolite framework is favorable for maintaining the framework of metals.37 Inspired by this idea, an improved dissolution–reconstruction (IDRC) strategy is proposed for achieving a high content of framework metal sites in heteroatom zeolites. Apart from the dissolution–reconstruction strategy of the parent *BEA framework, the better dispersion of Zr species via controllable dissolution and hydrolysis of the Zr precursor are the key improvements in IDRC, which guarantees strong interactions between the hydrolyzed Zr and Si species and thus more isolated tetrahedral Zr incorporation.
In this work, we tested the hypothesized IDRC strategy for the development of a high metal content in Zr-β zeolite, which has been proven to be one of the most active catalysts for the conversion of ethanol–acetaldehyde to 1,3-butadiene. The high metal content was proved, while the detailed mechanism of IDRC was systematically investigated by control experiments. The obtained Zr-β could be a promising robust Lewis acid catalyst in the conversion of an ethanol–acetaldehyde mixture to 1,3-butadiene thanks to its high conversion and stability compared with the traditional ones.
2. Methods
2.1 Catalysts preparation
Preparation of dealuminated β zeolite (DeAl-β). Hβ zeolite (Nankai University Catalyst Factory, Si/Al = 12.5) was treated with nitric acid (HNO3, Damao, 65–68%) at 353 K for 12 h. The samples were filtered, washed with deionized water, and dried at 393 K for 12 h.Samples synthesized by IDRC. According to the chemical composition of SiO2:0.04ZrO2:0.5TEAOH:0.5NH4F:7.5H2O:1IPA:0.6H2O2, tetraethylammonium hydroxide (TEAOH, Aladdin, 25%) and DeAl-β were mixed, and zirconium n-butoxide (BZ, Aladdin, 80% in n-butanol) was added slowly to a solution of isopropanol (IPA, Damao, AR) and hydrogen peroxide (H2O2, Kermel, 30%). Subsequently, the latter mixture was added to the former. Afterward, the final mixture was stirred for 2 h and then heated to 353 K to reach the specified quality. Ammonium fluoride (NH4F, Macklin, 98%) was added finally. After being crystallized at 413 K for 24 h under static conditions, the product was filtered, washed, dried at 393 K for 12 h, and calcined at 823 K for 6 h. The obtained Zr-β zeolite was denoted as IDRC25, where 25 represents the Si/Zr ratio in the gel.
Samples synthesized by DRC. TEAOH (Aladdin, 25%), zirconyl chloride octahydrate (ZrOCl2·8H2O, Guangfu, 99.0%), NH4F (Macklin, 98%), and DeAl-β were mixed. The final chemical composition was SiO2:0.04ZrO2:0.5TEAOH:0.5NH4F:7.5H2O. The mixture was crystallized at 413 K for 24 h under static conditions. Then the product was filtered, washed, dried at 393 K for 12 h, and calcined at 823 K for 6 h. The obtained Zr-β zeolite was denoted as DRC25, where 25 represents the Si/Zr ratio in gel.
Samples synthesized by liquid-phase incorporation (LPI). ZrOCl2·8H2O and DeAl-β were added into water with the composition of SiO2:nZrO2:10H2O, where n represents the Zr/Si ratio in the gel. The mixture was stirred at 298 K for 12 h, then dried at 353 K without filtration and washing, and calcined at 823 K for 4 h. The obtained Zr-β zeolite was denoted as LPIz (z = 25, 100), where z represents the Si/Zr ratio in the gel.
The preparation of ZrO2/DeAl-β. Zirconium dioxide (ZrO2, Aladdin, 99.99%) and DeAl-β were added into water with the composition of SiO2:0.01ZrO2:10H2O. The mixture was stirred at 298 K for 12 h, then dried at 353 K without filtration and washing, and calcined at 823 K for 4 h.
2.2 Characterization
Powder X-ray diffraction (XRD) patterns of the samples were recorded on a Rigaku Miniflex 600 diffractometer with Cu Kα radiation (λ = 1.54056 nm) at 40 kV and 15 mA. The relative crystallinity (R.C.) was calculated from the peak area at 2θ = 22.4° and the parent Hβ zeolite was used as the standard. N2 adsorption–desorption isotherms were measured at 77 K using a Micromeritics Tristar 3000 automatic surface-area and pore-size analyzer after degassing at 473 K for 6 h under vacuum. The total specific surface area (SBET) was calculated by the Brunauer–Emmett–Teller (BET) method. Also, the total pore volume (Vtotal) was estimated from the quantity of N2 adsorption at the relative pressure of 0.97. The pore volume and surface area of the micropore (Vmicro and Smicro) were obtained by the t-plot method.Transmission electron microscopy (TEM) images of the samples were obtained on a Tecnai G2 F20 microscope at 200 kV. Fourier transform infrared resonance (FT-IR) was performed on a Nicolet 6700 spectrometer with 64 scans at a resolution of 4 cm−1. The samples were diluted with potassium bromide and pressed into wafers before measurement. Thermogravimetric analysis (TG) was performed using a Mettler DSTA851 thermogravimetric analyzer. The temperature was linearly increased from 298 to 1173 K at a rate of 10 K min−1 using 50 mL min−1 air as the reaction gas.
The SiO2/Al2O3 contents of the samples were measured by X-ray fluorescence spectroscopy (XRF) on a Shimadzu Supermini 200X spectrometer. The metal contents of Zr-β were determined using a Perkin Elmer Optima 5300DV inductively coupled plasma optical emission spectrometry (ICP-OES) system. Prior to the analysis, the samples were dissolved in HF.
Ultraviolet-visible (UV-vis) diffuse reflectance spectroscopy was carried out on a Perkin Elmer Lambda 750 spectrophotometer. Barium sulfate was used as the reference. X-Ray photoelectron spectroscopy (XPS) was performed on a Thermo Fisher ESCALAB 250Xi electron spectrometer using an Al Kα X-ray source (486.6 eV, 150 W) at a constant analyzer pass energy of 30 eV. C1s (284.6 eV) was used as the reference.
The infrared spectra of the adsorbed pyridine (Py-IR) were obtained on a Gangdong 560 infrared spectrometer. The self-supporting wafers (∼10 mg) were loaded into the transmission cell and sealed. The cell was heated to 623 K and held for 3 h under vacuum. Pyridine was introduced at 323 K for 30 min and the spectra were collected at 423, 523, and 623 K, respectively. The concentrations of the Brønsted and Lewis acid sites were determined from the integration of the adsorption bands at 1545 and 1454 cm−1, using the extinction coefficients eB = 1.67 cm−1 mol−1 and eL = 2.22 cm−1 mol−1, respectively.38
Solid-state 29Si magnetic angle spinning nuclear magnetic resonance spectroscopy (29Si MAS NMR) was performed using a JEOL JNM ECZ600R spectrometer, operating at a resonance frequency of 119.23 MHz with a spinning rate of 6 kHz. The 29Si chemical shifts were reported relative to tetramethylsilane.
2.3 Catalytic reactions
A quartz fixed-bed reactor with an inner diameter of 14 mm was used to evaluate the activity of ethanol (EtOH)–acetaldehyde (AcH) to butadiene. First, 0.5 g catalyst with 20–40 mesh was loaded. Then the reactor was heated at 598 K for 1 h with 40 mL min−1 N2 for activation. Ethanol–acetaldehyde mixture with a molar ratio of 1![[thin space (1/6-em)]](https://www.rsc.org/images/entities/char_2009.gif) :1 was pumped using a Series II HPLC pump at a weight hourly space velocity (WHSV) of 1.04 h−1. The reactor was maintained at 598 K with 40 mL min−1 N2 as the carrier gas. The products were analyzed by a Shimadzu GC-2010 gas chromatography system equipped with an FID detector and an HP-Plot/Q column (30 m × 0.32 mm × 20 μm) with He as the carrier gas. The conversion, selectivity, and space time yield were calculated through the formula below.27,37,39,40
:1 was pumped using a Series II HPLC pump at a weight hourly space velocity (WHSV) of 1.04 h−1. The reactor was maintained at 598 K with 40 mL min−1 N2 as the carrier gas. The products were analyzed by a Shimadzu GC-2010 gas chromatography system equipped with an FID detector and an HP-Plot/Q column (30 m × 0.32 mm × 20 μm) with He as the carrier gas. The conversion, selectivity, and space time yield were calculated through the formula below.27,37,39,40

| Space time yield (g gcat−1 h−1) = conversion × selectivity × WHSV |
3. Results and discussion
3.1 Properties of the Zr-β catalyst obtained via IDRC
Zr-β catalyst with a Si/Zr ratio of 25 in gel was constructed by IDRC and named IDRC25. DRC25 and LPI25, with the same Zr content in gel, were prepared for comparison via DRC and LPI (one of the post-synthesis methods), respectively. Moreover, the sample failed to crystalize via direct synthesis due to the high content of heteroatoms, even up to 20 days, in line with the conclusion reported in the literature that high content metals inhibit nucleation.13,41,42 The XRD patterns (Fig. 1) manifested that the three samples still retained the *BEA topological structure during metal incorporation without ZrO2 or any other impurity phase. IDRC25 had the similar crystallinity with LPI25 but lower than DRC25 (Table 1), implying that IDRC will slightly damage the integrity of the framework. Nevertheless, the peaks of the crystal planes (101) and (302) of IDRC25 were shifted to lower angles,43 inferring that Zr may be incorporated into the zeolite framework. In addition, the peak of Si–O–Si at 1219 cm−1 was shifted to lower wavenumbers in the FT-IR spectra (Fig. S1†),44 which supported this point. | ||
| Fig. 1 XRD patterns of IDRC25, DRC25, and LPI25. | ||
| Sample | R.C. (%) | S BET (m2 g−1) | S Micro (m2 g−1) | S Ext (m2 g−1) | V Total (cm3 g−1) | V Micro (cm3 g−1) | V Meso (cm3 g−1) |
|---|---|---|---|---|---|---|---|
| a The calculation methods for determining the relative crystallinity (R.C.), surface area, and pore volume can be found in section 2.2. | |||||||
| IDRC25 | 53 | 455 | 264 | 191 | 0.721 | 0.139 | 0.582 |
| DRC25 | 87 | 535 | 362 | 173 | 0.475 | 0.190 | 0.285 |
| LPI25 | 57 | 456 | 310 | 146 | 0.407 | 0.163 | 0.244 |
| β | 100 | 486 | 350 | 124 | 0.374 | 0.184 | 0.190 |
Additionally, IDRC25 possessed high mesoporosity. Table 1 reveals that the mesopore volume of IDRC25 (0.582 cm3 g−1) was about twice that of DRC25 (0.285 cm3 g−1) and LPI25 (0.244 cm3 g−1), and even three times that of β zeolite (0.190 cm3 g−1). Meanwhile, many irregular mesopores were also observed in the TEM images (Fig. S2†).
The amounts of Si–OH of the three samples were also measured by the 29Si MAS NMR spectra (Fig. S3†). The peak at −101 ppm was assigned to Q3 species of (SiO)3SiOH, and the peaks at −114, −112, and −110 ppm were assigned to Q4 species of Si(OSi)4 at different T sites.45 As specified in Table 2, the proportion of Q3 in IDRC25 was 17% (compared with 5% in DRC25), proving the increasing number of Si–OH owing to there being lots of mesopores (Table 2). These results demonstrated that IDRC could achieve lots of mesopores at the same time as metal incorporation. However the increase in mesopores was at the cost of the micropores, which inevitably led to a decrease in the relative crystallinity. Note that the high proportion of Q3 in LPI25 (20%) was due to the silanol nests after dealumination, different from the cause of the formed silanol in IDRC25.
The content, distribution, and coordination of Zr in zeolite are believed to affect the catalytic performance. Table 2 details the chemical compositions of the samples. Approximately all the zirconium was incorporated into IDRC25 (5.0 wt%, Si/Zr = 28), more than double that of DRC25 (2.2 wt%, Si/Zr = 66). Obviously, DRC had a problem with the low utilization of metals. Meanwhile, LPI25 had the same Zr content (5.5 wt%, Si/Zr = 25) as that in gel due to the method not including filtration and washing. However, there was a great difference in the distribution and configuration of Zr among them. The Si/Zr ratio in the bulk phase of LPI25 was smaller than that on the surface, illuminating that Zr could not be dispersed uniformly in the zeolite via LPI. By contrast, the Si/Zr ratio in the bulk phase of IDRC25 and DRC25 was roughly the same as that on the surface, deducing that IDRC and DRC could achieve a uniform distribution of metals. High-resolution TEM and element mapping analysis (Fig. 2) were also conducted to visualize the dispersion of Zr in the framework of β zeolite. EDX mapping indicated that Zr species were homogeneously distributed in the IDRC25 zeolite.
 | ||
| Fig. 2 HRTEM and element mapping analysis of the IDRC25 sample. | ||
The coordination states of Zr in the samples were analyzed by UV-vis and XPS. The UV-vis spectra (Fig. 3a) revealed strong absorption at 194 nm but no absorption at 230 nm, both of which could be attributed to charge transfer between the oxygen atoms and metal centers. The former was generally assigned to the tetrahedral Zr in the framework, while the latter was related to the extra-framework ZrO2-like species.46 Therefore, the UV-vis results confirmed the existence of framework Zr in IDRC25, DRC25, and LPI25.
 | ||
| Fig. 3 (a) UV-vis and (b) XPS spectra of IDRC25, DRC25, and LPI25. | ||
Furthermore, XPS spectra (Fig. 3b) established that the binding energies of Zr 3d3/2 and 3d5/2 in ZrO2 were 184.6 and 182.2 eV, respectively. The Zr 3d binding energy in both IDRC25 and LPI25 was shifted upward to 185.5 and 183.2 eV, while DRC25 shifted evenly to 186.0 and 183.7 eV, close to the 183.3 eV of ZrSiO4 and in good agreement with other reported hydrothermally synthesized13 and post-treated Zr-β zeolites.43,45 Since the difference in electronegativity between Zr and Si leads to a higher shift of the Zr 3d binding energy after Zr incorporation to form Zr–O–Si bonds,47 the existence of four-coordinated framework Zr species in IDRC25, DRC25, and LPI25 was also elucidated. Note that nano ZrO2-like species could not be detected in the UV-vis or XPS spectra. Acidity can provide favorable evidence from another side for the existence of Zr species.
A high content of framework metal sites inevitably contribute to the increase in the amount of strong Lewis acid.43,48Table 3 shows that the strong Lewis acid amounts of IDRC25 (120 μmol g−1), DRC25 (106 μmol g−1), and LPI25 (57 μmol g−1) increased after metal incorporation compared to DeAl-β (27 μmol g−1). Apart from that, IDRC25 was found to have the strongest acidity due to its highest NH3 desorption temperature at maximum and instead LPI25 had the weakest one according to the NH3-TPD results (Table S1†). It can be deduced that there existed framework Zr in IDRC25, DRC25, and LPI25, and IDRC25 incorporated a much higher content of framework Zr in comparation with the latter two.
| Sample | Zr contenta (wt%) | Lewis acidityb (μmol g−1) | Con.c (%) | Sel.c (%) | |||
|---|---|---|---|---|---|---|---|
| Total | Weak | Medium | Strong | ||||
| a Determined by ICP. b Measured by infrared spectra of the adsorbed pyridine. c Reaction conditions: 598 K, WHSV = 1.0 h−1, TOS = 6 h. d Not measured. | |||||||
| Hβ | 0 | 256 | 127 | 114 | 15 | — | — |
| DeAl-β | 0 | 554 | 271 | 257 | 27 | 52.8 | 0.3 |
| ZrO2/DeAl-β | 1.5 | 551 | 350 | 185 | 14 | 11.8 | 9.4 |
| LPI100 | 1.5 | 444 | 229 | 165 | 51 | 35.3 | 66.0 |
| LPI25 | 5.5 | 594 | 266 | 271 | 57 | 37.7 | 68.9 |
| DRC100 | n.m.d | 210 | 122 | 40 | 48 | 32.9 | 63.7 |
| DRC50 | n.m.d | 414 | 191 | 129 | 93 | 40.7 | 65.5 |
| DRC25 | 2.2 | 545 | 265 | 174 | 106 | 45.1 | 69.4 |
| IDRC25 | 5.0 | 251 | 85 | 46 | 120 | 55.9 | 66.0 |
3.2 Effect of the metal introduction amount on the properties
A series of Zr-β zeolites with different Zr contents were constructed by IDRC (Si/Zr = 50–20 in gel) and DRC (Si/Zr = 100–15 in gel) to explore the effect of the metal incorporation amount. The obtained Zr-β zeolites were denoted as IDRCx and DRCy, where x and y represent the Si/Zr ratio in gel.All the samples had the *BEA topological structure as shown in the XRD patterns (Fig. S5†) and possessed a relative crystallinity above 50%. All the IDRC samples had a greater mesoporous volume, which decreased with the increase in Zr content, while all the DRC samples possessed lower ones. The difference in mesoporosity between IDRC and DRC was also observed in the TEM images (Fig. 2). These IDRC samples possessed Zr contents of 3.1–5.3 wt%. Also, no bulk ZrO2 could be observed by UV-vis until the Zr content in the product was higher than 5.0 wt% (Fig. S6 and Table S1†).
Besides, the ETB activity also corresponded to the contents of framework Zr sites. The ethanol–acetaldehyde conversion and 1,3-butadiene selectivity emerged with the increase in Zr content and then decreased when it exceeded 5.0 wt% (IDRC) or 2.2 wt% (DRC), manifesting that both methods achieved the best catalytic performance when the Si/Zr ratio in the gel was 25. These results suggested that IDRC could introduce a more than double Zr content in zeolite and better ETB activity.
3.3 Mechanism of IDRC
Process control, functional agents TEA+, OH−, and F−, and the parent framework DeAl-β were found to key to incorporating Zr with high contents in IDRC. Therefore, comparative experiments (Scheme 2) were designed to analyze the function of these agents and to explore the optimum mechanism of the method. | ||
| Scheme 2 Design of the comparative IDRC experiments. ①–⑨ were conducted referring to the IDRC procedures as follows: ① IDRC25, all the required agents were added and zirconium n-butoxide (BZ) in isopropanol (IPA) used as the Zr precursor; ② BZ in H2O used as the Zr precursor; ③ adopted zirconium n-propoxide (PZ) in IPA; ④ adopted zirconium ethoxide (EZ) in IPA; ⑤ H2O2 was not added; ⑥ TEA+ was not added; ⑦ OH− was not added; ⑧ F− was not added; ⑨ tetraethyl orthosilicate (TEOS) was used as the silicon source in place of DeAl-β. | ||
Compared to DRC, IDRC achieved a better dispersion of Zr species via controllable dissolution and hydrolysis of the Zr precursor. Several Zr precursors and solvents with different solubilities were studied as comparative samples (Table 4). A moderate to low solubility of Zr precursor was found to possess the highest ethanol–acetaldehyde conversion. We speculated that too high or too low a solubility of Zr precursor was inappropriate. Only the proper dissolution of Zr precursor led to its proper hydrolysis rate to match the Si species, which made it possible that a single hydrolyzed Zr species could interact with enough hydrolyzed Si species, instead of undergoing the self-polymerization of Zr species. Additionally, other process controls, for instance, low temperature and complexing, were also conducted to further slow the hydrolysis. The catalyst without H2O2 (Table 5, sample ⑤) possessed a low ETB activity, indicating H2O2 could promote more framework Zr sites instead of extra-framework Zr species. In the classical synthesis procedure of titanium silicalite-1, H2O2 could complex TBOT, with a similar structure as Zr n-butoxide, to promote metals existing as single atoms.49 Thus, H2O2 was speculated to complex Zr precursor, facilitating a better dispersion of Zr species. In short, a better dispersion of Zr species among Si species through process control was crucial for more isolated tetra-coordinated Zr incorporation in IDRC.
| Sample | Comparative factors | R.C. (%) | S BET (m2 g−1) | S Micro (m2 g−1) | V Total (cm3 g−1) | V Micro (cm3 g−1) | Con.a (%) | Sel.a (%) |
|---|---|---|---|---|---|---|---|---|
| a Reaction conditions: 598 K, WHSV = 1.0 h−1, TOS = 6 h. b Not measured. | ||||||||
| ① | All in | 53 | 455 | 264 | 0.721 | 0.139 | 55.9 | 66.0 |
| ⑤ | Without H2O2 | n.m.b | n.m.b | n.m.b | n.m.b | n.m.b | 49.8 | 63.1 |
| ⑥ | Without TEA+ | 0 | 46 | 17 | 0.121 | 0.009 | 4.4 | 0 |
| ⑦ | Without OH− | 103 | 547 | 366 | 0.495 | 0.192 | 28.9 | 57.4 |
| ⑧ | Without F− | 48 | 530 | 251 | 0.451 | 0.132 | 29.2 | 47.7 |
| ⑨ | Without nuclei | 0 | 141 | 55 | 0.236 | 0.029 | n.m.b | n.m.b |
TEA+ was the template cation for the synthesis of β zeolite. According to the FT-IR spectra (Fig. 4a), all the uncalcined samples (①, ⑦, and ⑧) containing TEA+ possessed peaks for C–H bond vibrations (1485 and 1393 cm−1) and C–N bond vibrations (1172 cm−1). After calcination, the above peaks disappeared, illuminating that TEA+ interacted and combined with the zeolite framework, which was also evidenced by the weight loss about the degradation of TEA+ at 523 K in TG-DTG (Fig. S7†).50 The role of TEA+ in IDRC was further analyzed by comparative experiments ① and ⑥. In ①, all the agents required in IDRC were added, while in ⑥ TEA+ was not added. The feature peaks about *BEA and even Si–O–Si bonds were not observed in ⑥ (Fig. 4a and b), indicating that the framework could not be retained due to the lack of TEA+ in IDRC. In addition, ⑥ possessed extremely weak ETB activity (Table 4), verifying that framework retention was the prerequisite for the catalysis. Consequently, the addition of TEA+ was shown to be necessary for the final framework formation in IDRC.
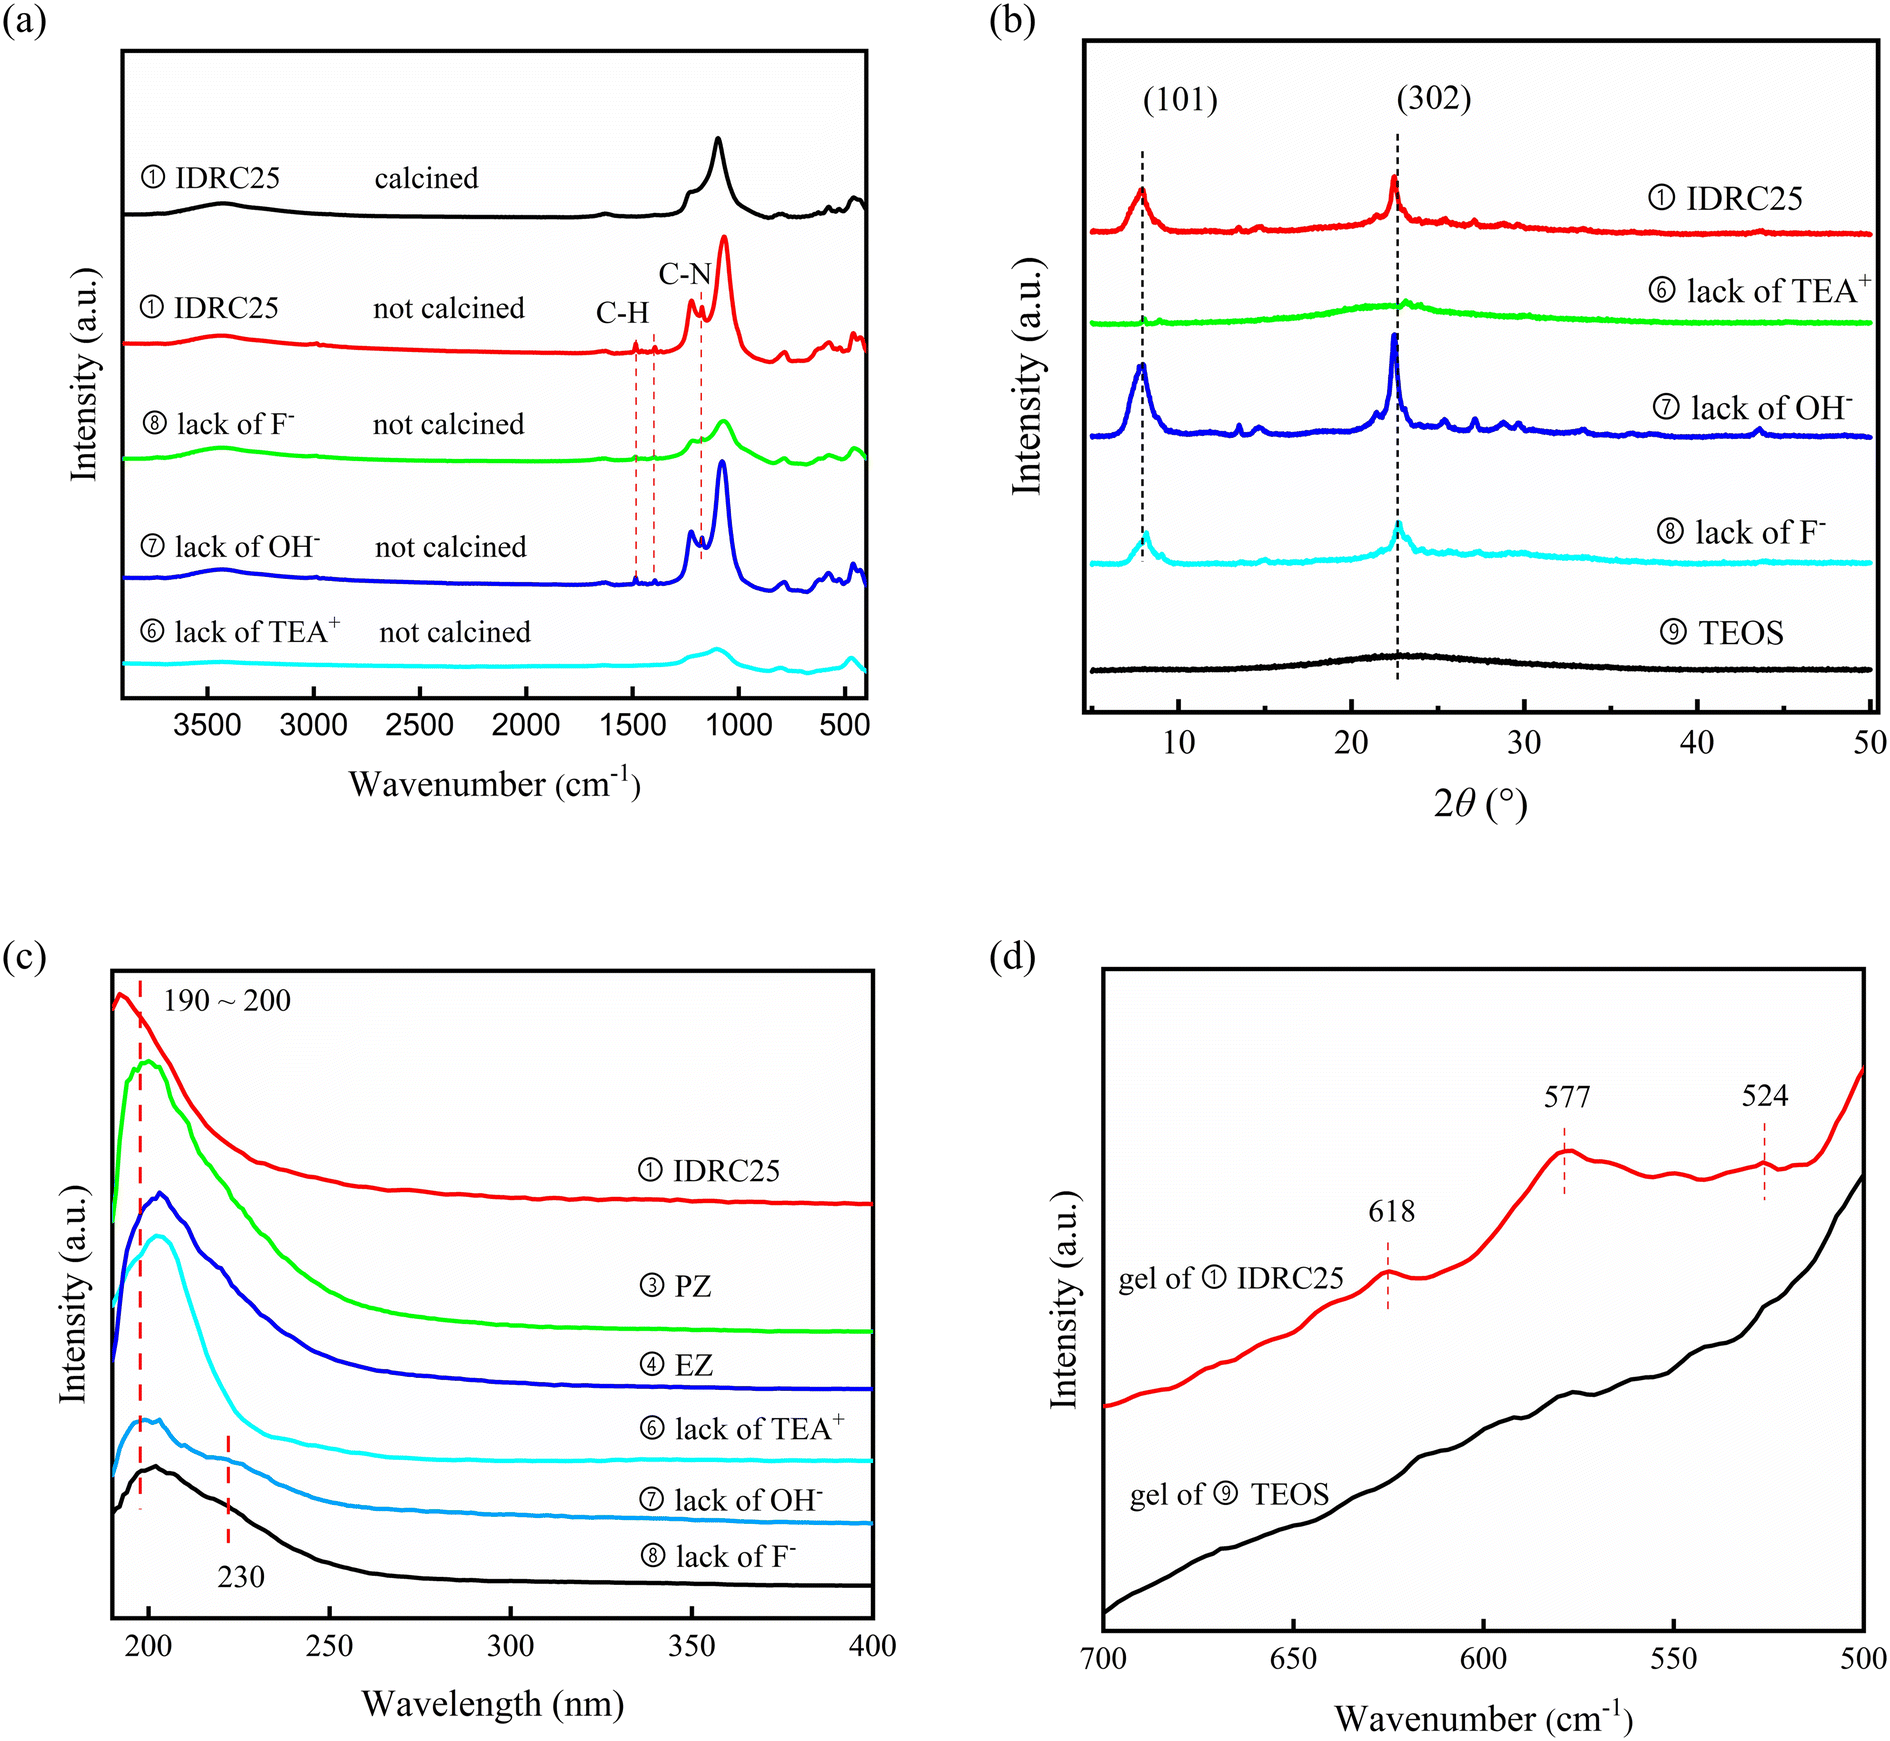 | ||
| Fig. 4 (a) FT-IR, (b) XRD, and (c) UV-vis spectra of comparative samples. (d) FT-IR spectra of gels of ① and ⑨. | ||
OH− provided alkaline conditions required for crystallization. The role of OH− in IDRC was analyzed through comparative experiments ① and ⑦. OH− was not added in ⑦. The XRD patterns and FT-IR spectra (Fig. 4a and b) revealed that ⑦ led to a higher relative crystallinity and better framework retention. However, most Zr species incorporated in ⑦ existed as ZrO2 (see the peak at 230 nm in Fig. 4c UV-vis spectra), which was also proved by the significantly reduced ETB activity (Table 4). We speculated that TEA+ would prevent Zr from approaching silanol inside the framework due to its size being close to the pore size of β zeolite (0.67 nm), resulting in less framework Zr sites in ⑦. Therefore, OH− was also necessary, whose etching ability could offset the spatial blocking effect of TEA+. Moreover, the TG results (Fig. S7†) showed that the amount of TEA+ in ① increased after the addition of OH−, indicating that more TEA+ was needed as a template for reconstruction after etching. Meanwhile, the reassembled species of zirconium and silicon could also disperse and be uniformly distributed compared with free diffusion inside the framework. The above results demonstrated that IDRC underwent etching first and then reconstruction, which was favorable for the incorporation of framework metal sites. OH− was the core agent for the dissolution of the framework and the recombination of zirconium and silicon species.
F− was the mineralizer for crystallization. The role of F− was analyzed through comparative experiments ① and ⑧. In the latter, F− was not added. Also, ⑧ had lower relative crystallinity, a worse framework retention, and smaller micropore volume than ① (Fig. 4a and b, Table 4), suggesting that F− played an important role in the auxiliary crystallization. Moreover, ⑧ had ZrO2 species (see the peak at 230 nm in Fig. 4c UV-vis spectra) and low ETB activity (Table 4). In the process of etching–reconstruction, plenty of Zr in the gel would inhibit the rate of nucleation and crystallization. F−, as a mineralizer, can assist TEA+ to guide the process, thus incorporating a high content of framework Zr sites.
DeAl-β, acting as parent framework, was the key to rapid reconstruction in IDRC compared with in hydrothermal synthesis. We conducted comparative experiments ① and ⑨ to analyze the reason why IDRC broke the speed limitation of nucleation and crystallization due to the numbers of metals.29,41,51 The silicon source of ⑨ was TEOS instead of DeAl-β. The XRD patterns (Fig. 4a) established that ① could generate the desired catalyst, while ⑨ could not fully crystallize, elaborating that DeAl-β could promote the formation of the final framework. Comparing the FT-IR results of the two gels (Fig. 4d), we found that the gel of ① contained a large number of basic structural units favorable for the synthesis of β zeolite (see peaks at 524, 577, and 618 cm−1),44 while the gel of ⑨ did not have these. These fragments would greatly promote nucleation, which partially offset the effect of Zr ions with a large ionic radius inhibiting crystallization. Therefore, the introduction of DeAl-β could provide many basic structural units to facilitate nucleation.
In short, process control, functional agents TEA+, OH−, and F−, and the parent framework DeAl-β in IDRC are indispensable to incorporate a high content of metals into the framework. The process control makes it possible to ensure interaction between a few zirconium species and lots of silicon species, promoting more isolated framework Zr sites. TEA+ guarantees the framework integrity of Zr-β zeolite. OH− etches the zeolite to rearrange the zirconium and silicon species and distribute them more evenly, and provides alkaline conditions for crystallization. F− assists TEA+ to direct nucleation and crystallization. DeAl-β provides basic structural units for the *BEA topological structure, which promotes nucleation.
The XRD patterns (Fig. S8†) showed that the peak for the *BEA structure in gel (0 h) was weakened significantly, indicating that the dissolution of DeAl-β occurred during gel formation. The crystallization curve (Fig. 5a) displayed that the IDRC samples crossed the induction period fast and then entered the crystallization period, which was consistent with the phenomenon reported in the literature that crystal nuclei can shorten the induction period.52 The degree of crystallization gradually increased over time and reached the maximum at 6 h. The relative crystallinity remained unchanged later, in line with the TEM images (Fig. S9†). The results indicated that the crystallization of IDRC could be completed in 6 h.
 | ||
| Fig. 5 (a) Crystallization curve and (b) pore-formation time curves of IDRC25 crystallized for different times. | ||
Similarly, the formation of mesopores displayed the same trend as the crystallization curve (Fig. 5b). The micropore and mesopore volume gradually increased over time and reached the maximum at 6 h, after which the micropore volume remained unchanged while the mesopore volume began to decrease. The mesopore volume of the IDRC samples was up to 0.912 cm3 g−1 (6 h), more than three times that of LPI and DRC samples. The TEM image of the 0 h sample showed that the amorphous gel contained a large number of pores. Thus, the high mesopore volume of IDRC25 was likely related to the pores formed in the gel.
The process of metal incorporation was also studied. Most zirconium species in gel existed in the form of agglomeration, and the particles were gradually degraded after 2 h, as shown in TEM (Fig. S9†). UV-vis (Fig. 6) revealed the presence of two adsorption peaks assigned to framework Zr sites at 194 nm and extra-framework Zr species at 230–240 nm, which were separated at 2 h. The latter peak converted to the shoulder peak at 210 nm at 4 h, implying that the Zr agglomerations dissolved and transformed to framework Zr sites. Only the peak of the framework Zr sites could be observed from 6 h to 24 h. Subsequently, the shoulder peak at 210 nm began to appear again at 36 h, and even the peak of bulk ZrO2 at 230–240 nm could be found at 48 h, indicating the formation of ZrO2 after 36 h. The above phenomena elucidated that most Zr species existed in the form of agglomerations during early crystallization, then dissolved gradually at 2 h, and entered the framework to form Zr–O–Si bond from 6 h to 24 h. No ZrO2 was observed during the period. However, the dissolution and condensation of Zr species could occur if the crystallization continued, thus forming ZrO2 again. Therefore, from the perspective of metal incorporation, the optimal crystallization time was 6–24 h.
 | ||
| Fig. 6 UV-vis spectra of IDRC25 crystallized for different times. | ||
 | ||
| Scheme 3 Crystallization process of IDRC. | ||
3.4 Catalytic performance of ETB
IDRC25, DRC25, and LPI25 were applied to catalyze the ETB reaction. Table 6 manifested that IDRC25 possessed higher ethanol–acetaldehyde conversion (55.9%) compared to DRC25 (45.1%) and LPI25 (37.7%). The results corresponded to the conclusion that the more framework Zr sites, the higher the amount of strong Lewis acid and the better catalytic performance of ETB. The selectivity of butadiene and the distribution of the by-products of the three samples were similar, but there were still slight differences. The crotonaldehyde selectivities of IDRC25 and DRC25 were lower than that of LPI25, which was related to their higher amount of strong Lewis acid. The strength of Lewis acid required by MPV reduction was higher than that required by aldol condensation, so the activity of MPV reduction was greatly increased and thus unconverted crotonaldehyde decreased in IDRC25 and DRC25. In addition, IDRC25 showed a decrease of 3.4 percentage points in butadiene selectivity, similar to the increasing range in the selectivity of ethylene as a dehydrated product. This could be attributed to the improved Brønsted acid sites of IDRC25, which are required for ethanol dehydration. The difference in product distributions among the three catalysts corresponded to the change in acid amount.| Sample | Con. (%) | Sel. (%) | |||||||
|---|---|---|---|---|---|---|---|---|---|
| 1,3-Butadiene | Ethylene | Ether | Propylene | Butene | Ethyl acetate | Croton-aldehyde | Others | ||
| a Reaction conditions: 598 K, WHSV = 1.0 h−1, TOS = 6 h. | |||||||||
| IDRC25 | 55.9 | 66.0 | 8.4 | 1.5 | 2.5 | 4.4 | 3.5 | 3.1 | 10.7 |
| DRC25 | 45.1 | 69.4 | 4.0 | 0.9 | 2.4 | 3.7 | 3.3 | 3.9 | 12.5 |
| LPI25 | 37.7 | 68.9 | 3.3 | 0.9 | 1.8 | 2.3 | 4.5 | 6.4 | 11.9 |
Time on stream of 24 h and 100 h were selected to further investigate the stability and life of the catalysts. Fig. 7 shows that the conversion and selectivity of DRC25 and LPI25 decreased rapidly over time. Also, the conversion of DRC25 decreased more, while the selectivity of LPI25 decreased more. In contrast, IDRC25 possessed a slower decreasing trend, with a conversion of 42.8% and selectivity of 65.5% at 24 h. Subsequently, the decrease in conversion was further slowed down, while the selectivity remained unchanged. Finally, the conversion and selectivity remained at 28.4% and 62.6% at 100 h. Therefore, IDRC25 had a higher selective stability and longer catalytic life.
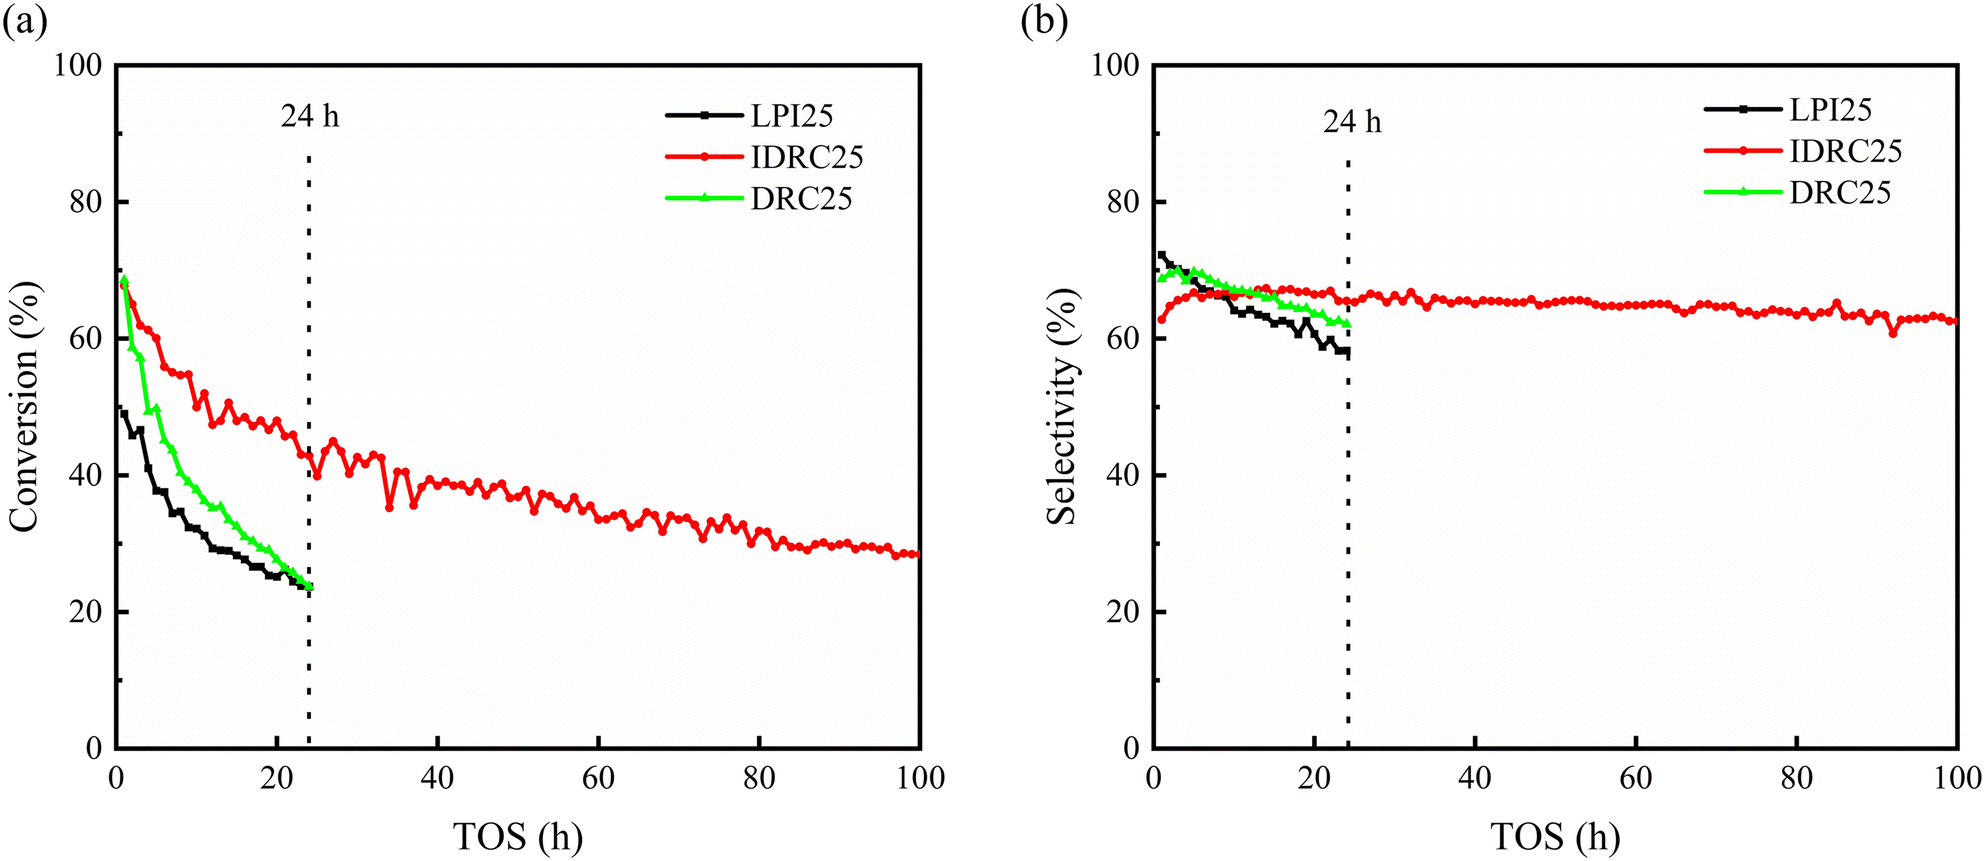 | ||
| Fig. 7 Long period (a) conversion and (b) selectivity diagrams of IDRC25, DRC25, and LPI25. Reaction conditions: 598 K, WHSV = 1.0 h−1, TOS = 1–24 or 100 h. | ||
The good stability of IDRC25 was analyzed and discussed. Previous studies by our group found that hierarchical zeolite was conducive to prolonging the catalytic life of Zr-β.27,40 The introduction of mesoporosity can enhance mass transfer, improve the diffusion of reactants and products, increase access to active sites, facilitate the removal of heavy products, and slow down carbon deposition, especially in the ETB processes involving products with a molecular size of 0.4–0.7 nm, such as ethyl acetate, crotonaldehyde, and 1,3-butadine. Therefore, the high mesoporosity of IDRC25 was one of key factors to improving its stability. Additionally, the carbon deposition was only 25.8% after 100 h, not much more compared with 13.1% after 6 h (Table S2†). That is, IDRC25 deposited carbon rapidly in the early stage, but this dramatically slowed later. Hence, the mesoporosity was an important reason for the slow deactivation.
3.5 Discussion about the framework metal sites and acidity
The Lewis acid sites of Zr-β mainly include silanol nests, framework Zr sites, and extra-framework Zr sites. Also, the sites in different chemical environments can show different intensities for the Lewis acidity. Besides, the change in acid amount is closely linked to the formation of Zr species. Five catalysts, namely DeAl-β, LPI100, DRC25, ZrO2/DeAl-β, and LPI25, were compared to discuss the relationship.DeAl-β contained a large number of hydroxyl nests but no Zr species. It had increasing weak and medium Lewis acid amounts (Table 3), inferring that hydroxyl nests formed after the removal of aluminum mainly exhibited weak and medium Lewis acidity.53
LPI100 contained 1.5 wt% Zr, mainly existing as framework Zr.27 DRC25 contained 2.2 wt% Zr, which was presumed to exist mainly as framework Zr species based on its high Lewis acid amount and enhanced activity. Herein, DeAl-β without Zr, LPI100, and DRC25 with mainly framework Zr species were compared. We concluded that a strong Lewis acid amount increased after framework Zr was incorporated. Also, the higher the framework Zr content, the higher the strong Lewis acid amount.
ZrO2/DeAl-β had only bulk ZrO2 species. The weak Lewis acid amount of ZrO2/DeAl-β increased significantly, while the medium Lewis acid amount decreased, indicating that ZrO2 mainly possessed weak Lewis acidity, which could damage hydroxyl nests.
LPI25 contained 5.5 wt% Zr. However, LPI25 had a similar strong acid amount and ETB activity with LPI100, suggesting that there was little difference in the framework Zr content between them. Thus, LPI25 must also contain a large number of extra-framework Zr species. However, bulk ZrO2 was not observed in LPI25 according to the above characterization results. It was reported in the literature that the Lewis acid properties of extra-framework metal sites depend on the cluster sizes.54 The larger the cluster size, the weaker the Lewis acidity. Combined with the more medium Lewis acid amount of LPI25 than LPI100, we speculated that these extra-framework Zr species existed mainly as nano ZrO2 species. That is, bulk ZrO2, nano ZrO2, and framework Zr species exhibited weak, medium, and strong Lewis acidity, respectively.
There were close relationships among the framework Zr contents, strong Lewis acid amount, and ETB activity. Also, the 1,3-butadiene space time yield was found to increase with the increase in strong Lewis acid amount, as shown in Fig. 8. The above analysis provides important support for the conclusion that IDRC can improve the incorporation of a high content of framework Zr.
 | ||
| Fig. 8 Relationships between the strong Lewis acid amount and space time yield of Zr-β. Reaction conditions: 598 K, WHSV = 1.0 h−1, TOS = 6 h. | ||
4. Conclusions
An improved dissolution–reconstruction synthesis strategy, IDRC, was used to prepare Zr-β zeolite with a high Zr content of 5.0 wt%, mainly as four-coordinated framework Zr sites. Additionally, IDRC had better performance in the introduction of high mesoporosity. The increase in content of framework Zr could also significantly increase the amount of strong Lewis acid and thus improve the catalytic activity for ETB. Therefore, the conversion of the IDRC sample increased to 55.9%. Moreover, the high mesoporosity of the IDRC sample could greatly improve the stability and prolong the catalytic life.The ability of IDRC to incorporate a high content of framework Zr sites was due to the synergistic effect of TEA+, OH−, and F− as functional agents and DeAl-β as the parent framework as well as process control. OH− etched DeAl-β to provide crystal nuclei and silicon sources during gel formation. Most Zr species existed as agglomerations in the meantime. Subsequently, the Zr species gradually dissolved and rearranged with lots of silicon species under the guidance of TEA+ and the assistance of F−. The crystallization reached the maximum at 6 h, due to the existence of the crystal nuclei, forming the Zr-β zeolite with a high content of isolated framework Zr sites.
Conflicts of interest
There are no conflicts to declare.Acknowledgements
The author thanks the support from National Natural Science Foundation of China (No. 21978211), Natural Science Foundation of Tianjin (No. 21JCZDJC00520), Natural Science Foundation of Ningbo (No. 2021J008), and Tianjin University (2021XT-0008).References
- A. Corma, L. T. Nemeth, M. Renz and S. Valencia, Nature, 2001, 412, 423–425 CrossRef CAS.
- H. Hattori and Y. One, Solid acid catalysis: from fundamentals to applications, CRC Press, Florida, 2015 Search PubMed.
- J. C. Vega-Vila, J. W. Harris and R. Gounder, J. Catal., 2016, 344, 108–120 CrossRef CAS.
- Y. Wang, J. D. Lewis and Y. Roman-Leshkov, ACS Catal., 2016, 6, 2739–2744 CrossRef CAS.
- P. Müller, S. P. Burt, A. M. Love, W. P. McDermott, P. Wolf and I. Hermans, ACS Catal., 2016, 6, 6823–6832 CrossRef.
- T. Elli, L. Hongfei, F. Wei, V. Vivek and Y. Lisha, J. Catal., 2016, 333, 207–216 CrossRef.
- S. V. D. Vyver and Y. Román-Leshkov, Am. Ethnol., 2015, 54, 12554–12561 Search PubMed.
- J. S. Bates and G. Rajamani, J. Catal., 2018, 365, 213–226 CrossRef CAS.
- J. S. Bates, B. C. Bukowski, J. W. Harris, J. Greeley and R. Gounder, ACS Catal., 2019, 9, 6146–6168 CrossRef CAS.
- V. L. Sushkevich, I. I. Ivanova, V. V. Ordomsky and E. Taarning, ChemSusChem, 2014, 7, 2527–2536 CrossRef CAS.
- V. L. Sushkevich and I. I. Ivanova, Appl. Catal., B, 2017, 215, 36–49 CrossRef CAS.
- A. Corma, M. E. Domine, L. Nemeth and S. Valencia, J. Am. Chem. Soc., 2002, 124, 3194–3195 CrossRef CAS.
- Y. Zhu, G. Chuah and S. Jaenicke, J. Catal., 2004, 227, 1–10 CrossRef CAS.
- A. Ramanathan, M. C. R. Ca Strovillalobos, C. Kwakernaak, S. Telalovic and U. Hanefeld, Chem. – Eur. J., 2010, 14, 961–972 CrossRef PubMed.
- S. Conrad, P. Wolf, P. Müller, H. Orsted and I. Hermans, ChemCatChem, 2017, 9, 175–182 CrossRef CAS.
- Z. Zhu, H. Xu, J. Jiang and P. Wu, J. Phys. Chem. C, 2016, 120, 23613–23624 CrossRef CAS.
- D. T. Bregante, P. Priyadarshini and D. W. Flaherty, J. Catal., 2017, 348, 75–89 CrossRef CAS.
- D. T. Bregante and D. W. Flaherty, J. Am. Chem. Soc., 2017, 139, 6888–6898 CrossRef CAS PubMed.
- D. T. Bregante, N. E. Thornburg, J. M. Notestein and D. W. Flaherty, ACS Catal., 2018, 8, 2995–3010 CrossRef CAS.
- D. T. Bregante, A. M. Johnson, A. Y. Patel, E. Z. Ayla, M. J. Cordon, B. C. Bukowski, J. Greeley, R. Gounder and D. W. Flaherty, J. Am. Chem. Soc., 2019, 141, 7302–7319 CrossRef CAS PubMed.
- V. L. Sushkevich, I. I. Ivanova and E. Taarning, Green Chem., 2015, 17, 2552–2559 RSC.
- D. Palagin, V. L. Sushkevich and I. I. Ivanova, J. Phys. Chem. C, 2016, 120, 23566–23575 CrossRef CAS.
- Z. Han, X. Li, M. Zhang, Z. Liu and M. Gao, RSC Adv., 2015, 5, 103982–103988 RSC.
- X. Q. Li, J. F. Pang, C. Wang, L. Li, X. L. Pan, M. Y. Zheng and T. Zhang, Green Chem., 2020, 22, 2852–2861 RSC.
- J. L. Cheong, Y. L. Shao, S. J. R. Tan, X. K. Li, Y. G. Zhang and S. S. Lee, ACS Sustainable Chem. Eng., 2016, 4, 4887–4894 CrossRef CAS.
- G. Yang, L. Wang and H. Jiang, React. Chem. Eng., 2020, 5, 1833–1844 RSC.
- G. Yang, L. Wang and H. Jiang, Microporous Mesoporous Mater., 2021, 316, 110949 CrossRef CAS.
- A. Chieregato, J. Velasquezochoa, C. Bandinelli, G. Fornasari, F. Cavani and M. Mella, ChemSusChem, 2015, 8, 377–388 CrossRef CAS PubMed.
- Z. Zhu, H. Xu, J. Jiang, Y. Guan and P. Wu, J. Catal., 2017, 352, 1–12 CrossRef CAS.
- L. Schreyeck, P. Caullet, J. C. Mougenel, J. L. Guth and B. Marler, J. Chem. Soc., Chem. Commun., 1995, 2187–2188 RSC.
- C. Bian, C. Zhang, S. Pan, F. Chen, W. Zhang, X. Meng, S. Maurer, D. Dai, A.-N. Parvulescu, U. Müller and F.-S. Xiao, J. Mater. Chem. A, 2017, 5, 2613–2618 RSC.
- Z. Zhu, H. Ma, M. Li, T. Su and H. Lu, Appl. Catal., A, 2019, 590, 117370 CrossRef.
- M. W. Anderson and J. Klinowski, Zeolites, 1986, 6, 455–466 CrossRef CAS.
- M. W. Anderson and J. Klinowski, J. Chem. Soc., Faraday Trans., 1986, 82, 1449–1469 RSC.
- G. Bellussi and V. Fattore, Stud. Surf. Sci. Catal., 1991, 69, 79–92 CrossRef CAS.
- B. Notari, Stud. Surf. Sci. Catal., 1991, 60, 343–352 CrossRef.
- Y. Zuo, L. Q. Yang, X. Jiang, M. T. Ma, Y. L. Wang, M. Liu, C. N. Song and X. N. Guo, ChemCatChem, 2020, 12, 6196–6204 CrossRef CAS.
- C. A. Emeis, J. Catal., 1993, 141, 347–354 CrossRef CAS.
- H. J. Chae, T. W. Kim, Y. K. Moon, H. K. Kim, K. E. Jeong, C. U. Kim and S. Y. Jeong, Appl. Catal., B, 2014, 150, 596–604 CrossRef.
- M. Zhang, Y. Qin, H. Jiang and L. Wang, Microporous Mesoporous Mater., 2021, 326, 111359 CrossRef CAS.
- Z. Kang, X. Zhang, H. Liu, J. Qiu and K. L. Yeung, Chem. Eng. J., 2013, 218, 425–432 CrossRef CAS.
- T. Iida, A. Takagaki, S. Kohara, T. Okubo and T. Wakihara, ChemNanoMat, 2015, 1, 155–158 CrossRef CAS.
- B. Tang, W. Dai, G. Wu, N. Guan, L. Li and M. Hunger, ACS Catal., 2014, 4, 2801–2810 CrossRef CAS.
- J. M. Newsam, M. Treacy, W. T. Koetsier and C. Gruyter, Proc. - R. Soc. Edinburgh, Sect. A: Math., 1988, 420, 375–405 CAS.
- W. Jie, K. Okumura, S. Jaenicke and G. K. Chuah, Appl. Catal., A, 2015, 493, 112–120 CrossRef.
- M. S. Morey, G. D. Stucky, S. Schwarz and M. Fröba, J. Phys. Chem. B, 1999, 103, 2037–2041 CrossRef CAS.
- B. Tang, W. Dai, X. Sun, G. Wu, N. Guan, M. Hunger and L. Li, Green Chem., 2015, 17, 1744–1755 RSC.
- D. W. Flaherty, Catal. Sci. Technol., 2020, 10, 635–647 RSC.
- Z. C. Shan, Z. D. Lu, L. Wang, C. Zhou, L. M. Ren, L. Zhang, X. J. Meng, S. J. Ma and F. S. Xiao, ChemCatChem, 2010, 2, 407–412 CrossRef CAS.
- M. A. Camblor, A. Corma and S. Valencia, J. Mater. Chem., 1998, 8, 2137–2145 RSC.
- S. Tolborg, A. Katerinopoulou, D. D. Falcone, I. Sádaba, C. M. Osmundsen, R. J. Davis, E. Taarning, P. Fristrup and M. S. Holm, J. Mater. Chem. A, 2014, 2, 20252–20262 RSC.
- B. Zheng, Y. Wan, W. Yang, F. Ling, H. Xie, X. Fang and H. Guo, Chin. J. Catal., 2014, 35, 1800–1810 CrossRef CAS.
- F. Yi, Y. Chen, Z. Tao, C. Hu, X. Yi, A. Zheng, X. Wen, Y. Yun, Y. Yang and Y. Li, J. Catal., 2019, 380, 204–214 CrossRef CAS.
- W. Dai, Q. Lei, G. Wu, N. Guan, M. Hunger and L. Li, ACS Catal., 2020, 10, 14135–14146 CrossRef CAS.
Footnote |
| † Electronic supplementary information (ESI) available. See DOI: https://doi.org/10.1039/d2cy01841a |
| This journal is © The Royal Society of Chemistry 2023 |