
Controlled site coverage of strong metal–support interaction (SMSI) on Pd NP catalysts†
Christian J.
Breckner
 a,
Kuixin
Zhu
b,
Mingrui
Wang
c,
Guanghui
Zhang
c,
Christina W.
Li
b and
Jeffrey T.
Miller
*a
a,
Kuixin
Zhu
b,
Mingrui
Wang
c,
Guanghui
Zhang
c,
Christina W.
Li
b and
Jeffrey T.
Miller
*a
aDavidson School of Chemical Engineering, Purdue University, West Lafayette, IN 47907, USA. E-mail: mill1194@purdue.edu
bDepartment of Chemistry, Purdue University, West Lafayette, Indiana 47907, USA. E-mail: christinawli@purdue.edu
cState Key Laboratory of Fine Chemicals, Frontier Science Center for Smart Materials, PSU-DUT Joint Center for Energy Research, School of Chemical Engineering, Dalian University of Technology, Dalian, Liaoning 116024, China. E-mail: gzhang@dlut.edu.cn
First published on 18th November 2022
Abstract
Strong metal–support interaction catalysts have been shown to improve desired product selectivity at the cost of fractional rates due to active site coverage. The goal of this study was to determine if the active site coverage of metallic nanoparticles could be controlled to lower levels than have been previously reported in SMSI catalysts with the aim of improving the rate while maintaining high selectivity. 2Pd–XTi/SiO2 (2 wt% Pd, X wt% Ti) strong metal–support interaction (SMSI) catalysts with Ti loadings between 0–1.0 wt% were synthesized to control Pd nanoparticle coverage. Calcination at 450 °C and reduction at 550 °C were sufficient for forming ∼2 nm sized Pd particles in all catalysts. Increasing the Ti loading from 0.1 to 1.0 wt% increased the surface coverage from 40 to 85% at a fixed reduction temperature of 550 °C. The IR spectra of the SMSI catalysts were similar with a high fraction of linear bonded CO which was much higher than that of Pd nanoparticles of similar size. The SMSI overlayer could be removed by oxidation at 350 °C and re-reduction at 200 °C. EXAFS of the oxidized catalysts indicates that nearly full oxidation of the metallic nanoparticle was required to remove the SMSI overlayer. Oxidation temperatures from 30 to 300 °C partially oxidized the Pd nanoparticles and subsequent re-reduction at 200 °C partially decreases the SMSI coverage. The fractional surface coverage was determined by measuring the rate of propylene hydrogenation with and without the SMSI overlayer. Increasing the reduction temperature from 200 to 550 °C increased the SMSI coverage from 0 to 85% depending on the Ti loading and temperature. After reduction at 550 °C and oxidation at 350 °C, the range of coverages varied between ∼10% with 0.1 wt% Ti after re-reduction at 300 °C and ∼85% with 1 wt% Ti after reduction at 550 °C.
1. Introduction
Since the original report of strong metal–support interaction (SMSI) by Tauster, et al. where a 2 wt% Pd/TiO2 catalyst initially reduced at 175 °C experienced a significant drop in CO uptake when further reduced at 500 °C,1 there has been continued interest in utilizing this phenomenon for improving catalyst performance. SMSI has been shown to improve product selectivity, catalyst lifetime, and process performance in reactions such as propane dehydrogenation,2 olefin and acetylene hydrogenation,3–5 Fischer–Tropsch synthesis,6 the water gas shift reaction,7 and in electrocatalysis.8 Dulub and coworkers used electron microscopy on a Pt/TiO2 catalyst to better understand why SMSI occurs. It was observed that the TiO2 support, after surface species mobilization and partial reduction,9 covered metal nanoparticles resulting in less active sites available for catalysis.10 Further work by Tauster, et al. found that this coverage could be reversed under high temperature oxidation.1 Related work found that the same process can occur on Pt/CeO2 catalysts as well indicating that this effect is not strictly limited to TiO2 supports.11 Further studies on transition metal oxide supports revealed that SMSI can occur on most reducible metal oxide supports such as TiO2,9 CeO2,11,12 Fe3O4,13,14 La2O3, Nb2O5,15 MnO2,16 and even partially modified supports such as tantalum-doped TiO2.8 SMSI has also been observed on non-reducible metal oxide supports such as ZnO,17,18 non-metal supports such as hydroxyapatite19,20 and boron nitride.21 The metal nanoparticles that facilitate SMSI are as varied as the supports that induce them: Pd,1 Pt,10,11 Ag,22 Au,19 Ni, Fe,21 Rh,6,23 and Co,24 among others. Many early studies have concluded that the covered nanoparticles experience an electronic interaction with the encapsulating SMSI oxides.1,6,25–27 Recent studies, however, suggest that SMSI is primarily a physical interaction where the uncovered active sites do not experience an electronic interaction with the nearby SMSI oxide species.2,28–30 It is likely that this misunderstanding of strong electronic interactions arose due to reactive metal–support interactions (RMSI), a process in which the encapsulating SMSI oxide becomes fully reduced to form an alloyed nanoparticle which experiences electronic interactions.31While studies on SMSI oxide supports were useful in understanding the encapsulation process, they have been shown to display low activity, particularly at reaction temperatures of 500 °C and above as the metal active sites become covered to near completion. Addition of low loadings of SMSI oxides to catalysts on inert supports, e.g. Pt–Ti/SiO2, also display lower chemisorption and catalytic activity at these high reaction temperatures.2,4,15 Previous studies have typically used SMSI oxide loadings of greater than 1 wt%. While these have improved rates compared to nanoparticles on SMSI supports and retained the benefits of increased selectivity, improved catalyst lifetime, and reduced leaching rates in liquid systems,2,24 the rates remain relatively low compared to catalysts without SMSI oxides. Other methods, such as atomic layer deposition (ALD) of metal oxides onto supported metal nanoparticles, have the same effect seen for SMSI catalysts.24,29,32 For both SMSI and ALD catalysts the loss of nanoparticle surface coverage is typically greater than 70%. Lower surface coverage may give desirable modifications to catalytic performance but at higher rate. Currently, however, there are no methods to control the SMSI surface coverage levels below 70%.
In the present work, the goal was to determine if the active site coverage of metallic nanoparticles could be controlled to lower levels than have been previously reported in SMSI catalysts with the aim of improving the rate while maintaining high selectivity. Several methods are given to control the TiO(2−x) SMSI coverage of Pd nanoparticles from 10 to 80%. CO chemisorption, propylene hydrogenation rates, CO IR spectroscopy, STEM, and in situ X-ray absorption spectroscopy (XAS) are combined to show that the catalytic surface of ∼2 nm sized Pd particles in 2Pd–XTi/SiO2 SMSI catalysts (2 wt% Pd, X wt% Ti, SiO2 support) can be partially covered by SMSI oxides in a controllable manner. A method to determine the fractional Pd surface coverage is also provided.
2. Materials and methods
2.1 Materials
Davisil 636 silica (99%), titanium(IV) bis(ammonium lactato)dihydroxide (50% solution), and tetraamminepalladium(II) nitrate (10% solution) were purchased from Sigma-Aldrich. All gases used for catalytic testing were purchased from Indiana Oxygen Company. 3% C3H6 and 5% H2 were both balanced with N2. The gases for XAS experiments were 3% H2 balanced in He, pure He, and 10% O2 balanced in He. All gases for XAS were purchased from AirGas, Illinois.2.2 Catalyst preparation
The control, non-SMSI 2Pd/SiO2 catalyst (0 wt% Ti, 2 wt% Pd) was synthesized using pH adjusted incipient wetness impregnation (IWI) on Davisil 636 silica (pore size = 60 Å, surface area = 480 m2 g−1). Ammonium hydroxide was added dropwise to a 10 wt% Pd(NH3)4(NO3)2 solution diluted in deionized water until the pH was 11. This solution was added dropwise to Davisil 636 silica. The catalyst was dried overnight at 125 °C, split into thirds, and calcined at 450/600/700 °C for 3 hours each. The three catalysts were reduced in 5% H2/N2 (∼100 mL min−1) at 200 °C for 30 minutes and 250 °C for 30 minutes.2Pd–XTi/SiO2 (X% Ti and 2% Pd) were synthesized using sequential incipient wetness impregnation (IWI). Varied amounts of titanium(IV) bis(ammonium lactate)dihydroxide (50% solution) corresponding to 0.1/0.5/1.0 wt% Ti were diluted in deionized water and added dropwise to Davisil 636 silica. The XTi/SiO2 catalyst precursors were dried overnight at 125 °C and calcined at 300 °C for 3 hours. A second solution containing 10 wt% tetraamminepalladium(II) nitrate solution diluted in deionized water was pH adjusted to 11 using ammonium hydroxide. This solution was added dropwise to the XTi/SiO2 catalyst precursors to achieve a loading of 2 wt% Pd. The 2Pd–XTi/SiO2 catalysts were dried overnight at 125 °C, split into thirds, and calcined at 450/600/700 °C for 3 hours each. The resulting 12 2Pd–XTi/SiO2 catalysts were sequentially reduced in 5% H2/N2 (∼100 mL min−1) at 200 °C for 30 minutes and 250 °C for 30 minutes. SMSI was induced on the 2Pd–XTi/SiO2 catalysts prior to analysis using a pre-treatment reduction temperature of 550 °C to initially stabilize particle sizes. The SMSI overlayer was removed using oxidation at 350 °C for 30 minutes. Analysis of the non-SMSI state was possible using a re-reduction temperature of 200 °C which did not induce SMSI coverage.
2.3 CO chemisorption
CO chemisorption was performed on a Micromeritics ASAP 2020 chemisorption instrument using a volumetric chemisorption analysis to determine relative particle sizes. A U-shaped quartz tube was filled with approximately 0.1 g of catalyst. The samples for the 2Pd/SiO2 (0 wt% Ti) catalysts were reduced in 5% H2/He at temperatures ranging from 250–550 °C for 30 minutes prior to analysis at 30 °C. The 0.1–1.0 wt% Ti containing catalyst samples were reduced in 5% H2/He at 250 °C for 30 minutes. The 250 °C pre-treatment was used to determine if the SMSI catalysts had the same changes to relative particle size as the 2Pd/SiO2 (0 wt% Ti) catalyst when increasing the calcination temperature. CO uptakes were estimated by taking the difference between the physisorption plus chemisorption and the physisorption only uptakes at different pressures. A linear regression of these points was used to estimate the uptake at zero pressure in mmol CO per g metal. The sample loading and Pd wt% were used to convert to mol CO per mol metal. Pd nanoparticles can bind CO in a linear, bridging, or three-fold manner depending on the nanoparticle size. Larger Pd nanoparticles (>4 nm) have predominately bridge bonding and three-fold bonding while small nanoparticles (<4 nm) have a mixture of linear, bridge, and three-fold bonding. Higher reduction temperatures result in larger particle sizes and more face sites which cause the bonding factor to increase. This changing bonding factor makes it difficult to estimate particle sizes directly using only CO chemisorption.2.4 Propylene hydrogenation catalytic performance tests
Propylene hydrogenation TORs at 30 °C were used to compare the performance of the catalysts. Rate measurements of the non-SMSI state were used in conjunction with Pd EXAFS dispersion estimates to calculate the TORs of all catalysts. The 2Pd/SiO2 (0 wt% Ti) catalyst was reduced at 250–550 °C then the rate was measured at 30 °C. For the 0.1–1.0 wt% Ti containing catalysts, to determine the rate with different coverages of SMSI, the catalysts were reduced at 550 °C, oxidized at 350 °C, then re-reduced at 200–550 °C. All catalytic tests were performed in a 12.7 mm ID quartz tube fixed bed reactor with a K-type thermocouple placed in the center of the bed to monitor the reaction temperature. A furnace connected to a temperature controller was used to manually adjust the bed temperature. Approximately 10 mg of catalyst was loaded into the reactor and was diluted to 1 g using SiO2. The reactions were performed in 2.0% H2 and 1.8% C3H6 balanced with N2 at 30 °C. The products were analyzed using a Hewlett Packard 6890 GC with a flame ionization detector (FID). Peaks were integrated and compared to a bypass run of the mixed gases to determine conversion and catalytic rate. The catalytic rate was calculated using the conversion and initial propylene flow rate to obtain mol C3H8 gcat−1 s−1. The catalyst loading and Pd wt% were used to transform this to mol C3H8 molmetal−1 s−1. The TOR was calculated by dividing the catalytic rate in mol C3H8 molmetal−1 s−1 by the dispersion from EXAFS. Each measurement was conducted at four flowrates that were averaged with five injections each. The rates at each flow rate were then averaged to obtain the final catalytic rates that are included in this report. SMSI coverage was calculated using the ratio of the catalytic rate when re-reduced at 300–550 °C (SMSI) and re-reduced at 200 °C (non-SMSI).2.5 CO infrared spectroscopy
CO infrared spectroscopy was performed on a Thermo Nicolet iS50 instrument with a mercury cadmium telluride (MCT) detector to determine the binding modes of the control and SMSI catalysts. Each spectrum was recorded by collecting 32 scans from 4000 to 650 cm−1 at a resolution of 8 cm−1. Spectra were collected until equilibrium had been achieved. This was done by scanning until there were no changes in spectra over time. The 0.1–1.0 wt% Ti containing catalysts were reduced in pure H2 at 550 °C prior to analysis at 30 °C in pure CO. Ar was used to purge samples at 350 °C between gas treatments (pure Ar, 30 mL min−1). Peaks were assigned for all catalysts as follows: atop bonding (2083 cm−1), bridge bonding (1920–1950 cm−1), and three-fold bonding (1840 cm−1) which is consistent with past studies.30,332.6 In situ X-ray absorption spectroscopy (XAS)
In situ XAS measurements were conducted at the 10-BM-B beamline at the Advanced Photon Source (APS) of Argonne National Lab at the Pd K edge (24.350 keV) to determine the Pd coordination environment and estimate particle sizes. The first set of measurements were conducting using catalysts that were pre-reduced from 250–550 °C. These catalysts were re-reduced at 200 °C for 30 minutes prior to scanning at room temperature in He. A second set of measurements were used to determine if particle sizes change after an initial reduction of 550 °C, 350 °C oxidation and 200 °C re-reduction as well as how much Pd in the sample becomes oxidized after each stage of oxidation. The catalysts were scanned at room temperature after each of the following steps: reduced at 550 °C, oxidized at 30 °C, oxidized at 200/300/350 °C, and re-reduced at 200 °C. All scans were conducted at room temperature. For this set, the reduced catalyst scans were taken under flowing 5% H2/He and the oxidized samples were scanned under flowing He. All samples were ground into a fine powder, pressed into a 6-shooter sample holder, and sealed in a sample cell with Kapton end caps. A gas purifier was connected to the He tank used for analysis to reduce the possibility of O2 exposure upon cell cooling. Samples were analyzed with flowing He or flowing H2. Measurements had a Pd foil and a third ion chamber that were used for energy calibrations. XAS data was fit using WinXAS 3.1. Least-squares regression fits of the k2-weighted Fourier transform data from 2.5 to 11.5 Å−1 in k-space were used to obtain the extended X-ray absorption fine structure (EXAFS) coordination parameters. The first shell was used to fit all spectra. All samples were fit using experimental phases and amplitudes as well as theoretical scattering paths using FEFF. An So2 value of 0.79 at a fixed coordination number of 12 for the Pd foil was used for all samples. All samples were then analyzed using theoretical scattering paths at controlled values of σ2 for direct comparison.2.7 Scanning transmission electron microscopy (STEM)
Samples for scanning transmission electron microscopy (STEM) were prepared by drop-drying 3 μL of a 1 mg mL−1 supported catalyst suspension onto a Cu grid. High-angle annular dark-field scanning transmission electron microscopy (HAADF-STEM) were obtained on an FEI Talos F200X S/TEM with a 200 kV X-FEG field-emission source. 100 particles were imaged and the corresponding average particle size and particle size distribution were determined.3. Results
3.1 Catalyst synthesis
The 2Pd/SiO2 (0 wt% Ti) catalysts were prepared by addition of Pd to SiO2. At a pH of 11, the SiO2 surface hydroxyls are deprotonated using NH4OH. Addition of metal cations such as Pd(NH3)42+ leads to a strong coulombic attraction and uniform surface coverage.34 Calcination at moderate temperature leads to the formation of small metallic nanoparticles.35 2Pd–XTi/SiO2 where X is the Ti wt% were prepared by addition of Ti to SiO2 followed by Pd. All catalysts had 2 wt% Pd. The Ti was added via incipient wetness impregnation (IWI) of titanium(IV) bis(ammonium lactate)dihydroxide. The SMSI precursors were dried and calcined at 300 °C to remove the organic ligands. Pd was then added to all catalysts using IWI of tetraamminepalladium(II) nitrate. The catalysts were calcined at 450/600/700 °C and reduced at 250 °C.3.2 Pd nanoparticle size effects and evidence for SMSI
Pd CO chemisorption uptakes at 30 °C were used to determine relative changes in particle size with increasing calcination temperature. Propylene hydrogenation rates were also tested as a second method to support these results. The catalysts were tested after calcination at 450, 600, or 700 °C followed by reduction at 200 °C (Table 1). This low temperature reduction is necessary to avoid SMSI coverage which also reduces the CO uptake and propylene hydrogenation rate. All catalysts have similar CO uptakes and catalytic rates at a given calcination temperature indicating that TiO2 had little effect on the Pd nanoparticle size. The CO uptakes were 0.32–0.39 with 450 °C calcination, 0.12–0.15 with 600 °C calcination, and 0.06–0.08 mol CO per mol Pd with 700 °C calcination. The propylene hydrogenation catalytic rates follow a similar trend where increasing calcination temperature resulted in a drop in catalytic rate from 4.5–5.7 with 450 °C calcination, 2.5–4.2 with 600 °C calcination, and 1.2–1.7 mol C3H8 molmetal−1 s−1 with 700 °C calcination. Similar CO uptakes and rates for the Ti containing catalyst indicate that the Pd nanoparticle sizes increased similarly as calcination temperature was increased. Calcination at 450 °C gave the highest CO chemisorption and hydrogenation rates; therefore, this calcination temperature was used to synthesize the smallest Pd nanoparticle sizes in all catalysts.
| Calcination temperature (°C) | Ti loading (wt%) | CO uptake (mol CO per mol Pd) | Catalytic rate (mol C3H8 molmetal−1 s−1) |
|---|---|---|---|
| 450 | 0 | 0.32 | 5.7 |
| 0.1 | 0.39 | 5.1 | |
| 0.5 | 0.35 | 4.5 | |
| 1.0 | 0.33 | 4.6 | |
| 600 | 0 | 0.15 | 3.5 |
| 0.1 | 0.12 | 4.2 | |
| 0.5 | 0.15 | 3.8 | |
| 1.0 | 0.12 | 2.5 | |
| 700 | 0 | 0.07 | 1.7 |
| 0.1 | 0.08 | 1.3 | |
| 0.5 | 0.08 | 1.7 | |
| 1.0 | 0.06 | 1.2 |
![[thin space (1/6-em)]](https://www.rsc.org/images/entities/char_2009.gif) :Pd ratio changes with Pd nanoparticle size, the particle size cannot be directly measured using chemisorption.38 A more reliable method is needed that can also be used in the presence of SMSI. Thus, the effect of reduction temperature on particle size was tested using EXAFS of the Pd K edge to estimate Pd nanoparticle sizes from Pd–Pd first shell coordination.39
:Pd ratio changes with Pd nanoparticle size, the particle size cannot be directly measured using chemisorption.38 A more reliable method is needed that can also be used in the presence of SMSI. Thus, the effect of reduction temperature on particle size was tested using EXAFS of the Pd K edge to estimate Pd nanoparticle sizes from Pd–Pd first shell coordination.39
| Ti loading (wt%) | Reduction temperature (°C) | CO uptake (mol CO per mol Pd) | Catalytic rate (mol C3H8 molmetal−1 s−1) |
|---|---|---|---|
| 0 | 250 | 0.32 | 5.7 |
| 400 | 0.25 | 5.5 | |
| 500 | 0.12 | 3.2 | |
| 550 | 0.12 | 2.6 |
In previous studies the Pt and Au NPs, M–M coordination number was shown to correlate with the nanoparticle size.39 Thus, Pd K edge X-ray absorption fine structure (EXAFS) was used to determine the Pd–Pd coordination and the effect of increasing reduction temperature on particle size. Spectra were collected after reduction temperatures of 250/400/500/550 °C (Fig. 1 and S1–S3†). Coverage of the Pd nanoparticle surface by the SMSI oxide will not affect the estimated particle sizes.
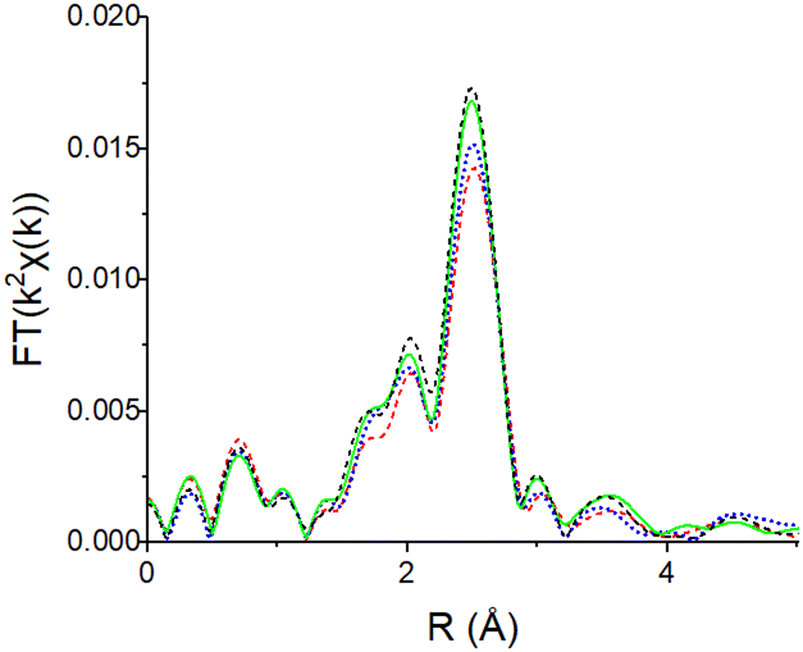 | ||
| Fig. 1 Pd K edge EXAFS spectra for the 2Pd/SiO2 (0 wt% Ti) catalyst reduced at 250 (red, dash), 400 (blue, dot), 500 (green, solid), 550 (black, dash); spectra for Ti containing catalysts were similar (Fig. S1–S3†). | ||
There are 3 main peaks between 1.5 and 3.0 Å in R space of the k2-weighted magnitude of the Fourier transforms which is typical for scattering of Pd nanoparticles40,41 (Fig. 1). A Pd–Pd scattering path with a bulk bond distance of 2.75 Å was used to fit all samples. The phase and amplitude of the Pd foil (supported by theoretical scattering paths using FEFF) were used to determine the EXAFS fitting parameters (Table S1†). The bond distances were all 0.01–0.03 Å smaller than the bulk Pd bond distance of 2.75 Å. This is typical of small metal nanoparticles which experience bond contraction due to a high fraction of low coordination surface atoms.42 The Pd nanoparticle size increased with increasing reduction temperature for all catalysts (Fig. 2, Table S1†). The particle sizes were 1.0–1.5 nm when reduced at 250 °C and grew to ∼2 nm when reduced at 550 °C. When reduced at 700 °C, the sizes were all similar regardless of Ti loading and were about 4 nm. Since SMSI Pd surface coverage will be determined after reduction at 550 °C, all catalysts were pre-reduced at 550 °C in order that the size would not change after SMSI treatments.
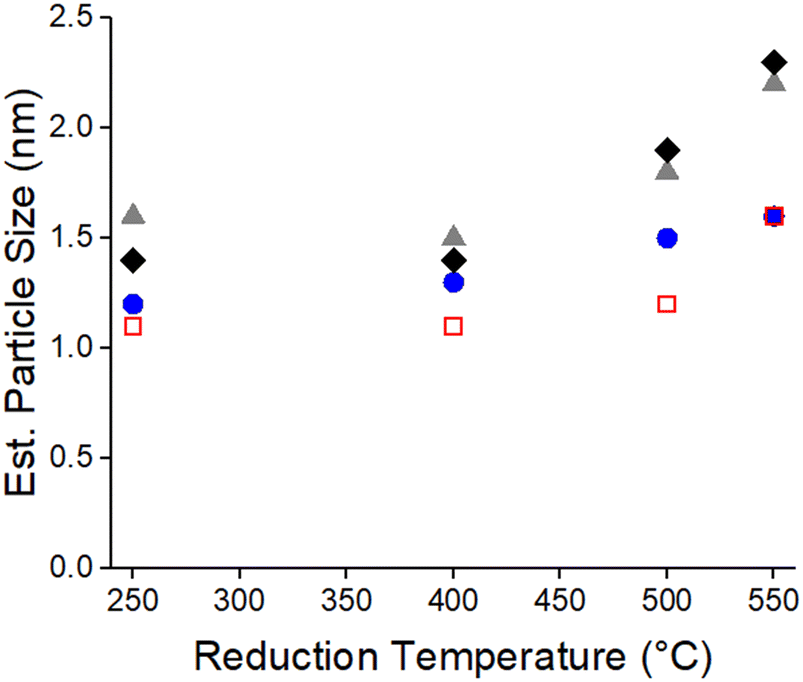 | ||
| Fig. 2 EXAFS particle sizes of 0 wt% Ti (blue, circle), 0.1 wt% Ti (red, square), 0.5 wt% Ti (grey, triangle), and 1.0 wt% Ti (black, diamond) containing catalysts calcined at 450 °C. | ||
To confirm the Pd nanoparticle size, STEM images were obtained on the catalysts after reduction at 550 °C. A typical STEM image and particle size distribution are shown for 2Pd–0.5Ti/SiO2 (Fig. 3). The average Pd nanoparticle size for each catalyst is given in Table 3 along with the sizes estimated by EXAFS. The STEM images and size distributions for the other catalysts are shown in Fig. S4–S6.†
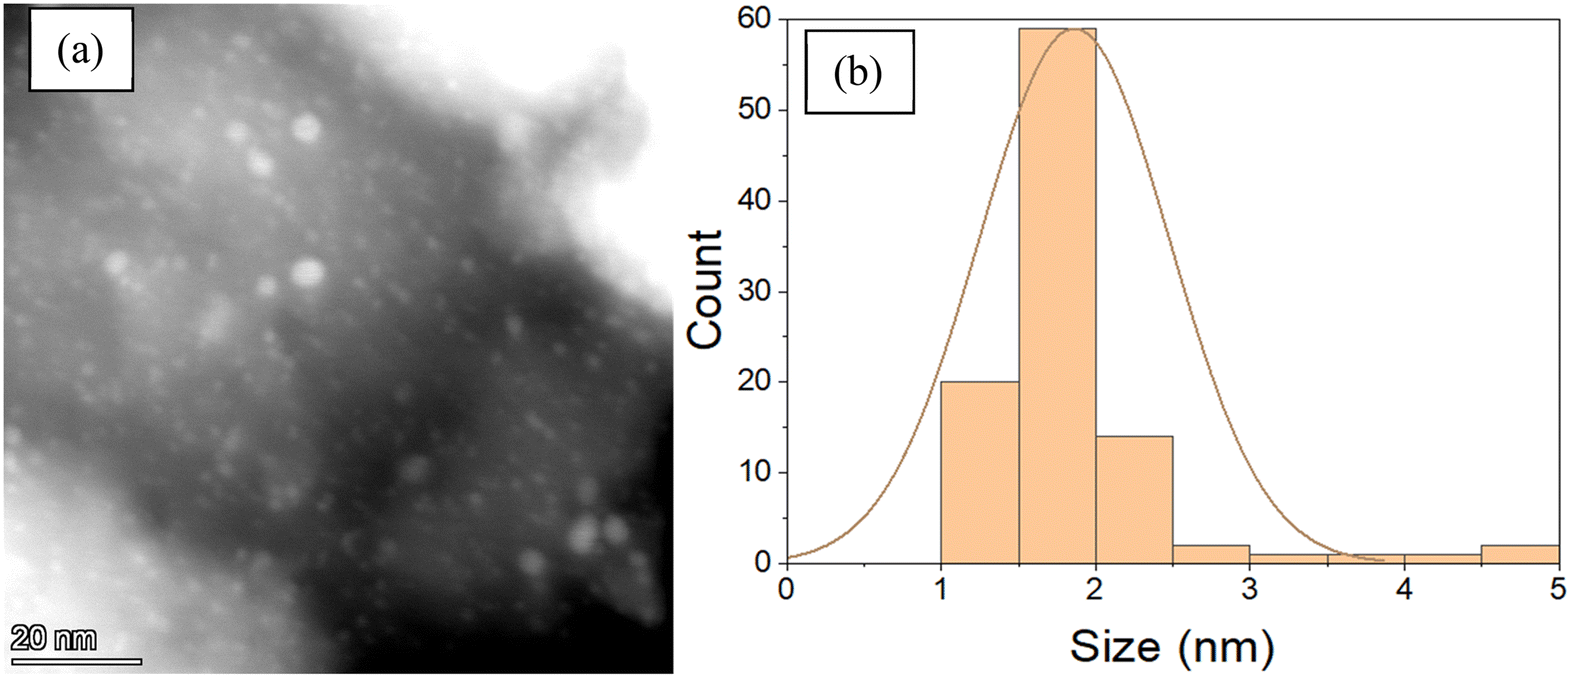 | ||
| Fig. 3 (a) STEM image and (b) particle size distribution of the 2Pd–0.5Ti/SiO2 catalyst after 550 °C reduction. | ||
| Ti loading (wt%) | EXAFS Est. size (nm) | STEM size (nm) |
|---|---|---|
| 0 | 1.6 | 1.9 ± 0.4 |
| 0.1 | 1.6 | 1.9 ± 0.8 |
| 0.5 | 2.2 | 1.9 ± 0.6 |
| 1.0 | 2.3 | 1.9 ± 0.4 |
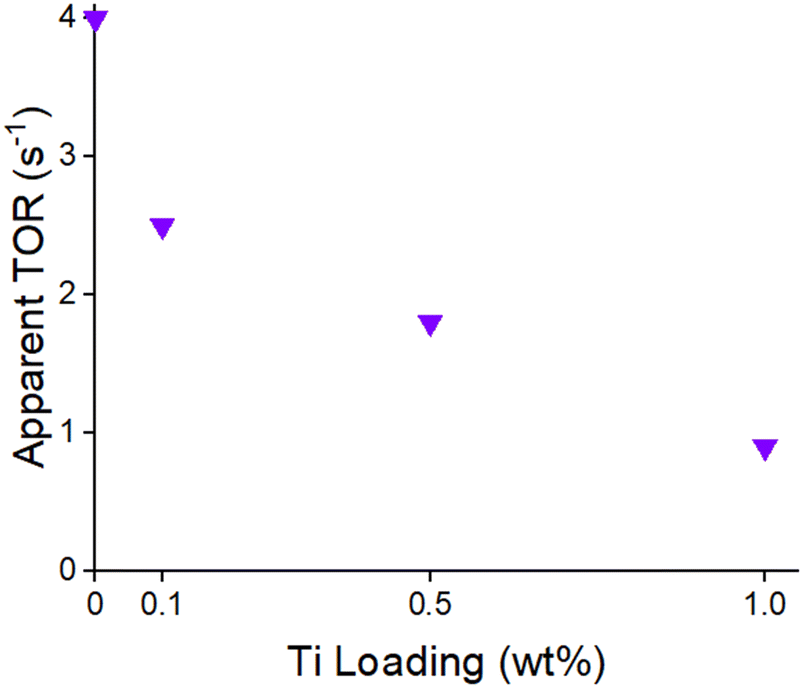 | ||
| Fig. 4 Apparent propylene hydrogenation TORs of all catalysts at 30 °C after 550 °C reduction. | ||
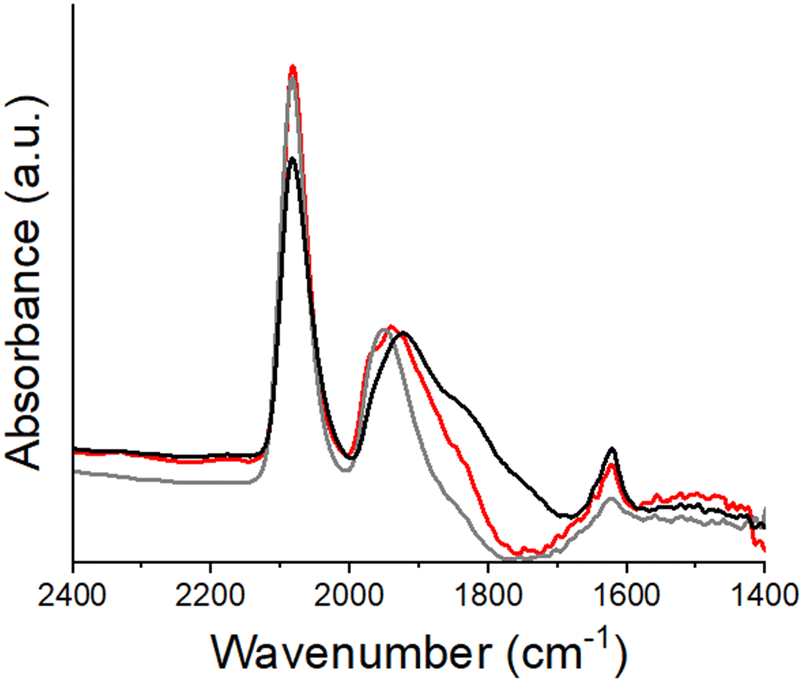 | ||
| Fig. 5 IR spectra of adsorbed CO on 0.1 (red), 0.5 (grey), and 1.0 (black) wt% Ti containing catalysts reduced at 550 °C; spectra were collected at 30 °C in pure CO. | ||
| Ti loading (wt%) | Higher order to linear bonding ratio |
|---|---|
| 0 | 2.8 |
| 0.1 | 1.2 |
| 0.5 | 0.8 |
| 1 | 1.0 |
3.3 Reversibility of the SMSI state
| Ti loading (wt%) | EXAFS Est. size (nm) | STEM size (nm) |
|---|---|---|
| 0 | 1.5 | — |
| 0.1 | 1.9 | 2.0 ± 0.7 |
| 0.5 | 2.3 | 1.8 ± 0.6 |
| 1.0 | 2.3 | 2.0 ± 0.9 |
The propylene hydrogenation TORs of the catalysts reduced at 550 °C, oxidized at 350 °C and re-reduced at 200 °C are shown in Table 6. The catalytic rates were all similar and the average TOR of 5.5 ± 1.3 s−1 is consistent with the literature for 1–3 nm Pd particles on alumina which had TORs of 4.4–12 s−1.44
| Ti loading (wt%) | Rate (mol C3H8 molmetal−1 s−1) | Dispersion | TOR (s−1) |
|---|---|---|---|
| 0 | 2.6 | 0.64 | 4.0 |
| 0.1 | 2.7 | 0.57 | 4.7 |
| 0.5 | 3.1 | 0.44 | 7.0 |
| 1 | 2.7 | 0.44 | 6.1 |
Since the nanoparticle size does not change after 350 °C oxidation and low temperature reduction, the fractional surface Pd nanoparticle coverage can be determine by the ratio of the propylene hydrogenation rate after high temperature reduction (SMSI covered Pd nanoparticles) divided by the rate after oxidation and re-reduction where the SMSI oxide over layer has been fully removed (Table S3†). Based on the rates with and without SMSI coverage, the fractional Pd nanoparticle surface coverage is shown to increase with increasing Ti loading (Fig. 6).
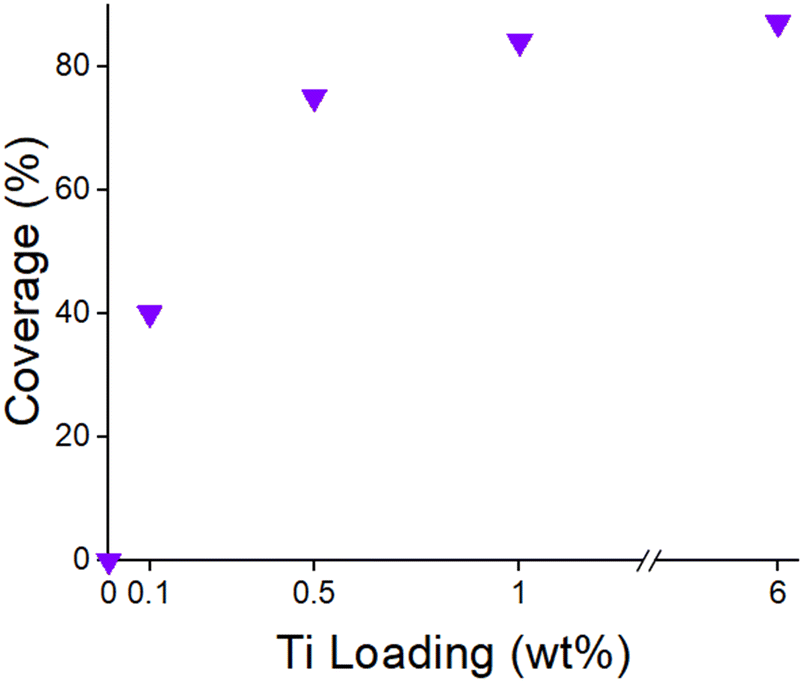 | ||
| Fig. 6 SMSI coverage for 0.1–1.0 wt% Ti catalysts reduced at 550 °C. | ||
| Ti loading (wt%) | Surface fraction Pd oxidized | Fraction of surface Pd covered by SMSI |
|---|---|---|
| 0 | 0.95 | — |
| 0.1 | 0.44 | 0.54 |
| 0.5 | 0.33 | 0.66 |
| 1.0 | 0.28 | 0.72 |
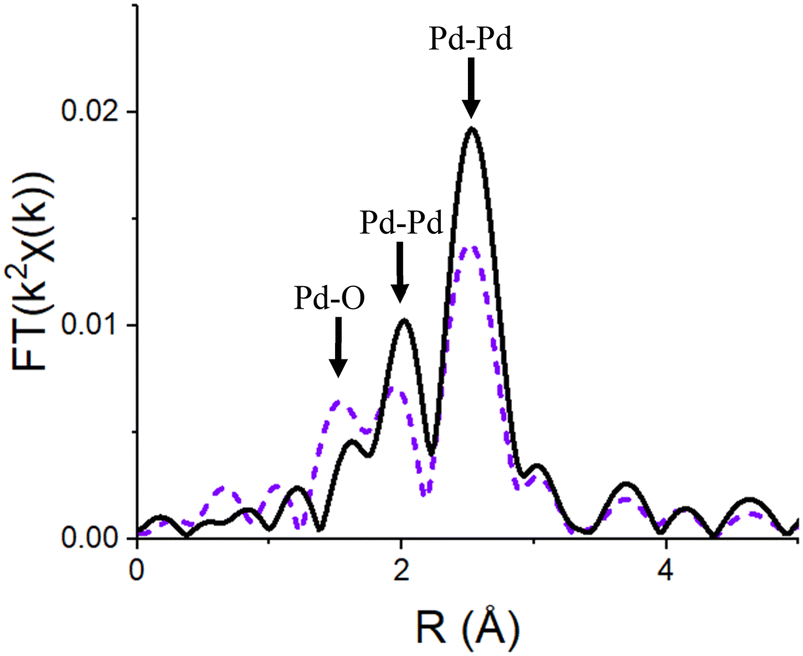 | ||
| Fig. 7 k 2-Weighthed Fourier transform of the Pd K edge EXAFS spectra of the 2Pd/SiO2 (0 wt% Ti) catalyst reduced at 550 °C (black, solid) then oxidized at 30 °C (purple, dash); spectra for Ti containing catalysts were had similar peaks of different sizes (Fig. S10–S12†). | ||
Based on the nanoparticle size determined from EXAFS and STEM (Table 3) and EXAFS of the reduced Pd nanoparticles (Fig. 1 and S1–S3†), the fraction of surface Pd atoms in each catalyst was estimated. The fraction Pd oxidized in each catalyst was determine from Pd–O coordination numbers (CN) after oxidation at 30 °C. For fully oxidized Pd there are 4Pd–O bonds, thus the fraction of oxidized Pd in any catalyst is given by the Pd–O CN/4. The surface fraction oxidized Pd decreases from 0.95 for 2Pd/SiO2 to as low as 0.28 at 1.0 wt% Ti (Table 7). This indicates that the SMSI overlayer prevents oxidation of the surface Pd atoms that it covers. In addition, increasing the Ti loading from 0.1 to 1.0 wt% increased the fraction of the nanoparticle surface that was covered.
The rate of propylene hydrogenation of SMSI covered Pd nanoparticles initially reduced at 550 °C was also determined after oxidation with increasing temperature and re-reduction at 200 °C. For the 2Pd–0.5Ti/SiO2 catalyst, the rate increases with increasing oxidation temperature suggesting that increasing oxidation temperatures partially removes the SMSI overlayer (Fig. 8a, Table S5†). Above 350 °C, the catalytic rate remained constant at ∼3.1 mol C3H8 molmetal−1 s−1 corresponding to a TOR of 6.8 s−1 which is consistent with past studies of ∼2 nm Pd particles44 suggesting there is little to no SMSI coverage remaining.
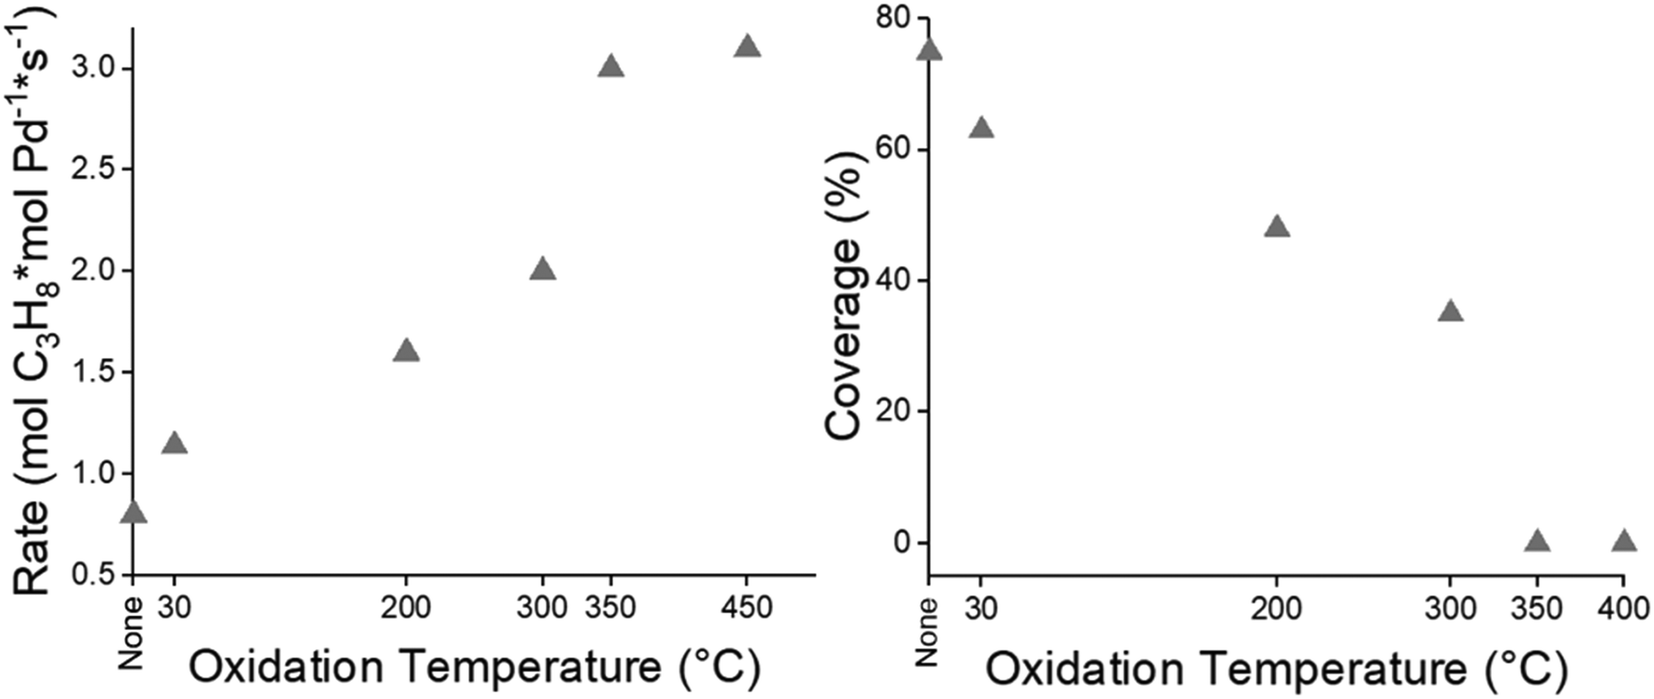 | ||
| Fig. 8 (a) Propylene hydrogenation rate and (b) fractional SMSI coverage of the 2Pd–0.5Ti/SiO2 catalyst reduced at 550 °C, oxidized at different temperatures, and re-reduced at 200 °C. | ||
The remaining coverage can be measured for the samples when oxidized below 350 °C, i.e., the rates after oxidation at low temperature and re-reduction at 200 °C divided by the rate after complete removal with 350 °C oxidation and 200 °C re-reduction (Fig. 8b, Table S5†). For 2Pd–0.5Ti/SiO2, the Pd nanoparticle surface coverage is 75% after 550 °C reduction. Using an oxidation step with increasing temperature and re-reduction at 200 °C results in a lower SMSI coverage. Thus, the oxidation temperature can be used to control the SMSI coverage, at least for low temperature reactions.
The fraction of total Pd that was oxidized with increasing temperature was determined by EXAFS. As the oxidation temperature increased the Pd–O coordination number increased (Table S6†). Since fully oxidized PdO has a coordination number of 4, the fraction of oxidized Pd with increasing temperature was estimated by determining the catalysts Pd–O CN/4. Increasing the oxidation temperature increases the fraction of oxidized Pd in all catalysts (Fig. 9). At 30 ° C exposed surface Pd atoms are oxidized. At higher oxidation temperatures Pd that is covered by the SMSI oxide is oxidized. At 350 °C, where there is little remaining SMSI coverage, there is also little metallic Pd. The EXAFS suggests that removal of the SMSI overlayer requires the oxidation of the metallic Pd covered by the SMSI oxide. For high coverages of the SMSI oxide this requires nearly complete oxidation of the metallic nanoparticle.
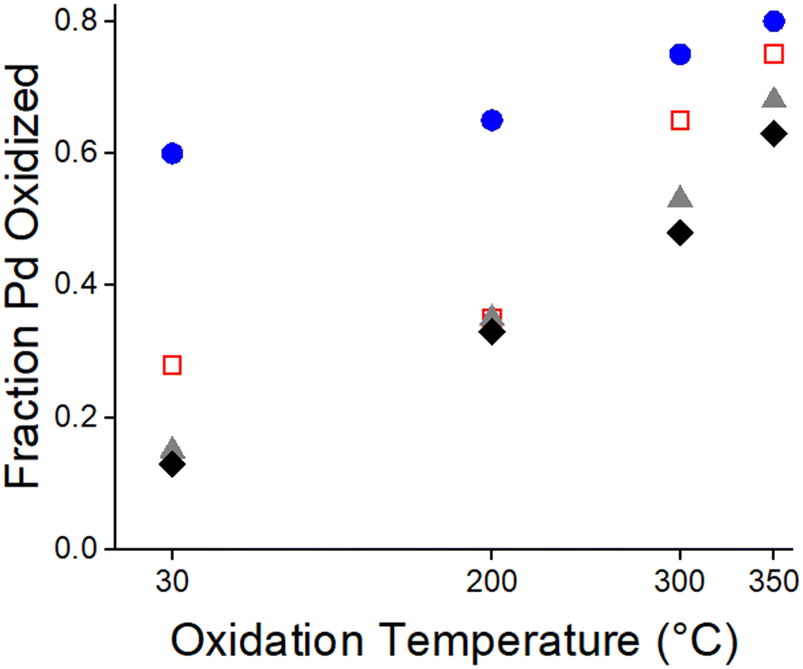 | ||
| Fig. 9 Fraction Pd oxidized for 0 wt% Ti (blue, circle), 0.1 wt% Ti (red, square), 0.5 wt% Ti (grey, triangle), and 1.0 wt% Ti (black, diamond) containing catalysts reduced at 550 °C, and oxidized at different temperatures. | ||
3.4 Controlling partial SMSI coverage by increasing the re-reduction temperature
As shown above, the fraction of SMSI coverage can be determined from the propylene hydrogenation rate at 30 °C with and without SMSI coverage. As demonstrated in Fig. 6, the Pd nanoparticle coverage can be controlled by the Ti loading where coverages of less than ∼50% would require ∼0.2 wt% Ti or less. Additionally, the SMSI coverage for low temperature reactions can be controlled by oxidation of the SMSI catalyst at temperatures below 350 °C. While the SMSI overlayer can be removed at 350 °C, partial removal occurs at lower oxidation temperatures (Fig. 8b).The 2Pd–XTi/SiO2 (0.1–1.0 wt% Ti) SMSI catalysts were reduced at 550 °C, oxidized at 350 °C, and re-reduced at 200 °C through five oxidation and re-reduction cycles and the CO chemisorption uptake was measured to confirm that there were no changes in particle size after these treatments. The initial and final CO chemisorption values were identical (Table 8) indicating no changes in nanoparticle size for oxidation and reduction temperatures below 350 °C and 550 °C, respectively.
| Ti loading (wt%) | 200 °C re-reduction measurement | CO uptake (mol CO per mol Pd) |
|---|---|---|
| 0.1 | Initial | 0.29 |
| Final | 0.28 | |
| 0.5 | Initial | 0.26 |
| Final | 0.28 | |
| 1.0 | Initial | 0.21 |
| Final | 0.22 |
The 2Pd–XTi/SiO2 catalysts were reduced at 550 °C and oxidized at 350 °C to remove the SMSI overlayer. Each catalyst was subsequently re-reduced at increasing temperature from 200–550 °C. The propylene hydrogenation rate (measured at 30 °C) for each re-reduction temperature was divided by the rate of the catalyst re-reduced at 200 °C to determine the fraction of SMSI surface coverage (Fig. 10, Table S7†). For each Ti loading, the SMSI coverage increased with increasing reduction temperature. In addition, lower Ti loadings resulted in lower coverages at every reduction temperature. Decreasing the re-reduction temperature resulted in lower levels of coverage from ∼10% after 300 °C re-reduction to ∼35% after 500 °C re-reduction for 0.1 wt% Ti. For 1 wt% Ti, 84% of the catalytic surface was covered after 550 °C reduction. Intermediate coverages of 0–75% were achieved with 200–400 °C re-reduction temperatures. These differences in coverage indicate that re-reduction temperature is also an effective method to vary particle coverage.
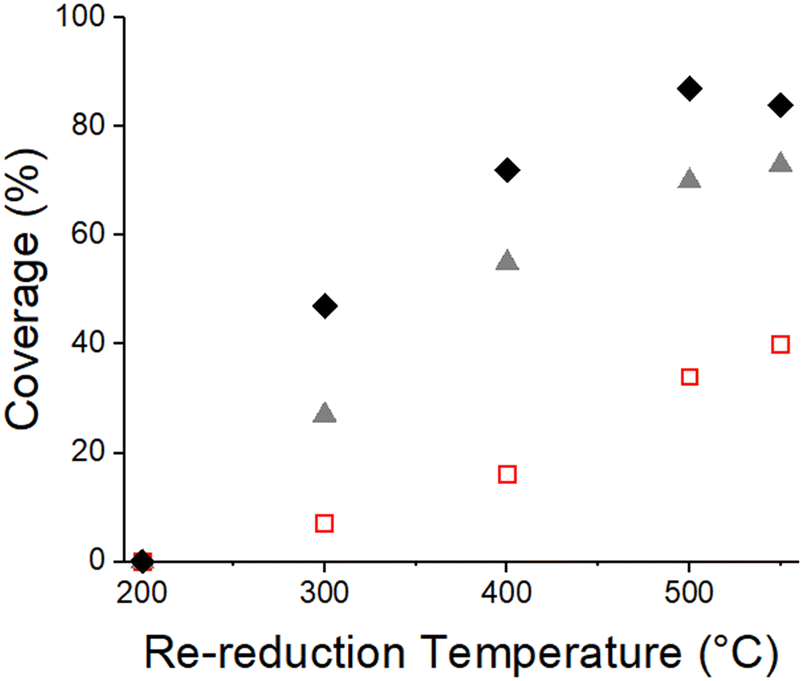 | ||
| Fig. 10 SMSI coverage for 0.1 wt% Ti (red, square), 0.5 wt% Ti (grey, triangle), and 1.0 wt% Ti (black, diamond) containing catalysts at varied re-reduction temperatures after 550 °C reduction and 350 °C oxidation. | ||
4. Discussion
4.1 Evidence for SMSI and conditions for reversibility
SMSI has been widely studied for metallic nanoparticles on oxide supports such as TiO2,9 CeO2,11,12 Nb2O5,15 ZnO,17,18 and on SiO2 and supported SMSI oxides.2,4,15 For the latter, the weight loadings of SMSI oxide are typically greater than 1.0 wt%. For both types, the NP surface is highly covered, often greater than 70%. In this study, we present three methods for controlling the SMSI coverage from 10–85%. To determine the Pd surface coverage by the SMSI oxide, one needs to compare the rate of propylene hydrogenation, a structure insensitive reaction in which the rate of every surface Pd is identical, with and without the SMSI overlayer. As shown by Tauster, et al. the SMSI oxide can be removed by oxidation at high temperature. For these 2Pd–XTi/SiO2 catalysts, oxidation at temperatures of 350 °C led to nearly complete oxidation of the metallic Pd nanoparticles and reversal of the SMSI coverage. Re-reduction at 200 °C restored the Pd nanoparticles without formation of the SMSI overlayer. As shown by STEM and EXAFS, these treatments did not alter the Pd nanoparticle size. Comparison of the propylene hydrogenation rates for the SMSI and SMSI-free states allows for determination of the Pd surface coverage as shown in Fig. 11.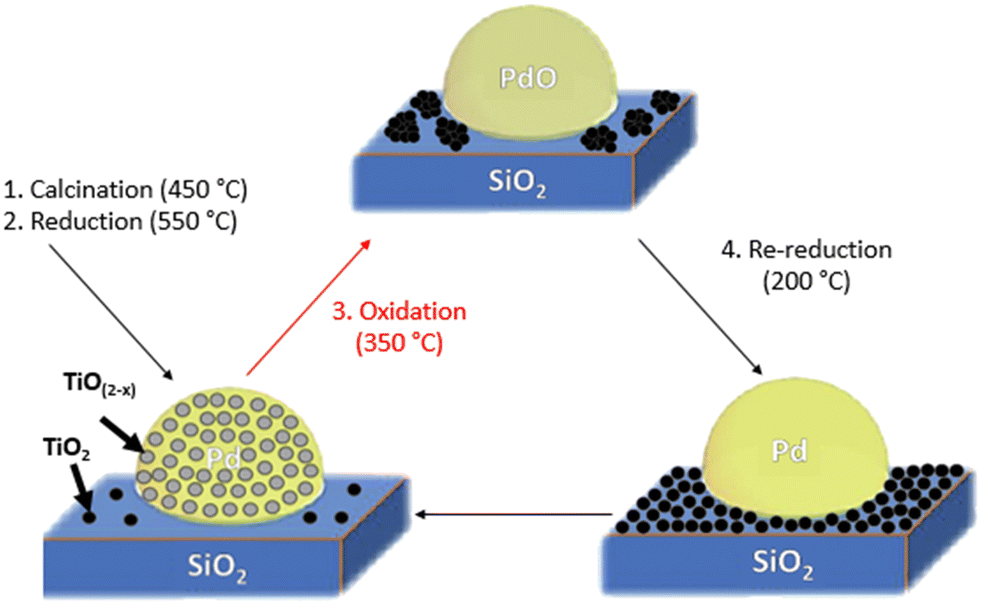 | ||
| Fig. 11 Determination of the fractional SMSI oxide coverage: steps 1 (calcination at 450 °C) and 2 (reduction at 550 °C) give small metallic nanoparticles with the maximum SMSI coverage. Step 3 (oxidation at 350 °C) gives PdO and removes the SMSI overlayer. Step 4 (re-reduction at 200 °C) gives Pd nanoparticles of the same size as in step 2 but without the SMSI surface coverage. Comparison of the propylene hydrogenation rate after step 2 and 4 gives the fractional SMSI surface coverage. | ||
4.2 Partial coverage of Pd nanoparticles by TiO(2−x) SMSI oxides
The first method to control the Pd surface coverage is to control the Ti loading and reduce the catalyst at high temperature (550 °C) to give the maximum coverage for that loading. For example, with 0.1 wt% Ti, the Pd nanoparticle surface coverage is ∼40%. While lower SMSI surface coverages were not investigated in this study, Ti loadings of less than 0.1 wt% would be expected to give even lower coverages. With 0.5 wt% Ti the surface coverage is ∼75%. At coverages of 1% or higher, the Pd surface coverage is nearly constant at ∼85% as seen in a previous study.2It is surprising that 0.1 wt% Ti can lead to a loss of 40% of the Pd surface sites. For example, on a 1.6 nm sized Pd nanoparticle in 2% Pd/SiO2 the dispersion is 0.62. The ratio of surface Pd to Ti is approximately 6. In addition, not all of the TiO(2−x) would be expected to be near the Pd nanoparticles. In order for 0.1% Ti to reduce the catalytic rate by 40%, a high fraction of the TiO(2−x) would have to be covering the Pd nanoparticle surface and each TiO(2−x) species would have to be covering more than one active site. Based on the IR spectra, the SMSI oxide selectively covers threefold Pd surface sites. Therefore, the SMSI oxide likely blocks more than one active site per Ti. If each SMSI oxide were to block three catalytic sites, this would require ∼0.07% Ti to give a surface coverage of 40%. This also assumes that all of the Ti added to the catalyst is on the Pd NPs with little remaining on the support. This suggests that at low loadings much of the TiO(2−x) is near or covering the Pd nanoparticles. High resolution electron microscopy techniques such as EDX may prove useful in determining this as well as the local structure of the partial SMSI overlayer.
The second method to control the Pd nanoparticle coverage by the SMSI oxide is to re-reduce the SMSI-free catalyst (step 4 in Fig. 10) at increasing temperatures. While there is little SMSI coverage upon reduction at 200 °C, the SMSI coverage increases at temperatures from 300–550 °C as seen in Fig. 10. Re-reduction combined with low Ti loading gives surface coverages as low as 10%. The limitation of this method is that, to maintain the low surface coverage, the reaction temperature must be lower than the re-reduction temperature. However, by reducing the Ti loading, one can get the same surface coverage at a higher temperature. For example, with 0.1 wt% Ti a surface coverage of 30% is achieved using re-reduction at ∼500 °C while for 0.5 wt% Ti the same surface coverage is possible using re-reduction at 300 °C (Fig. 10).
The third method for controlling the SMSI coverage is by using low temperature oxidation of the SMSI catalyst (Fig. 7). Room temperature air exposure of the SMSI covered Pd nanoparticle resulted in oxidation of the exposed metallic Pd atoms. Room temperature air is well known to oxidize metallic surface atoms in noble metal catalysts and is the basis for the oxidation–reduction chemisorption method. Re-reduction of the oxidized surface atoms does not lead to any significant changes in the fraction of metallic surface Pd, the fraction of SMSI coverage, or nanoparticle size. Thus, the SMSI oxide is impermeable to O2 and the metallic Pd atoms under the SMSI oxide are not oxidized. Increasing the oxidation temperature, however, does oxidize a portion of the metallic Pd covered by TiO(2−x). Re-reduction at 200 °C gives nanoparticles of the same size but with a higher fraction of exposed Pd. The fraction of exposed metallic Pd increases with increasing oxidation temperature until 350 °C where the SMSI oxide no longer covers the metallic Pd nanoparticles and the surface is fully metallic after 200 °C re-reduction. Oxidation at 350 °C leads to nearly complete oxidation of the metallic Pd nanoparticles. Thus, to remove the SMSI overlayer, one needs to oxidize the metallic atoms at the Pd–SMSI oxide interface. Since the SMSI oxide is impermeable to O2 and the fraction of oxidized Pd increases with increasing temperature, it is likely that oxidation of the SMSI covered Pd occurs at the edge of the SMSI oxide. As the temperature increases, sub-surface Pd oxidizes until the SMSI surface covered Pd is oxidized and the SMSI–Pd interface is fully removed. Removal of the SMSI oxide requires oxidation of the Pd NPs rather than migration of the SMSI oxide away from the metallic nanoparticles to the support.
4.3 Controlling partial coverage for improved SMSI catalysts
The presence of the SMSI oxide has been shown to be beneficial for several catalytic reactions;2–8 however, the high surface coverage of active sites leads to low rates. SMSI catalysts most often improve selectivity by suppressing hydrogenolysis reactions. The desired reaction rate, however, is also greatly reduced. Thus, the SMSI catalyst has improved selectivity but at a low rate.For example, dehydrogenation of propane on ∼2 nm Pt nanoparticles supported on SiO2 had a 60% propylene selectivity and 40% hydrogenolysis selectivity to methane and ethane at 30% conversion.2 Addition of SMSI oxides, for example Pt–Ti/SiO2 and Pt–Nb/SiO2 catalysts with 3% Ti and 4% Nb, suppressed hydrogenolysis giving propylene selectivities above 95%. As observed for these catalysts, the SMSI oxides resulted in the loss of over 80% of the active sites.
Similarly, Yang, et al. prepared Ni–Mo/SiO2 catalysts for m-cresol hydrodeoxygenation which is a biomass model compound.45 Under reaction conditions the Ni is reduced to Ni nanoparticles which are known for their high hydrogenolysis selectivity. The Mo:Ni molar ratios were varied and the catalytic performance was determined. At low Mo:Ni ratios and at high reaction temperature there is a high selectivity for hydrogenolysis and formation of CH4. At a Mo:Ni ratio near one hydrogenolysis is suppressed and hydrodeoxygenation leads to high selectivity to toluene. Further increases in the Mo:Ni ratio maintains the high selectivity but reduces the rates suggesting extensive coverage of active sites. Thus, controlling the active site coverage can lead to improved selectivity and higher rates.
The goal of this study was to determine if one can control the SMSI active site coverage to lower levels than is generally obtained with the hope of improving the rate while maintaining high selectivity. We demonstrate that the coverage can be controlled resulting in catalysts with higher activity; however, much lower SMSI loadings are required than what have typically been used. The effect on selectivity will depend on the specific reaction; however, based on the IR spectra, it appears that the SMSI oxide at low coverages occupies threefold surface sites which are known to be active sites for hydrogenolysis, for example. This study provides another option for synthesis of catalysts with improved performance.
5. Conclusions
∼2 nm sized 2 wt% Pd/SiO2 catalysts with 0–1.0 wt% Ti were synthesized using calcination at 450 °C and reduction at 550 °C. Calcination and reduction at higher temperatures led to slightly larger nanoparticles. Catalysts containing 0.1–1.0 wt% TiO(2−x) had reduced CO chemisorption capacities and lower propylene hydrogenation rates compare to Pd/SiO2 of the same size suggesting coverage of the Pd nanoparticles by the TiO(2−x) SMSI oxide. The Pd nanoparticle surface coverage increased with increasing Ti loading. Oxidation at 350 °C followed by reduction at 200 °C removed the SMSI overlayer and did not change the Pd nanoparticle size. Thus, the fractional coverage of the Pd nanoparticles was determined from the ratio of the propylene hydrogenation rate with SMSI coverage divided by that without SMSI coverage. For Ti loadings from 0.1 to 1.0 wt%, the SMSI coverage increased from about 40–85%. Surface coverage of 40% suggests that most of the Ti is covering the Pd nanoparticles and that each SMSI oxide species leads to the loss of more than one active site. Consistent with this conclusion, the IR spectra of adsorbed CO show that the SMSI oxides are selectively blocking Pd threefold sites.Following oxidation at 350 °C, partial SMSI coverage can also be controlled by re-reducing at temperatures from 300–500 °C. The low temperature re-reduction can be combined with low Ti loadings to give surface coverages as low as 10%. To retain low surface coverage the reaction temperature must be lower than the re-reduction temperature; however, by reducing the Ti loading, one can get the same surface coverage at a higher temperature. Finally, the SMSI surface coverage can be controlled by oxidation at temperatures below 350 °C followed by re-reduction at 200 °C. With increasing oxidation temperature, EXAFS shows that there is an increasing fraction of oxidized Pd. At 350 °C, where the SMSI oxide is fully removed, the metallic Pd nanoparticles are nearly fully oxidized. These results suggest that oxidation of the metallic Pd is required to remove the SMSI oxide overlayer. By controlling the SMSI oxide loading to levels of less than 1 wt%, it is suggested that catalysts with high selectivity and improved activity are possible.
Conflicts of interest
There are no conflicts to declare.Acknowledgements
CJB, CWL, and JTM were supported in part by the National Science Foundation under Cooperative Agreement No. EEC-1647722. CWL and KZ were partially funded by the National Science Foundation grant CHE-2106450. GZ would like to acknowledge the National Natural Science Foundation of China (21902019). Use of the Advanced Photon Source was supported by the U.S. Department of Energy Office of Basic Energy Sciences under contract no. DE-AC02-06CH11357. MRCAT operations, beamlines 10-BM and 10-ID, are supported by the Department of Energy and the MRCAT member institutions.References
- S. J. Tauster, S. C. Fung and R. L. Garten, Strong Metal-Support Interactions. Group 8 Noble Metals Supported on TiO2, J. Am. Chem. Soc., 1978, 100, 170–175 CrossRef CAS.
- J. Zhu Chen, J. Gao, P. R. Probus, W. Liu, X. Wu, E. C. Wegener, A. J. Kropf, D. Zemlyanov, G. Zhang, X. Yang and J. T. Miller, The effect of strong metal-support interaction (SMSI) on Pt-Ti/SiO2 and Pt-Nb/SiO2 catalysts for propane dehydrogenation, Catal. Sci. Technol., 2020, 10, 5973–5982 RSC.
- W. J. Kim, J. H. Kang, I. Y. Ahn and S. H. Moon, Deactivation behavior of a TiO2-added Pd catalyst in acetylene hydrogenation, J. Catal., 2004, 226, 226–229 CrossRef CAS.
- J. H. Kang, E. W. Shin, W. J. Kim, J. D. Park and S. H. Moon, Selective hydrogenation of acetylene on Pd/SiO2 catalysts promoted with Ti, Nb and Ce oxides, Catal. Today, 2000, 63, 183–188 CrossRef CAS.
- J. H. Kang, E. W. Shin, W. J. Kim, J. D. Park and S. H. Moon, Selective Hydrogenation of Acetylene on TiO2-Added Pd Catalysts, J. Catal., 2002, 208, 310–320 CrossRef CAS.
- G. R. Jenness and J. R. Schmidt, Unraveling the Role of Metal-Support Interactions in Heterogeneous Catalysis: Oxygenate Selectivity on Fischer-Tropsch Synthesis, ACS Catal., 2013, 3, 2881–2890 CrossRef CAS.
- J. A. Rodriguez, P. Liu, J. Hrbek, J. Evans and M. Pérez, Water Gas Shift Reaction on Cu and Au Nanoparticles Supported on CeO2(111) and ZnO(000): Intrinsic Activity and Importance of Support Interactions, Angew. Chem., Int. Ed., 2007, 46, 1329–1332 CrossRef CAS.
- A. Kumar and V. Ramani, Strong Metal-Support Interactions Enhance the Activity and Durability of Platinum Supported on Tantalum-Modified Titanium Dioxide Electrocatalysts, ACS Catal., 2014, 4, 1516–1525 CrossRef CAS.
- S. J. Tauster, S. C. Fung, R. T. K. Baker and J. A. Horsley, Strong interactions in supported-metal catalysts, Science, 1981, 211, 1121–1125 CrossRef CAS.
- O. Dulub, W. Hebenstreit and U. Diebold, Imaging Cluster Surfaces with Atomic Resolution: The Strong Metal-Support Interaction State of Pt Supported on TiO2(110), Phys. Rev. Lett., 2000, 84, 3646–3649 CrossRef CAS.
- A. K. Datye, D. S. Kalakkad, M. H. Yao and D. J. Smith, Comparison of metal-support interactions in Pt/TiO2 and Pt/CeO2, J. Catal., 1995, 155, 149–153 CrossRef.
- C. T. Campbell, Electronic perturbations, Nat. Chem., 2012, 4, 597–598 CrossRef CAS PubMed.
- M. C. Willinger, W. Zhang, O. Bondarchuk, S. Shaikhutdinov, H. J. Freund and R. Schlögl, A Case of Strong Metal-Support Interactions: Combined Advanced Microscopy and Model Systems to Elucidate the Atomic Structure of Interfaces, Angew. Chem., Int. Ed., 2014, 53, 5998–6001 CrossRef CAS.
- P. Kast, M. Friedrich, D. Teschner, F. Girgdies, T. Lunkenbein, R. N. d'Alnoncourt, M. Behrens and R. Schlögl, CO oxidation as a test reaction for strong metal-support interaction in nanostructured Pd/FeOx powder catalysts, Appl. Catal., A, 2015, 502, 8–17 CrossRef CAS.
- I. Y. Ahn, W. J. Kim and S. H. Moon, Performance of La2O3- or Nb2O5-added Pd/SiO2 catalysts in acetylene hydrogenation, Appl. Catal., A, 2006, 308, 75–81 CrossRef CAS.
- S. Mo, Q. Zhang, M. Zhang, Q. Zhanq, J. Li, M. Fu, J. Wu, P. Chen and D. Ye, Elucidating the special role of strong metal-support interactions in Pt/MnO2 catalysts for total toluene oxidation, Nanoscale Horiz., 2019, 4, 1425–1433 RSC.
- X. Liu, M. H. Liu, Y. C. Luo, C. Y. Mou, S. D. Lin, H. Cheng, J. M. Chen, J. F. Lee and T. S. Lin, Strong Metal-Support Interactions between Gold Nanoparticles and ZnO Nanorods in CO Oxidation, J. Am. Chem. Soc., 2012, 134, 10251–10258 CrossRef CAS.
- J. Gao, K. J. Sawant, J. T. Miller, Z. Zeng, D. Zemlyanov and J. P. Greeley, Structural and Chemical Transformations of Zinc Oxide Ultrathin Films on Pd(111) Surfaces, ACS Appl. Mater. Interfaces, 2021, 13, 35113–35123 CrossRef CAS.
- H. Tang, J. Wei, F. Liu, B. Qiao, X. Pan, L. Li, J. Liu, J. Wang and T. Zhang, Strong Metal-Support Interactins between Gold Nanoparticles and Nonoxides, J. Am. Chem. Soc., 2016, 138, 56–59 CrossRef CAS PubMed.
- S. Liu, W. Xu, Y. Niu, B. Zhang, L. Zheng, W. Liu, L. Li and J. Wang, Ultrastable Au nanoparticles on titania through an encapsulation strategy under oxidative atmosphere, Nat. Commun., 2019, 10, 5790 CrossRef CAS PubMed.
- J. Dong, Q. Fu, H. Li, J. Xiao, B. Yang, B. Zhang, Y. Bai, T. Song, R. Zhang, L. Gao, J. Cai, H. Zhang, Z. Liu and X. Bao, Reaction-Induced Strong Metal-Support Interactions between Metals and Inert Boron Nitride Nanosheets, J. Am. Chem. Soc., 2020, 142, 17167–17174 CrossRef CAS.
- J. A. Farmer and C. T. Campbell, Ceria Maintains Smaller Metal Catalyst Particles by Strong Metal-Support Bonding, Science, 2010, 329, 933–936 CrossRef CAS PubMed.
- J. C. Matsubu, S. Zhang, L. DeRita, N. S. Marinkociv, J. G. Chen, G. W. Grahaw, X. Pan and P. Christopher, Adsorbate-mediated strong metal-support interactions in oxide-supported Rh catalysts, Nat. Chem., 2017, 9, 120–127 CrossRef CAS PubMed.
- J. Lee, S. P. Burt, C. A. Carrero, A. C. Alba-Rubio, I. Ro, B. J. O'Neil, H. J. Jim, D. H. K. Jackson, T. F. Kuech, I. Hermans, J. A. Dumesic and G. W. Huber, Stabilizing cobalt catalysts for aqueous-phase reactions by strong metal-support interaction, J. Catal., 2015, 330, 19–27 CrossRef CAS.
- O. S. Alexeev, S. Y. Chin, M. H. Engelhard, L. Ortiz-Soto and M. D. Amiridis, Effects of Reduction Temperature and Metal-Support Interactions on the Catalytic Activity of Pt/γ-Al2O3 and Pt/TiO2 for the Oxidation of CO in the Presence and Absence of H2, J. Phys. Chem. B, 2005, 109, 23430–23443 CrossRef CAS PubMed.
- B. Han, Y. Guo, Y. Huang, W. Xi, J. Xu, J. Luo, H. Qi, Y. Ren, X. Liu, B. Qiao and T. Zhang, Strong Metal-Support Interactions between Pt Single Atoms and TiO2, Angew. Chem., 2020, 59, 11824–11829 CrossRef CAS.
- M. Chu, Q. Pan, W. Bian, Y. Liu, M. Cao, C. Zhang, H. Lin, Q. Zhang and Y. Xu, Strong metal-support interaction between palladium and gallium oxide within monodisperse nanoparticles: self-supported catalysts for propyne semi-hydrogenation, J. Catal., 2021, 395, 36–45 CrossRef CAS.
- X. Liu, M. H. Liu, Y. C. Luo, C. Y. Mou, S. D. Lin, H. Cheng, J. M. Chen, J. F. Lee and T. S. Lin, Strong Metal-Support Interactions between Gold Nanoparticles and ZnO Nanorods in CO Oxidation, J. Am. Chem. Soc., 2012, 134, 10251–10258 CrossRef CAS PubMed.
- S. Zhang, P. N. Plessow, J. J. Willis, S. Dai, M. Xu, G. W. Graham, M. Cargneloo, F. Abild-Pedersen and X. Pan, Dynamical Observation and Detailed Description of Catalysts under Strong Metal-Support Interaction, Nano Lett., 2016, 16, 4528–4534 CrossRef CAS PubMed.
- F. Polo-Garzon, T. Blum, Z. Bao, K. Wang, V. Fung, Z. Huang, E. E. Bickel, D. Jiang, M. Chi and Z. Wu, In Situ Strong Metal-Support Interaction (SMSI) Affects Catalytic Alcohol Conversion, ACS Catal., 2021, 11, 1938–1945 CrossRef CAS.
- M. Armbrüster, R. Schlögl and Y. Grin, Intermetallic compounds in heterogeneous catalysis - a quickly developing field, Sci. Technol. Adv. Mater., 2014, 15, 034803 CrossRef PubMed.
- J. Lee, S. P. Burt, C. A. Carrero, A. C. Alba-Rubio, I. Ro, B. J. O'Neil, H. J. Jim, D. H. K. Jackson, T. F. Kuech, I. Hermans, J. A. Dumesic and G. W. Huber, Stabilizing cobalt catalysts for aqueous-phase reactions by strong metal-support interaction, J. Catal., 2015, 330, 19–27 CrossRef CAS.
- D. J. Childers, N. M. Schweitzer, S. M. Shahari, R. M. Rioux, J. T. Miller and R. J. Meyer, Modifying structure-sensitive reactions by addition of Zn to Pd, J. Catal., 2014, 318, 75–84 CrossRef CAS.
- J. R. Regalbuto, M. Schreier, X. Hao, W. A. Spieker, J. G. Kim, J. T. Miller and J. A. Kropf, Towards a molecular understanding of noble metal catalyst impregnation, Studies in Surface Science and Catalysis, ed. E. Gaigneaux, et al., Elsevier, 2002, vol. 143, pp. 45–53 Search PubMed.
- W. A. Spieker, J. T. Miller, A. J. Kropf and J. R. Regalbuto, An EXAFS study of the coordination chemistry of hydrogen hexachloroplatinate (IV) 2. Speciation of complexes adsorbed onto alumina, Appl. Catal., A, 2003, 243, 53–66 CrossRef CAS.
- C. Yang, Z. Wu, G. Zhang, H. Sheng, J. Tian, Z. Duan, S. Hyuntae, A. J. Kropf, T. Wu, T. Krause and J. T. Miller, Promotion of Pd nanoparticles by Fe and formation of a Pd3Fe intermetallic alloy for propane dehydrogenation, Catal. Today, 2018, 323, 123–128 CrossRef.
- L. L. Sheu, Z. Karpinski and W. M. H. Sachtler, Effects of Palladium Size and Palladium Silicide Formation on Fourier Transform Infrared Spectra of CO Adsorbed on Pd/SiO2 Catalysts, J. Phys. Chem., 1989, 93, 4890–4894 CrossRef CAS.
- A. Tereshchenko, A. Guda, V. Polyakov, Y. Rusalev, V. Butova and A. Soldatov, Pd nanoparticle growth monitored by DRIFT spectroscopy of adsorbed CO, Analyst, 2020, 145, 7534–7540 RSC.
- J. T. Miller, A. J. Kropf, Y. Zha, J. R. Rebalbuto, L. Delannoy, C. Louis, E. Bus and J. A. van Bokhoen, The effects of gold particle size on Au-Au bond length and reactivity toward oxygen in supported catalysts, J. Catal., 2006, 240, 222–234 CrossRef CAS.
- V. V. Srabionyan, A. L. Bugaev, V. V. Pryadchenko, L. A. Avakyan, J. A. van Bokhoven and L. A. Bugaev, EXAFS study of size dependence of atomic structure in palladium nanoparticles, J. Phys. Chem. Solids, 2014, 75, 470–476 CrossRef CAS.
- S. C. Purdy, R. R. Seemakurthi, G. M. Mitchell, M. Davidson, B. A. Lauderback, S. Deshpande, Z. Wu, E. C. Wegener, J. Greeley and J. T. Miller, Structural trends in the dehydrogenation selectivity of palladium alloys, Chem. Sci., 2020, 11, 5066–5081 RSC.
- W. Szczerba, H. Riesmeier and A. Thünemann, Bond length contraction in gold nanoparticles, Anal. Bioanal. Chem., 2010, 398, 1967–1972 CrossRef CAS.
- G. A. Somorjai and J. Carrazza, Structure sensitivity of catalytic reactions, Ind. Eng. Chem. Fundam., 1986, 25, 63–69 CrossRef CAS.
- T. Lear, R. Marshall, J. A. Lopez-Sanchez, S. D. Jackson, T. M. Klaptöke, M. Bäumer, G. Rupprechter, H. J. Freund and D. Lennon, The application of infrared spectroscopy to probe the surface morphology of alumina-supported palladium catalysts, J. Chem. Phys., 2005, 123, 174706 CrossRef PubMed.
- F. Yang, N. J. LiBretto, M. R. Komarneni, W. Zhou, J. T. Miller, X. Zhu and D. E. Resaco, Enhancement of m-Cresol Hydrodeoxygenation Selectivity on Ni Catalysts by Surface Decoration of MoOx Species, ACS Catal., 2019, 9, 7791–7800 CrossRef CAS.
Footnote |
| † Electronic supplementary information (ESI) available. See DOI: https://doi.org/10.1039/d2cy01707e |
| This journal is © The Royal Society of Chemistry 2023 |