Soluble and reusable polymer-based catalysts with Brønsted and Lewis acidity for the one-pot synthesis of hydroxymethylfurfural from glucose†
Ibeh S.
Omodolor‡
 a,
Subhash
Kalidindi‡§
 a,
Sarah A.
Walz
a,
Maria R.
Coleman
a,
Sarah A.
Walz
a,
Maria R.
Coleman
 a,
Ravikumar
Gogar
 a,
Sridhar
Viamajala
 a,
Manuel
López Granados
 b and
Ana C.
Alba-Rubio¶
 *a
*a
aDepartment of Chemical Engineering, The University of Toledo, Toledo, OH 43606, USA. E-mail: aalbaru@clemson.edu
bGroup of Sustainable Energy and Chemistry (EQS), Institute of Catalysis and Petrochemistry (IPC-CSIC), Cantoblanco, 28049 Madrid, Spain
First published on 25th November 2022
Abstract
Hydroxymethylfurfural (HMF) is an interesting renewable platform molecule due to the number of products that can be obtained from it. Various catalytic systems have been used to produce HMF from glucose; however, challenges, such as the lack of recovery and reutilization and/or low catalytic activity, have been encountered. This article reports a series of novel polystyrene sulfonic acid (PSSA)-based catalysts with both Brønsted and Lewis acid sites for the one-pot synthesis of HMF from glucose. These catalysts combine the advantages of both homogeneous and heterogeneous catalysts, as they are soluble in water (highly active) and recoverable by ultrafiltration for further use. Due to the presence of Brønsted and Lewis acid sites, these catalysts have the ability to perform both the isomerization of glucose to fructose and the dehydration of fructose to HMF. The interplay between Brønsted and Lewis acid sites was investigated by synthesizing a series of PSSA–AlCl3 catalysts with different Brønsted![[thin space (1/6-em)]](https://www.rsc.org/images/entities/char_2009.gif) :
:![[thin space (1/6-em)]](https://www.rsc.org/images/entities/char_2009.gif) Lewis acid ratios. A maximum HMF yield of ∼55 mol% was obtained with the PSSA–AlCl3 catalyst with H+/Al mole ratio = 4 after 4 h of reaction, and this was recycled and reused up to five times without significant loss of activity. Remarkably, this catalyst was effective in the valorization of highly concentrated solutions of glucose in water (up to 16.7 wt%). A techno-economic analysis estimated that the minimum fuel selling price (MFSP) of this HMF would be $1.94 per kg at a feed price of $0.30 per kg glucose. This MFSP could be further reduced by improving the HMF yield, minimizing the volume of solvent used, or using a lower-cost feedstock.
Lewis acid ratios. A maximum HMF yield of ∼55 mol% was obtained with the PSSA–AlCl3 catalyst with H+/Al mole ratio = 4 after 4 h of reaction, and this was recycled and reused up to five times without significant loss of activity. Remarkably, this catalyst was effective in the valorization of highly concentrated solutions of glucose in water (up to 16.7 wt%). A techno-economic analysis estimated that the minimum fuel selling price (MFSP) of this HMF would be $1.94 per kg at a feed price of $0.30 per kg glucose. This MFSP could be further reduced by improving the HMF yield, minimizing the volume of solvent used, or using a lower-cost feedstock.
Introduction
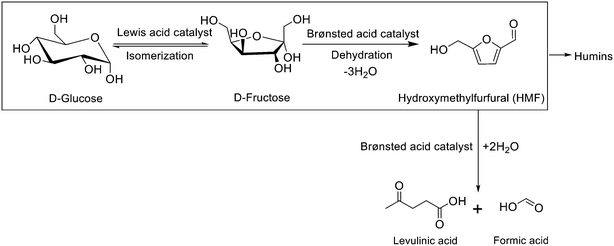
Due to the uncertainty in the continuous availability of petroleum and the environmental challenges associated with its use, recent research efforts have been geared towards the search for other alternative energy sources.1–3 Lignocellulosic biomass is a sustainable substitute because it is renewable and widely available. Among the different biomass valorization routes, the conversion of the sugar fraction into valuable products like hydroxymethylfurfural (HMF) has recently gained a lot of attention.4 In fact, the United States Department of Energy (DOE) listed HMF as one of the top 10 platform chemicals due to the myriad of products obtained from it.5–11 For instance, the complete oxidation of HMF produces 2,5-furandicarboxylic acid (FDCA) that can be converted to polyethylene furanoate (PEF), which is similar to polyethylene terephthalate (PET) but with improved barrier properties.12 Another example of an HMF-derived chemical is adipic acid, which is used to produce nylon.HMF can be produced by the acid-catalyzed dehydration of simple sugars like glucose and fructose. The production from fructose is easier because, in solution, about 21.5% of fructose exists as a furanose tautomer with a structure similar to HMF, which results in high HMF selectivity.13–15 Nevertheless, the production from glucose is preferable because it is the most abundant monosaccharide and has a lower cost.16–20 To do so, it is necessary to isomerize glucose to fructose using a Lewis acid catalyst, followed by the dehydration of fructose to HMF with a Brønsted acid catalyst (Fig. 1).
Different combinations of homogeneous Brønsted and Lewis acid catalysts have been used to produce HMF from glucose. For instance, mineral acids (e.g., H2SO4, HCl), mineral salts (e.g., AlCl3, CrCl2), and ionic liquids ([EMIM] Cl) are some of the homogeneous catalysts reported in the literature.21–30 However, their difficult separation and reutilization, as well as the high cost of ionic liquids, are some of the challenges associated with their use. On the other hand, heterogeneous catalysts, such as mesoporous tantalum oxide, mesoporous tantalum phosphate, chromium-exchanged zirconium phosphate, chromium-exchanged montmorillonite, Hβ-zeolite (Si/Al = 25), SO42−/ZrO2, SO42−/ZrO2–Al2O3, MCM-41 mesoporous silica containing ZrO2, Sn-ceramic powder, Al2O3–B2O3, Sn-beta zeolite, Sn-montmorillonite, TiO2–ZrO2, and Amberlyst-15 sulfonic resin have also been explored for the conversion of glucose into HMF.31–48 Nevertheless, challenges such as slower reaction kinetics and deactivation due to the formation of humins are some of the difficulties encountered by their use. Humins are formed when glucose, fructose, and HMF undergo aldol addition/condensation (in the presence of Brønsted acid sites) to form an active intermediate named 2,5-dioxo-6-hydroxyhexanal (DHH) that reacts with another HMF molecule.49 Humins get irreversibly chemisorbed on the active sites of the catalyst, thus reducing the number of active centers available for reaction.50
In order to overcome the challenges of the use of homogeneous and heterogeneous catalysts, in this work, we synthesized a series of soluble and reusable polymer-based catalysts containing both Brønsted and Lewis acid sites for the one-pot production of HMF from glucose. Polystyrene sulfonic acid (PSSA) has been reported as an active catalyst for reactions that require Brønsted acidity (e.g., production of biodiesel from vegetable oil, xylose dehydration to furfural, and oxidation of furfural into succinic and maleic acids).51–54 Interestingly, PSSA is soluble in polar solvents, which makes it highly active due to easy accessibility to the Brønsted acid sites, and it can also be recovered by ultrafiltration due to its high molecular weight. Now, in order to make that polymer catalyst suitable for the production of HMF from glucose, we added another functionality (Lewis acidity) by crosslinking PSSA chains with AlCl3. Previous studies in the literature described the addition of AlCl3 to sulfonic resins to generate solid catalysts with both functionalities. For example, Magnotta et al. reported the synthesis of heterogeneous PSSA–AlCl3 catalysts by spraying AlCl3 gas onto PSSA beads under an inert atmosphere at 105 °C.55 On the other hand, Wang et al. synthesized a ZnCl2-modified resin by mixing PSSA and ZnCl2 in ethanol for 6 h.56 In this report, however, we aimed to synthesize soluble and recoverable PSSA–AlCl3 catalysts to benefit from the advantages of both homogeneous and heterogeneous catalysis: high activity and reusability. To do so, we developed a facile method to carry out the crosslinking of PSSA with AlCl3 in an alcoholic medium at room temperature while maintaining the polymer catalyst in solution.30,48,57 A series of PSSA–AlCl3 catalysts with different Brønsted![[thin space (1/6-em)]](https://www.rsc.org/images/entities/char_2009.gif) :
:![[thin space (1/6-em)]](https://www.rsc.org/images/entities/char_2009.gif) Lewis acid ratios was synthesized, characterized, and studied in the one-pot production of HMF from glucose. Additionally, reutilization studies were carried out to demonstrate the recoverability and reusability of the catalysts. Lastly, a techno-economic analysis helped determine the minimum furan selling price (MFSP) of HMF produced. Remarkably, a low MFSP was obtained amid the high costs in 2022, mostly due to the reutilization of the catalysts.
Lewis acid ratios was synthesized, characterized, and studied in the one-pot production of HMF from glucose. Additionally, reutilization studies were carried out to demonstrate the recoverability and reusability of the catalysts. Lastly, a techno-economic analysis helped determine the minimum furan selling price (MFSP) of HMF produced. Remarkably, a low MFSP was obtained amid the high costs in 2022, mostly due to the reutilization of the catalysts.
Experimental
Materials
Poly(sodium 4-styrenesulfonate) solutions (Mw ∼200 kDa and 1000 kDa), 99.8% anhydrous methanol, anhydrous ethanol with ≤0.003% water, ≥99% methyl isobutyl ketone (MIBK), 99% HMF, 98% levulinic acid, 99% formic acid, ≥99.9% acetonitrile, 99.5% D-(+)-glucose, 98% sulfuric acid, 99.95% potassium hydrogen phthalate, phenolphthalein, and 99.5% sodium hydroxide were all purchased from MilliporeSigma, USA. Amberlyst® 15(H) dry was purchased from Alfa Aesar, USA, 99.99% aluminum chloride was obtained from Strem Chemicals, USA, and 99% 2-butanol and 99% D-(−)-fructose from Acros Organics, USA. 5 kDa nominal molecular weight limit (NMWL) Biomax polyethersulfone ultrafiltration discs were obtained from MilliporeSigma, USA, and used in 75 and 500 mL Amicon stirred ultrafiltration cells. Milli-Q water (∼18 MΩ cm−1) was used for all the experiments.Catalyst synthesis
In a typical synthesis, 1 g of PSSA (Mw = 1000 kDa) was dissolved in 30 mL of anhydrous methanol, and an appropriate mass of AlCl3 was dissolved in 20 mL of anhydrous ethanol in separate flasks. To ensure uniform dissolution, the methanolic solution of PSSA and ethanolic solution of AlCl3 were stirred independently for 1 h, after which the AlCl3–ethanol mixture was transferred to the PSSA–methanol mixture with the aid of a peristaltic pump at a flow rate of about 0.6 mL min−1. Then, the PSSA–AlCl3 alcoholic solution was stirred at 1000 rpm for 3 h at room temperature. The solution was then ultrafiltered using a 5 kDa Biomax polyethersulfone membrane. The retentate was casted and dried overnight at 60 °C. A series of PSSA–AlCl3 catalysts with different Brønsted![[thin space (1/6-em)]](https://www.rsc.org/images/entities/char_2009.gif) :
:![[thin space (1/6-em)]](https://www.rsc.org/images/entities/char_2009.gif) Lewis acid ratios was synthesized, and these catalysts were labeled as 1000-PSSA-AlCl3X, where 1000 indicates Mw in kDa and X indicates the actual H+/Al mole ratio obtained from characterization (e.g., 1000-PSSA-AlCl3 4.0 is the 1000 kDa catalyst with an actual H+/Al mole ratio of 4). As previously stated, our goal was to synthesize soluble and reusable polymer-based catalysts with both Brønsted and Lewis acid sites; however, by following the protocol described above, the 1000-PSSA-AlCl3 4.0 preparation resulted in the precipitation of the polymer. We believe this could be due to increased crosslinking and reduced hydrophilicity by consumption of sulfonic groups, although it could also be that the volume of alcohols used was insufficient to maintain the polymer in solution during the synthesis. For this reason, we decided to modify the synthesis by using PSSA with a lower Mw of 200 kDa and larger volumes of alcohols.
Lewis acid ratios was synthesized, and these catalysts were labeled as 1000-PSSA-AlCl3X, where 1000 indicates Mw in kDa and X indicates the actual H+/Al mole ratio obtained from characterization (e.g., 1000-PSSA-AlCl3 4.0 is the 1000 kDa catalyst with an actual H+/Al mole ratio of 4). As previously stated, our goal was to synthesize soluble and reusable polymer-based catalysts with both Brønsted and Lewis acid sites; however, by following the protocol described above, the 1000-PSSA-AlCl3 4.0 preparation resulted in the precipitation of the polymer. We believe this could be due to increased crosslinking and reduced hydrophilicity by consumption of sulfonic groups, although it could also be that the volume of alcohols used was insufficient to maintain the polymer in solution during the synthesis. For this reason, we decided to modify the synthesis by using PSSA with a lower Mw of 200 kDa and larger volumes of alcohols.
![[thin space (1/6-em)]](https://www.rsc.org/images/entities/char_2009.gif) :
:![[thin space (1/6-em)]](https://www.rsc.org/images/entities/char_2009.gif) Lewis acid ratios was synthesized, and these catalysts were labeled as 200-PSSA-AlCl3X, where 200 indicates Mw in kDa and X indicates the actual H+/Al mole ratio (e.g., 200-PSSA-AlCl3 4.0 is the 200 kDa catalyst with an actual H+/Al mole ratio of 4).
Lewis acid ratios was synthesized, and these catalysts were labeled as 200-PSSA-AlCl3X, where 200 indicates Mw in kDa and X indicates the actual H+/Al mole ratio (e.g., 200-PSSA-AlCl3 4.0 is the 200 kDa catalyst with an actual H+/Al mole ratio of 4).
Characterization of the fresh and used 200-PSSA and 200-PSSA-AlCl3 catalysts
Measurements of catalytic activity
![[thin space (1/6-em)]](https://www.rsc.org/images/entities/char_2009.gif) :
:![[thin space (1/6-em)]](https://www.rsc.org/images/entities/char_2009.gif) 3 v/v) was added to the pressure tube, closed with a front-seal cap with CAPFE O-ring, and the reactions were carried out at 150 °C using a stirred silicon oil bath (1000 rpm). Notably, water/MIBK–2-butanol biphasic media have been previously reported in the literature for the one-pot synthesis of HMF from glucose.58 However, all of them used salts (e.g., NaCl) in the aqueous phase to improve the partitioning of HMF in the organic solvent, known as the “salting-out effect”. In our case, since the addition of NaCl is incompatible with the use of PSSA because this would revert it back to NaPSS with the release of H+, we compensated for this by the addition of a larger volume of organic phase for efficient HMF extraction. Upon completion, the reactor was immersed in an ice bath to stop the reaction, and aqueous and organic phases were separated. Details about the analysis of aqueous and organic phases can be found in the ESI.†
3 v/v) was added to the pressure tube, closed with a front-seal cap with CAPFE O-ring, and the reactions were carried out at 150 °C using a stirred silicon oil bath (1000 rpm). Notably, water/MIBK–2-butanol biphasic media have been previously reported in the literature for the one-pot synthesis of HMF from glucose.58 However, all of them used salts (e.g., NaCl) in the aqueous phase to improve the partitioning of HMF in the organic solvent, known as the “salting-out effect”. In our case, since the addition of NaCl is incompatible with the use of PSSA because this would revert it back to NaPSS with the release of H+, we compensated for this by the addition of a larger volume of organic phase for efficient HMF extraction. Upon completion, the reactor was immersed in an ice bath to stop the reaction, and aqueous and organic phases were separated. Details about the analysis of aqueous and organic phases can be found in the ESI.†
![[thin space (1/6-em)]](https://www.rsc.org/images/entities/char_2009.gif) :
:![[thin space (1/6-em)]](https://www.rsc.org/images/entities/char_2009.gif) 3 v/v) to continuously extract HMF as soon as it was formed. The reactor was then closed with a front-seal cap with CAPFE O-ring, and reactions were carried out at 150 °C between 1 and 4 h using a stirred silicon oil bath (1000 rpm). Upon completion, the reactor was immersed in an ice bath to stop the reaction, and aqueous and organic phases were separated. Details about the analysis of aqueous and organic phases can be found in the ESI.†
3 v/v) to continuously extract HMF as soon as it was formed. The reactor was then closed with a front-seal cap with CAPFE O-ring, and reactions were carried out at 150 °C between 1 and 4 h using a stirred silicon oil bath (1000 rpm). Upon completion, the reactor was immersed in an ice bath to stop the reaction, and aqueous and organic phases were separated. Details about the analysis of aqueous and organic phases can be found in the ESI.†
![[thin space (1/6-em)]](https://www.rsc.org/images/entities/char_2009.gif) :
:![[thin space (1/6-em)]](https://www.rsc.org/images/entities/char_2009.gif) 3 v/v) was added for continuous extraction of HMF. The reactions were performed at 150 °C for 1 h to obtain low glucose conversions that would allow us to monitor the potential deactivation of the catalyst. Upon completion, the reactor was immersed in an ice bath to stop the reaction, and the aqueous and organic phases were separated. The aqueous phase was then centrifuged at 1400 rpm to remove insoluble humins, and ultrafiltered using an Amicon stirred cell with a 5 kDa NMWL Biomax polyethersulfone membrane. Then, both the retentate and water used to rinse the cell several times were added to the glass tube. The reactor was then dried to evaporate the water, and the contained catalyst was used for a subsequent run. Acid–base titrations of the filtrate solutions were performed to assess the potential leaching of sulfonic groups.
3 v/v) was added for continuous extraction of HMF. The reactions were performed at 150 °C for 1 h to obtain low glucose conversions that would allow us to monitor the potential deactivation of the catalyst. Upon completion, the reactor was immersed in an ice bath to stop the reaction, and the aqueous and organic phases were separated. The aqueous phase was then centrifuged at 1400 rpm to remove insoluble humins, and ultrafiltered using an Amicon stirred cell with a 5 kDa NMWL Biomax polyethersulfone membrane. Then, both the retentate and water used to rinse the cell several times were added to the glass tube. The reactor was then dried to evaporate the water, and the contained catalyst was used for a subsequent run. Acid–base titrations of the filtrate solutions were performed to assess the potential leaching of sulfonic groups.
Techno-economic analysis
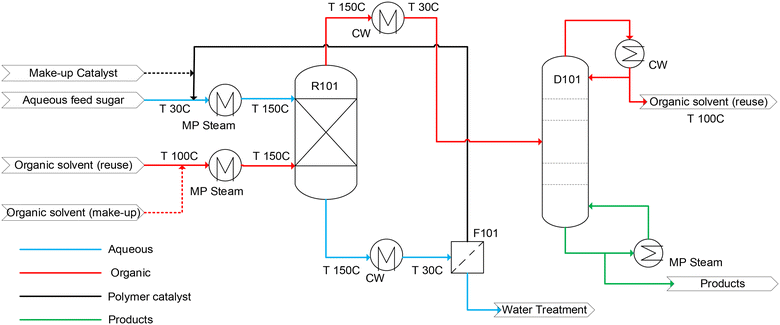
Based on the experimental results, we performed a techno-economic assessment for the production of HMF from glucose with the 200-PSSA-AlCl3 4.0 catalyst. A process flow model (Fig. 3) was developed for an aqueous feed of 9.1 wt% glucose at a flow rate of 10 MT h−1 (dry-sugar basis). In the process design, the dehydration of glucose occurs in a packed bed reactor-extractor (R101) where an aqueous stream containing glucose and 200-PSSA-AlCl3 4.0 and an organic solvent stream are fed counter-currently. After reaction, the aqueous stream is sent to an ultrafiltration unit (F101) to recover the polymer catalyst for re-use, and the organic stream is sent to a distillation unit (D101) for product and solvent recovery. Mass and energy balance calculations across the reactor were performed based on experimental results and enthalpy differences between feed and product streams in MS Excel. The equipment size was estimated based on liquid hold-up volume and experimentally determined residence time.59 Next, data of the organic phase on the reactor outlet stream was fed as input to a distillation unit in Aspen Plus to determine the number of stages, reboiler, and condenser duty. To recover the polymer catalyst, the membrane area required was estimated based on the typical flux of 50 L m−2 h−1 in commercial ultrafiltration modules.60 Intermediate heat exchangers were designed based on heat duty obtained from the enthalpy difference of process streams.Capital costs of all equipment were determined using CAPCOST® – an MS Excel-based program that uses a module-costing approach.61 A Chemical Engineering Plant Cost Index (CEPCI) value of 805 was used to estimate installed capital cost based on 2022$.62 The cost of land was assessed to be $0.5M and is consistent with previous techno-economic models for the conversion of lignocellulosic biomass to hydrocarbons.63 A 2-year construction period was assumed, and the capital investment was uniformly distributed over this period. Total fixed capital investment excluding land (FCIL) was estimated from the sum of the total module cost of all equipment and capital and operating costs of the ultrafiltration unit were determined using correlations provided by Guo et al.64 The cost of manufacturing (COM) was determined based on the cost of raw material (CRM), cost of utility (CUT), cost of wastewater treatment (CWT), and cost of operating labor (COL). CRM was determined based on estimates of material consumed in the process, where an additional 10% was added to make up for annual process losses of all recycled chemicals and catalyst. Replacement of all recycled chemicals and catalyst was accounted for every 3 years and was distributed to the annual cost of raw material. A feedstock price of $0.30 per kg of glucose was used19 and the price of the catalyst ($15 per kg) was assumed to be 5 times the cost of its raw materials – PSSA and AlCl3. Prices of other chemicals are listed in Table 1. To estimate the CUT, medium-pressure steam was assumed as a heating utility at the price of $4.77 per GJ,65 electricity at a price of $0.07 per kWh to pump process fluids,66 and cooling water at a price of $0.378 per GJ. A wastewater treatment cost of $0.5M per year was added to the cost of manufacturing, and operating labor was estimated based on the number and type of equipment. Working capital estimates were factored from CRM, cost of land, and COL. Parameters used for the techno-economic analysis are listed in Table 2.
| Material/utility | Price | Total operating cost | Comment/references | |
|---|---|---|---|---|
| $ | M$ | % | ||
| Glucose, kg | 0.30 | 25.95 | 66.8 | 63 |
| MIBK, kg | 1.00 | 0.61 | 1.6 | Market price |
| 2-Butanol, kg | 1.00 | 0.30 | 0.8 | Market price |
| 200-PSSA-AlCl3 4.0, kg | 15.0 | 0.72 | 1.9 | 5 × [market price of PSSA ($4 per kg) + AlCl3 ($1 per kg)] |
| Steam, GJ | 4.77 | 8.53 | 22.0 | 61, 65 |
| Cooling water, GJ | 0.38 | 0.63 | 1.6 | 61, 65 |
| Electricity, kWh | 0.07 | 0.24 | 0.6 | 66 |
| Wastewater treatment | Lumpsum | 0.5 | 1.3 | 63 |
| Operating labor | Lumpsum | 0.87 | 2.2 | 63 |
| Ultrafiltration | Flow rate correlation | 0.49 | 1.3 | 64 |
| Total (M$) | 38.84 | |||
| Parameter | Value | Units |
|---|---|---|
| Capacity (9.1 wt% glucose) | 10![[thin space (1/6-em)]](https://www.rsc.org/images/entities/char_2009.gif) 000 000 |
kg h−1 (dry basis) |
| Operating hours | 8650 | h per year |
| Project life | 20 | Years |
| Construction period | 2 | Years |
| Taxation rate | 21% | — |
| Annual interest rate | 10% | — |
| Total module factor | 1.18 | — |
| CEPCI | 805 | — |
| Cost of land | 0.5 | $M |
| Depreciation | 7-year MACRS | — |
Catalyst![[thin space (1/6-em)]](https://www.rsc.org/images/entities/char_2009.gif) : :![[thin space (1/6-em)]](https://www.rsc.org/images/entities/char_2009.gif) sugar sugar |
0.33 | kg/kg |
| Solvent ratio | 6 | v/v |
Revenue was generated by the sale of HMF. Net present value (NPV) was determined using discounted cash flow analysis with a discount rate of 10% and a taxation rate of 21%, which includes federal and state taxes.61 Capital equipment was depreciated in accordance with the 7-year modified accelerated cost recovery system (MACRS), and salvage value was assessed as 10% of FCIL after the project-life of 20 years. To determine the minimum furan selling price (MFSP), the selling price of furans was iterated to obtain a NPV approximately equal to zero. Although the process also generates levulinic acid, formic acid, and humins as by-products, these are too low to be recovered economically; thereby, minor streams are processed in the wastewater treatment plant.
Results and discussion
Phase diagram to identify the solvent ratio for solubility of AlCl3 and PSSA
Solubility studies were performed to ensure the crosslinking between PSSA and AlCl3 without precipitation of its components. To do so, the volume of ethanol was kept constant while changing the volume of methanol and the masses of 1000 kDa PSSA (1000-PSSA) catalyst and AlCl3. Fig. S1† shows the phase diagram obtained, where the green and purple areas indicate the solubility (1 phase) or macroscopic precipitation (2 phases) of 1000-PSSA and AlCl3, respectively, in different alcoholic mixtures. As the MeOH/(MeOH + EtOH) ratio of 0.6 resulted in the maximum solubility of both 1000-PSSA and AlCl3, that ratio was chosen to carry out all PSSA–AlCl3 syntheses. As previously stated, when 1000-PSSA was used to synthesize 1000-PSSA-AlCl3 catalysts, H+/Al mole ratios ≤4 resulted in the precipitation of the polymer catalysts. As a result, we decided to modify the synthesis by using a shorter-chain PSSA (200 kDa) and a larger volume of alcohol (Table S1†) while maintaining a MeOH/(MeOH + EtOH) volume ratio of 0.6. When 200 kDa PSSA (200-PSSA) was used, we were able to synthesize a series of catalysts with different H+/Al mole ratios ranging from 17.2 to 1.2, which reflects different degrees of AlCl3 incorporation to PSSA.Acid–base titration of 200-PSSA and 200-PSSA-AlCl3 catalysts
The amount of Brønsted acid sites on 200-PSSA and 200-PSSA-AlCl3 was determined by acid–base titration using a standardized 0.01 N NaOH solution. Table 3 shows the average values from three titrations. Table 3 and Fig. 4 also show the actual Al loading obtained by ICP-MS. As expected, there is a decrease in the content of Brønsted acid sites (H+) due to the incorporation of AlCl3 into the polymer structure.| Catalyst | Brønsted acid sites (mmol H+ gcat−1) | Al loading (mmol Al gcat−1) | H+/Al mole ratio |
|---|---|---|---|
| 200-PSSA | 5.40 | N/A | N/A |
| 200-PSSA-AlCl3 17.2 | 5.00 | 0.29 | 17.2 |
| 200-PSSA-AlCl3 7.4 | 4.63 | 0.63 | 7.4 |
| 200-PSSA-AlCl3 5.0 | 4.60 | 0.93 | 5.0 |
| 200-PSSA-AlCl3 4.0 | 4.44 | 1.10 | 4.0 |
| 200-PSSA-AlCl3 3.6 | 4.38 | 1.22 | 3.6 |
| 200-PSSA-AlCl3 3.0 | 4.11 | 1.35 | 3.0 |
| 200-PSSA-AlCl3 2.7 | 3.94 | 1.48 | 2.7 |
| 200-PSSA-AlCl3 1.7 | 2.71 | 1.56 | 1.7 |
| 200-PSSA-AlCl3 1.2 | 2.27 | 1.89 | 1.2 |
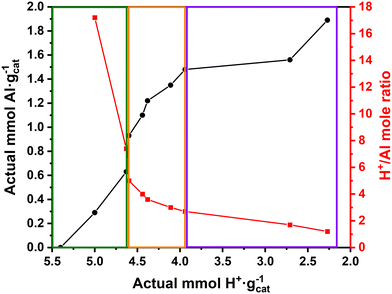 | ||
| Fig. 4 Actual H+vs. Al content and H+/Al mole ratio on 200-PSSA-AlCl3 catalysts upon addition of AlCl3. | ||
Inductively Coupled Plasma – Mass Spectrometry (ICP-MS) analysis of 200-PSSA-AlCl3 catalysts
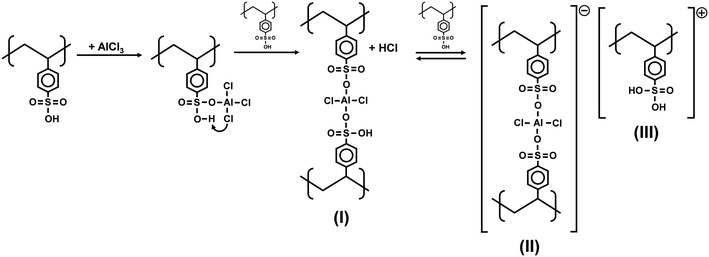
ICP-MS analyses were conducted to determine the amount of aluminum successfully incorporated into the polymer structure. Table 3 and Fig. 4 show that the Al content increases upon addition of AlCl3 while the concentration of Brønsted acid sites (H+) decreases. Fig. 4 also shows how the H+/Al mole ratio varied as AlCl3 was incorporated into PSSA. Remarkably, three different regions can be clearly observed in Fig. 4: one at low AlCl3 loadings with slow incorporation of Al (left), another in which there is a fast increase in the Al content while the H+ concentration is only slightly reduced (middle), and a final one in which the incorporation of Al plateaus at higher AlCl3 loadings (right). As suggested by Magnotta et al. and Wang et al.,55,56,67 we also expect AlCl3 to be incorporated between two sulfonic groups to form structure (I) with the release of HCl (Fig. 5). Then, unstable structure (I) can reversibly form structures (II) and (III) in the presence of another sulfonic group (Fig. 5). As a result, Fig. 4 would be consistent with that mechanism, as the equilibrium between structures (I) and (II) & (III) would be affected by the number of Brønsted acid sites available during the synthesis.Thermogravimetric Analysis (TGA) of 200-PSSA and 200-PSSA-AlCl3 catalysts
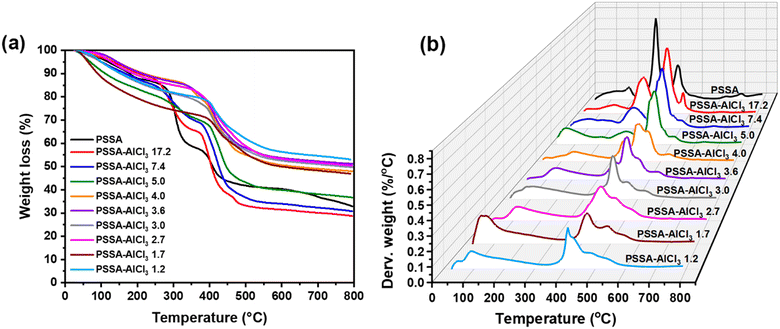
Fig. 6 compares the weight loss and derivative weight loss curves obtained from 200-PSSA and 200-PSSA-AlCl3 catalysts. The weight loss before 200 °C was attributed to the loss of water, which is due to the hygroscopic nature of the polymer.51,52 The loss of weight between 225–375 °C corresponds to the decomposition of the sulfonic groups, as reported elsewhere.51,52 As shown in the derivative weight plot (Fig. 6(b)), there is a gradual decrease in the intensity of this evolution upon the addition of AlCl3, which is due to the consumption of sulfonic groups by crosslinking with AlCl3. Interestingly, the decomposition of sulfonic groups on PSSA-AlCl3 4.0 and PSSA-AlCl3 3.6 catalysts occurred at higher temperatures (shoulder centered at around 350 °C), which might be attributed to the increased stability of the remaining sulfonic groups. Finally, the evolution beyond 400 °C corresponds to the decomposition of the polystyrene backbone.51,52 As AlCl3 is added to the PSSA structure to form PSSA–AlCl3 catalysts, the decomposition of the as-synthesized materials occurs at higher temperatures, which is attributed to the increased rigidity due to crosslinking.Micro-Attenuated Total Reflection Fourier Transform Infrared Spectroscopy (Micro-ATR FTIR) analysis of 200-PSSA and 200-PSSA-AlCl3 catalysts
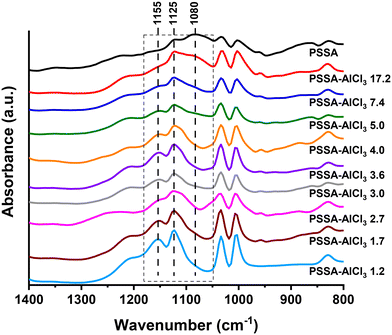
To better understand the nature of 200-PSSA and 200-PSSA-AlCl3 catalysts, materials were also characterized by FTIR in micro-ATR mode. Assuming that the structure of the aromatic rings remained intact upon the addition of AlCl3, all spectra were normalized using the intensity of the band at 1600 cm−1, which is attributed to the C![[double bond, length as m-dash]](https://www.rsc.org/images/entities/char_e001.gif) C vibrations in the aromatic ring.68 As shown in Fig. 7, all spectra look similar except for the bands at 1080, 1125, and 1155 cm−1. The band at 1080 cm−1 is assigned to the symmetric stretching vibration of –SO3−,68 and this decreases as the number of sulfonic groups is reduced by the incorporation of AlCl3. On the other hand, the bands at 1125 and 1155 cm−1 increase their intensity upon addition of AlCl3, which clearly indicates that AlCl3 is modifying the sulfonic groups, although these bands are more difficult to interpret due to the coexistence of structures (I), (II), and (III) (Fig. 5).
C vibrations in the aromatic ring.68 As shown in Fig. 7, all spectra look similar except for the bands at 1080, 1125, and 1155 cm−1. The band at 1080 cm−1 is assigned to the symmetric stretching vibration of –SO3−,68 and this decreases as the number of sulfonic groups is reduced by the incorporation of AlCl3. On the other hand, the bands at 1125 and 1155 cm−1 increase their intensity upon addition of AlCl3, which clearly indicates that AlCl3 is modifying the sulfonic groups, although these bands are more difficult to interpret due to the coexistence of structures (I), (II), and (III) (Fig. 5).
Catalytic studies
![[thin space (1/6-em)]](https://www.rsc.org/images/entities/char_2009.gif) :
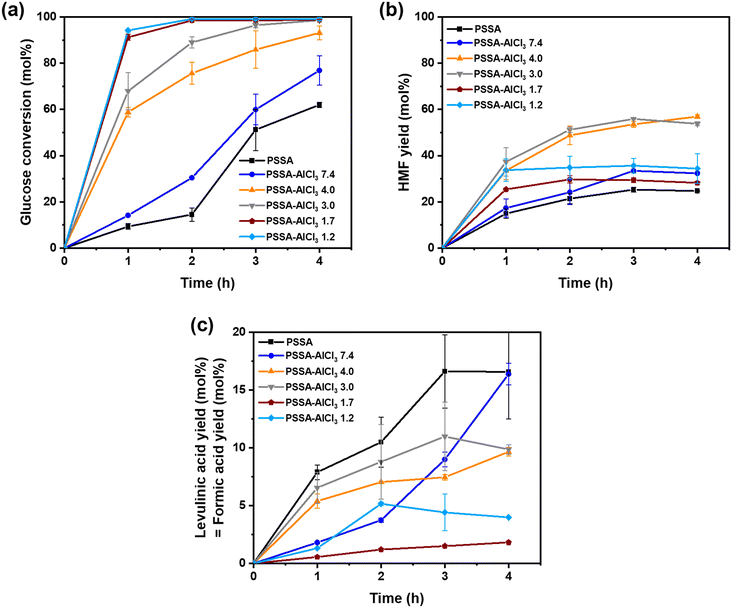
:![[thin space (1/6-em)]](https://www.rsc.org/images/entities/char_2009.gif) Lewis acid ratios, the amount of Brønsted acid sites (H+) was kept constant in all experiments. Fig. 8 shows the glucose conversion, HMF yield, and levulinic acid (= formic acid) yield obtained with 200-PSSA and 200-PSSA-AlCl3 catalysts in the production of HMF from glucose (9.1 wt% solution in water). Low glucose conversion (60 mol%) and HMF yield (25 mol%) were recorded when using the 200-PSSA catalyst, which was expected as the acid-catalyzed dehydration of glucose in water is not selective toward HMF. This is because glucose in solution only contains 1% of furanose isomer with a structure similar to HMF, thus complicating the direct conversion of glucose into HMF.69–71 In order to improve the glucose conversion and subsequent production of HMF, we explored the use of 200-PSSA-AlCl3 catalysts with different Brønsted
Lewis acid ratios, the amount of Brønsted acid sites (H+) was kept constant in all experiments. Fig. 8 shows the glucose conversion, HMF yield, and levulinic acid (= formic acid) yield obtained with 200-PSSA and 200-PSSA-AlCl3 catalysts in the production of HMF from glucose (9.1 wt% solution in water). Low glucose conversion (60 mol%) and HMF yield (25 mol%) were recorded when using the 200-PSSA catalyst, which was expected as the acid-catalyzed dehydration of glucose in water is not selective toward HMF. This is because glucose in solution only contains 1% of furanose isomer with a structure similar to HMF, thus complicating the direct conversion of glucose into HMF.69–71 In order to improve the glucose conversion and subsequent production of HMF, we explored the use of 200-PSSA-AlCl3 catalysts with different Brønsted![[thin space (1/6-em)]](https://www.rsc.org/images/entities/char_2009.gif) :
:![[thin space (1/6-em)]](https://www.rsc.org/images/entities/char_2009.gif) Lewis acid ratios. As shown in Fig. 8, both the glucose conversion and HMF yield increased when increasing the Al content (concentration of Lewis acid sites) until reaching a maximum HMF yield of ∼55 mol% with the 200-PSSA-AlCl3 4.0 catalyst. This is attributed to an enhanced isomerization of glucose to fructose by intramolecular hydride shift,33,69,70 which results in a higher concentration of furanose isomers in solution that can be readily converted into HMF.71 The long induction period observed in the conversion of glucose with 200-PSSA and 200-PSSA-AlCl3 7.4 catalysts is due to the absence or low content of Lewis acid sites, which results in the slow direct dehydration of glucose to HMF without the intermediate isomerization step. In addition, it can be observed that the carbon balance does not close in any case, which is attributed to the formation of humins.
Lewis acid ratios. As shown in Fig. 8, both the glucose conversion and HMF yield increased when increasing the Al content (concentration of Lewis acid sites) until reaching a maximum HMF yield of ∼55 mol% with the 200-PSSA-AlCl3 4.0 catalyst. This is attributed to an enhanced isomerization of glucose to fructose by intramolecular hydride shift,33,69,70 which results in a higher concentration of furanose isomers in solution that can be readily converted into HMF.71 The long induction period observed in the conversion of glucose with 200-PSSA and 200-PSSA-AlCl3 7.4 catalysts is due to the absence or low content of Lewis acid sites, which results in the slow direct dehydration of glucose to HMF without the intermediate isomerization step. In addition, it can be observed that the carbon balance does not close in any case, which is attributed to the formation of humins.
However, Fig. 8(b) shows that the HMF yield decreased when using catalysts with a high concentration of Lewis acid sites (200-PSSA-AlCl3 1.7 and 1.2). Although high glucose conversions were obtained with those two catalysts, the HMF yield was low due to the imbalance between Brønsted and Lewis acid sites. Additionally, part of the reduced activity of 200-PSSA-AlCl3 1.7 and 1.2 catalysts could be attributed to their reduced solubility in water due to their lower content of sulfonic groups and/or higher molecular weight due to crosslinking. As expected, the levulinic acid (and formic acid) yields were smaller when using the catalysts with lower Brønsted acidity (Fig. 8(c)). Since the mass balance ranged between 75–90 wt% in all cases, being higher at lower reaction times, it can be concluded that the production of humins was significant at longer reaction times.
| Cycle # | mmol H+ in the filtrate (% mmol H+ leacheda) | mmol H+ used to normalize the TOF plot (Fig. 10(b)) |
|---|---|---|
| a Initial: 1.551 mmol H+;0.479 mmol H+ total leached; (0.479/1.551)·100 = 30.8% mmol H+ lost (after 5 cycles). | ||
| 1 | 0.051 (3.3%) | 0.33 g × 4.7 mmol H+ gcat−1 = 1.551 (1st cycle) |
| 2 | 0.044 (2.8%) | 1.551–0.051 = 1.500 (2nd cycle) |
| 3 | 0.123 (7.9%) | 1.500–0.044 = 1.456 (3rd cycle) |
| 4 | 0.138 (8.9%) | 1.456–0.123 = 1.333 (4th cycle) |
| 5 | 0.123 (7.9%) | 1.333–0.138 = 1.195 (5th cycle) |
| Catalyst | Titration | ICP-OES (wt%) | Elemental analysis (wt%) | |||
|---|---|---|---|---|---|---|
| mmol H+ gcat−1 | Al | Cl | C | H | S | |
| 200-PSSA-AlCl3 4.8 fresh | 4.7 | 2.63 | <1.07 | 42.42 | 6.04 | 14.95 |
| 200-PSSA-AlCl3 4.8 used (after 5 cycles) | 3.2 | 0.57 | <1.22 | 53.23 | 5.96 | 9.53 |
| 200-PSSA-AlCl3 4.8 used (after 5 cycles), considering mass change | 3.7 | 0.66 | <1.41 | 61.68 | 6.91 | 11.02 |
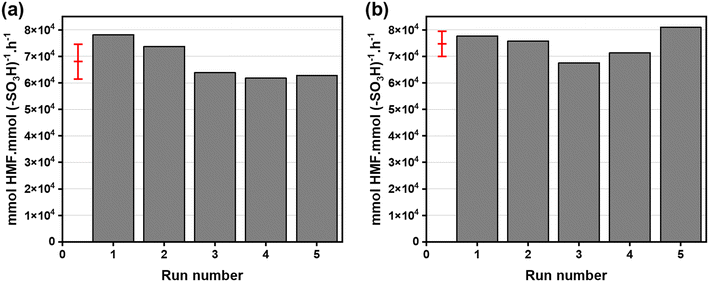
To further study the potential deactivation of the catalyst, the filtrates after the first and fifth cycles were also analyzed by ICP-OES. While the Al and Cl contents were <0.00078 ppm and <8500 ppm after the first cycle, these were of 9 ppm and 10![[thin space (1/6-em)]](https://www.rsc.org/images/entities/char_2009.gif) 900 ppm after the fifth one. Table 6 shows those values translated into mmol Al and mmol Cl in the filtrates. Those are negligible compared with the 0.322 mmol Al on the loaded catalyst (330 mg of 200-PSSA-AlCl3 4.8 with 2.63 wt% Al); therefore, that would not explain the loss of Al observed in Table 5. An explanation could be that an insoluble aluminum species (e.g., boehmite, AlO(OH)) was formed, and this was separated from the aqueous medium during the centrifugation step prior to ultrafiltration.72
900 ppm after the fifth one. Table 6 shows those values translated into mmol Al and mmol Cl in the filtrates. Those are negligible compared with the 0.322 mmol Al on the loaded catalyst (330 mg of 200-PSSA-AlCl3 4.8 with 2.63 wt% Al); therefore, that would not explain the loss of Al observed in Table 5. An explanation could be that an insoluble aluminum species (e.g., boehmite, AlO(OH)) was formed, and this was separated from the aqueous medium during the centrifugation step prior to ultrafiltration.72
| Cycle # | mmol Al in filtrate | mmol Cl in filtrate |
|---|---|---|
| 1 | <4.20 × 10⁻⁷ | <3.48 × 10⁻⁴ |
| 5 | 4.84 × 10⁻⁷ | 4.46 × 10⁻⁴ |
It is known that, in an aqueous medium, AlCl3 dissociates to form metal cations. Then, those metal ions are solvated by water forming complexes, such as [Al(H2O6)]3+], that can be hydrolyzed according to eqn (1) with the release of a proton.72
| [Al(H2O)6]3+ + xH2O ⇌ [Al(H2O)6−x(OH)x](3−x)+ + xH3O+ | (1) |
![[thin space (1/6-em)]](https://www.rsc.org/images/entities/char_2009.gif) :
:![[thin space (1/6-em)]](https://www.rsc.org/images/entities/char_2009.gif) aqueous solvent ratio of 6. The operating cost was of $38.84M, where the feedstock cost was the dominating factor (67%). Detailed break-up of operating and capital costs is listed in Tables 1 and 7. The MFSP was estimated to be $1.94 per kg-HMF from an aqueous glucose feed at a price of $0.30 per kg-glucose. Earlier, Torres et al.74 conducted a techno-economic analysis of an HCl-based process and estimated an MFSP of $1.78 per kg-HMF from corn-based fructose as starting material ($0.55 per kg-fructose). The estimates of MFSP from the process here reported are similar to the selling price estimates of the process modeled by Torres et al.,74 especially when previously reported MFSP values are corrected to 2022$.75 The advantage of our process, however, is potentially lower environmental impact due to catalyst reuse. More recently, Motagamwala et al.19 estimated an MFSP of $1.71 per kg-HMF in a process where the dehydration of 25% fructose ($0.816 per kg) was performed in a water–acetone solvent system and $1.46 per kg-HMF when using 25% glucose ($0.236 per kg). Although those MFSP values seem more promising than the value here presented, it must be taken into account that our process is much simpler since pre-isomerization of glucose to fructose is not included. It is likely that including (at least a partial) feed isomerization will lower the MFSP of the PSSA-based dehydration process, similar to improvements reported by Motagamwala et al. when upstream feed isomerization was included in their HMF process.19
aqueous solvent ratio of 6. The operating cost was of $38.84M, where the feedstock cost was the dominating factor (67%). Detailed break-up of operating and capital costs is listed in Tables 1 and 7. The MFSP was estimated to be $1.94 per kg-HMF from an aqueous glucose feed at a price of $0.30 per kg-glucose. Earlier, Torres et al.74 conducted a techno-economic analysis of an HCl-based process and estimated an MFSP of $1.78 per kg-HMF from corn-based fructose as starting material ($0.55 per kg-fructose). The estimates of MFSP from the process here reported are similar to the selling price estimates of the process modeled by Torres et al.,74 especially when previously reported MFSP values are corrected to 2022$.75 The advantage of our process, however, is potentially lower environmental impact due to catalyst reuse. More recently, Motagamwala et al.19 estimated an MFSP of $1.71 per kg-HMF in a process where the dehydration of 25% fructose ($0.816 per kg) was performed in a water–acetone solvent system and $1.46 per kg-HMF when using 25% glucose ($0.236 per kg). Although those MFSP values seem more promising than the value here presented, it must be taken into account that our process is much simpler since pre-isomerization of glucose to fructose is not included. It is likely that including (at least a partial) feed isomerization will lower the MFSP of the PSSA-based dehydration process, similar to improvements reported by Motagamwala et al. when upstream feed isomerization was included in their HMF process.19
| Equipment | Equipment cost ($M) | ||
|---|---|---|---|
| Bare module cost | Total module cost | Total module cost (%) | |
| Dehydration reactor | 33.19 | 39.16 | 77.1 |
| Distillation | 0.67 | 0.80 | 1.6 |
| Heat exchangers | 4.44 | 5.24 | 10.3 |
| Pumps | 1.26 | 1.49 | 2.9 |
| Ultrafiltration | — | 4.13 | 8.1 |
| Total | 50.82 | ||
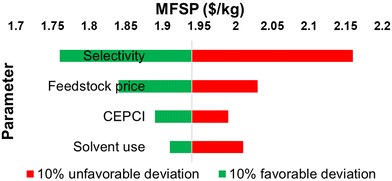
Fig. 11 shows the results from a sensitivity analysis of the process by accounting for 10% favorable and unfavorable variations in the process due to uncertainty and market forces. Selectivity towards HMF was found to be the most sensitive parameter. The MFSP can be reduced to $1.76 per kg-HMF if the HMF yield can be improved by 10% to 62.7 mol%. This improvement can potentially be achieved by staged operation of isomerization and dehydration reactions at different temperatures, fine tuning of the catalyst, and efficient concurrent removal of products from the reaction mixture. If the feedstock price is reduced by 10%, MFSP decreases to $1.84 per kg. The price of sugar from a bio-refinery can be reduced if high-value products can be made from lignin. With solvent minimization by 10%, MFSP decreases to $1.91 per kg due to energy-savings and equipment volume reduction. Additionally, a drop in CEPCI by 10% would decrease the MFSP to $1.89 per kg.
Conclusions
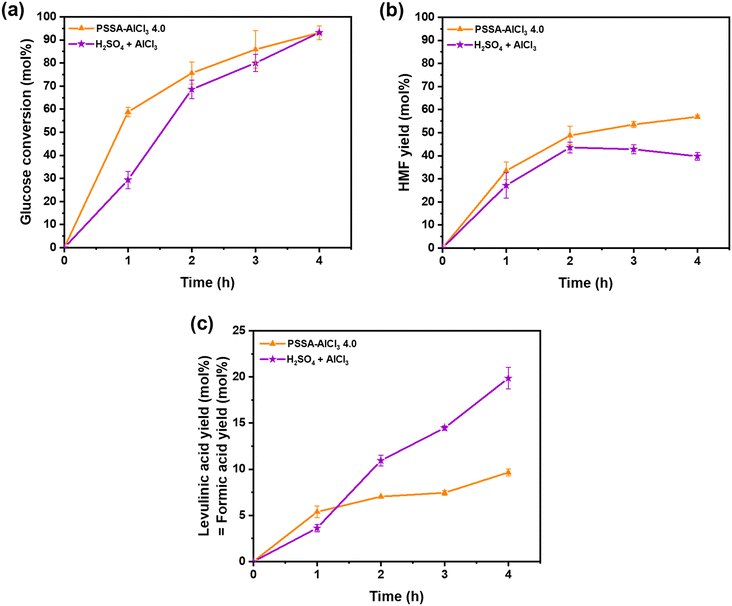
We developed a series of soluble and reusable polystyrene-based catalysts containing both Brønsted and Lewis acid sites for the valorization of highly concentrated solutions of glucose to HMF. These were synthesized by successful incorporation of AlCl3 (Lewis acidity) into polystyrene sulfonic acid (Brønsted acidity) in an alcoholic medium. Among them, the 200-PSSA-AlCl3 4.0 catalyst (H+/Al mole ratio of 4) outperformed all others, likely due to an optimum combination of Lewis and Brønsted acid sites for glucose isomerization, fructose dehydration to HMF, and solubility in the reaction medium. This polymer-based catalyst presented similar catalytic activity as a combination of pure homogeneous catalysts (H2SO4 + AlCl3), although it showed two important advantages: (i) can be recovered by ultrafiltration for further use and (ii) lower generation of side products, which is beneficial from a separation point of view. 200-PSSA-AlCl3 4.8 (H+/Al mole ratio of 4.8) was effectively reused up to five times without significant loss of activity, and the techno-economic analysis of the process reported a minimum selling price of $1.94 per kg-HMF, a value similar to furan selling process reported in the literature for direct glucose conversion. Finally, this work presents an interesting proof of concept for the development of soluble and reusable multifunctional polymer catalysts, which could be expanded upon in a wide variety of new applications.Conflicts of interest
There are no conflicts to declare.Acknowledgements
This work was supported by the University of Toledo start-up funds and the Rocket Fuel Fund. The authors would like to thank the staff at the Center for Materials and Sensor Characterization (CMSC) at the University of Toledo for providing training on ATR and TGA. The authors are also grateful to S. J. Saluga and V. Bamunuarachchi for their invaluable contribution to this project, as well as G. Alba for the design of the graphical abstract. We would also like to acknowledge Z. Pittman, C. Kitchens, S. T. Nekkanti, F. Hauck, and F. C. F. Marcos for helping complete some experiments during the review process.References
- J. J. Bozell, Science, 2010, 329, 522–523 CrossRef PubMed.
- F. Cherubini, Energy Convers. Manage., 2010, 51, 1412–1421 CrossRef.
- S. Lim and L. K. Teong, Renewable Sustainable Energy Rev., 2010, 14, 938–954 CrossRef.
- S. Albonetti, C. Hu and S. Saravanamurugan, ChemSusChem, 2022, 15, e202201057 CrossRef PubMed.
- M. M. Seitkalieva, A. V. Vavina, A. V. Posvyatenko, K. S. Egorova, A. S. Kashin, E. G. Gordeev, E. N. Strukova, L. V. Romashov and V. P. Ananikov, ACS Sustainable Chem. Eng., 2021, 9, 3552–3570 CrossRef.
- D. Steinbach, A. Kruse, J. Sauer and P. Vetter, Energies, 2018, 11, 645 CrossRef.
- Y. Su, H. M. Brown, X. Huang, X.-d. Zhou, J. E. Amonette and Z. C. Zhang, Appl. Catal., A, 2009, 361, 117–122 CrossRef.
- R.-J. van Putten, J. C. van der Waal, E. de Jong, C. B. Rasrendra, H. J. Heeres and J. G. de Vries, Chem. Rev., 2013, 113, 1499–1597 CrossRef.
- T. Wang, M. W. Nolte and B. H. Shanks, Green Chem., 2014, 16, 548–572 RSC.
- Y. Wang, C. A. Brown and R. Chen, AIMS Microbiol., 2018, 4, 261–273 Search PubMed.
- T. Werpy and G. Petersen, Top Value Added Chemicals from Biomass: Volume I -- Results of Screening for Potential Candidates from Sugars and Synthesis Gas, National Renewable Energy Lab., Golden, CO (US), United States, 2004 Search PubMed.
- S. K. Burgess, J. E. Leisen, B. E. Kraftschik, C. R. Mubarak, R. M. Kriegel and W. J. Koros, Macromolecules, 2014, 47, 1383–1391 CrossRef.
- J. M. R. Gallo, D. M. Alonso, M. A. Mellmer and J. A. Dumesic, Green Chem., 2013, 15, 85–90 RSC.
- J. He, H. Li, S. Saravanamurugan and S. Yang, ChemSusChem, 2019, 12, 347–378 CrossRef.
- C. Wang, L. Zhang, T. Zhou, J. Chen and F. Xu, Sci. Rep., 2017, 7, 40908 CrossRef PubMed.
- A. Al Ghatta, J. D. E. T. Wilton-Ely and J. P. Hallett, Green Chem., 2021, 23, 1716–1733 RSC.
- R. Huang, W. Qi, R. Su and Z. He, Chem. Commun., 2010, 46, 1115–1117 RSC.
- I. Jiménez-Morales, A. Teckchandani-Ortiz, J. Santamaría-González, P. Maireles-Torres and A. Jiménez-López, Appl. Catal., B, 2014, 144, 22–28 CrossRef.
- A. H. Motagamwala, K. Huang, C. T. Maravelias and J. A. Dumesic, Energy Environ. Sci., 2019, 12, 2212–2222 RSC.
- L. Zhang, G. Xi, Z. Chen, Z. Qi and X. Wang, Chem. Eng. J., 2017, 307, 877–883 CrossRef CAS.
- T. Dallas Swift, H. Nguyen, A. Anderko, V. Nikolakis and D. G. Vlachos, Green Chem., 2015, 17, 4725–4735 RSC.
- S. Jia, Z. Xu and Z. C. Zhang, Chem. Eng. J., 2014, 254, 333–339 CrossRef CAS.
- M. Li, W. Li, Y. Lu, H. Jameel, H.-m. Chang and L. Ma, RSC Adv., 2017, 7, 14330–14336 RSC.
- F. Menegazzo, E. Ghedini and M. Signoretto, Molecules, 2018, 23, 2201 CrossRef PubMed.
- G. Portillo Perez, A. Mukherjee and M.-J. Dumont, J. Ind. Eng. Chem., 2019, 70, 1–34 CrossRef CAS.
- J. Tang, L. Zhu, X. Fu, J. Dai, X. Guo and C. Hu, ACS Catal., 2017, 7, 256–266 CrossRef CAS.
- Z.-L. Xu, X.-Y. Wang, M.-Y. Shen and C.-H. Du, Chem. Pap., 2016, 70, 1649–1657 CAS.
- Y. Yang, C. Hu and M. M. Abu-Omar, J. Mol. Catal. A: Chem., 2013, 376, 98–102 CrossRef CAS.
- X. Zhang, P. Murria, Y. Jiang, W. Xiao, H. I. Kenttämaa, M. M. Abu-Omar and N. S. Mosier, Green Chem., 2016, 18, 5219–5229 RSC.
- S. Kalidindi, MS thesis, The University of Toledo, 2017 Search PubMed.
- T. C. Acharjee and Y. Y. Lee, Environ. Prog. Sustainable Energy, 2018, 37, 471–480 CrossRef CAS.
- B. Agarwal, K. Kailasam, R. S. Sangwan and S. Elumalai, Renewable Sustainable Energy Rev., 2018, 82, 2408–2425 CrossRef CAS.
- I. Agirrezabal-Telleria, I. Gandarias and P. L. Arias, Catal. Today, 2014, 234, 42–58 CrossRef CAS.
- S. M. Al-Amsyar, F. Adam and E.-P. Ng, Surf. Interfaces, 2017, 9, 1–8 CrossRef CAS.
- V. Choudhary, A. B. Pinar, R. F. Lobo, D. G. Vlachos and S. I. Sandler, ChemSusChem, 2013, 6, 2369–2376 CrossRef CAS.
- V. Degirmenci, E. A. Pidko, P. C. M. M. Magusin and E. J. M. Hensen, ChemCatChem, 2011, 3, 969–972 CrossRef CAS.
- S. Despax, B. Estrine, N. Hoffmann, J. Le Bras, S. Marinkovic and J. Muzart, Catal. Commun., 2013, 39, 35–38 CrossRef CAS.
- Q. Guo, L. Ren, S. M. Alhassan and M. Tsapatsis, Chem. Commun., 2019, 55, 14942–14945 RSC.
- Q. Hou, M. Zhen, L. Liu, Y. Chen, F. Huang, S. Zhang, W. Li and M. Ju, Appl. Catal., B, 2018, 224, 183–193 CrossRef CAS.
- F. Huang, Y. Su, Y. Tao, W. Sun and W. Wang, Fuel, 2018, 226, 417–422 CrossRef CAS.
- C. M. Lew, N. Rajabbeigi and M. Tsapatsis, Ind. Eng. Chem. Res., 2012, 51, 5364–5366 CrossRef CAS.
- M. Ohara, A. Takagaki, S. Nishimura and K. Ebitani, Appl. Catal., A, 2010, 383, 149–155 CrossRef CAS.
- J. E. Romo, N. V. Bollar, C. J. Zimmermann and S. G. Wettstein, ChemCatChem, 2018, 10, 4805–4816 CrossRef.
- J. Siqueira Mancilha Nogueira, J. P. Alves Silva, S. I. Mussatto and L. Melo Carneiro, Energies, 2020, 13, 655 CrossRef.
- Q. Xu, Z. Zhu, Y. Tian, J. Deng, J. Shi and Y. Fu, BioResources, 2014, 9, 303–315 CAS.
- Z. Xue, M.-G. Ma, Z. Li and T. Mu, RSC Adv., 2016, 6, 98874–98892 RSC.
- Y. Zhao, K. Lu, H. Xu, L. Zhu and S. Wang, Renewable Sustainable Energy Rev., 2021, 139, 110706 CrossRef CAS.
- I. Omodolor, PhD dissertation, The University of Toledo, 2022 Search PubMed.
- G. Tsilomelekis, M. J. Orella, Z. Lin, Z. Cheng, W. Zheng, V. Nikolakis and D. G. Vlachos, Green Chem., 2016, 18, 1983–1993 RSC.
- M. Marafi, A. Stanislaus and E. Furimsky, in Handbook of Spent Hydroprocessing Catalysts, ed. M. Marafi, A. Stanislaus and E. Furimsky, Elsevier, 2nd edn, 2017, pp. 67–140, DOI:10.1016/B978-0-444-63881-6.00004-4.
- N. Alonso-Fagúndez, V. Laserna, A. C. Alba-Rubio, M. Mengibar, A. Heras, R. Mariscal and M. L. Granados, Catal. Today, 2014, 234, 285–294 CrossRef.
- M. L. Granados, A. C. Alba-Rubio, I. Sádaba, R. Mariscal, I. Mateos-Aparicio and Á. Heras, Green Chem., 2011, 13, 3203–3212 RSC.
- X. Qian, J. Lei and S. R. Wickramasinghe, RSC Adv., 2013, 3, 24280–24287 RSC.
- A. Vu, S. R. Wickramasinghe and X. Qian, Ind. Eng. Chem. Res., 2018, 57, 4514–4525 CrossRef CAS.
- V. L. Magnotta and B. C. Gates, J. Polym. Sci., Polym. Chem. Ed., 1977, 15, 1341–1347 CrossRef CAS.
- B.-H. Wang, J.-S. Dong, S. Chen, L.-L. Wang and J. Zhu, Chin. Chem. Lett., 2014, 25, 1423–1427 CrossRef CAS.
- A. C. Alba-Rubio, M. R. Coleman, S. Kalidindi, A. S. Joshi and I. S. Omodolor, Homogeneous and Reusable Superacid Polymer Catalyst for the Synthesis of 5-Hydroxymethylfurfural, From Glucose, US2020/0360910A1, 2020.
- J. N. Chheda, Y. Román-Leshkov and J. A. Dumesic, Green Chem., 2007, 9, 342–350 RSC.
- R. Gogar, S. Viamajala, P. A. Relue and S. Varanasi, ACS Sustainable Chem. Eng., 2021, 9, 3428–3438 CrossRef CAS.
- L. U. Guangzhou Vocee Membrane Technology Co., https://www.alibaba.com/product-detail/78m2-PVDF-ultrafiltration-Hollow-fiber-UF_62100789938.html?spm=a2700.galleryofferlist.0.0.78244589YrbC8s, (accessed February 20, 2020).
- R. Turton, J. A. Shaeiwitz, D. Bhattacharyya and W. B. Whiting, Analysis, Synthesis, and Design of Chemical Processes, Pearson, 2018 Search PubMed.
- Chemical Engineering Essentials for the CPI Professional, ed. D. Lozowski, G. Ondrey, S. Jenkins and M. P. Bailey, June 2022 Search PubMed.
- R. Davis, L. Tao, E. C. D. Tan, M. Biddy, G. T. Beckham, C. J. Scarlata, J. J. Jacobson, K. G. Cafferty, J. A. Ross, J. C. Lukas, D. Knorr and P. Schoen, Process Design and Economics for the Conversion of Lignocellulosic Biomass to Hydrocarbons: Dilute-Acid and Enzymatic Deconstruction of Biomass to Sugars and Biological Conversion of Sugars to Hydrocarbons, 2015 Search PubMed.
- T. Guo, J. Englehardt and T. Wu, Water Sci. Technol., 2014, 69, 223–234 CrossRef.
- Office of Energy Efficiency & Renewable Energy, U.S. Department of Energy .
- U.S. Energy Information Administration, Annual Energy Outlook, 2022 Search PubMed.
- V. L. Magnotta and B. C. Gates, J. Catal., 1977, 46, 266–274 CrossRef CAS.
- D. Merche, J. Hubert, C. Poleunis, S. Yunus, P. Bertrand, P. De Keyzer and F. Reniers, Plasma Processes Polym., 2010, 7, 836–845 CrossRef CAS.
- Y. J. Pagán-Torres, T. Wang, J. M. R. Gallo, B. H. Shanks and J. A. Dumesic, ACS Catal., 2012, 2, 930–934 CrossRef.
- X. Qian, Top. Catal., 2012, 55, 218–226 CrossRef CAS.
- R.-J. van Putten, J. N. M. Soetedjo, E. A. Pidko, J. C. van der Waal, E. J. M. Hensen, E. de Jong and H. J. Heeres, ChemSusChem, 2013, 6, 1681–1687 CrossRef CAS.
- A. M. Norton, H. Nguyen, N. L. Xiao and D. G. Vlachos, RSC Adv., 2018, 8, 17101–17109 RSC.
- J. Tang, X. Guo, L. Zhu and C. Hu, ACS Catal., 2015, 5, 5097–5103 CrossRef CAS.
- A. I. Torres, M. Tsapatsis and P. Daoutidis, Comput. Chem. Eng., 2012, 42, 130–137 CrossRef CAS.
- https://tradingeconomics.com/united-states/inflation-cpi) .
Footnotes |
| † Electronic supplementary information (ESI) available. See DOI: https://doi.org/10.1039/d2cy01619b |
| ‡ Equal contribution. |
| § Current affiliation: Department of Chemical and Biological Engineering, Tufts University, Medford, MA 02155, USA. |
| ¶ Current affiliation: Department of Chemical and Biomolecular Engineering, Clemson University, Clemson, SC 29634, USA. |
| This journal is © The Royal Society of Chemistry 2023 |

