
 Open Access Article
 This Open Access Article is licensed under a
 Creative Commons Attribution 3.0 Unported Licence
An investigation into the adsorption mechanism of n-butanol by ZIF-8: a combined experimental and ab initio molecular dynamics approach†
Samuel P.
Wallbridge
 a,
Stuart
Archer
a,
Mark R. J.
Elsegood
a,
Jonathan L.
Wagner
b,
Jamieson K.
Christie
c and
Sandra E.
Dann
*a
a,
Stuart
Archer
a,
Mark R. J.
Elsegood
a,
Jonathan L.
Wagner
b,
Jamieson K.
Christie
c and
Sandra E.
Dann
*a
aDepartment of Chemistry, Loughborough University, Loughborough, UK. E-mail: S.E.Dann@lboro.ac.uk
bDepartment of Chemical Engineering, Loughborough University, Loughborough, UK
cDepartment of Materials, Loughborough University, Loughborough, UK
First published on 11th July 2023
Abstract
The zeolitic imidazolate framework, ZIF-8, has been shown by experimental methods to have a maximum saturation adsorption capacity of 0.36 g g−1 for n-butanol from aqueous solution, equivalent to a loading of 14 butanol molecules per unit cell or 7 molecules per sodalite β-cage. Diffuse reflectance infrared Fourier transform spectroscopy (DRIFTS) shows the presence of hydrogen bonding between adsorbed butanol molecules within the cage; the presence of three different O–H stretching modes indicates the formation of butanol clusters of varying size. Ab initio molecular dynamics simulations show the formation of intermolecular hydrogen bonding between the butanol molecules, with an average hydrogen-bond coordination number of 0.9 after 15 ps simulation time. The simulations also uniquely demonstrate the presence of weaker interactions between the alcohol O–H group and the π-orbital of the imidazole ring on the internal surface of the cage during early stages of adsorption. The calculated adsorption energy per butanol molecule is −33.7 kJ mol−1, confirming that the butanol is only weakly bound, driven primarily by the hydrogen bonding. Solid-state MAS NMR spectra suggest that the adsorbed butanol molecules possess a reasonable degree of mobility in their adsorbed state, rather than being rigidly held in specific sites. 2D 13C–1H heteronuclear correlation (HETCOR) experiments show interactions between the butanol aliphatic chain and the ZIF-8 framework experimentally, suggesting that O–H interactions with the π-orbital are only short lived. The insight gained from these results will allow the design of more efficient ways of recovering and isolating n-butanol, an important biofuel, from low-concentration solutions.
Introduction
n-Butanol is a straight chain alcohol with physical and chemical properties that make it attractive as a next-generation liquid transportation fuel: it has a high energy density, high miscibility with gasoline and diesel, is easy to distribute, and it is safer than alternatives such as ethanol, with a lower vapour pressure and higher flash point.1,2 Bio-butanol can be obtained by the fermentation of sugars with Clostridium bacteria that produce dilute aqueous mixtures of acetone, butanol and ethanol (ABE) along with a number of side products.3–5 Due to the toxicity of n-butanol towards Clostridium bacteria, the concentration of butanol obtained is very low, typically less than 20 g L−1. Traditional wild strains produce low yields, such as C. acetobutylicium ATCC 824, which achieves a yield of 6.1 g L−1 of butanol from microalgae sources.6,7 Genetic engineering of bacterial strains can be used to improve fermentation performance; for example, Lu et al. were able to enhance butanol production by genetically engineering a strain of C. beijerinckii from 2.6 to 12.0 g L−1, whilst Zu et al. demonstrate an improved butanol tolerance for C. acetobutylicium strains, resulting in a yield increase from 14.5 to 18.0 g L−1.8,9Alternatively, to prevent cell disruption, the product can be recovered in situ, however, low n-butanol concentrations in solution mean that current methods, such as distillation, gas stripping and pervaporation, require large amounts of energy and are not cost effective.10 Adsorption onto a variety of solid materials, however, has been demonstrated as an energy-efficient method for the recovery of n-butanol from low-concentration aqueous fermentation liquors.11–16 Materials such as activated carbons, polymeric resins and zeolites have all shown high adsorption capacities for n-butanol from aqueous solutions. For example, Lin et al. achieved a capacity of 0.206 grams of butanol per gram of adsorbent with a polystyrene diethylbenzene polymer.17 Whilst zeolites, such as ZSM-5, ZSM-12 and beta that reach capacities of 0.12, 0.075 and 0.150 g g−1, respectively, are favoured for their molecular sieving properties and improved adsorption kinetics.18 The application of in situ recovery by adsorption has been demonstrated in several studies to improve the overall yield and productivity of ABE fermentation processes. For example, Xue et al. used an activated carbon in a fed-batch fermentation process to increase the yield by 230%, to 54.6 g L−1.19,20
Zeolitic imidazolate frameworks (ZIFs) are a subclass of metal–organic frameworks (MOFs) with great structural diversity and tuneable properties that have been used widely in the field of separation.21 ZIF-8 is the most notably studied ZIF; its structure consists of the cubic space group I![[4 with combining macron]](https://www.rsc.org/images/entities/char_0034_0304.gif) 3m with a = b = c = 16.9901 Å and α = β = λ = 90° (Fig. 1(a))22 where tetrahedral zinc atoms are coordinated to the nitrogen of 2-methylimidazole linking groups that repeat to form an extended framework (Fig. 1(b)). The resulting truncated octahedral β-cages are joined by 4- and 6-membered rings to generate a highly symmetrical sodalite (SOD) network (Fig. 1(c)).23,24 The β-cage has a diameter of 11.6 Å and can only be accessed through the narrow 6-membered ring opening with a diameter of 3.4 Å (Fig. 1(d)), however, an “opening the gate” effect, first characterised by Fairen-Jiminez et al., resulting from rotation about the Zn–N bond, enlarges the pore opening and allows much larger molecules to diffuse into the channels.25
3m with a = b = c = 16.9901 Å and α = β = λ = 90° (Fig. 1(a))22 where tetrahedral zinc atoms are coordinated to the nitrogen of 2-methylimidazole linking groups that repeat to form an extended framework (Fig. 1(b)). The resulting truncated octahedral β-cages are joined by 4- and 6-membered rings to generate a highly symmetrical sodalite (SOD) network (Fig. 1(c)).23,24 The β-cage has a diameter of 11.6 Å and can only be accessed through the narrow 6-membered ring opening with a diameter of 3.4 Å (Fig. 1(d)), however, an “opening the gate” effect, first characterised by Fairen-Jiminez et al., resulting from rotation about the Zn–N bond, enlarges the pore opening and allows much larger molecules to diffuse into the channels.25
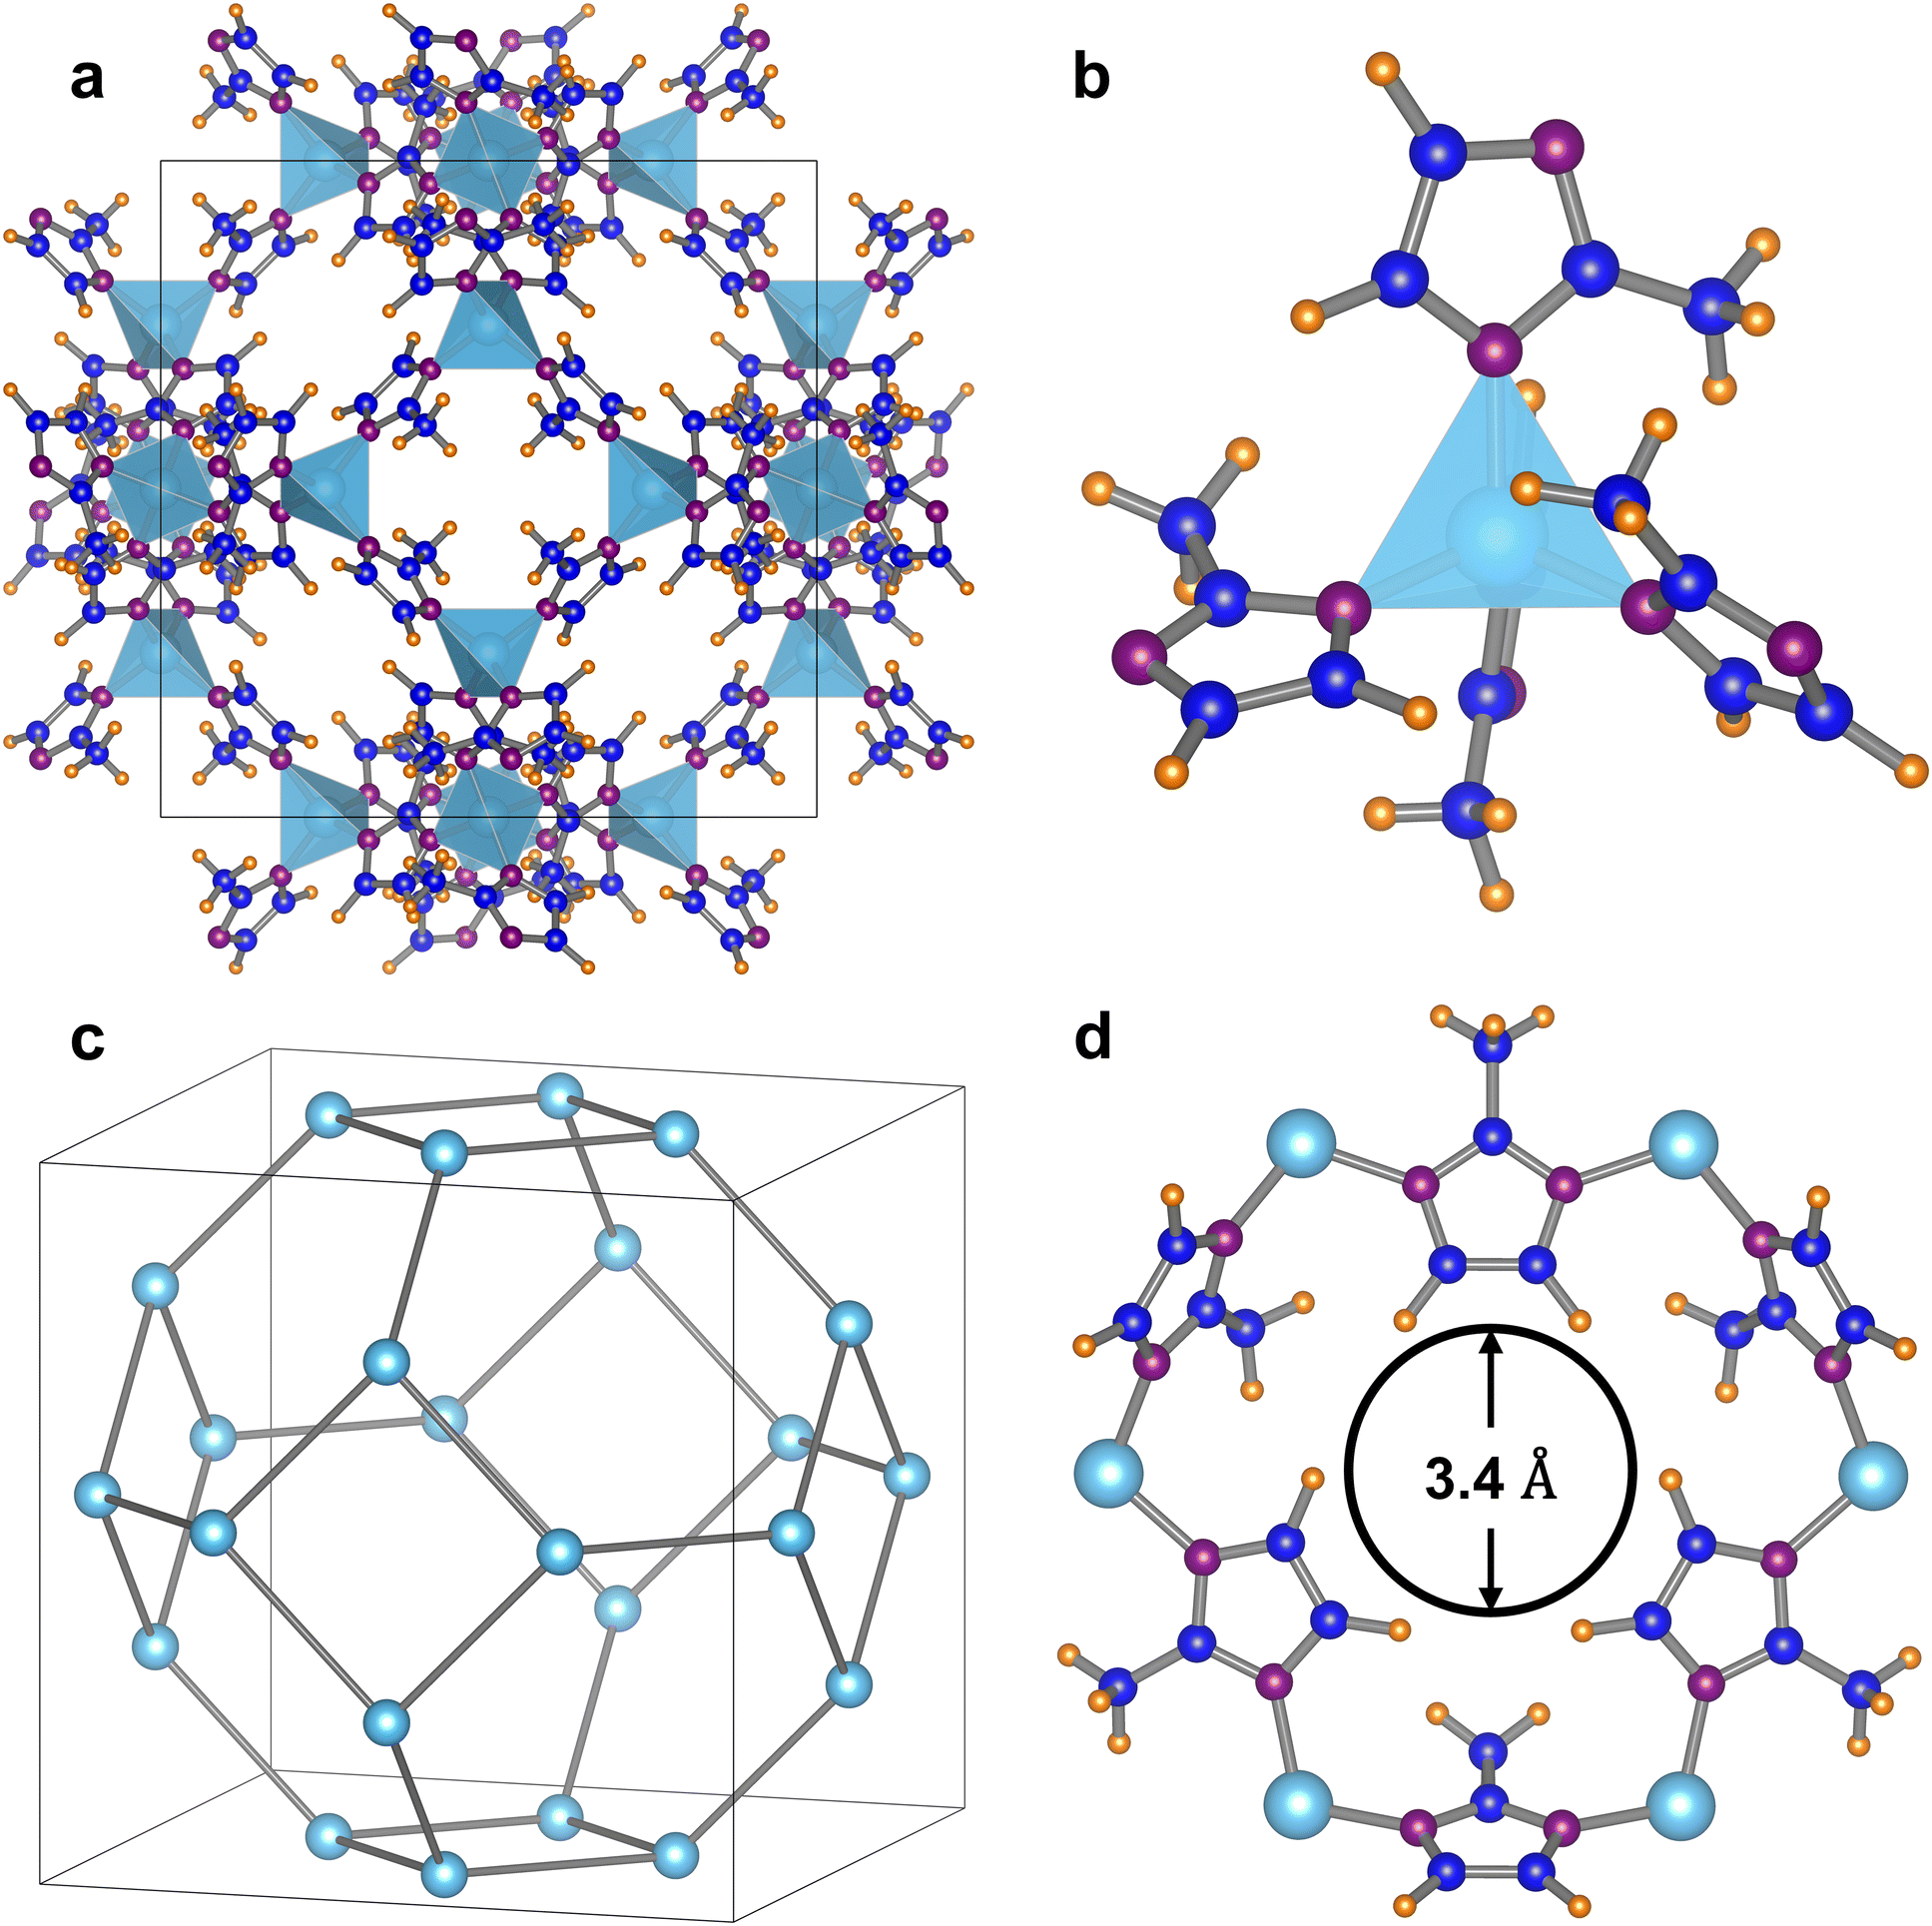 | ||
| Fig. 1 The structure of ZIF-8 where zinc atoms are shown in light blue, nitrogen in purple, carbon in dark blue and deuterium (representing hydrogen positions) in orange. The light blue tetrahedra are ZnN4 units. (a) ZIF-8 cubic unit cell, space group I3m, a = 16.9901 Å and α = 90°. (b) Zinc tetrahedron (ZnN4) coordinated by four 2-methylimidazole groups. (c) Simplified SOD beta-cage depicted by zinc framework atoms. (d) Six-membered ring with narrow pore opening of 3.4 Å, hindered by bulky 2-methylimidazole groups. Data are adapted after Wu et al. (CDCC 652032). | ||
ZIF-8 possesses characteristics that make it desirable as an adsorbent material; it's microporous nature results in a high internal surface area; it also displays good chemical and thermal stability and it is highly hydrophobic, meaning that it can be employed in aqueous media. Applications of ZIF-8 have included separation of small gas molecules, short-chain hydrocarbons and alcohols, as well as much bulkier molecules.22,26–29 Several studies have demonstrated that ZIF-8 has a high adsorption capacity for n-butanol, greater than 0.3 g g−1, as well as good selectivity over acetone and ethanol in low-concentration aqueous environments for both batch and breakthrough processes.30–32 The mechanism of adsorption and hence the nature of n-butanol molecules inside the ZIF-8 cages is, however, unclear from experimental data alone. Gao et al. have reported that the selective separation takes place by a combination of thermodynamic and kinetic effects; the predominant effect being the relative polarisability of the molecules and hence greater interaction between butanol and ZIF-8, compared to ethanol and acetone.30 However, it has been suggested by Remi et al. after Rietveld refinement of PXRD data, that the butanol molecules interact solely through hydrogen bonding and show no interaction with the cage itself.33 Several studies have employed molecular simulations to investigate the behaviour of light alcohols in ZIF cages; both Monte Carlo simulations and the Ideal Adsorbed Solution Theory (IAST) have previously demonstrated the existence of molecular clustering through hydrogen bonding interactions that play a key role in adsorption.34–38
In this paper, we investigate the adsorption of n-butanol by ZIF-8 both experimentally and theoretically to examine the molecular interactions present at maximum loading capacity. Liquid-phase adsorption isotherms, diffuse reflectance infrared Fourier transform spectroscopy (DRIFTS) and solid-state MAS NMR spectroscopy are used to provide an experimental insight into the behaviour of n-butanol inside the ZIF-8 cages. These data are combined with ab initio molecular dynamics simulations to investigate the preferential arrangement and binding mode of the butanol molecules within the framework. To develop materials with increased adsorption capacities, targeted molecular selectivity, improved separation kinetics and scalability for industrial application, an understanding of the mechanism for n-butanol adsorption is imperative for development of correct structure–property relationships. In doing so, the results in this study can accelerate the discovery of materials for more efficient n-butanol recovery.
Results and discussion
The liquid-phase adsorption characteristics of ZIF-8 towards n-butanol have been studied for ZIF-8 synthesised by both solvothermal and room-temperature precipitation routes (details provided in the ESI†). Scanning Electron Microscopy (SEM) micrographs in Fig. 2 indicate that the two preparation routes produce ZIF-8 samples with significantly different particle sizes and morphologies. In Fig. 2(a) and (b), ZIF-8 particles synthesised by the room-temperature precipitation method are small and highly uniform with well-defined rhombic dodecahedral morphology, possessing twelve thermodynamically stable [110] crystal facets.39 The average particle size was determined by measuring the diameter of >300 particles to give a value of 405 ± 24 nm (Fig. S4, ESI†). | ||
Fig. 2 Scanning Electron Microscopy (SEM) micrographs collected with secondary electron imaging of ZIF-8 synthesised by the room-temperature precipitation method at magnification of (a) ×5500 and (b) ×40![[thin space (1/6-em)]](https://www.rsc.org/images/entities/char_2009.gif) 000 and ZIF-8 synthesised solvothermally at magnifications of (c) ×600 and (d) ×5500. In (b) and (d), a selection of crystal facets are marked to demonstrate the different particle morphologies. {110} crystal facets are marked with purple borders, whilst {100} facets are marked with green borders. 000 and ZIF-8 synthesised solvothermally at magnifications of (c) ×600 and (d) ×5500. In (b) and (d), a selection of crystal facets are marked to demonstrate the different particle morphologies. {110} crystal facets are marked with purple borders, whilst {100} facets are marked with green borders. | ||
In comparison, ZIF-8 particles synthesised solvothermally in Fig. 2(c) are much less uniform, forming large aggregates with no obvious crystal morphology. Fig. 2(d) shows that large crystals, up to approximately 16 μm in size, with a truncated rhombic dodecahedral morphology, can be observed in the sample. This is an intermediate morphology formed as a result of incomplete crystal evolution which exposes both [110] and less thermodynamically stable [100] facets.39,40 This observation suggests that despite the long reaction time, the crystal morphology evolution is very slow under these conditions compared to the room-temperature precipitation method. From this point forward, large particles of ZIF-8 synthesised by the solvothermal method will be referred to as L-ZIF-8, whereas small particles of ZIF-8 synthesised by the room-temperature precipitation method will be referred to as S-ZIF-8. Despite the differences in particle size and morphologies, powder X-ray diffraction (Fig. S1, ESI†) confirms that both routes produce crystalline ZIF-8 with a good match to literature data from Wu et. al.22 N2 adsorption/desorption analysis (Fig. S3, ESI†) indicates that S-ZIF-8 has a slightly larger Brunauer–Emmett–Teller (BET) surface area of 1433 m2 g−1 compared to 1373 m2 g−1 for L-ZIF-8 with total pore volumes of 0.71 cm3 g−1 and 0.66 cm3 g−1, respectively.
Single-component liquid-phase butanol adsorption isotherms for both L-ZIF-8 and S-ZIF-8 in Fig. 3 show that both fit the Langmuir adsorption model and reach similar plateaus. The saturation adsorption capacity, Qmax, values derived from these plots are 0.364 ± 0.027 g g−1 and 0.356 ± 0.025 g g−1 for L-ZIF-8 and S-ZIF-8, respectively. These data suggest that the maximum amount of butanol that can be separated per gram of ZIF-8 is the same, within experimental error, despite their vastly different particle sizes and morphologies; an observation that is not unexpected given the similarities in surface area and pore volume. The Langmuir constant, k, is calculated to be 0.65 ± 0.26 L g−1 and 0.73 ± 0.28 L g−1. Again, the values for the two samples are within experimental error of one another, and the relatively high values suggest that the adsorption is very favourable. The uptake of butanol is high at low n-butanol starting concentrations (0.5 and 1.0 wt%), with the adsorption capacity exceeding 0.3 g g−1 in both cases by 2.0 wt%; this is a highly desirable characteristic considering that the concentration of n-butanol present in ABE fermentation liquors is often below 2 wt%. However, linear derivation of the Langmuir model (Fig. S5, ESI†) shows that for starting concentrations of 0.25 wt% and below, the adsorption capacity (Qe) is low and deviates from this model, so it is suggested that ZIF-8 is not suitable for separation of n-butanol from aqueous mixtures that are considerably lower than 0.5 wt%.
 | ||
| Fig. 3 n-butanol adsorption isotherms measured over the starting concentration range 0.5–5.0 wt% for L-ZIF-8 (□) and S-ZIF-8 (●). The data are fitted to the Langmuir adsorption model for L-ZIF-8 (solid line) and S-ZIF-8 (dashed line). | ||
The number of butanol molecules adsorbed per ZIF-8 unit cell, N, is determined using eqn (1) below:
 | (1) |
| Butanol/cage | Q max (g g−1) | Weight percent (wt%) |
|---|---|---|
| 4 | 0.20 | 17.8 |
| 5 | 0.27 | 21.3 |
| 6 | 0.33 | 24.7 |
| 7 | 0.38 | 27.5 |
| 8 | 0.43 | 30.3 |
Diffuse reflectance infrared Fourier transform spectroscopy (DRIFTS)
DRIFT spectroscopy has been used to study the interactions present within the framework during adsorption as well as the desorption mechanism of the butanol upon heating. The presence of adsorbed species at room temperature is evident in the spectra in Fig. 4(a) for L-ZIF-8 and Fig. 4(b) for S-ZIF-8; butanol O–H stretching bands are observed between 3200–3700 cm−1, whilst C–H stretches are present at ca. 2960 and 2872 cm−1. Deconvolution of the O–H stretching bands using a Gaussian fit (Fig. S6, ESI†) indicates that there are three vibrational modes in this region. The relatively sharp band at ∼3605 cm−1 can be assigned to free hydroxyl groups that do not exhibit any hydrogen bonding between butanol molecules, thus suggesting that there are isolated butanol molecules present inside the cage. The broad band between 3150–3560 cm−1 has two features that can be assigned to O–H stretches of hydroxyl groups hydrogen bonded to one another to different extents: one at ∼3350 cm−1 for polymeric hydrogen bonding and a shoulder at ∼3513 cm−1 for butanol present as smaller dimers/trimers.41–44 All three of the O–H stretching modes are observed in both L-ZIF-8 and S-ZIF-8 implying that the adsorbed species exist in the binding mode within the structure, possessing the same hydrogen bonding interactions, despite their vastly different particle sizes and morphologies. The full spectra are included in Fig. S7 (ESI†) and again show the same n-butanol bands throughout; as well as the bands associated with the ZIF-8 framework, butanol C–OH stretches are present at ∼1114, 1071 and 1027 cm−1 as is the C–H deformation at 846 cm−1. The presence of hydrogen bonding modes implies that intermolecular interactions play an important role in the stabilisation of n-butanol inside the β-cages of ZIF-8. | ||
| Fig. 4 Diffuse reflectance infrared Fourier transform spectroscopy (DRIFTS) spectra collected during in situ n-butanol desorption experiments carried out under a N2 atmosphere for (a) L-ZIF-8 and (b) S-ZIF-8. A constant temperature ramp of 5 °C min−1 was applied to the sample cell; spectra in (a) are shown every 20 °C, whilst spectra in (b) are shown every 10 °C, with additional plots distinguished as dashed lines, for clear comparison to (a). (c) and (d) mass spectra data collected in-line during DRIFTS desorption experiments for L-ZIF-8 and S-ZIF-8, respectively. Mass fragments: m/z 56 = [C4H8]+, m/z 43 = [C3H7]+, m/z 41 = [C3H5]+ and m/z = 31 [CH2 = OH]+. | ||
The clustering of alcohols in porous frameworks to form hydrogen-bonded networks is a phenomenon that is known to contribute to the adsorption mechanism in zeolites and MOFs.35,45 In fact, we have conducted similar experiments with various other straight-chain alcohols, including 1-propanol, 1-pentanol and 1-hexanol to compare their behaviour in ZIF-8; these data are provided in Fig. S8 (ESI†). Both the O–H stretching modes of isolated alcohol groups, as well as those related to hydrogen-bonded clusters are again observed during adsorption for all three adsorbates, suggesting that the proposed mechanism is not just limited to n-butanol.
As the sample is heated and the butanol desorbs from L-ZIF-8 (Fig. 4(a)) the intensity of the broad O–H stretching bands related to hydrogen-bonded butanol begins to decrease at low temperatures and is completely lost by 170 °C. The O–H stretching band of the terminally bound butanol remains at a similar intensity until higher temperatures, before gradually decreasing in intensity up to 350 °C. On the other hand, in the spectra for S-ZIF-8 (Fig. 4(b)) all three of the O–H stretching modes decrease in intensity rapidly at low temperatures and are completely lost by 110 °C. These differences in desorption rates from the two samples are also reflected in mass spectra data collected in-line with DRIFTS experiments in Fig. 4(c) and (d). Butanol mass fragments 56, 43, 41 and 31 are all observed to increase simultaneously from approximately 50 °C for both samples. For L-ZIF-8 in Fig. 4(c), the intensity of these fragments plateaus above 100 °C before gradually decreasing up to 350 °C when the butanol is fully desorbed from the framework. On the other hand, mass spectral signals continue to increase in intensity sharply up to approximately 150 °C for S-ZIF-8 (Fig. 4(d)) beyond which there is a sudden, sharp drop in the signals as the butanol is fully desorbed.
As reported by Tanaka et al., the mass transport rate of n-butanol in ZIF-8 is governed by both intercrystallite and surface resistance models; on reduction in crystal size, the contribution from surface barriers becomes more significant, resulting in faster diffusion.46 The large reduction in particle size from L-ZIF-8 to S-ZIF-8 therefore plays a significant role in the desorption characteristics observed in these experiments. Further, the existence of truncated rhombic dodecahedron particles in L-ZIF-8, where a fraction of the exposed surface consists of the {100} facets, results in the smaller 4-membered ring openings at the surface of the crystals rather than the 6-membered ring. It is likely that this is also a contributing factor towards the slow desorption observed for L-ZIF-8.39 It is, therefore, assumed that the delay between loss of terminally bound and hydrogen-bonded O–H stretching in the spectra of L-ZIF-8 as the temperature is increased is a direct result of slow mass transfer out of the bulk phase, rather than an intrinsic difference in the binding between the two samples. Particle size reduction, coupled with a uniform, thermodynamically stable, particle morphology, results in rapid desorption kinetics for S-ZIF-8, eliminating significant mass transfer limitations.
It is also noteworthy that as the temperature is increased during these experiments, none of the IR bands associated with the framework, including the aromatic C–H stretching band at 3133 cm−1, C–N stretching at 1180 and 1149 cm−1 and C–H deformation at 837 cm−1, show any shift with butanol desorption. The band positions remain constant regardless of the presence or absence of butanol within the framework which gives a strong indication that there are only very weak interactions between butanol molecules and the hydrophobic framework when the pores are saturated.
Molecular dynamics simulations
Ab initio molecular dynamics simulations employing the density functional theory (DFT) method have been carried out to corroborate the conclusions drawn from experimental findings. Based on a saturation loading capacity of 0.36 g g−1, determined from liquid-phase adsorption experiments, simulations were carried out with seven butanol molecules per β-cage of ZIF-8. After equilibration at 500 K, the butanol molecules were allowed to diffuse freely into their adsorbed state at 300 K; the root-mean-square deviation (RMSD) plot of the butanol atomic coordinates (Fig. S9, ESI†) suggests that equilibration was reached after 15 ps of simulation time.To investigate how intermolecular interactions contribute to the adsorption process, the extent of hydrogen bonding inside the framework was monitored over the course of the simulation by calculating the radial distribution function (RDF), g(r), for the O–O distance between butanol hydroxyl groups. These data, plotted in Fig. 5, show that in the first 1 ps of the simulation, the distribution of O–O distances between butanol molecules is governed by the quasi-random starting configuration and there is no evidence of any significant hydrogen bonding. At 5 ps, a sharp peak centred around 2.8 Å is present in the g(r) plot, suggesting that there is an organisation of the butanol molecules into a hydrogen-bonded network, inside the cage. This sharp peak remains in the plot at 10 and 15 ps, but at slightly decreased intensity compared to at 5 ps. The area under the plot of g(r), represents n(r), the average coordination number of each oxygen atom on a butanol molecule to the oxygen atoms of other butanol molecules in the cage. The value of n(r) up to 3.31 Å has been calculated to determine the average number of hydrogen bonds per butanol molecule at any given point throughout the simulation and is plotted in Fig. 5(b). The plot shows a sharp increase in the coordination number over the first 5 ps of the simulation at 300 K, where n(r) is equal to approximately 1.2 after 5 ps. The coordination number then plateaus before decreasing to 0.9 at approximately 8 ps as the butanol molecules arrange into their most stable configuration, beyond which there is no change in the extent of hydrogen bonding up to 15 ps.
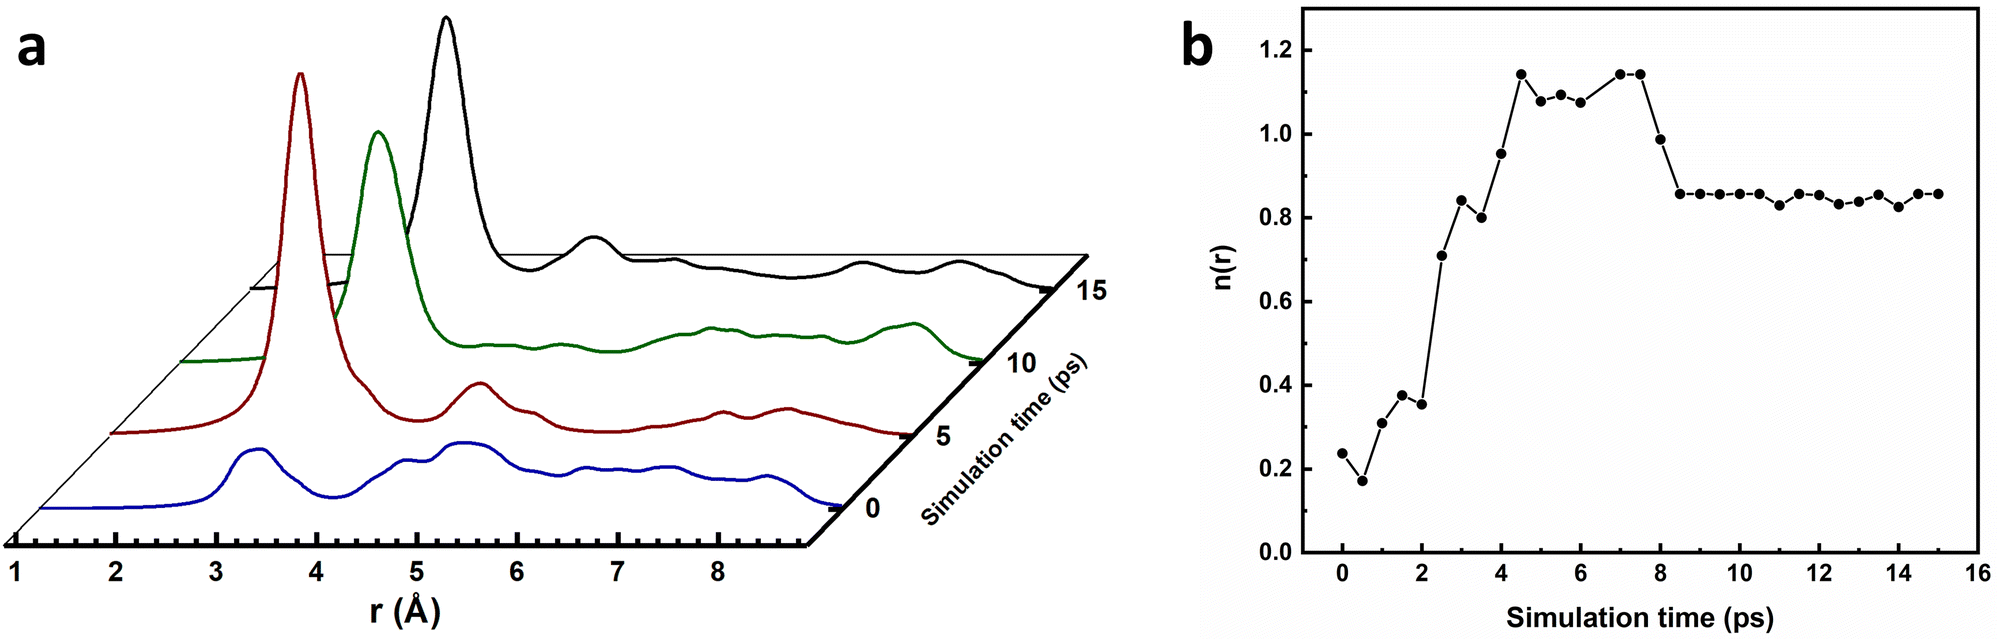 | ||
| Fig. 5 Analysis of hydrogen bonding over the course of the molecular dynamics simulation with 7 butanol molecules inside the framework. (a) Shows how the radial distribution function (RDF), g(r), for the intermolecular O–O distance varies between 0 to 9 Å averaged over 1 ps of time starting at 0, 5, 10 and 15 ps into the simulation, and shown in blue, red, green and black, respectively. (b) Average coordination number, n(r), of each oxygen atom to neighbouring oxygen atoms at a distance below 3.31 Å. | ||
The final arrangement of the butanol molecules after 15 ps can be viewed along all 3 axes in Fig. 6; the 2-methylimidazole linking groups have been removed for clarity, leaving just the tetrahedral Zn atoms of the β-cage, whilst hydrogen bonds between O–H groups are shown in green. The full coordinates for one loaded β-cage can be found as a separate ESI† file. It can be observed that the butanol molecules are arranged into clusters of different sizes within the cage; a hydrogen-bonded trimer, a dimer and two isolated butanol molecules that do not partake in any hydrogen bonding. The most stable configuration, therefore, consists of three hydrogen bonds between the seven butanol molecules, rather than a continuous network as would be expected in purely liquid butanol. These results support the observation of multiple O–H stretching modes in DRIFTS experiments with respect to different extents of hydrogen bonding between butanol's (observed in Fig. 4).
 | ||
| Fig. 6 Arrangement of seven adsorbed butanol molecules inside the ZIF-8 cage after production at 300 K for 15 ps of molecular dynamics simulation, viewed along the (a) x-axis, (b) y-axis and (c) z-axis. The ZIF-8 β-cage is represented by just the zinc atoms in light blue with organic imidazole linkers excluded for clarity. Carbon atoms of butanol molecules are shown in deep blue, hydrogen atoms in orange and oxygen atoms in red. Hydrogen bonding between butanol molecules is shown by highlighting O–O distances less than or equal to 3.31 Å in green. | ||
Charge density analysis was carried out to investigate the interactions present between adsorbed n-butanol and the hydrophobic surface of the ZIF-8 cage. The plot in Fig. 7 shows that there are a number of areas of charge accumulation and depletion distributed unevenly around the cage, indicating various points of interaction between the butanol molecules and the framework. The most prevalent are the interactions between multiple butanol hydroxyl groups and the C![[double bond, length as m-dash]](https://www.rsc.org/images/entities/char_e001.gif) C moiety of 2-methylimidazole groups on the internal cage surface. This type of interaction is an example of π hydrogen bonding, where the acceptor is the electronegative π orbital on the imidazole ring and the donor is the butanol O–H group.47,48 In Fig. 7, two examples of this π hydrogen bonding are highlighted, however, it is observed a total of four times throughout the cage, after 15 ps. In fact, where the hydroxyl hydrogen is not involved in a hydrogen bond with the hydroxyl on another butanol molecule, then it always interacts with the CC π cloud. Evidence suggests that these bonds are substantially weaker than alcohol–alcohol hydrogen bonding, however, it should not be considered to be negligible.49 These interactions are accompanied by other, less well-defined, areas of charge transfer between the aliphatic carbon chain of the butanol molecules and the 2-methylimidazole groups at various, unevenly distributed, locations around the cage. The observed butanol positions are unlikely to describe fixed adsorption sites and given that the process is driven by intermolecular hydrogen bonding, a degree of variability is expected. The adsorption energy per butanol molecule in ZIF-8 can be calculated by eqn (2) given below for the optimised structures:
C moiety of 2-methylimidazole groups on the internal cage surface. This type of interaction is an example of π hydrogen bonding, where the acceptor is the electronegative π orbital on the imidazole ring and the donor is the butanol O–H group.47,48 In Fig. 7, two examples of this π hydrogen bonding are highlighted, however, it is observed a total of four times throughout the cage, after 15 ps. In fact, where the hydroxyl hydrogen is not involved in a hydrogen bond with the hydroxyl on another butanol molecule, then it always interacts with the CC π cloud. Evidence suggests that these bonds are substantially weaker than alcohol–alcohol hydrogen bonding, however, it should not be considered to be negligible.49 These interactions are accompanied by other, less well-defined, areas of charge transfer between the aliphatic carbon chain of the butanol molecules and the 2-methylimidazole groups at various, unevenly distributed, locations around the cage. The observed butanol positions are unlikely to describe fixed adsorption sites and given that the process is driven by intermolecular hydrogen bonding, a degree of variability is expected. The adsorption energy per butanol molecule in ZIF-8 can be calculated by eqn (2) given below for the optimised structures:
 | (2) |
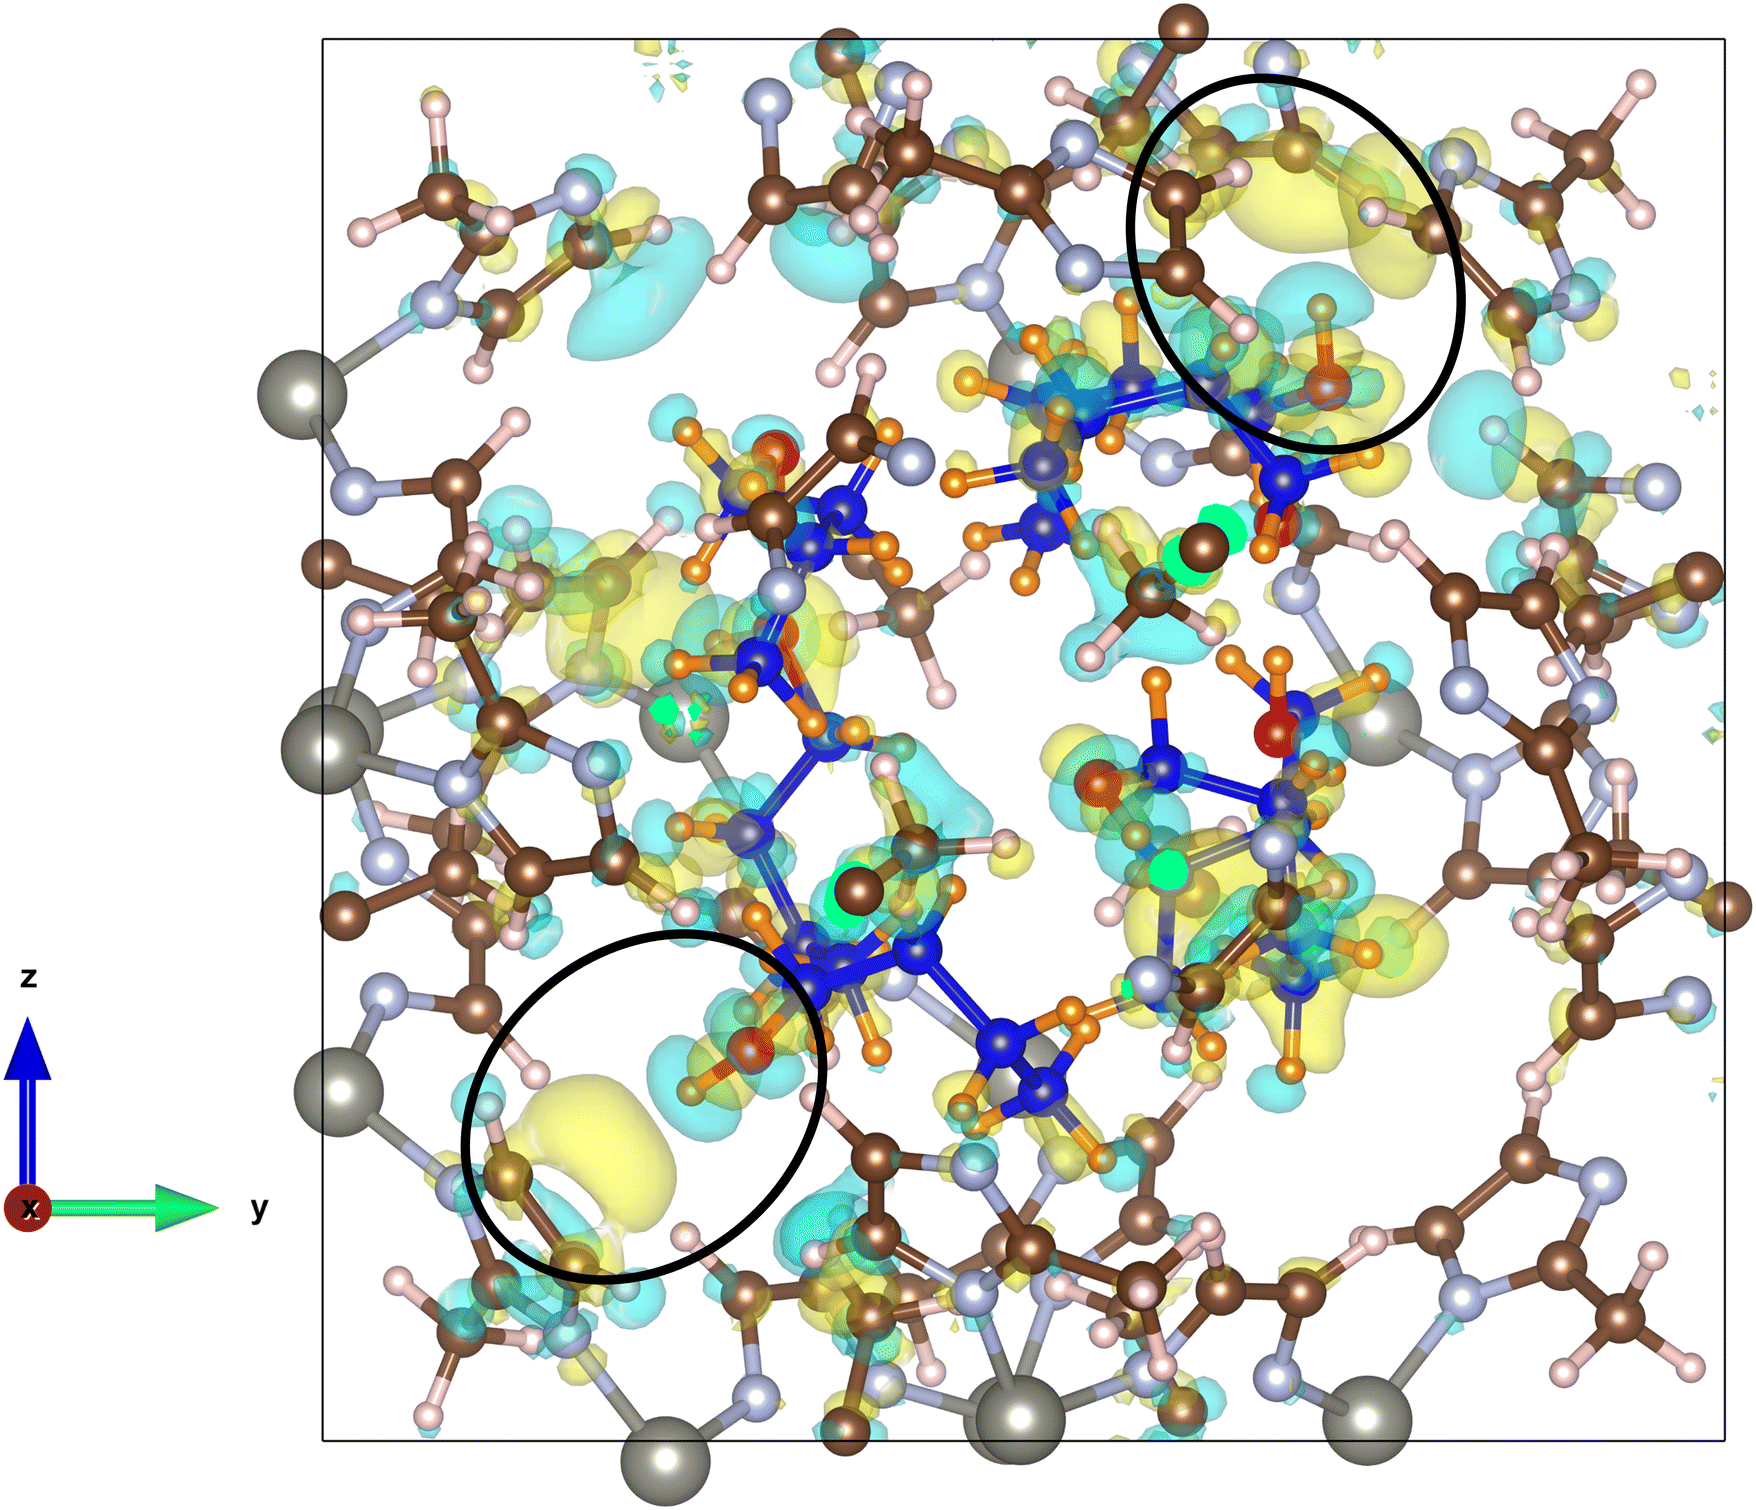 | ||
| Fig. 7 Charge density plot of optimised coordinates after 15 ps molecular dynamics simulation at 300 K with seven butanol molecules inside the ZIF-8 cage. Interactions occur as weak charge transfer from electron-rich areas shown in blue to electron-deficient areas shown in yellow, with an iso-surface value of 0.00045 e Å−13. The two circled areas demonstrate the occurrence of specific interactions between the hydrogen atom of a butanol hydroxyl group and the CC electron π cloud of an imidazole ring. Butanol atoms: carbon in blue, hydrogen in orange and oxygen in red. Framework atoms: carbon in brown, nitrogen in light blue and zinc in grey. | ||
For comparative purposes, an equivalent simulation has been carried out for ZIF-8 loaded with 6 butanol molecules per cage. As with the 7-butanol simulation, the extent of intermolecular hydrogen bonding between butanol molecules inside the cage can be seen to increase over the course of the simulation by analysing the RDF, g(r), shown in Fig. S10 (ESI†). The average hydrogen bonding coordination number, n(r), increases more gradually to ca. 1.8 over 10 ps, equilibrating to ca. 1.6 by 15 ps simulation time; this value is greater than that observed for the 7-butanol simulation, indicating that there is a larger extent of hydrogen bonding present in this simulation. Visualisation of the final coordinates of this simulation after 15 ps in Fig. S11 (ESI†) confirms this, showing that the butanol molecules are linked in a more continuous hydrogen bonding network when only 6 butanol molecules are present.
Charge-density analysis of butanol adsorbed in the ZIF-8 cage (Fig. S12, ESI†) with this arrangement highlights no charge transfer between butanol molecules and the pore surfaces, unlike what was seen when loaded with 7 butanol molecules. This suggests that at loadings below saturation capacity, the molecules have more freedom to arrange into their preferred hydrogen-bonded orientation. Despite having a stronger Eads per butanol of −39.0 kJ mol−1 for the 6-butanol simulation, the overall stabilisation of −234.0 kJ mol−1 is lower, providing a driving force for the adsorption of a seventh butanol molecule, and allowing the partial disruption of the hydrogen-bond network at saturation adsorption capacity.
These simulations substantiate the importance of hydrogen bonding during the adsorption of n-butanol in ZIF-8, whilst demonstrating at the maximum experimental loading capacity, weaker interactions between butanol molecules and the pore surface play a synergistic role in the adsorption. It is, however, assumed that due to the low calculated adsorption energy per butanol molecule inside the cage, the small pore opening of ZIF-8 is prerequisite for good separation performance, providing additional confinement to the butanol inside the framework.
Solid-state NMR
Solid-state MAS NMR spectroscopy has been used to provide further insight into the nature of adsorbed n-butanol inside the framework. A sample of L-ZIF-8 was pre-adsorbed with n-butanol before being packed into a 3.2 mm zirconia rotor, spectra were then collected by MAS at 15 kHz. In the spectra, shown in Fig. 8, peaks are present for both the ZIF-8 framework, as well as the adsorbed n-butanol in both (a) single-pulse (SP) 1H and (b) cross-polarization (CP) 13C spectra. In Fig. 8(a), two broad peaks associated with ZIF-8 framework protons are observed at 7.0 and 2.0 ppm, which are assigned to the methyl and aromatic protons, respectively. Four much sharper peaks associated with the adsorbed butanol species are observed; the peak at 0.4 ppm is assigned to the methyl protons as position 4, whilst the peak at 0.9 ppm is associated with the protons of the CH2 groups at positions 5 and 6, in an equivalent environment. | ||
| Fig. 8 MAS NMR spectra of ZIF-8 with adsorbed n-butanol collected at 15 kHz. (a) Single-pulse 1H spectrum and (b) cross-polarisation 13C spectrum. Peak assignments are based on the proton or carbon atoms at the positions 1 to 8 provided, where 1 to 3 (black) correspond to the ZIF-8 framework, whilst 4 to 8 (green) correspond to adsorbed n-butanol molecules. | ||
Assignment of the peaks at 2.9 and 3.9 ppm between the hydroxyl proton and the two protons on the adjacent carbon (C7) was at first tentative. Collection of proton spectra under quantitative conditions was subsequently performed to provide rough peak integrals that support these assignments, despite overlaps between the butanol and ZIF-8 framework peaks. By normalising the integral for the peak at 0.9 ppm to 4.00 (C5/C6), the remaining integrals equate to 3.17, 1.89 and 0.73 for the peaks at 0.4 (C4 with 3 protons), 2.9 (C7 with 2 protons) and 3.9 ppm (hydroxyl proton), respectively.
In Fig. 8(b), there are three ZIF-8 framework peaks, at 151, 125 and 14 ppm assigned to the tertiary, two equivalent aromatic and methyl carbons, respectively. There are four butanol peaks that are again much sharper than the ZIF peaks; they are at 60, 34, 18 and 13 ppm and are assigned progressively along the carbon chain from the methyl carbon at 13 ppm. The relatively sharp nature of the butanol peaks in both cases in Fig. 8 compared to the ZIF peaks are uncharacteristic of strongly adsorbed, rigid species. It instead suggests that the adsorbed species possess a high degree of mobility inside the cage rather than being fixed to one site; in this respect, the butanol displays liquid-like characteristics.52,53 This hypothesis is supported by analysis of the rotating frame spin-lattice relaxation time constant, T1ρ, through the CP 13C spectrum. T1ρ is calculated to be 19.3 (± 5.1) s averaged across the three framework signals in the 13C spectrum, whereas for the n-butanol signals T1ρ is equal to just 3.9 ± 0.9 s. The relaxation time observed for the adsorbed butanol peaks is, therefore, 5 times shorter than that observed for the ZIF-8 signals and suggests that the butanol molecules exist in a partial liquid state inside the cage.
2D 13C–1H heteronuclear correlation (HETCOR) data shown in Fig. 9 indicates a range of correlations between 13C atoms of the framework and 1H atoms of adsorbed n-butanol. Butanol methyl protons at position 4, along with CH2 protons at positions 5 and 6 show correlation signals with all three framework carbon signals. The butanol CH2 proton signal at position 7 adjacent to the hydroxyl group on the other hand, shows correlations only with the framework carbon signals of C3 (methyl) and C2 (tertiary). It is interesting to note that no correlations were detected between the butanol hydroxyl proton and the framework carbons. From this it can be inferred that the protons of the butanol aliphatic tail exist in closer proximity to the internal pore surface, and with a greater degree of mobility, than the hydroxyl ends that are hydrogen bonded to one another.
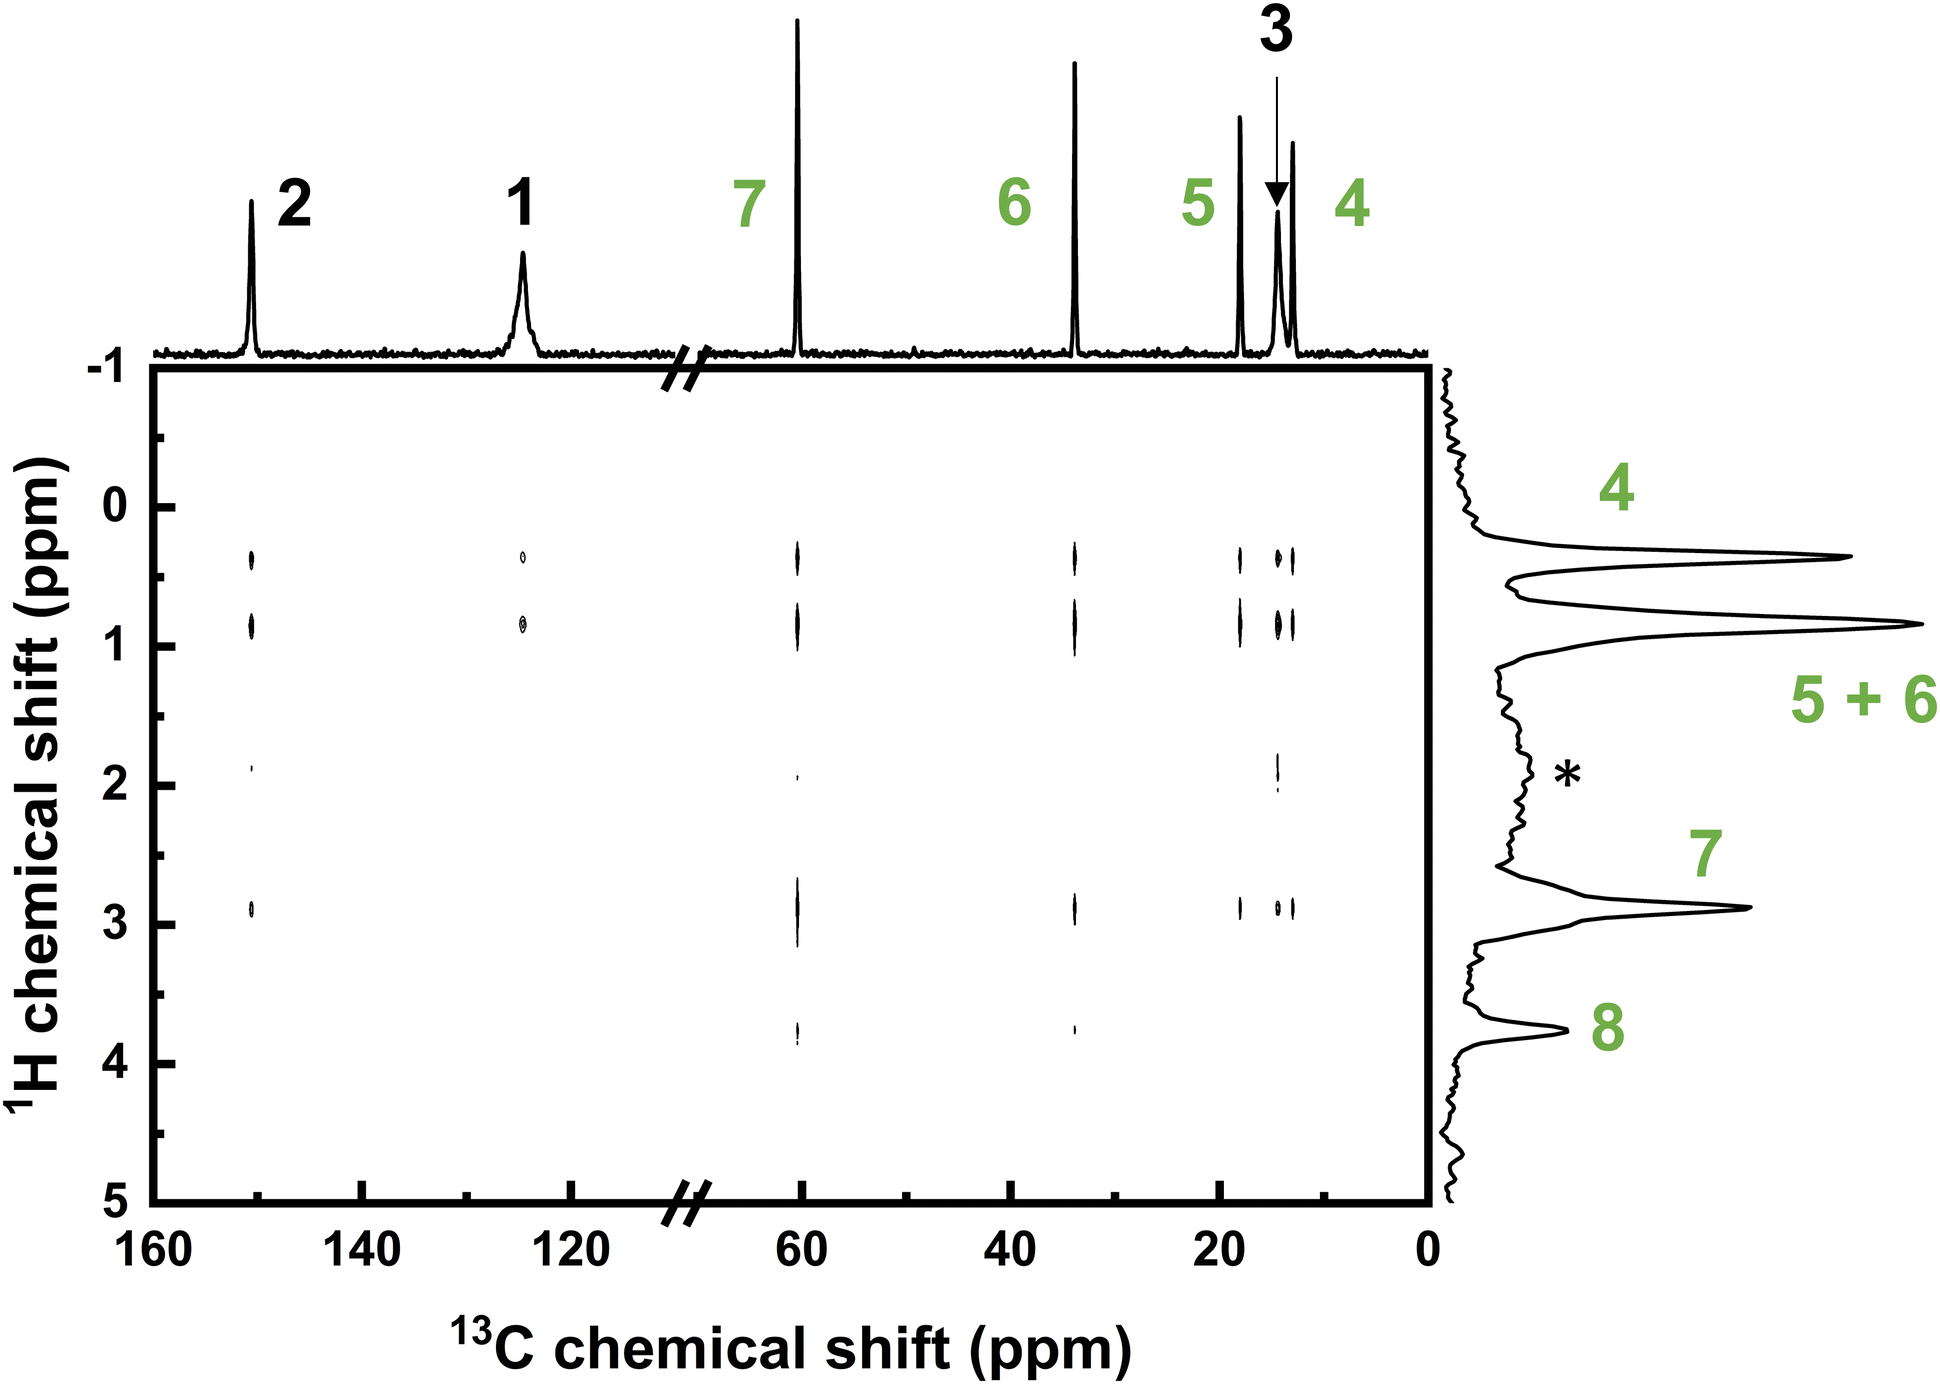 | ||
| Fig. 9 2-dimensional 13C–1H heteronuclear correlation (HETCOR) spectrum of ZIF-8 with adsorbed n-butanol, collected with MAS at 15 kHz. Individual 1D 13C and 1H spectra are displayed on the x-axis and y-axis, respectively. Peak assignments are based on the proton or carbon atoms at the positions 1 to 8 provided in Fig. 8. Peaks in the 1H spectrum associated with the ZIF-8 framework protons are very broad and present at 1.8 ppm (*) and 6.7 ppm (not shown). | ||
Non-covalent interactions such as hydrogen bonding are not permanent and are weak enough to readily dissociate, whilst there is a correlation between the bond lifetime and the bond strength.54,55 It can, therefore, be inferred that the weak O–H–π hydrogen bonds that are present during adsorption in molecular dynamics simulations (as described in Fig. 7) have a short lifetime and are, importantly, not favoured over the stronger butanol intermolecular hydrogen bonds. Ab initio molecular dynamics simulations have, therefore, allowed the observation of interactions that are not accessible experimentally, providing a unique insight into the adsorption process.
Material design
We have shown the adsorption of n-butanol by ZIF-8 to be weak and driven by adsorbate-adsorbate hydrogen bonding inside the cages. This weak binding is evidenced experimentally by the rapid desorption that occurs from small ZIF-8 particles at low temperature (<150 °C), compared to larger particles that exhibit significant mass transfer limitations. This has implications on the efficiency of the separation process, particularly during regeneration of ZIF-8 and recovery of n-butanol during, for example, temperature swing adsorption (TSA). The use of smaller particles will result in lower minimum purge temperatures, and hence reduced energy requirements; as demonstrated in Fig. 4, a small temperature change will result in a large decrease in adsorbate loading when compared to the use of larger particles. This in turn leads to less time for desorption and cooling of the adsorbent bed and hence a quicker overall cycle duration. The temperature required to desorb n-butanol from L-ZIF-8 particles (>300 °C) is also likely to cause the adsorbent to begin to decompose over extended time periods.56 Lower temperatures therefore mean that the adsorbent is less susceptible to thermal degradation during regeneration and as a result could theoretically be used for more cycles without loss of adsorption capacity.57Furthermore, the important structural features, namely the large cage volume and narrow, flexible, pore opening, provide means of adsorbing a large quantity of weakly bound adsorbate that is confined inside the structure. It is, therefore, evident from this work that there are several characteristics that should be considered during the design of improved adsorbent materials for the efficient separation of n-butanol from low concentration, aqueous mixtures.
Conclusions
This work has shown by several techniques the adsorption mechanism of n-butanol by ZIF-8, which will have important implications on the design of improved adsorbent materials. It has been proven experimentally and by ab initio molecular dynamics simulations that hydrogen bonding plays the key role in the adsorption process. Simulations also highlight the presence of weak interactions between the butanol molecules and the π cloud of the imidazole linking groups on the framework, in the early stages of adsorption at maximum adsorption capacity. The calculated adsorption energy of −33.7 kJ mol−1, however, suggests that the adsorption is very weak and depends primarily on the intermolecular hydrogen bonding, rather than strong binding at fixed sites. Solid-state MAS NMR spectroscopy has shown that n-butanol molecules are mobile in nature inside the cage, whilst 13C–1H HETCOR indicates the presence of dispersion interactions between the butanol aliphatic carbon chain, and the imidazole ring on the internal cage.These results show that ZIF-8 is most stable in a configuration with seven adsorbed n-butanol molecules per cage. A successful adsorbent benefits from a large pore volume to allow for a greater extent of adsorbate–adsorbate hydrogen bonding, along with a narrow pore opening in order to provide confinement of adsorbed species inside the cage. Interactions with the pore surface are not the most important factor, with hydrogen-bonding between the absorbed molecules playing the most significant role in stability. The particle size also has a significant impact on the efficiency of the separation, with a reduction in particle size eliminating significant mass transfer limitations and reducing the desorption temperature. This important insight will provide guidance to allow future work in the design of adsorbents for the separation of butanol from ABE and related liquors, to form part of a concerted effort to design a more energy efficient process of recovery, to allow bio-butanol to succeed at replacing petrol, diesel, and current biobased alternatives.
Author contributions
S. P. Wallbridge: conceptualisation, formal analysis, investigation, methodology, visualisation and writing – original draft. S. Archer: investigation (NMR). M. R. J. Elsegood: formal analysis. J. L. Wagner: funding acquisition, project administration, resources, supervision, writing – review and editing. J. K. Christie: conceptualisation, data curation, funding acquisition, project administration, resources, supervision, writing – review and editing. S. E. Dann: conceptualisation, funding acquisition, project administration, resources, supervision, writing – review and editing.Conflicts of interest
There are no conflicts to declare.Acknowledgements
We would like to thank Loughborough University and the Engineering and Physical Sciences Research Council (EPSRC) for the studentship for S. P. W, who is funded by three different EPSRC DTP grants - EP/N509516/1, EP/R513088/1 and EP/T518098/1. We would like to thank the SCI for awarding S. P. W the Sydney Andrew Scholarship. We would like to thank the UK Catalysis Hub for access to their laboratory facilities and June Callison for assistance with DRIFTS experiments. This paper acknowledges the use of the Lovelace HPC service at Loughborough University. Some calculations were performed using the Sulis Tier 2 HPC platform hosted by the Scientific Computing Research Technology Platform at the University of Warwick. Sulis is funded by EPSRC Grant EP/T022108/1 and the HPC Midlands+ consortium.Notes and references
- B. Ndaba, I. Chiyanzu and S. Marx, Biotechnol. Rep., 2015, 8, 1–9 CrossRef CAS PubMed.
- B. Kolesinska, J. Fraczyk, M. Binczarski, M. Modelska, J. Berlowska, P. Dziugan, H. Antolak, Z. J. Kaminski, I. A. Witonska and D. Kregiel, Materials, 2019, 12, 1–22 CrossRef PubMed.
- S. Li, L. Huang, C. Ke, Z. Pang and L. Liu, Biotechnol. Biofuels, 2020, 13, 1–25 CrossRef PubMed.
- S. Y. Lee, J. H. Park, S. H. Jang, L. K. Nielsen, J. Kim and K. S. Jung, Biotechnol. Bioeng., 2008, 101, 209–228 CrossRef CAS PubMed.
- C. Xue, X. Q. Zhao, C. G. Liu, L. J. Chen and F. W. Bai, Biotechnol. Adv., 2013, 31, 1575–1584 CrossRef CAS PubMed.
- A. M. Lopez-Contreras, P. A. M. Claassen, H. Mooibroek and W. M. De Vos, Appl. Microbiol. Biotechnol., 2000, 54, 162 CrossRef CAS PubMed.
- Y. Li, W. Tang, Y. Chen, J. Liu and C. F. Lee, Fuel, 2019, 242, 673–686 CrossRef CAS.
- L. Zhu, H. Dong, Y. Zhang and Y. Li, Metab. Eng., 2011, 13, 426–434 CrossRef CAS PubMed.
- C. Lu, L. Yu, S. Varghese, M. Yu and S. T. Yang, Bioresour. Technol., 2017, 243, 1000–1008 CrossRef CAS PubMed.
- J. L. Wagner, D. Lee-Lane, M. Monaghan, M. Sharifzadeh and K. Hellgardt, Algal Res., 2019, 37, 92–102 CrossRef.
- N. Abdehagh, F. H. Tezel and J. Thibault, Adsorption, 2016, 22, 357–370 CrossRef CAS.
- N. Abdehagh, F. H. Tezel and J. Thibault, Adsorption, 2013, 19, 1263–1272 CrossRef CAS.
- X. Lin, J. Wu, X. Jin, J. Fan, R. Li, Q. Wen, W. Qian, D. Liu, X. Chen, Y. Chen, J. Xie, J. Bai and H. Ying, Biotechnol. Prog., 2012, 28, 962–972 CrossRef CAS PubMed.
- V. Saravanan, D. A. Waijers, M. Ziari and M. A. Noordermeer, Biochem. Eng. J., 2010, 49, 33–39 CrossRef CAS.
- H. Li, F. Guo, J. Hu, C. Peng, H. Wang, H. Liu and J. Li, J. Mater. Chem. A, 2019, 7, 22353–22358 RSC.
- M. Pakzati, H. Abedini, T. Hamoule and A. Shariati, Adsorption, 2021, 27, 1279–1290 CrossRef CAS.
- X. Lin, J. Wu, X. Jin, J. Fan, R. Li, Q. Wen, W. Qian, D. Liu, X. Chen, Y. Chen, J. Xie, J. Bai and H. Ying, Biotechnol. Prog., 2012, 28, 962–972 CrossRef CAS PubMed.
- C. Gao, J. Wu, Q. Shi, H. Ying and J. Dong, Microporous Mesoporous Mater., 2017, 243, 119–129 CrossRef CAS.
- I. Veza, M. F. Muhamad Said and Z. A. Latiff, Biomass Bioenergy, 2021, 144, 105919 CrossRef CAS.
- C. Xue, F. Liu, M. Xu, I. C. Tang, J. Zhao, F. Bai and S. T. Yang, Bioresour. Technol., 2016, 219, 158–168 CrossRef CAS PubMed.
- S. Bhattacharjee, M. S. Jang, H. J. Kwon and W. S. Ahn, Catal. Surv. Asia, 2014, 18, 101–127 CrossRef CAS.
- H. Wu, W. Zhou and T. Yildirim, J. Am. Chem. Soc., 2007, 129, 5314–5315 CrossRef CAS PubMed.
- W. Wong-Ng, J. A. Kaduk, L. Espinal, M. R. Suchomel, A. J. Allen and H. Wu, Powder Diffr., 2011, 26, 234–237 CrossRef CAS.
- K. S. Park, Z. Ni, A. P. Cô, J. Y. Choi, R. Huang, F. J. Uribe-Romo, H. K. Chae, M. O’keeffe and O. M. Yaghi, Proc. Natl. Acad. Sci. U. S. A., 2006, 103, 10186–10191 CrossRef CAS PubMed.
- D. Fairen-Jimenez, S. A. Moggach, M. T. Wharmby, P. A. Wright, S. Parsons and T. Düren, J. Am. Chem. Soc., 2011, 133, 8900–8902 CrossRef CAS PubMed.
- K. Zhang, R. P. Lively, C. Zhang, R. R. Chance, W. J. Koros, D. S. Sholl and S. Nair, J. Phys. Chem. Lett., 2013, 4, 3618–3622 CrossRef CAS.
- K. Zhang, R. P. Lively, C. Zhang, W. J. Koros and R. R. Chance, J. Phys. Chem. C, 2013, 117, 7214–7225 CrossRef CAS.
- T. Ueda, M. Nakai and T. Yamatani, Adsorption, 2017, 23, 887–901 CrossRef CAS.
- J. McEwen, J. D. Hayman and A. Ozgur Yazaydin, Chem. Phys., 2013, 412, 72–76 CrossRef CAS.
- C. Gao, Q. Shi and J. Dong, CrystEngComm, 2016, 18, 3842–3849 RSC.
- J. Cousin Saint Remi, G. Baron and J. Denayer, Adsorption, 2012, 18, 367–373 CrossRef CAS.
- B. Claessens, A. Martin-Calvo, J. J. Gutiérrez-Sevillano, N. Dubois, J. F. M. Denayer and J. Cousin-Saint-Remi, Langmuir, 2019, 35, 3887–3896 CrossRef CAS PubMed.
- J. Cousin Saint Remi, T. Rémy, V. Vanhunskerken, S. Vandeperre, T. Duerinck, M. Maes, D. Devos, E. Gobechiya, C. E. A. Kirschhock, G. V. Baron and J. F. M. Denayer, ChemSusChem, 2011, 4, 1074–1077 CrossRef CAS PubMed.
- K. Zhang, A. Nalaparaju, Y. Chen and J. Jiang, Phys. Chem. Chem. Phys., 2014, 16, 9643–9655 RSC.
- R. M. Madero-Castro, J. M. Vicent-Luna and S. Calero, J. Phys. Chem. C, 2019, 123, 23987–23994 CrossRef CAS.
- A. Martin-Calvo, S. Van Der Perre, B. Claessens, S. Calero and J. F. M. Denayer, Phys. Chem. Chem. Phys., 2018, 20, 9957–9964 RSC.
- R. Krishna, J. M. van Baten and R. Baur, Microporous Mesoporous Mater., 2018, 267, 274–292 CrossRef CAS.
- R. Krishna and J. M. Van Baten, ACS Omega, 2020, 5, 28393–28402 CrossRef CAS PubMed.
- S. H. Pang, C. Han, D. S. Sholl, C. W. Jones and R. P. Lively, Chem. Mater., 2016, 28, 6960–6967 CrossRef CAS.
- J. Cravillon, S. Münzer, S. J. Lohmeier, A. Feldhoff, K. Huber and M. Wiebcke, Chem. Mater., 2009, 21, 1410–1412 CrossRef CAS.
- M. Avram and G. H. Mateescu, Infrared Spectroscopy: Applications in Organic Chemistry, Wiley - Interscience, New York, 1972 Search PubMed.
- J. Errera, R. Gaspart and H. Sack, J. Chem. Phys., 1940, 8, 63–71 CrossRef CAS.
- U. Liddel and E. D. Becker, Spectrochim. Acta, 1957, 10, 70 CrossRef CAS.
- R. A. Provencal, R. N. Casaes, K. Roth, J. B. Paul, C. N. Chapo, R. J. Saykally, G. S. Tschumper and H. F. Schaefer, J. Phys. Chem. A, 2000, 104, 1423–1429 CrossRef CAS.
- J. R. Di Lorio, B. A. Johnson and Y. Román-Leshkov, J. Am. Chem. Soc., 2020, 142, 19379–19392 CrossRef PubMed.
- S. Tanaka, K. Fujita, Y. Miyake, M. Miyamoto, Y. Hasegawa, T. Makino, S. Van Der Perre, J. Cousin Saint Remi, T. Van Assche, G. V. Baron and J. F. M. Denayer, J. Phys. Chem. C, 2015, 119, 28430–28439 CrossRef CAS.
- T. S. Zwier, Annu. Rev. Phys. Chem., 1996, 47, 205–246 CrossRef CAS.
- J. M. Maier, P. Li, E. C. Vik, C. J. Yehl, S. M. S. Strickland and K. D. Shimizu, J. Am. Chem. Soc., 2017, 139, 6550–6553 CrossRef CAS PubMed.
- R. L. Brinkley and R. B. Gupta, AIChE J., 2001, 47, 948–953 CrossRef CAS.
- H. P. Paudel, W. Shi, D. Hopkinson, J. A. Steckel and Y. Duan, React. Chem. Eng., 2021, 6, 990–1001 RSC.
- Handbook of Chemistry and Physics, ed, D. R. Lide, CRC Press, Inc., Florida, 76th edn, 1995 Search PubMed.
- M. D. Alba, M. A. Castro, S. M. Clarke, S. Medina, L. Messe and C. Millán, Solid State Nucl. Magn. Reson., 2011, 40, 138–143 CrossRef CAS PubMed.
- L. Qi, R. Alamillo, W. A. Elliott, A. Andersen, D. W. Hoyt, E. D. Walter, K. S. Han, N. M. Washton, R. M. Rioux, J. A. Dumesic and S. L. Scott, ACS Catal., 2017, 7, 3489–3500 CrossRef CAS.
- J. Lentz and S. H. Garofalini, Phys. Chem. Chem. Phys., 2019, 21, 12265–12278 RSC.
- J. Zheng and M. D. Fayer, J. Am. Chem. Soc., 2007, 129, 4328–4335 CrossRef CAS PubMed.
- J. B. James and Y. S. Lin, J. Phys. Chem. C, 2016, 120, 14015–14026 CrossRef CAS.
- S. Venkatesan, in Separation and Purification Technologies in Biorefineries, ed. S. Ramaswamy, H.-J. Huang and B. V. Ramerao, John Wiley and Sons, Ltd, Chichester, 1st edn, 2013, vol. 1, pp. 101–143 Search PubMed.
Footnote |
| † Electronic supplementary information (ESI) available. See DOI: https://doi.org/10.1039/d3cp02493h |
| This journal is © the Owner Societies 2023 |