 Open Access Article
Formation of H3O+ and OH by CO2 and N2O trace gases in the atmospheric environment†
Daniele
Catone
 a,
Mattea Carmen
Castrovilli
 b,
Francesca
Nicolanti
c,
Mauro
Satta
 *de and
Antonella
Cartoni
 *e
*e
aIstituto di Struttura della Materia - CNR (ISM-CNR), Area della Ricerca di Roma 2, Via del Fosso del Cavaliere 100, 00133, Rome, Italy
bIstituto di Struttura della Materia - CNR (ISM-CNR), Area della Ricerca di Roma 1, Monterotondo Scalo 00015, Italy
cDepartment of Physics, Sapienza University of Rome, P. le Aldo Moro 5, Rome, 00185, Italy
dInstitute for the Study of Nanostructured Materials-CNR (ISMN-CNR), Department of Chemistry, Sapienza University of Rome, P. le Aldo Moro 5, Rome, 00185, Italy. E-mail: mauro.satta@cnr.it; Tel: + 39 06 49913381
eDepartment of Chemistry, Sapienza University of Rome, P. le Aldo Moro 5, Rome, 00185, Italy. E-mail: antonella.cartoni@uniroma1.it; Tel: + 39 06 49913678
First published on 18th September 2023
Abstract
The impact of cosmic rays’ energetic subatomic particles on climate and global warming is still controversial and under debate. Cosmic rays produce ions that can trigger fast reactions affecting chemical networks in the troposphere and stratosphere especially when a large amount of relevant trace gases such as carbon dioxide, methane, sulfur dioxide and water are injected by volcanic eruptions. This work focuses on synchrotron experiments and an ab initio theoretical study of the ion chemistry of carbon dioxide and nitrous oxide radical cations reacting with water. These molecules catalyze a fast exothermic formation of hydronium ions H3O+ and the hydroxyl radical OH, the main oxidant in the atmosphere. Moreover, theoretical calculations demonstrate that at the end of the catalytic cycle, CO2 and N2O are produced vibrationally excited and subsequently they quench in the microsecond time scale by collision with the surrounding atmospheric molecules at the pressure and temperature of the upper-troposphere/stratosphere. The chemistry involved in these reactions has a strong impact on the oxidant capacity of the atmosphere, on the sulfate aerosol production, on the cloud formation and eventually on the chemical networks controlling climate and global warming models.
1. Introduction
The role of ionic processes occurring in the atmosphere is still a challenging and controversial topic because of their potential effect on the formation and depletion of many chemical species relevant to climate models.1 Despite the fundamental role of neutrals in many chemical processes, ion–molecule reactions2 are also important because these reactions destroy or produce species through faster reactions. In the troposphere and stratosphere ions are formed by Cosmic rays’ energetic subatomic particles that enter Earth's atmosphere from space.3 The ionization rate due to cosmic rays is at its maximum value of about 20–40 cm−3 s−1 in the upper troposphere/lower stratosphere layer (as shown for instance in Fig. 1 of ref. 3). Ionization of gaseous air molecules, mainly N2 and O2, produces primary ions which afterwards react with other atmospheric molecules. Moreover, secondary particles such as protons, electrons and muons, lose their energy ionizing species as they propagate downwards. Svensmark4 has studied for many years the connection between cosmic rays, clouds, and climate. These studies are based on the observation that when there is a change in solar activity and hence in the flux of cosmic rays there is a change in climate because cosmic rays influence cloud formations which affects Earth's temperature. Indeed, cosmic rays can produce ions that stabilize and favor aerosol formation which leads to clouds. CLOUD Project Experiments performed in Ginevra at CERN from 2006 were also prepared to understand the influence of galactic cosmic rays (GCRs) on aerosols and clouds, and their implications for climate.5 They want to find out which trace gases and ions are involved in aerosol particle formation. However, this topic, due to its complex nature, remains the object of controversial studies based on laboratory measurements and on satellite data analysis.6 In the atmosphere, composed of a mixture of gases, the main components are N2 and O2 but also trace gases such as carbon dioxide, methane, water, nitrous oxide, ozone and sulfur dioxide are relevant in the atmospheric chemical networks. These gases are present in very little amount but cannot be neglected. They are emitted in the atmosphere by natural or anthropogenic sources and could have a key role in chemical reactions that change the budget of climate relevant species with consequent alteration of the atmospheric composition with potentially social and health severe effects. Chlorofluorocarbon molecules are a classic example of such trace gases. They interact with sun light and produce chlorine radicals that catalytically destroy the ozone molecules.7 One of the main cation present in the upper atmosphere is hydronium ion, the seed of water organic cluster whose climate effects are debated.8 The formation of H3O+ should be considered especially in regions of the atmosphere, as upper troposphere9 where water and trace gases are present and secondary subatomic particles can trigger ionization. Indeed, the atmosphere is a complex system subject to sudden and heterogeneous spatial and temporal changes in its chemistry and dynamics. For instance, recently, a large amount of water vapor has been injected into the stratosphere by the eruption of the submarine volcano Hunga Tonga–Hunga Ha’apai that has increased the amount of global stratospheric water vapor by more than 5–10%.10,11 This rare event can affect the chemistry of the stratosphere for several years and it should be considered, given that water vapor is the most abundant trace gas able to influence the climate by absorption and emission of infrared radiant energy.12,13 Volcanic eruptions also eject other trace gases, such as carbon dioxide, carbon monoxide and sulfur dioxide that could have a role in alternative chemical networks active in this modified atmosphere.In this scenario, the present manuscript focuses on an experimental and theoretical study of the ion chemistry of carbon dioxide and nitrous oxide radical cation with water. These molecules, as observed in the reaction of sulfur dioxide radical cation with water,14–16 can catalyze a fast production of hydronium ions and hydroxyl radical OH, the main oxidant present in the atmosphere.
2. Methods
2.1. Synchrotron experiments
The radiation available at the Circular Polarization beamline (CiPo) at the synchrotron Elettra (Trieste) has been used to produce carbon dioxide and nitrous oxide radical cations with different internal energies. The beamline already described in previous works,17–19 is equipped with a Normal Incidence Monochromator (NIM) and an electromagnetic elliptical undulator/wiggler providing monochromatized radiation photons in the 8–40 eV energy range. In these experiments, the aluminium grating of the NIM, operating in the energy range 8–18 eV has been used, with an energy resolution of about 20 meV. The photon energy was calibrated against the autoionization features observed in the Ar total photoionization cross-section between the 3p spin orbit components.20 Carbon dioxide or nitrous oxide was introduced in the ion source through a leak valve and the molecules were ionized by synchrotron radiation at a pressure of about 10−6–10−5 mbar. The CO2˙+ or N2O˙+ were then guided into the octupole reaction cell with several optical lenses at the nominal collision energy (CE) of 0 eV with an energy spread of about 100–150 meV. Water was introduced into the reaction cell (octupole) at room temperature and at different nominal pressures. The photoionization efficiencies curve (PIEC) of both N2O and CO2 were acquired by scanning the photon energy from their ionization energies to about 17 eV with a step of 0.02 eV and an acquisition time of 15 seconds per point. The PIEC of NO+ from N2O+ is also reported and acquired in the 14.0–18.0 eV photon energy range with a 0.02 eV step and an acquisition time of 10 seconds per point. Mass spectra were acquired at the photon energies of 13.5 (N2O) and 14.0 (CO2) eV before and after the introduction of water in the reaction cell and in the mass over charge (m/z) range 10–50. The measurements have been performed at different water pressures in the 10−6–10−5 mbar range and with acquisition time ranging from 1 to 5 seconds per point. Both reactions produce protonated molecules CO2H+ (m/z = 45), N2OH+ (m/z = 45) and H2O˙+ (m/z = 18) with a tiny signal at m/z = 19 due to hydronium ion H3O+ that become the most intense peak at high pressures. The intensities of the reagent and product ions were then acquired by scanning the photon energy in the range of 13.8–15.0 eV and 12.9–13.7 eV for CO2 and N2O respectively, with a step of 0.10 eV and an acquisition time of 30 seconds per point. The pressure measurements are affected by an error of about 30%. For the sake of clarity, the ˙ in radicals and radical cation is omitted in the following sections. Linearity of the product/reagent ratio with the pressure has been verified at different photon energies up to about 8.0 × 10⁻⁵ mbar.2.2. Theoretical calculations
In particular the ab initio calculations have employed the Density Functional Theory Double-hybrid approach, which is able to describe the radical nature of the species reacting during the charge and hydrogen transfer processes. The functional used in all calculations is the B2PLYP of Grimme23 and the basis set employed is the aug-cc-pVTZ which is based on triple zeta, including polarization, tight core and diffuse functions.24 All frequency calculations have been performed using the harmonic approximation and the electronic structure calculations have been done with the Gaussian code.25
The present reactions occur via open shell radical paths which are properly described with the level of calculation here used, as reported by the partial charge and spin analysis in the next paragraph. The scan of the reactive potential energy surfaces has been accomplished by scanning both the HO–H and H2O–OCO (H2O–ONN) coordinates with a variable step whose minimum value has been taken as 0.02 Å. All the other geometrical coordinates, except the scanning coordinates, have been optimized during the scans. The spin and charge population are described with the Mulliken analysis of the electron density.26
 | (1) |
 | (2) |
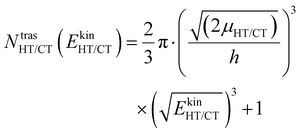
These two last unimolecular rate coefficients can be written in the adiabatic rotation approximation of the microcanonical transition state theory27 as:
 | (3) |
 | (4) |
The kinetic energy is given by three terms:
 | (5) |
 | (6) |
The branching ratio (BR) of the HT channels have been analysed to get information on the vibrational–translational energy partition of the products by comparing the experimental and theoretical BR. The theoretical BR of HT channel can be written as:
 | (7) |
 | (8) |
We have calculated the BR for each combination of vibrational–translational energies of the products (energy triplet:  ) at each photon energy hν, and with a 1.0 cm−1 energy scan. The optimal energy triplet was selected such that the theoretical BR was the closest to the experimental BR (with a maximum deviation of 2%), whose values were evaluated with the rate coefficients obtained by the procedure described in the ESI† (Section S2 see later).
3. Results and discussion
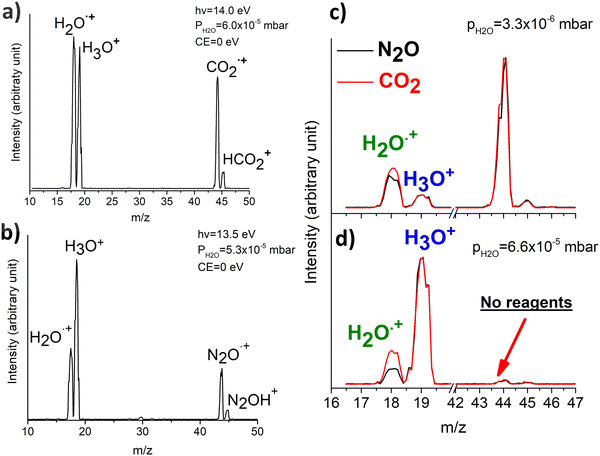
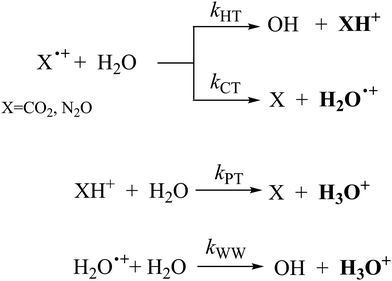
In Fig. 1(a) and (b) the mass spectra of the reactions involving CO2+ + H2O and N2O+ + H2O are shown, respectively. In Fig. 1(a) the peaks at m/z = 44, 45, 18 and 19 are due to the ions CO2+, HCO2+, H2O+ and H3O+, respectively, while in Fig. 1(b) the same m/z data are referred to N2O+, N2OH+, H2O and H3O+. The small peak at m/z = 30 (NO+) is due to a minor second order radiation contribution. In Fig. 1(c) and (d) the enlargement of the interested zone is shown for the two systems in the experiments performed under the same experimental conditions and during the same beam time, in two sequential measurements by changing only the neutral gas reagent in the ion source (CO2 in red and N2O in black) and keeping the water pressures fixed at the same nominal values of 3.3 × 10⁻⁶ and 6.6 × 10⁻⁵ mbar. At high pressure is evident that both the CO2+ and N2O+ ions react completely (Fig. 1(d)).By considering the observed ions in the mass spectra (Fig. 1) and the data from literature21 it is reasonable to assert that the reactions network is depicted as in Scheme 1.
Where PT is the proton transfer process and kWW is the rate coefficient of the hydrogen transfer reaction between two water molecules. The literature experimental rate coefficients k at 300 K are reported in Table 1.21 These data demonstrate that CT, PT and WW reactions are very fast and at the high pressure all products of the first two reactions, XH+ and H2O+, react completely with water leading to the sink ion H3O+. The thermochemical  data from the literature29 allow for the calculations of the thermochemistry of all reactions in Scheme 1. In the case of CO2 the HT, CT and PT are exothermic by 60.0, 113.0 and 150.1 kJ mol−1 while in the case of N2O they are exothermic by 10.1, 26.9 and 113.9 kJ mol−1. Finally, reaction between H2O+ and H2O is exothermic by 97.3 kJ mol−1. It is noteworthy to say that in the HT reaction with X = N2O only the oxygen atom [HONN]+ has been considered as the HT on N [HNNO]+ is endothermic by 15.4 kJ mol−1.
 (kJ mol−1) for the reactions in Scheme 1. Literature experimental rate coefficients k in cm3 s−1 molecule−1 at 300 K for the four reactions in Scheme 1. kHT and kCT have an error of 15%. kPT has an error of 20 and 25% in the reaction with CO2 and N2O, respectively and kWW of 10%
| Molecule | (HT) | (CT) | (PT) | (WW) | k HT | k CT | k PT | k WW |
|---|---|---|---|---|---|---|---|---|
| a CCSD(T)/aug-cc-pVTZ energies with B2PLYP/aug-cc-pVTZ geometries and zero point correction. | ||||||||
| CO2 | −60.0 | −113.0 | −150.1 | −97.3 | 6.00 × 10⁻¹⁰ | 1.80 × 10⁻⁹ | 2.65 × 10⁻⁹ | 2.05 × 10⁻⁹ |
| −60.8 | −112.0 | |||||||
| N2O | −10.1 | −26.9 | −113.9 | −97.3 | 2.10 × 10⁻¹⁰ | 1.89 × 10⁻⁹ | 2.83 × 10⁻⁹ | 2.05 × 10⁻⁹ |
| −14.3 | −29.6 | |||||||
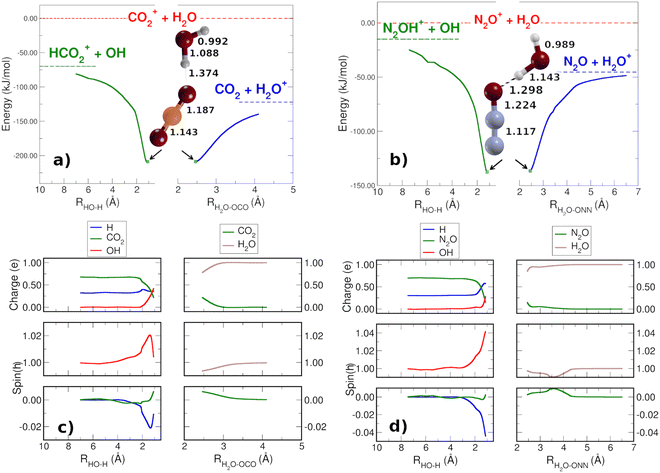
In order to check that there are not reaction barriers in the dissociation of the reactive complex, the Minimum Energy Path of the HT and CT reactions, both with carbon dioxide and nitrous oxide, have been calculated starting from the structure of the minimum adduct [X⋯H2O]+ (Fig. 2(a) and (b)) at the energies of 208.7 and 136.6 kJ mol−1 for CO2 and N2O, respectively. Once formed, the adduct ions can lead to CT or HT, with CT faster than HT. The reaction coordinate of CT is the distance between the oxygen atoms of water and nitrous oxide [H2O⋯ONN]+ and one of the O of CO2 [H2O⋯OCO]+. In the HT reaction, the O–H bond of H2O has been considered as the reaction coordinate. The spin and charge evolution of the two systems along the MEP from the adduct [X⋯H2O]+ ions are reported in Fig. 2(c) and (d). In the CT reaction, the charge and spin are mostly transferred to the water molecule in both adduct ions [H2O⋯X]+. In the case of HT, the spin is entirely on OH while the charge, up to 2 Å, is shared among X, the hydrogen involved in HT (blue H in Fig. 2(c) and (d)) and OH.
These pictures demonstrate that in HT the redistribution of the charge is a factor that, together with the lower reaction energy, probably makes HT slower than CT, where, in the adduct ions, both charge and spin are already in the final product H2O.
We also investigated the two reactions by changing the photon energies of the synchrotron radiation used to ionize the neutrals CO2 and N2O. Carbon dioxide and nitrous oxide have different ionization energies being (X2Πg) 13.777 ± 0.001 eV and (X2Π) 12.889 ± 0.004 eV, respectively.30 Their PIEC, reported in the ESI† in Fig. S3 and S4, have been acquired together with the PIEC of NO+ (Fig. S5, ESI†), the main fragment of nitrous oxide radical cation. In the case of CO2 the ionization efficiency is quite low at about 15.0 eV and no fragments have been observed up to this energy,21,31 and it is known that the first excited state A2Πu is at 17.331 eV.32 As regard N2O, the picture is more complex since several autoionizing resonances between the ground X2Π and the first excited state A2Σ+ (16.38 eV)33 of N2O+ start appearing at 13.9 eV. At about 14.77 eV the appearance of NO+ is observed (Fig. S5, ESI†) due to the dissociation of excited N2O* which autoionizes into N2O+(X2Π) and predissociates.34
For the above discussed reasons the reaction involving CO2+ + H2O and N2O+ + H2O have been studied in the photon energy range from 13.8 to 15.0 eV and 12.9 to 13.7 eV, respectively, to investigate the effect of the photon energy on the reactivity without the presence of fragments, resonances or electronic excited states.
In Fig. 3(a) and (b) the intensities of all ions involved in the reactions of CO2+ + H2O and N2O+ + H2O together with the ratio HCO2+/CO2+ (Fig. 3(c)) and N2OH+/N2O+(Fig. 3(d)) are reported as a function of photon energies and at CE = 0.
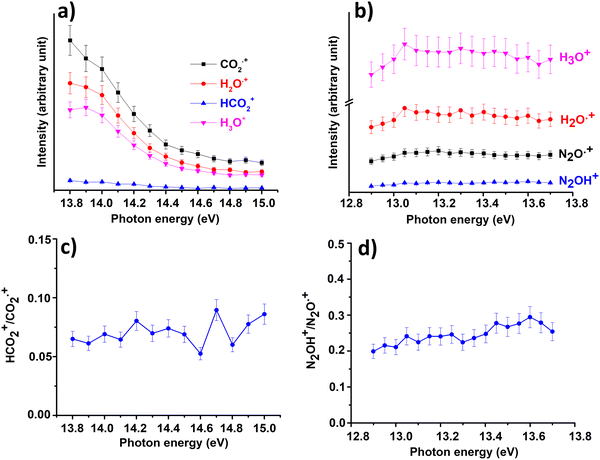 | ||
| Fig. 3 Intensities of the ions involved in the reactions of Scheme 1 with X = CO2 (a) and X = N2O (b) and the ratio HCO2+/CO2˙+ (c) and N2OH+/N2O˙+ (d) as a function of photon energy at the water pressure of 4.3 × 10⁻⁵ mbar and 8.2 × 10⁻⁵ mbar, respectively and CE = 0. Error bars are 10% of the values. | ||
These data show that the slowest HT channel could be weakly influenced by the internal energy of the CO2+ and N2O+ ions. These measurements do not directly provide the experimental rate coefficients k of processes HT and CT as a function of hv as well as the internal energy of the ions acquired during the interaction with photons. Nevertheless, these important quantities can be derived by the experimental mass intensities recorded as a function of photoionization energy (Fig. 3(a) and (b)) together with the experimental photoionization spectra (Fig. S3 and S4 shown in ESI†). These data allow the development of an appropriate kinetic model, described in detail in the ESI† (Section S2).
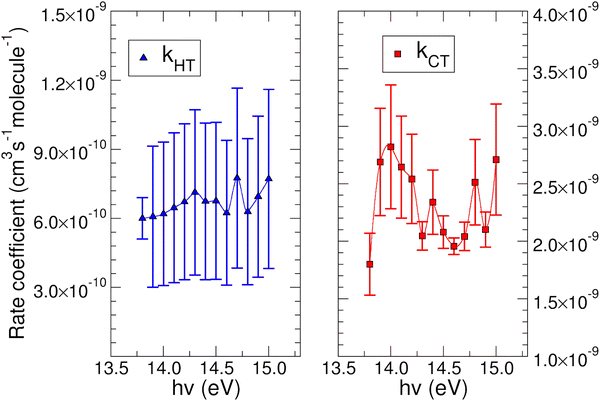
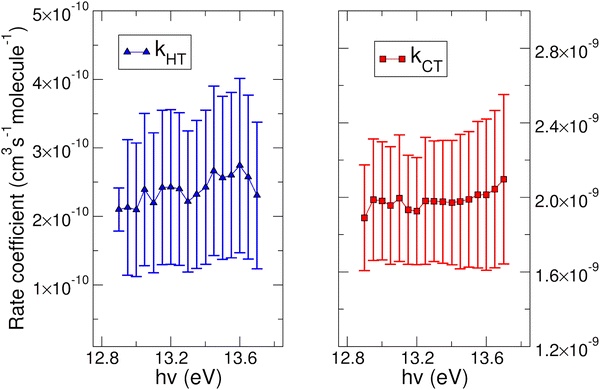
The experimental rate coefficients kHT and kCT as a function of photon energy derived for CO2+ + H2O and N2O+ + H2O reactions are shown in Fig. 4 and 5, respectively.
In both HT reactions, the derived experimental rate coefficients seem to be not influenced by hv in the explored photon energy range. This is also true for the CT in N2O+ + H2O, but the picture is more complex in the case of the reaction of water with carbon dioxide where a sinusoidal trend for kCTvs. hv is derived. In this case the rate coefficient increases from the threshold up to 14.0 eV, then goes down up to 14.6 eV and finally grows again up to 15.0 eV. These evidences suggest that the well-known complex vibronic structure of the ionic ground CO2+(X2Πg) state in the energy range 13.8–14.7 eV could affect the CT reactivity.35 Probably the HT is also influenced by the manifold vibronic band structures of CO2+, but errors do not allow highlighting this effect. Nevertheless, although our measurements are not state-selective for a specific vibrational level of the reagent ions, in the case of CO2+ is quite evident that vibrations in the ground state are involved in the photoionization process and affect its reactivity. Early studies,36–38 have already shown that the vibrational excitation of CO2+ has different effect, such as increasing the rate coefficient of CT with O2 and NO, while it decreases the rate coefficient in the HT with H2.
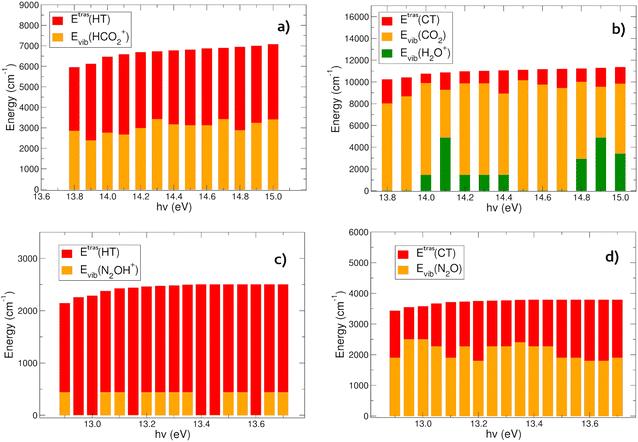
The vibrational content of the products (Evib) at the different photon energies, together with their relative kinetic energy (Etras) have been also evaluated following the procedure described in Section 2.2.2, and discussed in the following next Sections 3.1 and 3.2.
3.1. HT and CT Products in the reactions of CO2˙+ with H2O
In Fig. 6(a) and (b) the energies content of the products in the HT (panel a) and CT (panel b) reactions of CO2+ with H2O is reported. In the HT reaction, the OH is always in its vibrational ground level, and all the vibrational energy is in the HCO2+ ion. There is an almost constant trend in the energy partition between the vibrational and relative kinetic energies: the total energy (∼6000–7000 cm−1, evaluated with eqn (6)) at each hν partially goes to the relative motion of the products (EtrasHT between 3100 and 4072 cm−1) whereas HCO2+ is vibrationally excited between 2382 and 3412 cm−1 (see Tables S3 and S4 in the ESI†).The CT channel exhibits quite a different behavior in the energy partition of the products: here the relative kinetic energies are much lower than in the HT channel, with values in between 884 and 2224 cm−1. The great part of the energy goes to the vibrational levels of both products CO2 and H2O+. Carbon dioxide is excited with vibrational energies between 4391 and 10132 cm−1, with oscillations as a function of hν, and negatively correlated with the energy content of H2O+, which has vibrational levels excited between 0 and 4868 cm−1 (see Tables S3 and S5 in the ESI†). This behavior resembles the oscillations observed in the rate coefficient as a function of hv. When the rate coefficient is higher, at hv around 14.0 and greater than 14.6 eV, the vibrational levels of the H2O+ ion are excited. Overall the most substantial outcome of the CO2+ + H2O reaction is the vibrational heating of the neutral carbon dioxide, and at a less extent the vibrational heating of the water cation product.
3.2. HT and CT in the reactions of N2O˙+ with H2O
The CT and HT reactions of water with N2O+ as a function of the photoionization energies reveal a different scenario in the energy partition of the products at variance with the CO2 reactions. In Fig. 6(c) and (d) the energy distributions of the products in the two channels HT and CT, respectively, are reported. The data reveal that in this case the kinetic energy of the relative motion of the products plays a major role in the HT reaction (Fig. 6(c)). Here the N2OH+ is vibrationally excited only in its NNO in plane bending mode (see Tables S3 and S6, ESI†), while all the other frequency modes are spectator during the reactions. The relative kinetic energies here are within a range of 1706–2501 cm−1. The CT channel shows a very different trend in water cation vibrational excitation compared to the CO2 reaction. Here there is no involvement of the frequency modes of H2O+ during the charge transfer process. The neutral N2O molecule is vibrationally excited in a range between 1797 and 2495 cm−1, whereas the relative kinetic energies vary between 1048 and 1990 cm−1 (see Table S7, ESI†).In conclusion, the products energy distribution analysis shows that in the CT reactions of CO2+ and N2O+ with water, vibrationally hot neutrals CO2 and N2O products are formed. Considering the relevance of these molecules in the atmospheric environments, hereafter their relaxation mechanisms will be discussed and the radiative and collision quenching will be considered.
The calculated vibrational energies of CO2 and N2O (Tables S5 and S7, ESI†) at the photon energies investigated have been used to evaluate their vibrational radiative power and lifetime by using the high-temperature molecular spectroscopic database HITEMP (Section S3 in the ESI†).39 The vibrational radiative emission has been found to have radiation lifetimes higher than one second (see Tables S8 and S9 of ESI†). On the other hand, the vibrational–translational relaxation due to collisions with surrounding atmospheric molecules has lifetimes of the order μs40–42 at the upper tropospheric/stratospheric pressures of about 0.1 atm.43 Hence, the dominant quenching mechanism in this atmospheric environment is not radiative emission, but the collision of hot CO2 and N2O with the surrounding molecules. This relaxation mechanism is essentially similar to the energy transfer which CO2 undergoes after earth's IR excitation, and it points to the role of cosmic rays as not only effective in global climate cooling by triggering the formation of clouds, but also as a warming agent.6 On the other hand, the vibrational radiative emission mechanism becomes competitive with the collisional relaxation process only at lower pressures such those occurring in the outer space such as exosphere and the interstellar medium (P ≤ 10−7 atm).44
The results of this work are important for the role, sometime controversial and not yet well understood, of all these molecules on climate models, as for instance when they are injected into the stratosphere by volcanoes. Recently, the submarine volcano Hunga Tonga–Hunga Ha’apai eruption has increased the amount of global stratospheric water vapor by ca. 10%.11 During the volcanic eruption a large amount of gases are introduced into the atmosphere such as CO2, CH4, H2O, SO2 with a potential climate impact. Indeed, these molecules, which are greenhouse gases, can alter, among the others, the ozone layer, the stratospheric sulfate aerosol dynamic, cloud formation and in general the atmospheric chemistry.45–47 More specifically the H3O+ and OH species studied in the chemical network of the present work, have a relevant involvement in the atmospheric chemistry. Protonated mixed water organic clusters are among the most abundant cations in the stratosphere,48,49 and alter the Earth's radiative balance due to IR absortption.8 Hydroxyl radical OH is the key oxidant in the atmosphere50 and affect the oxidation of methane, the budget of ozone and the sulfate aerosol formation by reacting with SO2 thus with a potential climate effect.51,52 OH, primary formed by the reaction of O(1D) with H2O triggered by sunlight dissociation of O3 in O(1D) and O2, can also be formed by secondary processes. These processes are operative also during nighttime started either by neutral chemicals, mainly in the troposphere,50 or by ions, such as SO2+ CO2+ and N2O+ produced by cosmic rays. These ions can increase the rate coefficients of the reactions of several orders of magnitude53 with respect to the relative neutral reaction, resulting in a fast formation of reactive OH radicals and “hot” CO2 and N2O that can relax losing their vibrational energy by collisions.
4. Conclusions
In this work the mechanistic insights of the reactions involving CO2+ + H2O and N2O+ + H2O are reported and the rate coefficients as a function of photon energy are given. The results show that a chemical network is operative as shown in Scheme 2.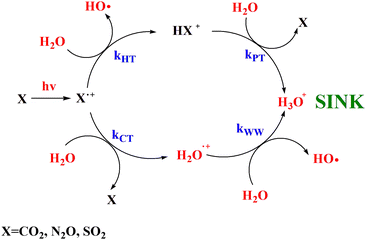 | ||
| Scheme 2 Catalytic scheme proposed for the reaction of CO2, N2O and SO2 with H2O in the gas phase under ionization conditions. | ||
Overall these processes do not destroy the molecules CO2 and N2O, rather, their ionization by cosmic rays’ catalyze the transformation of H2O in H3O+ and OH as also observed with the molecule SO2 investigated in our previous works.15,16 Moreover, theoretical calculations demonstrates that CO2 and N2O molecules are reformed in excited vibrational levels that in microseconds time scale quench via collision with the surrounding molecules at the typical pressures and temperatures of the upper troposphere/stratosphere and warming the surrounding atmosphere. In conclusion this work highlights the relevance of ion chemistry of trace gases and of laboratories studies that can improve the knowledge of the role of ions to climate and global warming, a challenging scientific topic of our days.54,55
Author contributions
Daniele Catone and Mattea Carmen Castrovilli: performed experiments and data analysis, review & editing. Francesca Nicolanti: review & editing. Mauro Satta: conceptualization, performed theoretical calculations, writing – original draft, review & editing. Antonella Cartoni: supervision, conceptualization, performed experiments and data curation, writing – original draft, review & editing.Conflicts of interest
The authors declare that they have no known competing financial interests or personal relationships that could have appeared to influence the work reported in this paper.Acknowledgements
We thank Fabio Zuccaro for assistance during the experiments on the beamline CiPo of Elettra Synchrotron. We acknowledge Elettra Synchrotron Trieste for providing access to its synchrotron radiation facilities and for financial support. This article is based upon work from COST action CA18212 – Molecular Dynamics in the GAS phase (MD-GAS).References
- D. Siingh and R. P. Singh, J. Phys., 2010, 74, 153–168 CAS.
- D. Catone, M. Satta, M. C. Castrovilli, L. Avaldi and A. Cartoni, Chem. Phys. Lett., 2021, 771, 138467 CrossRef CAS.
- I. A. Mironova, K. L. Aplin, F. Arnold, G. A. Bazilevskaya, R. G. Harrison, A. A. Krivolutsky, K. A. Nicoll, E. V. Rozanov, E. Turunen and I. G. Usoskin, Space Sci. Rev., 2015, 194, 1–96 CrossRef CAS.
- H. Svensmark, M. B. Enghoff, N. J. Shaviv and J. Svensmark, Nat. Commun., 2017, 8, 1–9 CrossRef CAS PubMed.
- E. M. Dunne, H. Gordon, A. Kürten, J. Almeida, J. Duplissy, C. Williamson, I. K. Ortega, K. J. Pringle, A. Adamov and U. Baltenspergere, et al. , Science, 2016, 354, 1119–1124 CrossRef CAS PubMed.
- V. Kumar, S. K. Dhaka, M. H. Hitchman and S. Yoden, Sci. Rep., 2023, 13, 3707 CrossRef CAS PubMed.
- S. Solomon, Rev. Geophys., 1999, 37, 275–316 CrossRef CAS.
- K. L. Aplin and R. A. McPheat, J. Atmos. Sol.-Terr. Phys., 2005, 67, 775–783 CrossRef CAS.
- T. Leblanc, T. D. Walsh, I. S. McDermid, G. C. Toon, J.-F. Blavier, B. Haines, W. G. Read, B. Herman, E. Fetzer and S. Sander, et al. , Atmos. Meas. Tech., 2011, 4, 2579–2605 CrossRef.
- H. Vömel, S. Evan and M. Tully, Science, 2022, 377, 1444–1447 CrossRef PubMed.
- S. Khaykin, A. Podglajen, F. Ploeger, J.-U. Grooß, F. Tence, S. Bekki, K. Khlopenkov, K. Bedka, L. Rieger and A. Baron, et al. , Commun. Earth Environ., 2022, 3, 316 CrossRef.
- S. Jenkins, C. Smith, M. Allen and R. Grainger, Nat. Clim. Change, 2023, 13, 127–129 CrossRef.
- P. Sellitto, A. Podglajen, R. Belhadji, M. Boichu, E. Carboni, J. Cuesta, C. Duchamp, C. Kloss, R. Siddans and N. Bègue, et al. , Commun. Earth Environ., 2022, 3, 288 CrossRef.
- G. de Petris, A. Cartoni, A. Troiani, G. Angelini and O. Ursini, Phys. Chem. Chem. Phys., 2009, 11, 9976 RSC.
- A. Cartoni, D. Catone, P. Bolognesi, M. Satta, P. Markus and L. Avaldi, Chem. – Eur. J., 2017, 23, 6772–6780 CrossRef CAS PubMed.
- M. Satta, A. Cartoni, D. Catone, M. C. Castrovilli, P. Bolognesi, N. Zema and L. Avaldi, ChemPhysChem, 2020, 21, 1146–1156 CrossRef CAS PubMed.
- M. Satta, P. Bolognesi, A. Cartoni, A. R. Casavola, D. Catone, P. Markus and L. Avaldi, J. Chem. Phys., 2015, 143, 244312 CrossRef PubMed.
- A. Cartoni, A. R. Casavola, P. Bolognesi, S. Borocci and L. Avaldi, J. Phys. Chem. A, 2015, 119, 3704 CrossRef CAS PubMed.
- A. Cartoni, P. Bolognesi, E. Fainelli and L. Avaldi, J. Chem. Phys., 2014, 140, 184307 CrossRef PubMed.
- G. V. Marr and J. B. West, At. Data Nucl. Data Tables, 1976, 18, 497–508 CrossRef CAS.
- V. G. Anicich, An Index of the Literature for Bimolecular Gas Phase Cation-Molecule Reaction Kinetics, JPL Publication, 2003, pp.3–19 Search PubMed.
- T. Su and W. J. Chesnavich, J. Chem. Phys., 1982, 76, 5183–5185 CrossRef CAS.
- S. Grimme, J. Chem. Phys., 2006, 124, 034108 CrossRef PubMed.
- R. A. Kendall, T. H. Dunning and R. Harrison, J. Chem. Phys., 1992, 96, 6796–6806 CrossRef CAS.
- M. J. Frisch, G. W. Trucks, H. B. Schlegel,G. E. Scuseria, M. A. Robb, J. R. Cheeseman, G. Scalmani, V. Barone, G. A. Petersson, H. Nakatsuji, X. Li, M. Caricato, A. Marenich, J. Bloino, B. G. Janesko, R. Gomperts, B. Mennucci, H. P. Hratchian, J. V. Ortiz, A. F. Izmaylov, J. L. Sonnenberg, D. Williams-Young, F. Ding, F. Lipparini, F. Egidi, J. Goings, B. Peng, A. Petrone, T. Henderson, D. Ranasinghe, V. G. Zakrzewski, J. Gao, N. Rega, G. Zheng, W. Liang, M. Hada, M. Ehara, K. Toyota, R. Fukuda, J. Hasegawa, M. Ishida, T. Nakajima, Y. Honda, O. Kitao, H. Nakai, T. Vreven, K. Throssell, J. A. Montgomery, Jr., J. E. Peralta, F. Ogliaro, M. Bearpark, J. J. Heyd, E. Brothers, K. N. Kudin, V. N. Staroverov, T. Keith, R. Kobayashi, J. Normand, K. Raghavachari, A. Rendell, J. C. Burant, S. S. Iyengar, J. Tomasi, M. Cossi, J. M. Millam, M. Klene, C. Adamo, R. Cammi, J. W. Ochterski, R. L. Martin, K. Morokuma, O. Farkas, J. B. Foresman and D. J. Fox, Gaussian 09, Revision A.02, ct technical report, Gaussian, Inc., Wallingford, 2016 Search PubMed.
- R. S. Mulliken, J. Chem. Phys., 1955, 23, 1833–1840 CrossRef CAS.
- J. L. Bao and D. G. Truhlar, Chem. Soc. Rev., 2017, 46, 7548–7596 RSC.
- M. Satta, D. Catone, M. C. Castrovilli, P. Bolognesi, L. Avaldi, N. Zema and A. Cartoni, J. Phys. Chem. A, 2022, 126(22), 3463–3471 CrossRef CAS PubMed.
- B. Ruscic and D. H. Bross, Active Thermochemical Tables (ATcT) Values Based on ver. 1.122p of the Thermochemical Network, 2020, https://atct.anl.gov/ (accessed 2023-02-01) Search PubMed.
- NIST Chemistry WebBook, ed. P. J. Linstrom and W. G. Mallard, NIST Standard Reference Database number 69; National Institute of Standards and Technology, Gaithersburg, MD, 2005, http://webbook.nist.gov (accessed January 2023) Search PubMed.
- J. H. D. Eland, Int. J. Spectrom. Ion Phys., 1972, 9, 397–406 CrossRef CAS.
- M. Baer and P. M. Guyon, J. Chem. Phys., 1986, 85, 4765 CrossRef.
- E. Kinmonda, J. H. D. Eland and L. Karlsson, Int. J. Mass Spectrom., 1999, 185–187, 437–447 CrossRef.
- J. L. Olivier, R. Locht and J. Momigny, Chem. Phys., 1982, 68, 201–211 CrossRef CAS.
- J. Liu, W. Chen, C.-W. Hsu, M. Hochlaf, M. Evans, S. Stimson and C. Y. Ng, J. Chem. Phys., 2000, 112(24), 22 CrossRef.
- C. Nicolas, C. Alcaraz, R. Thissen, J. Žabka and O. Dutuit, Planet. Space Sci., 2002, 50, 877–887 CrossRef CAS.
- E. Alge, H. Villinger and W. Lindinger, Plasma Chem. Plasma Process., 1981, 1, 65–71 CrossRef CAS.
- G. Borodi, A. Luca and D. Gerlich, Int. J. Mass Spectrom., 2009, 280, 218–225 CrossRef CAS.
- L. S. Rothman, I. E. Gordon, R. J. Barber, H. Dothe, R. R. Gamache, A. Goldman, V. Perevalov, S. A. Tashkun and J. Tennyson, J. Quant. Spectrosc. Radiat. Transfer, 2010, 111, 2139–2150 CrossRef CAS.
- Z. Baalbaki and H. Teitelbaum, Chem. Phys., 1986, 104, 83–106 CrossRef CAS.
- F. Cannemeyer and A. E. De Vries, Physica, 1974, 74, 196–204 CrossRef CAS.
- R. M. Siddles, G. J. Wilson and C. J. S. M. Simpson, Chem. Phys., 1994, 189, 779–791 CrossRef CAS.
- M. Pidwirny, Atmospheric Pressure, Fundamentals of Physical Geography, 2nd edn, 2006 Search PubMed.
- K. M. Ferriere, Rev. Mod. Phys., 2001, 73, 1031 CrossRef CAS.
- J. G. Anderson, D. M. Wilmouth, J. B. Smith and D. S. Sayres, Science, 2012, 337, 835–839 CrossRef CAS PubMed.
- M. M. Joshi and G. S. Jones, Atmos. Chem. Phys., 2009, 9, 6109–6118 CrossRef CAS.
- L. Millán, M. L. Santee, A. Lambert, N. J. Livesey, F. Werner, M. J. Schwartz, H. C. Pumphrey, G. L. Manney, Y. Wang, H. Su, L. Wu, W. G. Read and L. Froidevaux, Geophys. Res. Lett., 2022, 49, 1–10 CrossRef PubMed.
- G. Henschen and F. Arnold, Nature, 1981, 291, 211–213 CrossRef CAS.
- N. S. Shuman, D. E. Hunton and A. A. Viggiano, Chem. Rev., 2015, 115, 4542–4570 CrossRef CAS PubMed.
- J. Lelieveld, S. Gromov, A. Pozzer and D. Taraborrelli, Atmos. Chem. Phys., 2016, 16, 12477–12493 CrossRef CAS.
- V. Vaida, J. Chem. Phys., 2011, 135, 020901 CrossRef PubMed.
- M. Li, E. Karu, C. Brenninkmeijer, H. Fischer, J. Lelieveld and J. Williams, npj Clim. Atmos. Sci., 2018, 29, 1–7 Search PubMed.
- J. H. Futrell and T. O. Tiernan, Science, 1968, 162, 415–422 CrossRef CAS PubMed.
- J. B. Burkholder, J. P. D. Abbatt, I. Barnes, J. M. Roberts, M. L. Melamed, M. Ammann, A. K. Bertram, C. D. Cappa, A. G. Carlton and L. J. Carpenter, et al. , Environ. Sci. Technol., 2017, 51, 2519–2528 CrossRef CAS PubMed.
- M. Satta, M. C. Castrovilli, F. Nicolanti, A. R. Casavola, C. Mancini Terracciano and A. Cartoni, Condens. Matter, 2022, 46, 1–30 Search PubMed.
Footnote |
| † Electronic supplementary information (ESI) available. See DOI: https://doi.org/10.1039/d3cp02427j |
| This journal is © the Owner Societies 2023 |

