Er3+ doped nanoparticles as upconversion thermometer probes in confined fluids†
Received
15th May 2023
, Accepted 15th June 2023
First published on 4th July 2023
Abstract
Non-contact temperature measurement at the nanoscale by photoluminescence using a nano-sensor in a confined fluid has been performed in the present work. Upconversion lanthanide-doped nanoparticles applied to ratiometric thermometry could be considered as a self-referenced nanosensor. Gadolinium orthovanadate (GdVO4) nanoparticles doped with Yb3+ and Er3+ were synthesized and then dispersed in an ester-based fluid. Rheological measurements show that the viscosity of the dispersed NP suspension remains unchanged up to a shear rate of 10−4 s−1 at 393 K. The NP suspension allows luminescence intensity ratio (LIR) thermometry up to 473 K with a relative sensitivity of 1.17% K−1 with a NIR laser. Then, the temperature calibration by coupling the high pressure (1.08 GPa max) confirmed the applicability of NPs as a thermosensor in a variable pressure environment. According to these results, the fluid containing GdVO4:Yb3+/Er3+ nanoparticles can be used for temperature sensing in a pressurized environment for further application in tribology.
1. Introduction
Temperature and pressure are fundamental parameters affecting the physicochemical properties of materials. Their measurements are crucial for both scientific and industrial applications. In many applications, they have to be measured locally in submicron-sized areas: nano-manometry and mano-thermometry in biomedical applications, microfluidics, and catalysis as well as in tribology. In tribological measurements, temperature and pressure are crucial parameters for understanding and predicting the behavior of the interface between solids in contact. Local temperature and pressure changes between two contacting friction surfaces affect the rheological properties of the interface, which has an important influence on the life and performance of the tribological system.1,2 To understand the friction between two materials in contact, local temperature and pressure measurement with high accuracy and efficiency has become a major topic in tribology research. Well-known techniques for measuring temperature in friction include (1) a thermocouple inserted in the material 2 mm below the sliding surface; (2) infrared thermography; and (3) Raman micro-spectroscopy.3,4 However, reliable measurement with good spatial and temporal resolution of temperature, or other physical parameters in frictional contact is not a simple matter.
The application of Raman spectroscopy to tribological measurements has recently been studied for local pressure mapping in the case of lubricated contact with a fluid by Jubault et al.5,6 and Yagi et al.7 In such experiments, this technique provides a precise and accurate pressure measurement with a higher spatial and temporal resolution than other temperature measurement techniques. However, it requires the selection of a fluid that exhibits strong Raman scattering, which is not the case for most lubricants. Infrared thermography collects the IR emission from the tribological contact. It is then possible to measure the temperature all over the contact area by using a full-field IR camera. A drawback of this technique is the calibration process. Indeed, different sources (solid surfaces and bodies, lubricant films or the interface and the environment) contribute to the overall IR radiation and must be separated by applying appropriate coatings to the transparent disc and/or using different filters. These issues can be solved using non-contact nano-manometers and nanothermometers. Recent studies have been carried out by Albahrani et al.8 and Seoudi et al.9 on the application of a nano-sensor for measuring temperature and pressure in a lubricating fluid. In their studies, CdSe/CdS/ZnS core/shell/shell quantum dots (QDs) were used as a calibrated nano-sensor for temperature and pressure (under 0.2 to 1.3 GPa between 0 and 100 °C) by their change in emission energy shift. The main drawback of this technique was the coupled dependence of the emission energy to pressure and temperature, while pressure and temperature generally vary independently in tribological contact.
It is therefore essential to find out a suitable optical thermometric sensor for temperature measurement under multivariable conditions. In tribological measurement, pressure independence should be required. Meanwhile, to reduce the measurement scale to achieve high spatial resolution, the miniaturized size of the sensor is one of the most important conditions. Over the past decades, many photoluminescent nanothermometers have been studied, such as fluorescent dyes10–12 and CdSe-based9,13 and perovskite based14,15 quantum dots. Temperature sensitivity could be demonstrated by their spectroscopic properties, such as emission spectral shift, variation in emission intensity, and change in emitter lifetime. Among the spectral variables of thermometry, the luminescence intensity ratio (LIR) is well-known as a self-referenced measurement method, which will not be influenced by the absolute intensity of the emission.16–25 This feature is particularly needed in dynamic measurement, where the sensor concentration cannot remain constant. Nanoparticles doped with lanthanide ions (Ln3+)26,27 are one of the main families of photoluminescence nanothermometers and are commonly used as LIR thermometers. Thanks to the special property of Er3+, it provides thermally coupled energy levels (2H11/2 and 4S3/2) that are suitable for temperature measurement in the range 293–473 K, with high sensitivity.28–32 The relatively small gap between the energy levels (about 600–800 cm−1) allows excited electrons to be thermally promoted to a higher level. The proportion of thermally promoted electrons follows the Boltzmann distribution,33 which allows the temperature to be calibrated by measuring the ratio of the emission intensity of its two thermally coupled energy levels. Besides the aforementioned favorable luminescence properties, they exhibit also relatively low cytotoxicity, resistance to photobleaching, thermal decomposition and oxidation processes. Therefore, they can be used in various applications including biomedical ones.
However, considering the scattered medium for the Er3+-based fluorescence sensor in temperature measurement, the current excitation by laser of Er3+ under green light can cause interfering emission from the scattered medium. To solve this problem, the Er3+-based fluorescence sensor could be excited via an upconversion (UC) system, with low-energy absorption to induce high-energy emission.34,35 Er3+ combined with a sensitizing ion such as Yb3+ can be excited using a near-infrared (NIR) laser via the energy transferred by Yb3+. The use of an NIR excitation source avoids the possible emission of scattered media during the visible excitation.36,37 In the UC system, several experimental parameters need to be carefully controlled to obtain accurate Er3+ thermometry, such as the effects induced by the NIR laser,29,38–41 the optical quenching effect42–45 and the chemical properties of the sensor.46–49 These parameters can be affected by other physical influencing factors. As an example, in tribological applications, local pressure can cause potential damage or material degradation. Under high pressure, the nano-sensor could be modified and thus its optical properties could change.50,51 Studies in the literature have shown that high pressure (up to 25 GPa) can cause variations in Er3+-doped materials due to structural changes such as shortening of interionic distances and shifting energy levels. These variations modify the probability of transitions and therefore have an impact on the position and intensity of the photoluminescence peak.52–58 Since the inorganic structure is stable under compression, a relatively high pressure is usually required to cause a structural variation. Under low-range pressure (below 6 GPa), the pressure sensitivity on SrF2:Yb3+,Er3+ has been reported in Runowski's works in 2017, variations in lifetime, emission intensity and peak centroid were observed under compression up to 5.5 GPa.57 Moreover, the pressure-sensing properties of upconversion Yb3+/Er3+ doped fluoride nanoparticles have also been found to vary the red-to-green ratio, lifetime and brightness of Er3+ with pressure up to 5.4 GPa by McLellan et al.58
Nonetheless, pressure sensitivity up to 1 GPa has not yet been reported by Ln-doped nanoparticles. As mentioned previously, for further application in tribology, the temperature measurement must be stable under specific conditions, such as high pressure (up to 3 GPa) and high shear rates (up to 106 s−1). Indeed, besides temperature, pressure and shear stress are the other two key parameters that vary in tribological contact. In this work, we studied the effect of a more moderated pressure (up to 1 GPa) on the LIR thermometry of Er3+doped nanoparticles. As the nano-sensor will be used in a specific medium for further tribological measurements, the GdVO4:Yb3+/Er3+ upconversion nano-sensor was synthesized and then dispersed in a lubricant (ester-based oil). Among the various possible matrices, it offers a number of advantages, including very simple synthesis in the form of very small particles (<50 nm). The hydrophilic surface of the nanoparticles after co-precipitation synthesis means that the dispersion of the nanoparticles in the lubricant can be optimised for future tribological applications. Moreover, the vanadate matrix provides very good sensitivity for Er3+/Yb3+ thermometry.59,60 It has the disadvantage of having a fairly high phonon energy,61 but our previous study has already shown that this disadvantage is negligible in low concentration suspension.62 The thermometric characteristics have also been studied as a function of dispersion and laser power conditions.62 As GdVO4 is known to exhibit a phase transition from a zircon-like to a scheelite-like structure at 6.8 GPa, this nanosensor should be used exclusively in a pressure range below 6 GPa.63 The concentration of NPs GdVO4:Yb3+/Er3+ in the suspension was selected according to hydrodynamic size and rheological properties. The photoluminescence thermometry of the dispersed GdVO4:Yb3+/Er3+ nano-sensor was characterized up to 423K. The effect of pressure on the dispersed suspension of the GdVO4:Yb3+/Er3+ nano-sensor was studied in a diamond anvil cell (DAC) at pressures up to 1 GPa and at different temperatures.
2. Materials and methods
2.1. Materials
GdVO4.
Yb3+/Er3+ (x(Yb) = 0.10; x(Er) = 0.02) Nanoparticles were synthesized by a chemical co-precipitation technique.16,26,64–66 The precise synthesis method can be found in our previous work.62
Suspension of NPs GdVO4.
Yb3+/Er3+ was prepared by adding the ground powder in an ester-based oil (Nycobase 5750: conventional mono-pentaerythritol lubricating oil, supplied by NYCO, Paris, France) at various weight concentrations, followed by mechanical stirring and ultrasonic treatment at room temperature for 30 minutes.
2.2. Characterizations
The crystalline phase of the synthesized nanoparticles was characterized using an X-ray diffractometer (Bruker D8 Advance diffractometer) with Cu Kα radiation (λ = 1.54060 Å) operating at 45 kV and 30 mA at room temperature. Scanning electron microscopy (Zeiss Merlin Compact SEM) is performed for the analysis of the morphology, using a secondary electron detector at a low accelerating voltage up to 5 kV. The morphology of the nanoparticles was analyzed by transmission electron microscopy (TEM, JEOL 2100F 200 kV) with a secondary electron detector. The hydrodynamic size of the NPs in the suspension was calculated by the Dynamic Light Scattering (DLS, Malvern-Zetasizer) at different concentrations.
The viscosity of the colloidal suspension was determined using a rheometer (Physica MCR301, Anton Paar) with a parallel-plate geometry (PP40), at different temperatures (293–373 K, ± 0.03 K) and imposing a shear rate (range between 1 and 104 s−1). During the measurement, a steel plate is rotating against a glass plate, and the gap between the two parallel plates was fixed at 0.2 mm. A transparent glass plate will be used for further optical measurement. The uncertainty on viscosity measurement is about 5%.
For the optical characterizations, the absorption spectrum of the NPs powder was acquired using a LAMBDA 365 UV/Vis (PerkinElmer) Spectrophotometer from 350 to 1100 nm, in an integrating sphere. The emission spectra were obtained using a modular spectrofluorometer, upon excitation of a continuous-wave NIR laser (970 nm, MDL-2W) focused on the sample to a spot size of 4 mm2. The spectrometer is equipped with a detector (CCD, Short Focal Length Triple Grating Imaging Spectrographs, TRIAX 320 HORIBA) and an optical fiber. At ambient pressure, the NP powder was deposed on a silicon slice for better thermal transfer, the fluid was poured into a sapphire bowl closed with a glass lid for the emission acquisition. Data were collected after 10 s of temperature and laser stabilization, from 293 to 573 K (each 5 K) for the powder and from 298 to 423 K (each 5 K) for the fluid. The temperature was controlled using a thermo-cell (LINKAM Optical DSC600 cell).
Temperature calibrations under pressure were carried out using a high-pressure diamond anvil cell (DAC), as shown in Fig. S1 (ESI†), with a working hydrostatic pressure range of up to 1.3 GPa in Nycobase. According to the method described in previous work,9 the DAC (MDAC type BHP for Biology 100° symmetrical aperture, Betsa) consists of a 1.4 mm culet diamond anvil and a 400 mm thick diamond window, with a nickel gasket between them. The nickel gasket thickness was about 0.2 mm and comprises a hole of 0.5 mm in diameter. The pressure inside the DAC was increased and maintained in the cell by inflating an internal membrane with helium. A heating ring (External Heating System, Betsa) was placed around the DAC for temperature regulation. A thermocouple inserted next to the metal seal in the DAC was used to measure the temperature of the sample with a precision of ±0.1 K. During the experiments, a small amount of suspended sample (<1 μL) was introduced into the hole in the seal. The hydrostatic pressure inside the DAC was determined by introducing ruby microparticles (>3 μm) as a pressure sensor for calibration using their photoluminescence wavelength shift R1. These ruby microparticles were excited by a 460 nm laser. The wavelength position of the emission spectrum was referenced using an Argon lamp (Avalight-CAL-Mini) with a peak at 696.54 nm. The calibration of the hydrostatic pressure was based on previous literature.67,68 Based on previous work, the pressure uncertainty can be considered to be of the order of 0.05 GPa.9
2.3. Data analysis
Luminescence intensity ratio (LIR) calculation.
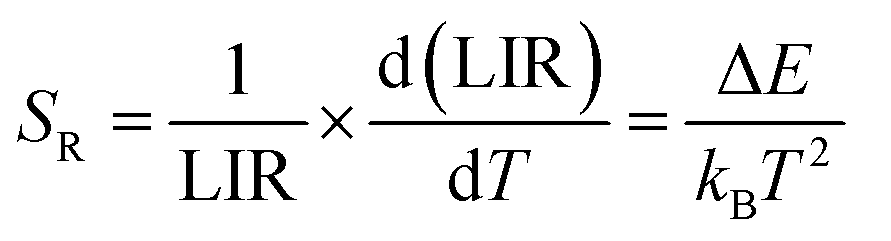
The Er3+ thermometry is performed by the LIR variation in the function of temperature. According to the Boltzmann distribution, the population ratio of the two thermally coupled levels (TCLs) (NL2 and NL1) varies with temperature following eqn (1).| |  | (1) |
where Ni denotes the population of excited ions, as the population of the energy level (N) is directly proportional to the emitted intensity (I), and Ii is thus the emitted intensity for a given level i. The pre-exponential constant B includes gi, σi, and ωi, which are the degeneracy, the effective emission cross-section, and the angular frequency of the transitions for a given level i, respectively. ΔE is the energy gap between the two TCLs, k is the Boltzmann constant, and T is the absolute temperature.33 The emitted intensity was calculated by the integrated band area to average the total emitted intensities for each sublevel's transition.69 The integrated area is estimated by MATLAB software according to Simpson‘s rule, from 540 to 567 nm for level L1 (4S3/2 to 4I15/2) and from 512 to 540 nm for level L2 (2H11/2 to 4I15/2) (Fig. S2, ESI†). ΔE can be then determined by the calibration curve of Ln(LIR) versus 1/T. Moreover, SR (relative thermal sensitivity), defined by eqn (2), is an important indicator of the reliability of the measurement.70| |  | (2) |
LIR experimental uncertainty determination.
The intrinsic experimental uncertainty in the emission intensity (δI/I) is detector-dependent and is mainly determined by the value of the signal-to-noise ratio (SNR)71 (eqn (1), ESI†). The SNR of the CCD detector used for our measurement is stated by the manufacturer to be at best 0.05%. However, the detector operates with greater uncertainty, and, therefore, the δI/I value is always higher than the indicated intrinsic SNR. The SNR is estimated experimentally for each spectrum by dividing the baseline spectral fluctuation by the peak intensity (NL2 and NL1). The experimental uncertainty is then determined by eqn (3).| |  | (3) |
3. Results
The results section will be divided into two parts. The first part deals with the characterizations of GdVO4:Yb3+/Er3+ powder and the second one with the characterizations of GdVO4:Yb3+/Er3+ dispersed at 0.5 wt% in a lubricant oil (Nycobase 5750).
3.1. Powder: GdVO4:Yb3+/Er3+ NPs
Structural characterizations.
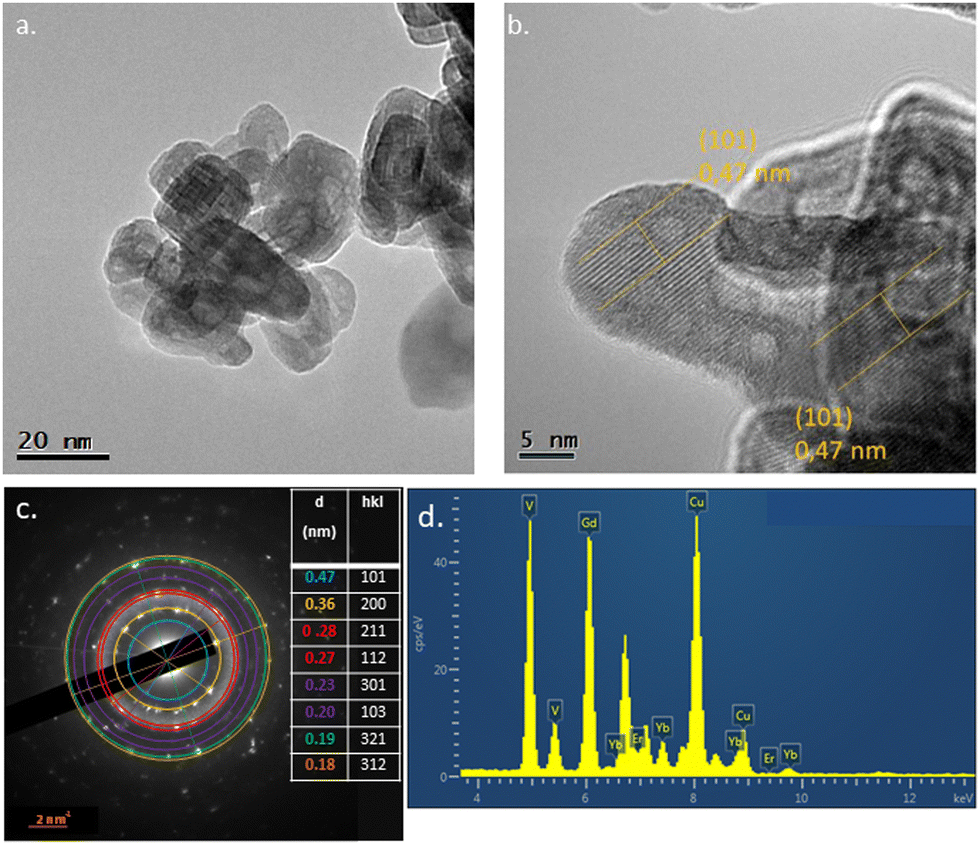
The crystalline phase of the synthesized nanoparticles GdVO4:Yb3+/Er3+ has been determined to be a pure tetragonal phase (JCPDC-17-0260) in our previous work (Fig. 1a).62 The SEM image of NPs GdVO4:Yb3+/Er3+ shows that the size of individual NP is about 30 nm (Fig. 1b). The TEM image (Fig. 2a) confirms that the particle size is of the order of 30 nm and shows the porosity of the particles induced by atomic diffusion during heat treatment. The HR TEM image (Fig. 2b) shows reticular planes 0.47 nm apart, which is consistent with the plane distance (101) of GdVO4 (JCPDS-17-0260). The electron diffraction pattern (Fig. 2c) confirms the presence of crystalline GdVO4 (JCPDS-17-0260). Finally, the EDS spectrum (Fig. 2d) confirms the chemical composition of the probes, which contain Gd (28.9 at%), V (28.5 at%), Yb (4 at%) and Er (low content). This analysis leads to a Yb/Gd ratio of 0.14, consistent with the theoretical one (Yb/Gd = 0.10). The agglomerates formed by NPs size about 400 nm, which has been confirmed by TEM image,62 This result has also been observed in other's work.72
 |
| | Fig. 1 XRD pattern (a) and SEM image (b) of GdVO4:Yb3+/Er3+ NPs powder. | |
 |
| | Fig. 2 TEM picture (a), HRTEM picture (b) electron diffraction pattern (c), and EDS spectrum (d) of GdVO4:Yb3+/Er3+ NPs powder. | |
Optical characterizations.
Fig. 3a shows the powder absorption and emission (upon 970 nm excitation) spectra in blue and green lines, respectively. The GdVO4:Yb3+/Er3+ NPs powder absorbs a broad band of light in the NIR range, around 985 nm, due to the presence of the Yb3+ sensitizer of the Er3+ emitter. In the emission spectrum upon NIR laser excitation (970 nm), the NPs are able to emit green light (525 & 552 nm), from the Er3+ excited levels (2H11/2 & 4S3/2, respectively) to the ground state.28,72,73 The inset shows as well, that the powder emits strong green light when using a NIR laser pen. The proposed excitation mechanism is thus presented in Fig. 3b: upon excitation at 970 nm, Er3+ can be excited to the 4F7/2 excited state by two sequentially absorbed photons (ground-state absorption (GSA) and excited-state absorption (ESA), respectively, indicated by the black dotted arrow).60,74–77 When Yb3+ is present in the system, the energy transfer between Yb3+ and Er3+ would occur mainly in the Er3+excitation pathway. Since Yb3+ has a much larger absorption effective cross-section in the NIR region than Er3+ (2I15/2 to 4I11/2), the energy transfer upconversion process (ETU) becomes the main excitation of Er3+ to its upper levels (4F7/2) to generate the same emissions. Other cross-relaxations and some backward energy transfer (EBT: Er to Yb) can also occur in this system,76,78–80 but they were not observed in our experiments. It is important to note that non-radiative relaxations are more noticed in the upconversion system, which induces a non-negligible laser heating during high power density excitation. To prevent the laser-induced thermal effect from distorting the thermometric measurement, previous work62 has shown that the laser intensity should be less than 2.5 W cm−2 for NPs powder.
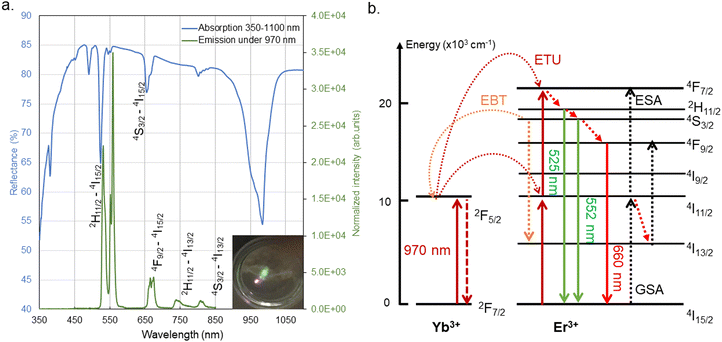 |
| | Fig. 3 (a) Absorption and emission spectra of the GdVO4:Yb3+/Er3+ powder sample. Inset: Photograph of the GdVO4:Yb3+/Er3+ powder sample with a 980 nm handheld laser pen. (b) The upconversion process between Er3+ and Yb3+ under NIR excitation. | |
Temperature calibration by photoluminescence thermometry.
The temperature was calibrated up to 573 K with the NPs powder under NIR laser at 2.5 W cm−2. As shown in Fig. 4a, the intensity of peak λ2 increases while peak λ1 decreases with temperature. The ratiometric thermometry following the Boltzmann distribution was proven by the temperature calibration, with the LIR values varying with temperature (Fig. 4b). According to the Boltzmann eqn (1), Ln (LIR) is linearly proportional to 1/T up to 573 K, and more importantly, this variation is reversible. The slopes calculated by the fitted trendline of the calibration curves are used to estimate the energy gap (ΔE) in eqn (1). The average of the slopes is used to estimate ΔE (Table 1). The thermal detection efficiency was evaluated by calculating the relative thermal sensitivity SR (eqn (2)), which was calculated with the average of the heating and cooling curves and is equal to 0.81%. K−1 for the sample at 313 K. This value at low temperatures is close to the literature data (0.47 at 298 K73 and 1.11% K−1 at 307 K81).
 |
| | Fig. 4 GdVO4:Yb3+/Er3+ powder upon NIR laser at 2.5 W cm−2: (a) emission spectra at 293–573 K. (b) Temperature calibration curve and fitted trendline equations, error bars determined by uncertainty (eqn (3)). | |
Table 1 The estimated energy gap (ΔE) and the uncertainty of temperature calibration curves
|
|
Y offset |
B
|
Slope |
ΔEestimated |
δ(LIR)/LIR (average) (%) |
| NPs powder |
2.5263 |
13 |
−860.46 |
598 |
1.92 |
| NPs in suspension |
2.4839 |
12 |
−925.12 |
643 |
19.97 |
| NPs suspension (Pconstant) |
2.6395 |
14 |
−897.98 |
624 |
14.18 |
| NPs suspension (Pvarying) |
2.5697 |
13 |
−870.38 |
605 |
12.84 |
3.2. In suspension: GdVO4:Yb3+/Er3+ NPs
For further application in temperature measurement in tribology,9 an ester-based oil (Nycobase 5750) was chosen as the fluid medium to disperse GdVO4:Yb3+/Er3+ nanoprobes. Nycobase 5750 is used as a base oil for lubricant in tribological studies due to its suitable properties: rheological, high thermal resistance, chemical stability, and non-toxicity. The NPs were dispersed in the fluid and the suspension can be stable for more than 3 months. Furthermore, it was confirmed that Nycobase 5750 (Nyco) does not absorb any NIR light.62 Thus, Nyco can be considered as a good fluid medium for the upconversion thermo-sensor, as it does not emit light upon NIR excitation and cannot be heated by the NIR laser.
Hydrodynamic size measurements.
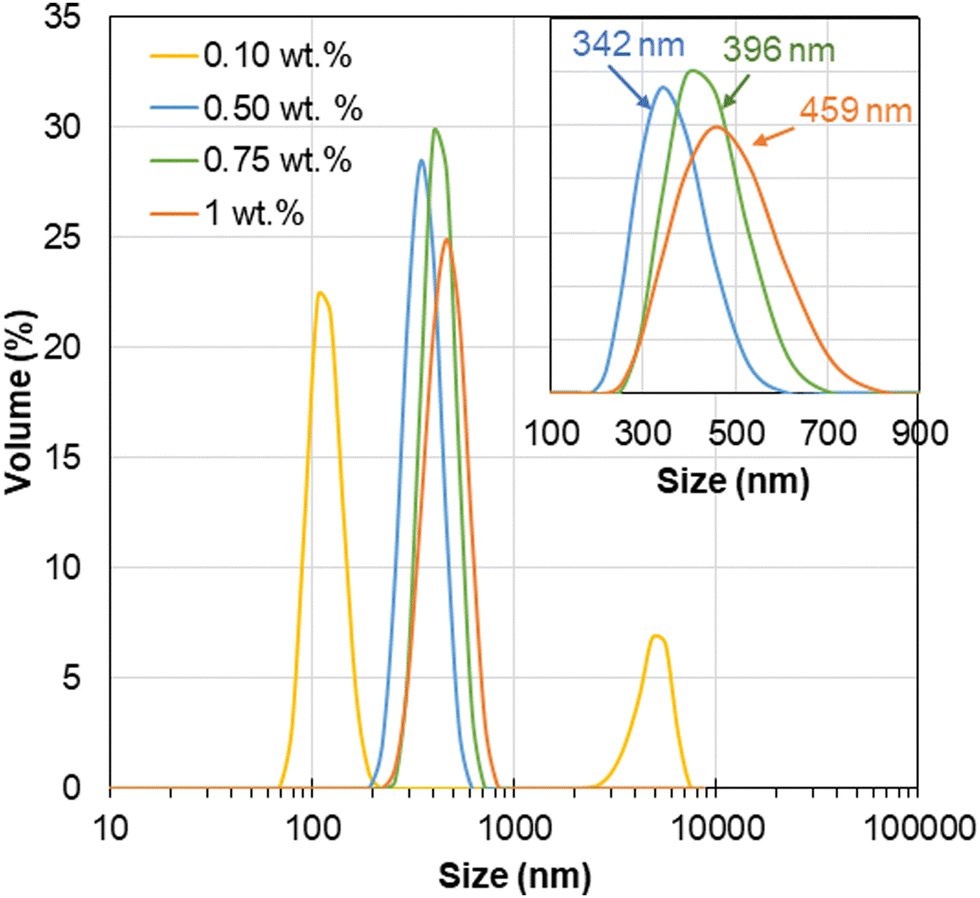
The NPs suspensions are prepared at different and relatively low concentrations: 0.1, 0.5, 0.75 and 1 wt% for DLS analysis. As shown in Fig. 5, the measured hydrodynamic size of the NP suspension after one week of settling. The hydrostatic size of the NPs aggregation is about 400 nm, which corresponds to the previous result observed in the TEM image.62 However, although in the 0.1 wt% suspensions, the hydrodynamic size is the smallest among all, around 100 nm, the second peak at 5000 nm shows that the suspension is not homogeneous. The position of the peak centroid, as well as the width of the peak, increases with concentration, which means that the hydrodynamic size increases while the monodispersity becomes more important with increasing concentration, respectively. Among the concentrations of 0.5, 0.75 and 1 wt%, the suspension at 0.5 wt% is the one that has both the smallest hydrodynamic size of NPs (less than 350 nm) and the best monodispersity. It is important to note that the monodispersity and small size of nano probes are required for tribological applications to improve the spatial resolution.
 |
| | Fig. 5 The DLS diagram of GdVO4:Yb3+/Er3+ suspension at 0.1, 0.5, 0.75 and 1 wt%. | |
Rheological properties characterizations.
Since it is essential to preserve the rheological properties of Nyco as much as possible for further friction tests, the viscosity of 0.5 wt% suspensions is measured at different temperatures with pure Nycobase as a reference. Fig. 6 show the measured viscosities of 0.5 wt% and the reference of pure Nycobase at 293 to 373 K, respectively. As pure Nycobase is a Newtonian fluid, its viscosity will not change with the shear rate, which is thus presented in line in Fig. 6. The difference in viscosity between the 0.5 wt% suspensions and the pure Nycobase (<2.97%) can hardly be observed in the experimental uncertainty range (<5%). Moreover, at 293 K, under a high shear rate (>8000 s−1), the viscosity decreases very slightly with increasing shear rate for both suspensions and pure Nycobase, which is explained by the shear-induced heating effect that decreases viscosity.8
 |
| | Fig. 6 Viscosity of GdVO4:Yb3+/Er3+ NPs suspension at 293–373 K under a shear rate of 1–104 s−1 for 0.5 wt% NPs suspension (in dot) and pure Nycobase (in line). | |
The viscosity of the 0.5 wt% NPs suspension varies almost in the same way as that of the pure Nyco fluid. Thus, the dispersion of the NPs does not affect the rheological properties of the Nyco in the temperature and shear rate range studied, which is a crucial condition for using the NPs suspension as a lubricant. This means that the presence of GdVO4:Yb3+/Er3+ nanoprobes at 0.5 wt% in the fluid will not change the tribological contact behavior. More importantly, for the 0.5 wt% NPs suspension, it has been verified that there is no impact of NIR laser heating even at high laser intensity in our previous work.62 Therefore, the 0.5 wt% GdVO4:Yb3+/Er3+ nanoprobes suspension has been selected for further temperature calibration under atmospheric and under high pressure (up to 1.1 GPa) in the further study.
Temperature calibration under atmospheric pressure.
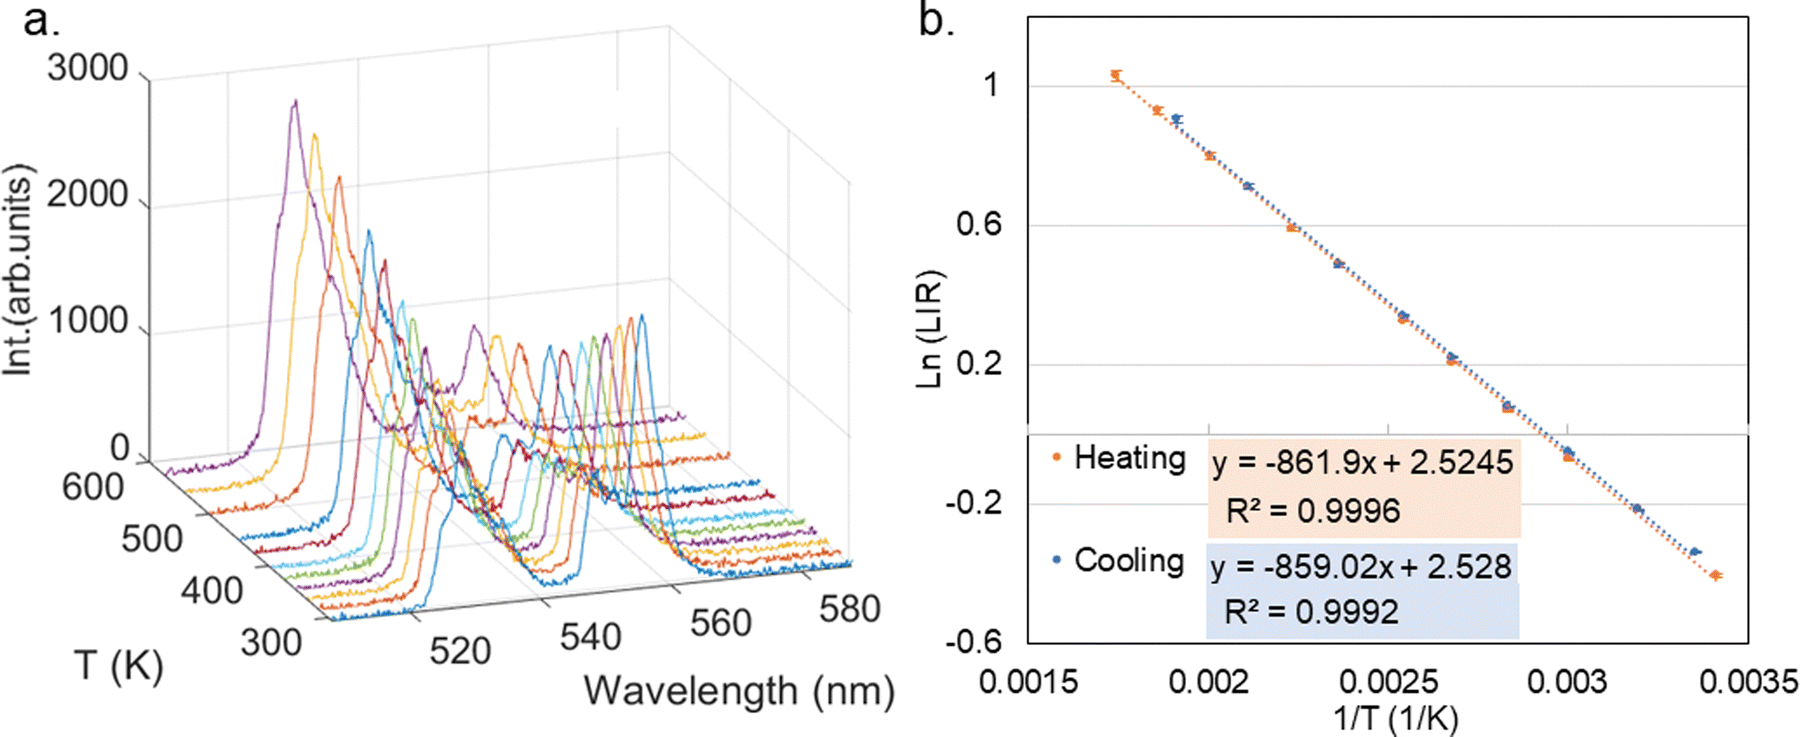
Temperature calibration by upconversion emission was performed on the NPs suspension between 298 and 423 K (Fig. 7a). The maximum temperature was limited to avoid possible evaporation of Nyco during the measurement. At 0.5 wt% of NPs, the emission of the suspension could be measured at a high pump power density (13.5 W cm−2). However, the calculated uncertainty (eqn (3)) cannot be negligible and has been represented on the calibration curve by an error bar. Although the spectral uncertainty is notable, the temperature calibration curve of the 0.5 wt% NPs {GdVO4:Yb3+/Er3+} is linear and reversible up to 150 °C, with little deviation between the heating and cooling curves (Fig. 7b). The energy gap (ΔE) was then fitted by the curves in Table 1, and the relative sensibility (SR) is 1.17% K−1 at 313 K, which is consistent with the values obtained with the powder calibration curve.
 |
| | Fig. 7 GdVO4:Yb3+/Er3+ suspended at 0.5 wt% upon NIR laser at 13.5 W cm−2: (a) emission spectra at 298–423 K. (b) Temperature calibration curve and fitted trendline equations, error bars determined by uncertainty (eqn (3)). | |
Temperature calibration under high pressure.
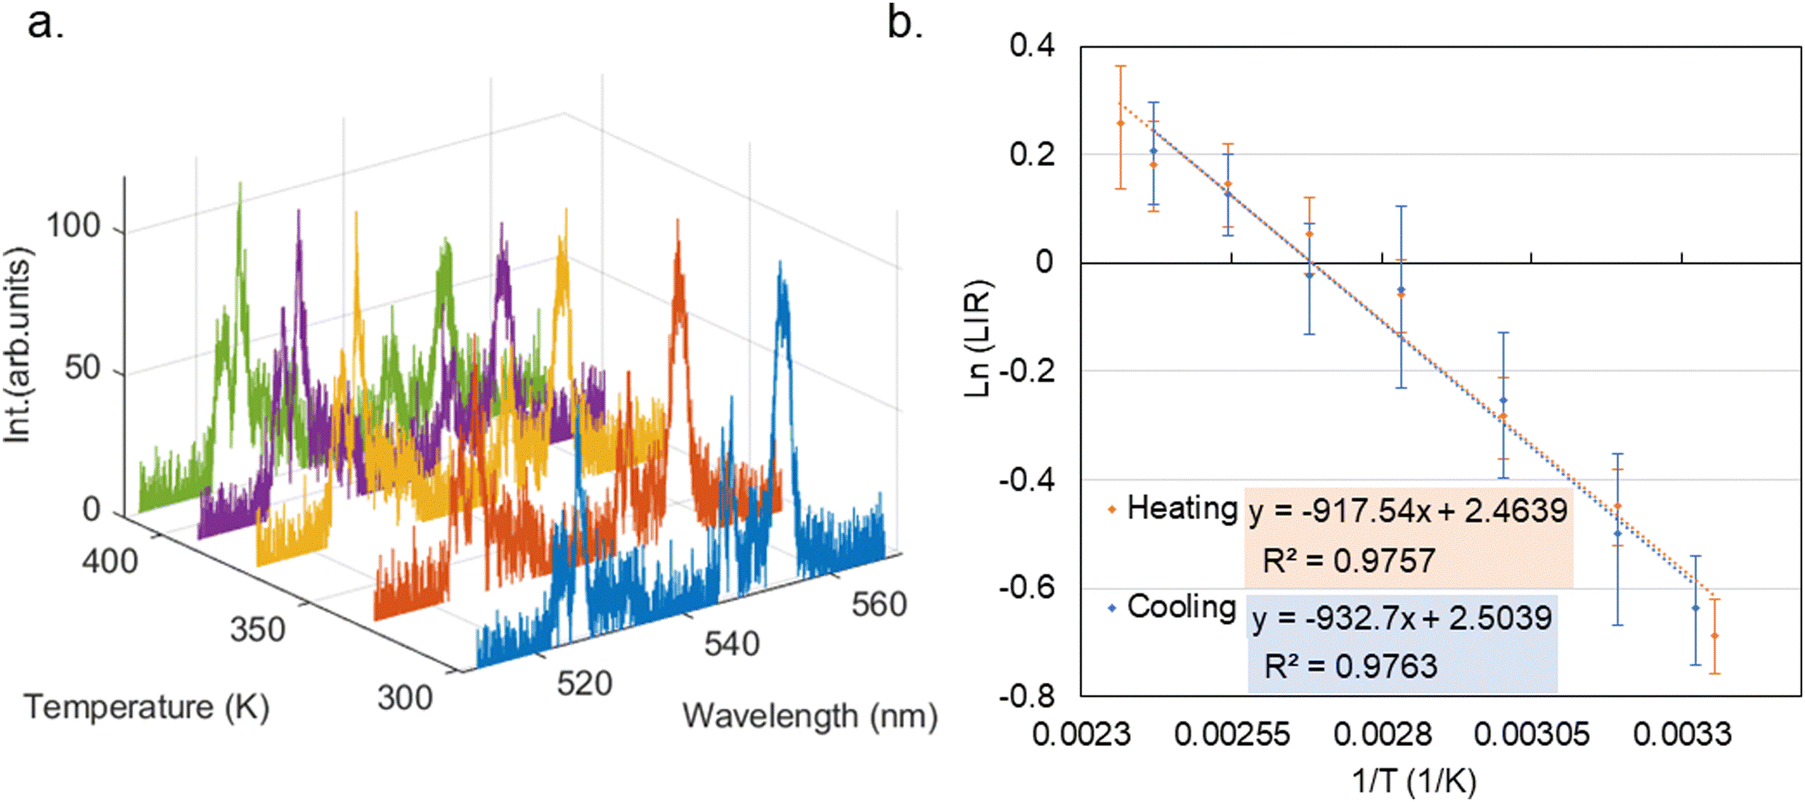
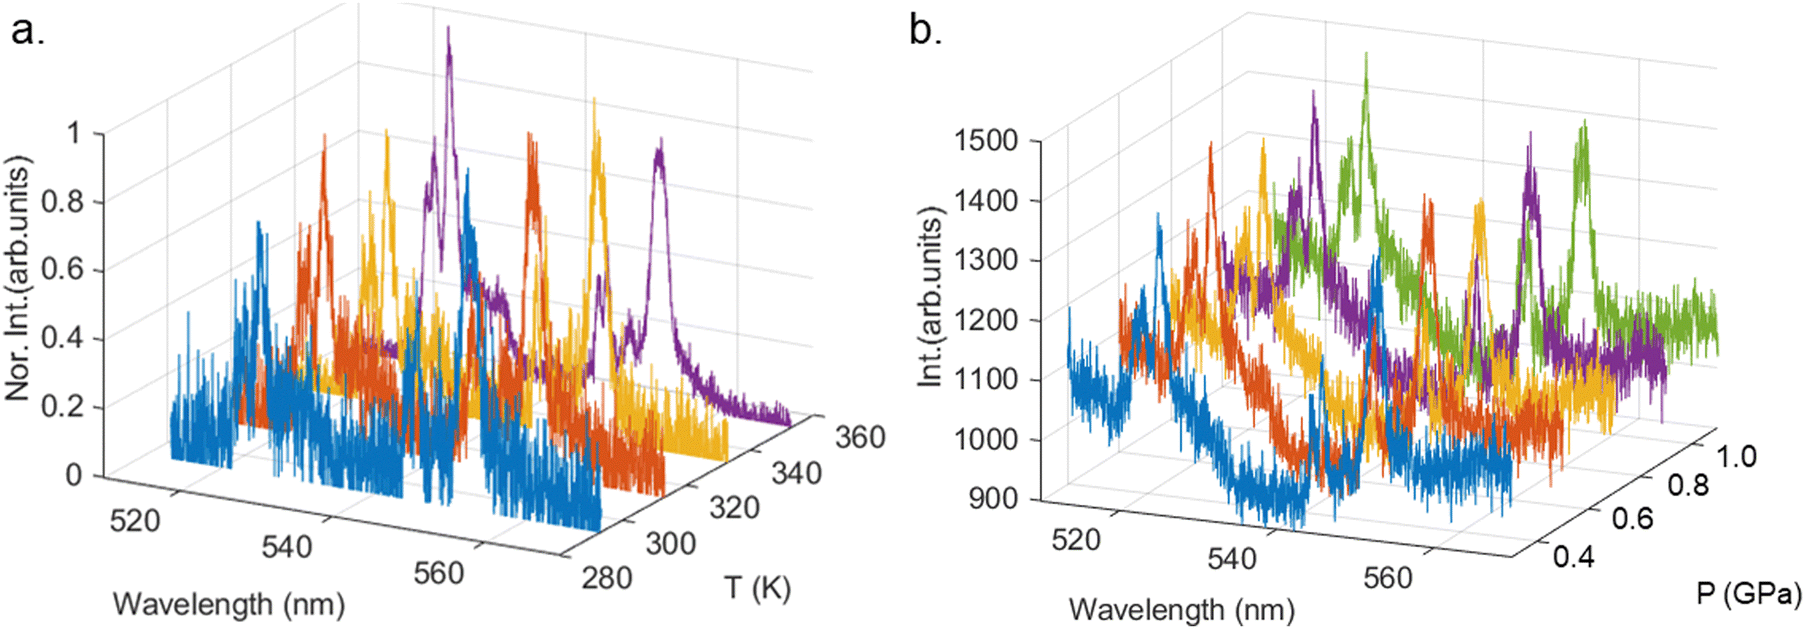
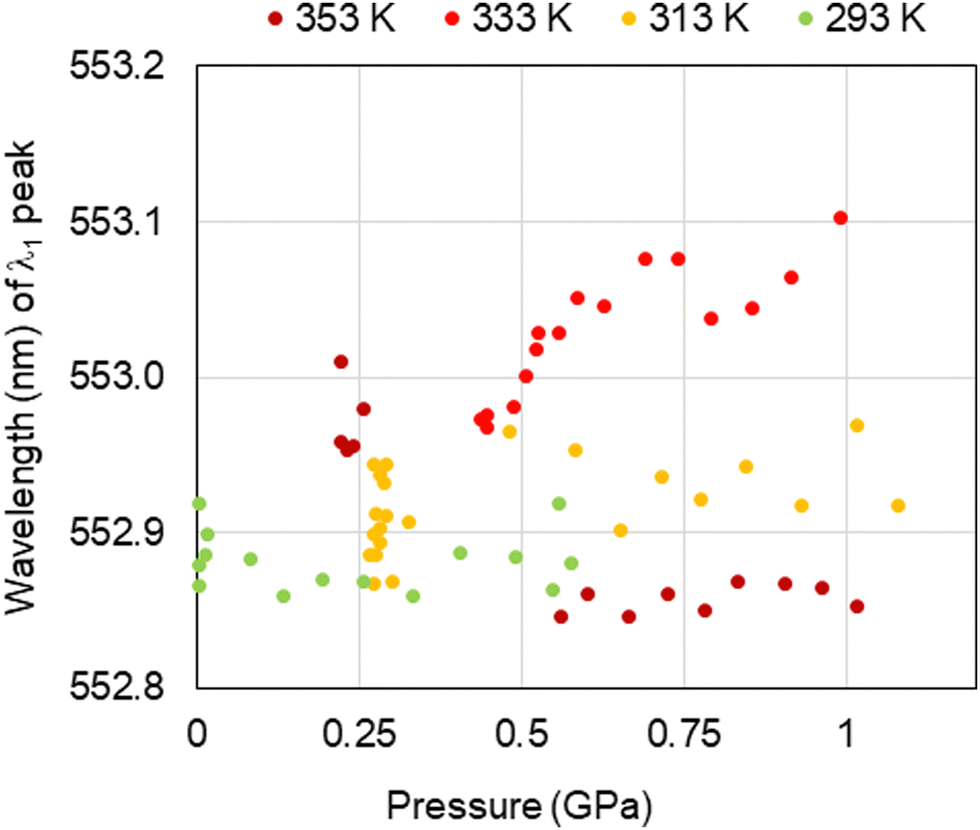
In order to apply the NPs suspension as a thermo-sensor lubricant for temperature measurement in tribological friction experiments, the photoluminescence thermometry of the suspension was studied under pressure (up to 1.1 GPa) in a diamond anvil cell (DAC) at every 20 K from 293 K to 353 K, under a 13.5 W cm−2 NIR laser as in the previous experiments. To study the effect of pressure on the LIR of NPs, two sets of data were collected in the DAC under isothermal conditions. The first group, called Pconstant, is a repeated measurement at the same temperature and pressure (the lowest pressure for the corresponding temperature). The second group, called Pvarying is a sequence of measurements at a given temperature for a variable pressure. The emission spectra are presented in Fig. 8a at varying temperatures and constant pressure (P = 0.6 GPa), showing that increasing temperature increases the emission intensity of peak λ2 and decreases that of the peak λ1. Conversely, Fig. 8b shows the negligible change in emission intensity under varying pressure at a constant temperature. Besides the LIR measurement, the peak shift has been verified for peak 1 (at 553 nm). As shown in Fig. 9, the corrected peak shift is not significant (<0.2 nm GPa−1) at a given temperature under varying pressure.
 |
| | Fig. 8 GdVO4:Yb3+/Er3+ suspended at 0.5 wt% in DAC upon NIR laser at 13.5 W cm−2: (a) emission spectra at 293–353 K under 0.6 GPa; (b) emission spectra at 313 K under 0.4–1.1 GPa. | |
 |
| | Fig. 9 GdVO4:Yb3+/Er3+ suspended at 0.5 wt% in DAC upon NIR laser at 13.5 W cm−2: λ1 peak position (corrected) under pressure at different temperatures. | |
As shown in Fig. 10a, Ln(LIR) under Pconstant is plotted by a hollow point for each temperature, and Ln(LIR) under Pvarying is plotted by a solid symbol for each temperature as well. The LIR value under Pconstant and Pvarying does not change with increasing pressure but only with temperature. An analysis of variance is conducted to conclude the influence of pressure on the LIR variation. In Table 2, the variance (VAR) at Pconstant (here the residual variance) and that at Pvarying (here the explained variance) are calculated for each temperature. The uncertainties calculated by SNR of emission spectra are listed. The VAR(Pvarying) is always lower than the VAR (Pconstant). This means that the distribution of the LIR value is less dispersed when the pressure varies than when the pressure is constant. This means that the pressure has no effect on the LIR variation. To confirm this result, the ratio VAR (Pvarying)/VAR (Pconstant) was calculated and found to be less than 1. This result shows that the slight change in the LIR value under isothermal conditions cannot be explained by the variation in pressure. Then, the LIR value is independent of pressure (up to 1.1 GPa) in the temperature range studied.
 |
| | Fig. 10 GdVO4:Yb3+/Er3+ suspended at 0.5 wt% upon NIR laser at 13.5 W cm−2: (a) distribution of Ln(LIR) values at four temperatures (293 to 353 K) under constant pressure (hollow point) and pressure varying up to 1.1 GPa (solid point). (b) Temperature calibration curve and the fitted trendline equations under constant pressure (green) and pressure varying (brown), error bars determined by the standard deviation of overall data. | |
Table 2 The average of LIR and variance of LIR for each temperature in DAC
|
T (K) |
P
constant
|
P
varying
|
VAR ratioa |
|
P (GPa) |
SNR (%) |
VAR |
P
max (GPa) |
SNR (%) |
VAR |
|
VAR ratio: the ratio of VAR Pvarying/VAR Pconstant.
|
| 293 |
0.01 |
6.47 |
2.54 × 10⁻³ |
0.61 |
6.48 |
6.30 × 10⁻⁴ |
0.25 |
| 313 |
0.29 |
6.55 |
5.27 × 10⁻⁴ |
1.08 |
5.97 |
5.00 × 10⁻⁴ |
0.95 |
| 333 |
0.45 |
2.74 |
2.92 × 10⁻⁴ |
0.99 |
4.22 |
2.81 × 10⁻⁴ |
0.96 |
| 353 |
0.23 |
8.28 |
7.49 × 10⁻³ |
1.02 |
3.47 |
4.06 × 10⁻⁴ |
0.05 |
Therefore, the thermometric validity of NPs suspended under pressure was investigated by averaging Ln(LIR) under Pconstant as well as Pvarying for each temperature. As shown in Fig. 10b, the temperature calibration curve under both Pconstant and Pvarying is linear as a function of 1/T and overlap with each other. ΔEestimated by their slopes is therefore very close, 624 and 605 cm−1 respectively (Table 1). This observation confirmed that the LIR of suspended NPs GdVO4:Yb3+/Er3+ is independent of pressure (up to 1 GPa), and therefore, the NPs are able to measure temperature by their emission without any effect caused by pressure variation.
To summarize, if we compare the temperature calibration curve at the same laser pumping power (13.5 W cm−2) of the 0.5 wt% NPs suspension in our previous results (Table 1), the ΔEestimated obtained by the slope of the calibration curve could be considered as the same, which confirms the reliability of these NPs GdVO4:Yb3+/Er3+ for temperature measurement under a pressure up to 1 GPa. The uncertainty of the measurement depends on the intensity of the emission, the quantity of NPs in the suspension being much less important than in the powder, the uncertainty has become important in the suspension. Nevertheless, in the NPs suspension under atmospheric pressure, the 19% uncertainty caused only a 7.5% error in the ΔEestimated value compared to the NPs powder. It is important to note that the configuration of the optical experiments is different between the temperature calibration under pressure in the DAC and at atmospheric pressure with a thermal controller, which may imply differences in the illuminations and therefore uncertainty in the emission intensity, and consequently, in the LIR value. This may be the reason for a slight shift in the constant B in the Boltzmann equation. However, once the ΔE is consistent with the previous result, the GdVO4:Yb3+/Er3+ NPs can be validated as thermometric and pressure-independent probes.
4. Conclusions
A non-contact, pressure-independent nanothermometer was investigated for tribological temperature measurement using GdVO4:Yb3+/Er3+ upconversion nanoparticles. The NPs were prepared by precipitation and thermal treatment. The NPs dispersed in the fluid lubricant has the same photoluminescence thermometric properties as the NP powder. At low NP dispersion concentration, the suspension retains the original rheological properties of the lubricant even at a high temperature (373 K) and at a high shear rate (104 s−1). In order to apply the NPs in frictional contact for temperature sensing, temperature calibration was performed under hydrostatic pressure (up to 1.1 GPa) in a diamond anvil cell. The result confirmed the independence of the LIR from pressure, and the calibration curve under variable pressure is superimposed on that under constant pressure. Therefore, the incorporation of these GdVO4:Yb3+/Er3+ nanosensors into the lubricant leads to the formation of a suspension that allows temperature measurement by the LIR method without being disturbed by the influence of pressure. The next step is the application in tribological contact, in particular in fluid lubrication.
Author contributions
C. J., L. B., D. P. and S. D. are the supervisors of projects. Y. Z., L. B. C. J. and D. P. performed the experiments. G. L., D. P., N. B., M. M., Y. M., C. D, F. C. and D. F. provided input into the design of the experiments. Y. Z., G. L., L. B., N. B., D. P. and S. D. co-wrote the manuscript with input from other authors.
Conflicts of interest
There are no conflict to declare.
Acknowledgements
The authors gratefully acknowledge the Ctμ platform of electronic microscopy (University Lyon 1). The authors sincerely thank all the supports from the LABEX MANUTECH-SISE (ANR-10-LABX-0075) of Université de Lyon. This work was supported by the LABEX MANUTECH-SISE (ANR-10-LABX-0075) of Université de Lyon, within the Plan France 2030 operated by the French National Research Agency (ANR).
References
- A. P. Semenov, Tribology at High Temperatures, Tribol. Int., 1995, 28(1), 45–50, DOI:10.1016/0301-679X(95)99493-5.
- Y. Meng, J. Xu, Z. Jin, B. Prakash and Y. Hu, A Review of Recent Advances in Tribology, Friction, 2020, 8, 221–230, DOI:10.1007/s40544-020-0367-2.
- R. Komanduri and Z. B. Hou, A Review of the Experimental Techniques for the Measurement of Heat and Temperatures Generated in Some Manufacturing Processes and Tribology, Tribol. Int., 2001, 34(10), 653–682, DOI:10.1016/S0301-679X(01)00068-8.
- S. M. B. Albahrani, D. Philippon, P. Vergne and J. M. Bluet, A Review of in Situ Methodologies for Studying Elastohydrodynamic Lubrication, Proc. Inst. Mech. Eng., Part J, 2016, 230(1), 86–110, DOI:10.1177/1350650115590428.
- I. Jubault, J. L. Mansot, P. Vergne, A. A. Lubrecht and J. Molimard, In Situ Pressure Measurements in an Elastohydrodynamically Lubricated Point Contact Using Raman Microspectrometry. Comparison with Numerical Calculations, Tribol. Ser., 2003, 41, 663–673, DOI:10.1016/s0167-8922(03)80179-7.
- I. Jubault, J. Molimard, A. A. Lubrecht, J. L. Mansot and P. Vergne, In Situ Pressure and Film Thickness Measurements in Rolling/Sliding Lubricated Point Contacts, Tribol. Lett., 2003, 15(4), 421–429, DOI:10.1023/B:TRIL.0000003068.07650.2e.
- K. Yagi, P. Vergne and T. Nakahara, In Situ Pressure Measurements in Dimpled Elastohydrodynamic Sliding Contacts by Raman Microspectroscopy, Tribol. Int., 2009, 42(5), 724–730, DOI:10.1016/j.triboint.2008.10.005.
- S. M. B. Albahrani, T. Seoudi, D. Philippon, L. Lafarge, P. Reiss, H. Hajjaji, G. Guillot, M. Querry, J. M. Bluet and P. Vergne, Quantum Dots to Probe Temperature and Pressure in Highly Confined Liquids, RSC Adv., 2018, 8(41), 22897–22908, 10.1039/C8RA03652G.
- T. Seoudi, D. Philippon, N. Fillot, L. Lafarge, N. Devaux, A. Mondelin and P. Vergne, CdSe-Based Quantum Dots as In Situ Pressure and Temperature Non-Intrusive Sensors in Elastohydrodynamic Contacts, Tribol. Lett., 2020, 68(73), 1–14, DOI:10.1007/s11249-020-01312-x.
- R. M. Johann, Indicating Pressure and Environmental Effects by Means of the Spectral Shift with Rhodamine B and Fluorescein, AIP Adv., 2015, 5(7), 0–15, DOI:10.1063/1.4927687.
- J. A. Sutton, B. T. Fisher and J. W. Fleming, A Laser-Induced Fluorescence Measurement for Aqueous Fluid Flows with Improved Temperature Sensitivity, Exp. Fluids, 2008, 45(5), 869–881, DOI:10.1007/s00348-008-0506-4.
- B. Lasio, L. Malfatti and P. Innocenzi, Photodegradation of Rhodamine 6G Dimers in Silica Sol-Gel Films, J. Photochem. Photobiol., A, 2013, 271, 93–98, DOI:10.1016/j.jphotochem.2013.08.007.
- B. Han, W. L. Hanson, K. Bensalah, A. Tuncel, J. M. Stern and J. A. Cadeddu, Development of Quantum Dot-Mediated Fluorescence Thermometry for Thermal Therapies, Ann. Biomed. Eng., 2009, 37(6), 1230–1239, DOI:10.1007/s10439-009-9681-6.
- Q. Yang, L. Zhao, Z. Fang, Z. Yang, J. Cao, Y. Cai, D. Zhou, X. Yu, J. Qiu and X. Xu, Transparent Perovskite Glass-Ceramics for Visual Optical Thermometry, J. Rare Earths, 2021, 39(6), 712–717, DOI:10.1016/j.jre.2020.05.009.
- J.-H. Fan, Y. Qin, M. Azeem, Z.-Z. Zhang, Z.-G. Li, N. Sun, Z.-Q. Yao and W. Li, Temperature-Responsive Emission and Elastic Properties of a New 2D Lead Halide Perovskite, Dalton Trans., 2021, 0–5, 10.1039/d0dt04165c.
- M. Quintanilla, M. Henriksen-Lacey, C. Renero-Lecuna and L. M. Liz-Marzán, Challenges for Optical Nanothermometry in Biological Environments, Chem. Soc. Rev., 2022, 51(11), 4223–4242, 10.1039/d2cs00069e.
- T. P. Van Swieten, T. Van Omme, D. J. Van Den Heuvel, S. J. W. Vonk, R. G. Spruit, F. Meirer, H. H. P. Garza, B. M. Weckhuysen, A. Meijerink, F. T. Rabouw and R. G. Geitenbeek, Mapping Elevated Temperatures with a Micrometer Resolution Using the Luminescence of Chemically Stable Upconversion Nanoparticles, ACS Appl. Nano Mater., 2021, 4(4), 4208–4215, DOI:10.1021/acsanm.1c00657.
- D. Jaque and F. Vetrone, Luminescence Nanothermometry, Nanoscale, 2012, 4(15), 4301–4326, 10.1039/c2nr30764b.
- J. R. Casar, C. A. McLellan, C. Siefe and J. A. Dionne, Lanthanide-Based Nanosensors: Refining Nanoparticle Responsiveness for Single Particle Imaging of Stimuli, ACS Photonics, 2021, 8(1), 3–17, DOI:10.1021/acsphotonics.0c00894.
- C. D. S. Brites, S. Balabhadra and L. D. Carlos, Lanthanide-Based Thermometers: At the Cutting-Edge of Luminescence Thermometry, Adv. Opt. Mater., 2019, 7(5), 1–30, DOI:10.1002/adom.201801239.
- A. Bednarkiewicz, L. Marciniak, L. D. Carlos and D. Jaque, Standardizing Luminescence Nanothermometry for Biomedical Applications, Nanoscale, 2020, 12(27), 14405–14421, 10.1039/d0nr03568h.
- M. D. Dramićanin, Sensing Temperature via Downshifting Emissions of Lanthanide-Doped Metal Oxides and Salts. A Review, Methods Appl. Fluoresc., 2016, 4, 042001, DOI:10.1088/2050-6120/4/4/042001.
- M. D. Dramićanin, Trends in Luminescence Thermometry, J. Appl. Phys., 2020, 128, 04902, DOI:10.1063/5.0014825.
- M. Runowski, A. Shyichuk, A. Tymiński, T. Grzyb, V. Lavín and S. Lis, Multifunctional Optical Sensors for Nanomanometry and Nanothermometry: High-Pressure and High-Temperature Upconversion Luminescence of Lanthanide-Doped Phosphates – LaPO4/YPO4:Yb3+–Tm3, ACS Appl. Mater. Interfaces, 2018, 10(20), 17269–17279, DOI:10.1021/acsami.8b02853.
- Y. Cheng, Y. Gao, H. Lin, F. Huang and Y. Wang, Strategy Design for Ratiometric Luminescence Thermometry: Circumventing the Limitation of Thermally Coupled Levels, J. Mater. Chem. C, 2018, 6(28), 7462–7478, 10.1039/c8tc02401d.
- F. Paz-Buclatin, F. Rivera-López, O. González, I. R. Martín, L. L. Martin and D. J. Jovanović, GdVO4:Er3+/Yb3+ Nanocrystalline Powder as Fluorescence Temperature Sensor. Application to Monitor the Temperature of an Electrical Component, Sens. Actuators, A, 2019, 299, 111628, DOI:10.1016/j.sna.2019.111628.
- M. Ding, Z. Shen, Y. Yuan, W. Bai, C. Lu and Z. Ji, β-NaYF4:Yb3+/Er3+ Nanocrystals Embedded Sol-Gel Glass Ceramics for Self-Calibrated Optical Thermometry, Ceram. Int., 2018, 44(12), 14884–14890, DOI:10.1016/j.ceramint.2018.05.125.
- A. Sedlmeier, D. E. Achatz, L. H. Fischer, H. H. Gorris and O. S. Wolfbeis, Photon Upconverting Nanoparticles for Luminescent Sensing of Temperature, Nanoscale, 2012, 4(22), 7090–7096, 10.1039/c2nr32314a.
- S. Sinha, M. K. Mahata and K. Kumar, Enhancing the Upconversion Luminescence Properties of Er3+–Yb3+ Doped Yttrium Molybdate through Mg2+ Incorporation: Effect of Laser Excitation Power on Temperature Sensing and Heat Generation, New J. Chem., 2019, 43(15), 5960–5971, 10.1039/c9nj00760a.
- A. Ćirić, T. Gavrilović and M. D. Dramićanin, Luminescence Intensity Ratio Thermometry with Er3 +: Performance Overview, Crystals, 2021, 11(2), 1–19, DOI:10.3390/cryst11020189.
- S. Goderski, M. Runowski, P. Woźny, V. Lavín and S. Lis, Lanthanide Upconverted Luminescence for Simultaneous Contactless Optical Thermometry and Manometry-Sensing under Extreme Conditions of Pressure and Temperature, ACS Appl. Mater. Interfaces, 2020, 12(36), 40475–40485, DOI:10.1021/acsami.0c09882.
- M. Runowski, N. Stopikowska, D. Szeremeta, S. Goderski, M. Skwierczyńska and S. Lis, Upconverting Lanthanide Fluoride Core@Shell Nanorods for Luminescent Thermometry in the First and Second Biological Windows: β-NaYF 4:Yb3+–Er3+@SiO2 Temperature Sensor, ACS Appl. Mater. Interfaces, 2019, 11(14), 13389–13396, DOI:10.1021/acsami.9b00445.
- S. A. Wade, S. F. Collins and G. W. Baxter, Fluorescence Intensity Ratio Technique for Optical Fiber Point Temperature Sensing, J. Appl. Phys., 2003, 94(8), 4743–4756, DOI:10.1063/1.1606526.
- C. Lee, E. Z. Xu, Y. Liu, A. Teitelboim, K. Yao, A. Fernandez-Bravo, A. M. Kotulska, S. H. Nam, Y. D. Suh, A. Bednarkiewicz, B. E. Cohen, E. M. Chan and P. J. Schuck, Giant Nonlinear Optical Responses from Photon-Avalanching Nanoparticles, Nature, 2021, 589(7841), 230–235, DOI:10.1038/s41586-020-03092-9.
- I. Hyppänen, N. Perälä, R. Arppe, M. Schäferling and T. Soukka, Environmental and Excitation Power Effects on the Ratiometric Upconversion Luminescence Based Temperature Sensing Using Nanocrystalline NaYF4:Yb3+,Er3+, ChemPhysChem, 2017, 18(6), 692–701, DOI:10.1002/cphc.201601355.
- F. Auzel, Upconversion and Anti-Stokes Processes with f and d Ions in Solids, Chem. Rev., 2004, 104(1), 139–173, DOI:10.1021/cr020357g.
- S. F. Himmelstoß and T. Hirsch, A Critical Comparison of Lanthanide Based Upconversion Nanoparticles to Fluorescent Proteins, Semiconductor Quantum Dots, and Carbon Dots for Use in Optical Sensing and Imaging, Methods Appl. Fluoresc., 2019, 7, 022002, DOI:10.1088/2050-6120/ab0bfa.
- A. D. Pickel, A. Teitelboim, E. M. Chan, N. J. Borys, P. J. Schuck and C. Dames, Apparent Self-Heating of Individual Upconverting Nanoparticle Thermometers, Nat. Commun., 2018, 9, 4907, DOI:10.1038/s41467-018-07361-0.
- A. H. Li, Z. J. Sun and Q. Lü, Laser Heating Effect on the Power Dependence of Upconversion Luminescence in Er3+ -Doped Nanopowders, J. Nanoparticle Res., 2013, 15, 1377, DOI:10.1007/s11051-012-1377-4.
- X. Xia, A. Volpi, J. Y. D. Roh, M. C. De Siena, D. R. Gamelin, M. P. Hehlen and P. J. Pauzauskie, The Impact of 2H9/2 → 4I13/2 Emission from Er3+ Ions on Ratiometric Optical Temperature Sensing with Yb3+/Er3+ Co-Doped Upconversion Materials, J. Lumin., 2021, 236, 118006, DOI:10.1016/j.jlumin.2021.118006.
- J. C. Martins, A. R. N. Bastos, R. A. S. Ferreira, X. Wang, G. Chen and L. D. Carlos, Primary Luminescent Nanothermometers for Temperature Measurements Reliability Assessment, Adv. Photonics Res., 2021, 2(5), 2000169, DOI:10.1002/adpr.202000169.
- B. Chen and F. Wang, Combating Concentration Quenching in Upconversion Nanoparticles, Acc. Chem. Res., 2020, 53(2), 358–367, DOI:10.1021/acs.accounts.9b00453.
- F. Wang, J. Wang and X. Liu, Direct Evidence of a Surface Quenching Effect on Size-Dependent Luminescence of Upconversion Nanoparticles, Angew. Chem., Int. Ed., 2010, 49(41), 7456–7460, DOI:10.1002/anie.201003959.
- J. Zhao, H. Li, Q. Zeng, K. Song, X. Wang and X. Kong, Temperature-Dependent Upconversion Luminescence of NaYF 4:Yb3+, Er3+ Nanoparticles, Chem. Lett., 2013, 42(3), 310–312, DOI:10.1246/cl.2013.310.
- Y. Yan, A. Jans Faber and H. de Waal, Luminescence Quenching by OH Groups in Highly Er-Dopedphosphate Glasses, J. Non. Cryst. Solids, 1995, 181, 283–290 CrossRef CAS.
- F. Zhang, G. Li, W. Zhang and Y. L. Yan, Phase-Dependent Enhancement of the Green-Emitting Upconversion Fluorescence in LaVO4:Yb3+, Er3, Inorg. Chem., 2015, 54(15), 7325–7334, DOI:10.1021/acs.inorgchem.5b00851.
- X. Cui, Y. Cheng, H. Lin, F. Huang, Q. Wu and Y. Wang, Size-Dependent Abnormal Thermo-Enhanced Luminescence of Ytterbium-Doped Nanoparticles, Nanoscale, 2017, 9(36), 13794–13799, 10.1039/c7nr04575a.
- T. G. Artur Tymiński, Are Rare Earth Phosphates Suitable as Hosts for Upconversion Luminescence? Studies on Nanocrystalline REPO4 (RE = Y, La, Gd, Lu) Doped with Yb3+/Ho3+, Yb3+/Er3+, Yb3+/Tm3+, Yb3+/Tb3+ and Yb3+/Tb3+/Eu3+ Ions, J. Lumin., 2017, 181, 411–420, DOI:10.1016/j.jlumin.2016.09.028.
- A. A. Ansari, A. K. Parchur, M. K. Nazeeruddin and M. M. Tavakoli, Luminescent Lanthanide Nanocomposites in Thermometry: Chemistry of Dopant Ions and Host Matrices, Coord. Chem. Rev., 2021, 444, 214040, DOI:10.1016/j.ccr.2021.214040.
- M. Runowski, W. Przemysław and R. M. Inocencio, Optical Pressure Sensing in Vacuum and High-Pressure Ranges Using Lanthanide-Based Luminescent Thermometer–Manometer, J. Mater. Chem. C, 2021, 4643–4651, 10.1039/d1tc00709b.
- M. D. Wisser, M. Chea, Y. Lin, D. M. Wu, W. L. Mao, A. Salleo and J. A. Dionne, Strain-Induced Modification of Optical Selection Rules in Lanthanide-Based Upconverting Nanoparticles, Nano Lett., 2015, 15(3), 1891–1897, DOI:10.1021/nl504738k.
- Y. Wang, J. Zhou, J. Gao, K. Zhang, C. Gao, X. Xie and L. Huang, Physical Manipulation of Lanthanide-Activated Photoluminescence, Ann. Phys., 2019, 531(9), 1–12, DOI:10.1002/andp.201900026.
- M. A. Antoniak, S. J. Zelewski, R. Oliva, A. Żak, R. Kudrawiec and M. Nyk, Combined Temperature and Pressure Sensing Using Luminescent NaBiF4:Yb,Er Nanoparticles, ACS Appl. Nano Mater., 2020, 3(5), 4209–4217, DOI:10.1021/acsanm.0c00403.
- M. Runowski, T. Zheng, P. Woźny and P. Du, NIR Emission of Lanthanides for Ultrasensitive Luminescence Manometry – Er3+-Activated Optical Sensor of High Pressure, Dalton Trans., 2021, 50(41), 14864–14871, 10.1039/d1dt02681j.
- P. Woźny, M. Runowski and S. Lis, Emission Color Tuning and Phase Transition Determination Based on High-Pressure up-Conversion Luminescence in YVO4:Yb3+, Er3+ Nanoparticles, J. Lumin., 2019, 209, 321–327, DOI:10.1016/j.jlumin.2019.02.008.
- S. Goderski, M. Runowski, P. Woźny, V. Lavín and S. Lis, SI:Lanthanide Upconverted Luminescence for Simultaneous Contactless Optical Thermometry and Manometry-Sensing under Extreme Conditions of Pressure and Temperature, ACS Appl. Mater. Interfaces, 2020, 12(36), 40475–40485, DOI:10.1021/acsami.0c09882.
- M. Runowski, J. Marciniak, T. Grzyb, D. Przybylska, A. Shyichuk, B. Barszcz, A. Katrusiak and S. Lis, Lifetime Nanomanometry-High-Pressure Luminescence of up-Converting Lanthanide Nanocrystals-SrF2:Yb3+,Er3, Nanoscale, 2017, 9(41), 16030–16037, 10.1039/c7nr04353h.
- C. A. McLellan, C. Siefe, J. R. Casar, C. S. Peng, S. Fischer, A. Lay, A. Parakh, F. Ke, X. W. Gu, W. Mao, S. Chu, M. B. Goodman and J. A. Dionne, Engineering Bright and Mechanosensitive Alkaline-Earth Rare-Earth Upconverting Nanoparticles, J. Phys. Chem. Lett., 2022, 13(6), 1547–1553, DOI:10.1021/acs.jpclett.1c03841.
- O. A. Savchuk, J. J. Carvajal, C. Cascales, J. Massons, M. Aguiló and F. Díaz, Thermochromic Upconversion Nanoparticles for Visual Temperature Sensors with High Thermal, Spatial and Temporal Resolution, J. Mater. Chem. C, 2016, 4(27), 6602–6613, 10.1039/c6tc01841f.
- N. M. Bhiri, M. Dammak, M. Aguiló, F. Díaz, J. J. Carvajal and M. C. Pujol, Stokes and Anti-Stokes Operating Conditions Dependent Luminescence Thermometric Performance of Er3+ -Doped and Er3+, Yb3+ Co-Doped GdVO4 Microparticles in the Non-Saturation Regime, J. Alloys Compd., 2020, 814, 152197, DOI:10.1016/j.jallcom.2019.152197.
- A. Dwivedi, D. Kumar, S. B. Rai and A. K. Rai, Effect of Host on the Radiative (Upconversion Emission) as Well as Non-Radiative Relaxation (Laser Induced Optical Heating) in Tm3 +/Yb3+ Co-Doped Phosphors, J. Lumin., 2020, 226, 117421, DOI:10.1016/j.jlumin.2020.117421.
- Y. Zhou, G. Ledoux, D. Philippon, S. Descartes, M. Martini, S. He, C. Desroches, D. Fournier, C. Journet and L. Bois, Laser-Induced Heating in GdVO 4:Yb 3 +/Er 3 + Nanocrystals for Thermometry, ACS Appl. Nano Mater., 2022, 5, 16388–16401, DOI:10.1021/acsanm.2c03466.
- T. Marqueño, D. Errandonea, J. Pellicer-Porres, D. Martinez-Garcia, D. Santamaria-Pérez, A. Muñoz, P. Rodríguez-Hernández, A. Mujica, S. Radescu, S. N. Achary, C. Popescu and M. Bettinelli, High-Pressure Polymorphs of Gadolinium Orthovanadate: X-Ray Diffraction, Raman Spectroscopy, and Ab Initio Calculations, Phys. Rev. B, 2019, 100, 064106 CrossRef.
- P. R. N. Childs, J. R. Greenwood and C. A. Long, Review of Temperature Measurement, Rev. Sci. Instrum., 2000, 71(8), 2959–2978, DOI:10.1063/1.1305516.
- A. Huignard, V. Buissette, G. Laurent, T. Gacoin and J. P. Boilot, Synthesis and Characterizations of YVO4: Eu Colloids, Chem. Mater., 2002, 14(5), 2264–2269, DOI:10.1021/cm011263a.
- M. Abdesselem, M. Schoeffel, I. Maurin, R. Ramodiharilafy, G. Autret, O. Clément, P. L. Tharaux, J. P. Boilot, T. Gacoin, C. Bouzigues and A. Alexandrou, Multifunctional Rare-Earth Vanadate Nanoparticles: Luminescent Labels, Oxidant Sensors, and MRI Contrast Agents, ACS Nano, 2014, 8(11), 11126–11137, DOI:10.1021/nn504170x.
- O. Grasset, Calibration of the R Ruby Fluorescence Lines in the Pressure Range [0-1 GPa] and the Temperature Range [250–300 K], High Pressure Res., 2001, 21(3–4), 139–157, DOI:10.1080/08957950108201020.
- H. K. Mao, J. Xu and P. M. Bell, Calibration of the Ruby Pressure Gauge to 800 Kbar under Quasi-Hydrostatic Conditions, J. Geophys. Res., 1986, 91(B5), 4673, DOI:10.1029/jb091ib05p04673.
- N. Rakov, G. S. Maciel and M. Xiao, Upconversion Fluorescence and Its Thermometric Sensitivity of Er3+:Yb3+ Co-Doped SrF2 Powders Prepared by Combustion Synthesis, Electron. Mater. Lett., 2014, 10(5), 985–989, DOI:10.1007/s13391-014-4030-9.
- L. Li, F. Qin, Y. Zhou, Y. Zheng, H. Zhao and Z. Zhang, Approximate Energy Gaps, Dissimilar Relative Thermal Sensitivities, Sens. Actuators, B, 2018, 269, 203–209, DOI:10.1016/j.snb.2018.04.158.
-
C. D. S. Brites, A. Millán and L. D. Carlos, Lanthanides in Luminescent Thermometry, 2016, vol. 49 DOI:10.1016/bs.hpcre.2016.03.005.
- R. V. Perrella and P. C. De Sousa Filho, High-Sensitivity Dual UV/NIR-Excited Luminescence Thermometry by Rare Earth Vanadate Nanoparticles, Dalton Trans., 2020, 49(3), 911–922, 10.1039/c9dt04308j.
- O. A. Savchuk, J. J. Carvajal, J. Massons, C. Cascales, M. Aguiló and F. Díaz, Novel Low-Cost, Compact and Fast Signal Processing Sensor for Ratiometric Luminescent Nanothermometry, Sens. Actuators, A, 2016, 250, 87–95, DOI:10.1016/j.sna.2016.08.031.
- M. Wujczyk, A. Watras, K. Szyszka and R. J. Wiglusz, Influence of Vanadium Concentration on Up-Conversion Luminescence in Er3+–Yb3+ and Tm3+–Yb3+ Ions Pair Co-Doped YVxP1−xO4 Solid State Solution, J. Alloys Compd., 2021, 884, 161022, DOI:10.1016/j.jallcom.2021.161022.
- V. Buissette, A. Huignard, T. Gacoin, J. P. Boilot, P. Aschehoug and B. Viana, Luminescence Properties of YVO4:Ln (Ln = Nd, Yb, and Yb-Er) Nanoparticles, Surf. Sci., 2003, 532–535, 444–449, DOI:10.1016/S0039-6028(03)00203-6.
- J. Sun, Z. Zhang, H. Suo, Y. Chen, J. Xiang and C. Guo, Temperature Self-Monitoring Photothermal Nano-Particles of Er3 +/Yb3+ Co-Doped Zircon-Tetragonal BiVO4, Ceram. Int., 2021, 47(1), 409–415, DOI:10.1016/j.ceramint.2020.08.147.
- Y. Cho, S. W. Song, S. Y. Lim, J. H. Kim, C. R. Park and H. M. Kim, Spectral Evidence for Multi-Pathway Contribution to the Upconversion Pathway in NaYF4:Yb3+,Er3+ Phosphors, Phys. Chem. Chem. Phys., 2017, 19(10), 7326–7332, 10.1039/c7cp00048k.
- J. Liu, H. Deng, Z. Huang, Y. Zhang, D. Chen and Y. Shao, Phonon-Assisted Energy Back Transfer-Induced Multicolor Upconversion Emission of Gd2O3:Yb3 +/Er3+ Nanoparticles under near-Infrared Excitation, Phys. Chem. Chem. Phys., 2015, 17(23), 15412–15418, 10.1039/c5cp01632k.
- T. Li, C. Guo and L. Li, Up-Conversion Luminescence of Er3+–Yb3+ Co-Doped CaIn2O4, Opt. Express, 2013, 21(15), 18281, DOI:10.1364/oe.21.018281.
- J. H. Oh, B. K. Moon, B. C. Choi, J. H. Jeong, H. Choi and J. H. Kim, Reinterpretation of the Red Emission Pathway in β-NaYF4:Yb3+, Er3, Ceram. Int., 2017, 43(2), 2517–2522, DOI:10.1016/j.ceramint.2016.11.053.
- T. V. Gavrilović, D. J. Jovanović, V. Lojpur and M. D. Dramićanin, Multifunctional Eu3+- and Er3+/Yb3+ -Doped GdVO4 Nanoparticles Synthesized by Reverse Micelle Method, Sci. Rep., 2014, 4, 1–9, DOI:10.1038/srep04209.
|
| This journal is © the Owner Societies 2023 |
Click here to see how this site uses Cookies. View our privacy policy here. 
 Open Access Article
 This Open Access Article is licensed under a Creative Commons Attribution-Non Commercial 3.0 Unported Licence
 a,
Gilles
Ledoux
a,
Gilles
Ledoux