 Open Access Article
Creative Commons Attribution 3.0 Unported Licence
Correction: Automated assessment of redox potentials for dyes in dye-sensitized photoelectrochemical cells†
Jelena
Belić
a,
Arno
Förster
a,
Jan Paul
Menzel
b,
Francesco
Buda
b and
Lucas
Visscher
*a
aDepartment of Chemistry and Pharmaceutical Sciences, Vrije Universiteit Amsterdam, De Boelelaan 1083, 1081 HV, Amsterdam, The Netherlands. E-mail: l.visscher@vu.nl
bLeiden Institute of Chemistry, Leiden University, Einsteinweg 55, P.O. Box 9502, 2300 RA, Leiden, The Netherlands
First published on 2nd June 2023
Abstract
Correction for ‘Automated assessment of redox potentials for dyes in dye-sensitized photoelectrochemical cells’ by Jelena Belić et al., Phys. Chem. Chem. Phys., 2022, 24, 197–210, https://doi.org/10.1039/D1CP04218A.
The authors have found an error in processing the components of the solvation energy in the published version of this manuscript. The Gibbs free energy of solvation was missing a contribution from the energy required to polarize the solute. While the equations are correct, the values attributed to them are not. This error led to a consistent shift by 0.1 eV on average, in the values for the reported solvation energies and Gibbs free energies calculated via the TC and GW approaches that include solvation effects. However, as the conclusions were based on the extent of the linear relationship between the experimental and theoretical values, this error did not affect the main conclusions. Tables and Figures that contain the error in the original publication and the Electronic Supplementary Information (ESI) are Tables 2, S2, S3, S4 and S5 and Fig. 5, 7 and 10. The changes in the Tables and Figures from the original publication have been summarised below with the corrections for the corresponding Tables and Figures. Please refer to the revised ESI (https://www.rsc.org/suppdata/d1/cp/d1cp04218a/d1cp04218a1.pdf) for the correction in the ESI tables.
| Approach | MD | MAD | RMSD | R 2 |
|---|---|---|---|---|
| a MD stands for the mean deviation; MAD stands for the mean absolute deviation, RMSD stands for the root mean squared deviation; R2 is squared correlation. | ||||
| ΔGDCCOSMO | −0.28 | 0.28 | 0.30 | 0.94 |
| ΔGTCCOSMO | −0.35 | 0.35 | 0.36 | 0.94 |
| ΔGTCCOSMO-RS | −0.34 | 0.34 | 0.36 | 0.96 |
| ΔEox | −0.13 | 0.15 | 0.18 | 0.91 |
| –εDFTHOMO | −0.05 | 0.10 | 0.13 | 0.91 |
| –εGW,solvHOMO | 0.32 | 0.32 | 0.34 | 0.91 |
| −εGW,solv,geoHOMO | 0.15 | 0.16 | 0.19 | 0.95 |
| ΔGscreeningCOSMO | −0.34 | 0.34 | 0.37 | 0.96 |
 | ||
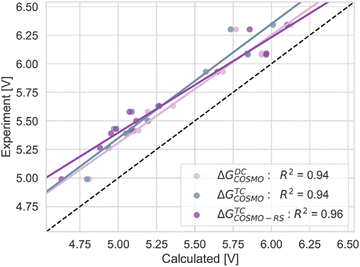
| Fig. 5 The correlation of adiabatic GSOP computed with ΔGTCCOSMO (pink), ΔGDCCOSMO (grey) and ΔGTCCOSMO-RS (purple) methods to the experimental oxidation potential vs. vacuum (dashed line). | ||
 | ||
| Fig. 7 Computed vertical GSOPs with AEox (blue), –εDFTHOMO (red) and –εGW,solvHOMO (green) compared to the experimental oxidation potential (dashed line) vs. vacuum. | ||
In Table 2, the corrected values of MD, MAD, and RMSD (in bold) manifest a shift for the Gibbs free energy values by 0.1 eV on average. The correlation of R2 with the experiments for the ΔGTCCOSMO decreased by 0.01 while for –εGW,solvHOMO and −εGW,solv,geoHOMO it increased by 0.02. These slight changes affect the text referring to the values in the Tables and Figures. Particularly in the Conclusion, the correct analysis is: “We find that, to calculate the ground state oxidation potential for these dyes, both pathways using the COSMO model perform well. The TC and DC pathways show the same value of squared correlation with the experiment, where the TC path shows a higher MAD value”.
In Table S2, the corrected values for Gibbs free energies calculated via the TC approach are given.
In Table S3, corrected values for Gibbs free energies calculated GW approaches that include solvation effects are given.
In Table S4, for the case of the PDI-0000 molecule, the corrected values for Gibbs free energies calculated with the TC approach are given.
Table S5 shows the solvation contribution to the Gibbs free energies calculated with the TC and DC approach. All values are corrected, and the correction of the text that refers to this table is: “On average, the value of ΔΔG is −1.50 eV, with a maximum value of −1.80 eV for NDI-58.”
In Fig. 5, 7, and 10, the R2 values are corrected according to the values in Table 2.
The Royal Society of Chemistry apologises for these errors and any consequent inconvenience to authors and readers.
Footnote |
| † Corrections have also been made to the ESI, which can be reached using the following link, https://www.rsc.org/suppdata/d1/cp/d1cp04218a/d1cp04218a1.pdf |
| This journal is © the Owner Societies 2023 |

